

Cost–Benefit Analysis of Unconventional Arterial Intersection Designs: Cairo as a Case Study

1
The Center of Road Traffic Safety, Naif Arab University for Security Sciences, Riyadh 11452, Saudi Arabia
2
Graduate School of Urban Innovation, Yokohama National University, Yokohama 240-8501, Japan
3
Civil Engineering Department, Faculty of Engineering, Aswan University, Aswan 81542, Egypt
*
Author to whom correspondence should be addressed.
Sustainability 2022, 14(24), 17016; https://0-doi-org.brum.beds.ac.uk/10.3390/su142417016
Submission received: 7 November 2022
/
Revised: 6 December 2022
/
Accepted: 13 December 2022
/
Published: 19 December 2022
(This article belongs to the Special Issue Sustainable Public Transport and Logistics Network Optimization)
Abstract
:Due to their innovative treatment, Unconventional Arterial Intersection Designs (UAIDs) have been developed to alleviate congestion at conventional signalized intersections, in an effort towards the sustainable development of crowded capitals. A methodological framework for economic assessment, however, has not been investigated properly for such designs, particularly under mixed traffic environments. This article aims to outline a methodological framework that can be followed for the socio-economic assessment of such designs. A cost–benefit analysis approach was developed to figure out the different determinants of costs and benefits of an overpass interchange (as a widespread treatment) and two selected UAIDs (as alternative measures). The two studied UAID schemes in this article are Continuous Flow Intersection (CFI) and Restricted Crossing U-Turn (RCUT). Seeking credible results, a set of three signalized intersections in downtown Cairo, Egypt was selected as a proof-of-concept for the developed method. PTV-VISSIM, a simulation-based platform, was utilized to estimate the benefits gained by road users. Our research objectives were to identify, evaluate, and compare the economic feasibility of the different alternatives. Compared to the overpass intersection, we found that the CFI and RCUT designs ensure higher economic efficiency, while mitigating congestion at conventional signalized intersections under heterogeneous traffic conditions.
1. Introduction
Transportation experts worldwide have been challenged by a rapid increase in road traffic needs. As a result of the ever-increasing traffic demands of road users, congestion in the conventional traffic signalized intersections has also dramatically increased. Accordingly, the total travel time and the overall delay have significantly deteriorated, particularly under high traffic volume conditions. The conventional treatments aimed at improving the performance of signalized intersections have failed to produce significant improvements under various conditions. Therefore, there is an urgent need for innovative approaches to overcome the serious traffic dilemma, alleviate congestion, and raise the current level of service at conventional intersections, particularly under constrained and limited resources.
Unconventional Arterial Intersection Designs (UAIDs) have been presented as innovative treatments to ensure safer flow along the arterial corridors and facilitate sustainable planning for congested cities. UAIDs enhance operational performance by reducing the delay, as well as improving the entire intersection’s safety conditions through reducing the total cycle time and the number of conflict points [1,2,3,4]. However, a methodological framework for the economical assessment of such designs has not been investigated, particularly under mixed traffic conditions. Overpass interchanges are effective in alleviating congestion and improving safety, but have high construction costs. UAIDs are relatively less costly than overpasses while providing good performance. To identify the best solution in practice, evaluation from a cost-effectiveness viewpoint is necessary.
This study is a part of an ongoing research project investigating the applicability of UAIDs under heterogeneous traffic complexities, in order to gain a better understanding of the performance, vulnerabilities, and limitations of such designs [5,6,7,8]. The main objective of this paper is to develop a methodological framework that could be followed as a socio-economic assessment approach for UAIDs. The research objective is accomplished by identifying, evaluating, and comparing the economic feasibilities of UAIDs with that of an overpass interchange. Accordingly, we provide clear guidance to practitioners and decision-makers, which may be followed in order to determine the proper treatments from an economical point of view.
In this study, we investigate two UAID schemes; namely, the Restricted Crossing U-Turn (RCUT) or the Superstreet Median (SSM), and the Continuous Flow Intersection (CFI), which is also referred to as Displaced Left-Turn (DLT). We aim to study the possibility and applicability of these two proposed UAID schemes for implementation in developing cities where mixed traffic is the dominant condition, focusing on the socio-economic assessment.
The remainder of this paper is structured as follows. The following section provides a review of relevant studies in the literature. Section 3 illustrates the methodology of this research, while Section 4 presents a case study. Finally, Section 5 and Section 6 present a discussion of the results and our conclusions, respectively.
2. Literature Review
In urban road networks—particularly signalized ones—traffic flow at intersections is an indicator of the level of service (LOS). Conventional treatments to improve the performance of signalized intersections focus on enhancing the control systems, either by utilizing actuated signal control, changing the time plans of the existing signals, optimizing the signal timing, or by adding extra and/or exclusive lanes (e.g., turning pockets) to increase the ability to approach intersections. Although higher capacities are usually rendered by overpass interchanges as a grade-separation approach, they are costly and aesthetically unpleasant [1,9]. Hence, UAIDs have been presented as a signalized intersection treatment that ensure safer flow along arterial corridors. The main purposes of these schemes are to enhance the operational performance by reducing the delay, as well as improving the safety conditions of the entire intersection. This can be achieved by reducing the total cycle time. A two-phase system results in significant operational efficiency, due to the reduction in the total cycle length. Shorter mean queues, shorter storage bays with shorter travel time, and overall significant improvement are notable indicators along arterial corridors [1,2]. The displacement or re-routing of one or more of traffic streams can reduce the total number of conflict points inside the main intersection, significantly improving the safety performance [1,3,4].
Several geometric and signal designs for intersections have been developed in the literature, in addition to improving traffic data prediction accuracy [10]. The symmetric intersection presented in [11] is a junction of two arterials that have different driving rules. On the left-hand traffic arterial, vehicles drive on the left side and obey left-side traffic rules. On the right-hand traffic arterial, vehicles drive on the right side and obey right-side traffic rules. Alemdar et al. [12] have developed several geometric and signal designs for three intersections in Turkey. These designs were simulated using the PTV VISSIM software and evaluated using multi-criteria decision analysis methods. They considered vehicle delay, queue length, stopped delay, stops, travel time, vehicle safety, CO2 emissions, fuel consumption, and construction cost.
In this study, we investigate two UAID schemes. As a unique and innovative design, the CFI intersection allows through-flow and left-turn flow to be pursued simultaneously within only a two-phase signal, instead of four, in the case of conventional intersections. As its name implies, the CFI maintains traffic flow along the corridors [2]. It can be applied by re-routing the left-turn flow and permitting it to cross to the opposite side brink in an exclusive left-turn lane through unopposed minor upstream crossovers, provided a few hundred meters in advance of the main existing intersections [2,13,14]. These displacements create four additional intersections upstream of the main one, as shown in Figure 1.
The novelty of the RCUT intersection is the separation of the directions of travel flow on arterial roads with two different traffic signal controllers, as shown in Figure 2. Within a two-phase signal system, independent operation on the arterial streets is emphasized to achieve an efficient smooth traffic flow [4,9,14]. As the RCUT controls the crossing flow at the main to the minor approaches, the main road traffic flow can continue to progress, through left and/or right turns. With channelizing medians, independent flow operation is provided along the arterial corridor, and the left-turning traffic flow takes an indirect left-turn to reach destinations on minor streets [2,4,14]. The U-turns provided along with the main corridor result in an indirect left-turn for the minor approach flow. These U-turns allow minor street vehicles to travel in the main corridor by right-turning followed by left-turning at the provided U-turns, then continuing to travel along the opposite minor route accordingly, as shown in Figure 2.
Few economic impact studies have been carried out to analyze the cost and benefit of UAIDs. The replacement of conventional signalized intersections by either a signalized intersection or a grade-separated interchange (overpass interchange) has been analyzed, and it was found that the overpass interchange provided a higher investment return than adding a new signal control, especially when the minor traffic demand was less than half of the major [9]. The safety and economic impacts of replacing conventional signalized intersections with roundabouts in rural high-speed locations have also been investigated [15]. The results revealed that the reductions in crash severity and frequency resulted in an annual return between $1.0 and $1.6 million, due to the replacement of locations with higher-than-normal crash histories. Moreover, a preliminary economic analysis of a realistic RCUT project has been conducted for safety mitigation on rural highways, in order to estimate construction costs [16]. The achieved potential benefits in either operational or safety performance showed the best investment return within a few years in most cases, compared with maintaining the geometry of conventional signalized intersections. To the best of our knowledge, a methodological framework for the cost and benefit assessment has not yet been investigated in the literature for such designs, particularly under a mixed traffic environment.
3. Methodology
Cost–Benefit Analysis (CBA) is a procedure to evaluate the output of a particular project, in order to decide whether it is valuable or not. CBA can help policy-makers to assess the value of transaction projects and to decide the best alternative to implement through determining its financial feasibility. Using a common unit of monetary measurement, CBA depends on estimating the potential costs and revenues associated with a project’s implementation and operation.
Therefore, it is important to consider the different cost and benefit components carefully before conducting CBA. From a financial point of view, the cost is defined by the value of money used to produce or present a certain project, including direct and indirect costs, principal costs, personnel costs, running costs, and depreciation rates. However, from economic or social perspectives, the cost denotes the way in which the available resources are used properly in a specific project or a particular activity. From the transportation economic point of view, the cost of transportation investment is the value of the resources consumed to achieve expected benefits [17]. On the other hand, the benefits are defined, from the financial point of view, as the monetary values of the desirable consequence of a certain project, an economic policy, or even a decision. Meanwhile, from an economic or social perspective, the benefits are the value of the goods and services produced. The CBA discussed in this research is an economic assessment approach that aims to define and formulate the different cost and benefit components associated with the implantation of the proposed UAID intersections, in order to produce enough information on the proposed alternative schemes and to ascertain whether these should be undertaken as a cost-effective treatment.
To accomplish the objective of this study, CBA was conducted to assess the socio-economic return of various cost and benefit factors affecting the implementation of the proposed UAIDs, as shown in Figure 3. Based on the CBA approach, a comparative study was conducted between conventional signalized intersections, compared to an overpass interchange and two proposed UAIDs. The present values of various alternatives were estimated following their future benefits, considering all comprehensive possible costs and benefits which are associated with each scheme, which is the governing factor in this approach. Thus, both cost and benefit components were estimated with respect to the overpass interchange (as a conventional common intersection), and CFI and RCUT (as UAIDs). CBA was conducted through the following basic steps: First, all costs and benefits for the control, as well as the suggested alternatives, were identified by developing basic cost factors. Second, the beneficiary values of the cost and benefit items were identified. Third, the costs and benefits were determined in monetary terms. Fourth, the Present Value for both cost and benefit were estimated by deducting the future values based on interest rates. Fifth, the calculation of road user benefits and the extrapolation of benefits of all alternatives were performed by evaluating the indices under different external conditions. Finally, the Benefit–Cost Ratio (BCR)—an indication that refers to the efficiency of each suggested scheme—was estimated, in order to obtain a decision on the best scheme for implementation.
3.1. Cost Estimation
A cost breakdown was executed based on data obtained from the annual reports of local authorities [14], in order to estimate the total cost of the existing intersections and the other alternatives, including overpass interchanges and UAIDs. Several elements were considered when estimating the cost of the different alternatives in this study, as shown in Figure 3. The costs considered in this study were included construction, running, and maintenance costs, as illustrated in Equation (1). The construction costs include pavement construction, signal heads, detectors, and other needed components, where the pavement construction cost includes asphalt concrete, sidewalks, and line painting, in addition to the cost of installing signs along the road; the signal head cost includes the cost needed to purchase and installing the traffic signal heads, detectors, and control units; and the overpass interchange construction cost consists of concrete elements, asphalt pavement, sidewalks, handrails, and light poles. Although the total land required is higher in the case of the overpass interchange, the right-of-way cost was not considered in this study due to missing data.
The operation cost consists of the electricity consumption annual cost which is needed to control the existing conventional intersections, such as that required by signal heads, detector units, and the other control units. It also includes the repair cost of unexpected problems, including spare parts and manpower costs. On the other hand, the maintenance cost refers to the annual repair cost for asphalt concrete, sidewalks, painting, signal heads, detectors, and all control units, including the repair materials and manpower costs.
where C—Project total cost (in Egyptian pounds (L.E)/year); T—Project total lifetime (years); CC—Construction total cost (L.E/year); OC—Annual operation total cost (L.E/year); MC—Annual maintenance total cost (L.E/year).
3.2. Road User Benefit Estimation
The promotion and development of transportation systems brings benefits to all road users and other citizens. The term “user returns” refers to the benefits to road users, while the term “social returns” refers to the indirect benefits of other people, such as the reduction of negative environmental impacts (i.e., noise and gas emissions) [18]. The user returns are estimated based on user trip cost reductions due to the improvement in traffic conditions. Hence, the user estimated benefits was assessed in terms of savings in operating costs due to the implementation of the proposed treatments for traffic congestion. The Carbon Dioxide (CO2) emissions indicator was used to represent the indirect cumulative benefits, as an environmental index. The estimated road user benefits can be categorized as follows:
- Savings by reducing the cost of fuel consumption;
- Savings by reducing the cost of CO2 emissions;
- Savings by reducing the total travel time on the road.
3.2.1. Estimating the Fuel Consumption Cost Saving
The savings due to the reduction of wasted fuel consumption were calculated. A comparison was done by estimating the fuel consumed during peak and free-flow periods. The applied equations (Equations (2)–(8)) have been developed by the Texas Transportation Institute [19].
In the beginning, the excess fuel consumption cost was estimated by calculating the average daily traffic volume along the respective route. Then, the daily vehicle vehicle kilometers of travel (DVKT) was calculated, which is the average daily traffic on a section of roadway multiplied by the length (in kilometers) of that section of roadway. The average speeds from the simulation of each proposed scheme, average fuel economy, DVKT, excess diesel wasted (EDW), and excess gasoline wasted (EGW) annual costs were estimated. To calculate the excess gasoline cost (EGC) and excess diesel cost (EDC), the authors followed the equations reported in the “Cairo traffic congestion study phase 1 final report” by the World Bank [20]. The fuel subsidy values at the time of the study were 2.2 L.E/liter for gasoline and 1.1 L.E/liter for diesel, as illustrated in Equations (6) and (7).
where EFC—Excess annual fuel cost (L.E/year); EGC—Excess gasoline annual cost (L.E/year); EDC—Excess diesel annual cost (L.E/year); EGW—Excess gasoline wasted annual amount (liter); EDW—Excess diesel wasted annual amount (liter); EFS—Excess fuel subsidy annual cost (L.E/year); EGS—Excess gasoline subsidy annual cost (L.E/year); EDS—Excess diesel subsidy annual cost (L.E/year); DVKT—Daily vehicle kilometers of travel annual cost (veh./km/year); —Average free-flow travel speed (Km/h); —Average congested speed (Km/h).
3.2.2. Estimating the CO2 Emissions Cost Reduction
The cost savings due to reducing CO2 emissions were calculated based on the CO2 emissions standard rates reported in World Bank-related studies [21] (Equations (9) and (10)). Both the vehicle type and used fuel type affect the cost savings associated with CO2 emissions due to a reduction in excess fuel consumption. The standard emissions rates for diverse vehicular modes were used to calculate the CO2 emission due to congestion in Cairo; namely, one liter of consumed gasoline or diesel by passenger cars was considered to produce 2.40 and 2.41 kg of CO2, respectively [5]. Attention should be paid to converting the volume units of the wasted diesel and gasoline annual amounts in liters to mass units (i.e., in kg) before substituting into Equations (9) and (10), bearing in mind that 1.0 L of diesel weighs 0.832 kg, while 1.0 L of gasoline is 0.77 kg.
where : CO2 emissions annual cost (L.E/year); WCO2: CO2 emissions weight/year (Kg); UCCO2: CO2 unit cost (L.E/ton); GW: Wasted gasoline weight/year (kg); DW: Wasted diesel weight/year (kg).
3.2.3. Estimating the Total Travel Time Cost Saving
The annual cost due to the reduction of the total travel time was calculated according to the method developed by the Texas Transportation Institute [19] and followed in other previous studies [5,20]. The total travel delay time on a road network (i.e., the amount of extra time that traffic takes due to congestion) was estimated using Equation (11). The data obtained from a previously published report by the World Bank [20] was used for more accurate and reliable indices of social benefits.
where DC: Total delay cost/year (L.E/year); N: Annual traffic flow on a road at peak hours (veh); O: Vehicle occupancy factor; : Incident delay factor for a road; L: Congested length of a route segment (Km); : Average congested speed (Km/h); : Average free flow travel speed (Km/h); VOT: Value of time for car user (L.E/h).
The overall travel delay was calculated by comparing the total travel at the average speeds and the free flow speeds, during the peak periods and in the same route segment as [L × ()] as shown in Equation (11). Then, the average delay per vehicle was used as an indicator of overall delay on the route segment at peak periods of each alternative scheme. The average vehicle occupancy index (Equation (12); developed by [22]) was used to estimate the total number of road users, in order to calculate the travel time reliability metrics, according to the national home travel survey index [20].
where O: Average vehicle occupancy factors for cars. r: Record in the queried “trippub” data. R: The total number of records in the queried “trippub” data. (TRPMILES)r: Total trip distance of data recorded “r” (miles). (NUMONTRP)r: The traveler’s total number for the data record “r” on each trip. (WTTRDFIN)r: Final trip weight of the data record “r”.
3.3. The Net Present Value Estimation
When aiming to conduct an applicable socio-economic assessment, it is essential to estimate the Net Present Value (NPV), in order to ensure that an equitable comparison of the total costs and benefits of each scheme is made along the project lifetime. Based on its hypothetical basic foundation, the NPV was estimated according to reductions in future values with respect to the present ones by utilizing a social discount rate, as shown in Equation (13). Following similar previous studies [5,20,23], we assumed that the lifespan of the proposed intervention is 30 years for super-structures elements and sidewalks, while it is 10 years for signal heads, detectors, and control units. Thus, the net present value of each cost and benefit of each proposal can be calculated over the lifespan of the project. Accordingly, the BCR value can be used to calculate the efficiency of the overpass interchange, as well as the other UAIDs (i.e., CFI and RCUT), compared to the existing conventional intersections.
where NPV: Net present value estimate; T: Project total lifetime (years from start year “t” to the end of lifetime); C: Project annual cash flow; i: A given social discount rate.
4. Case Study
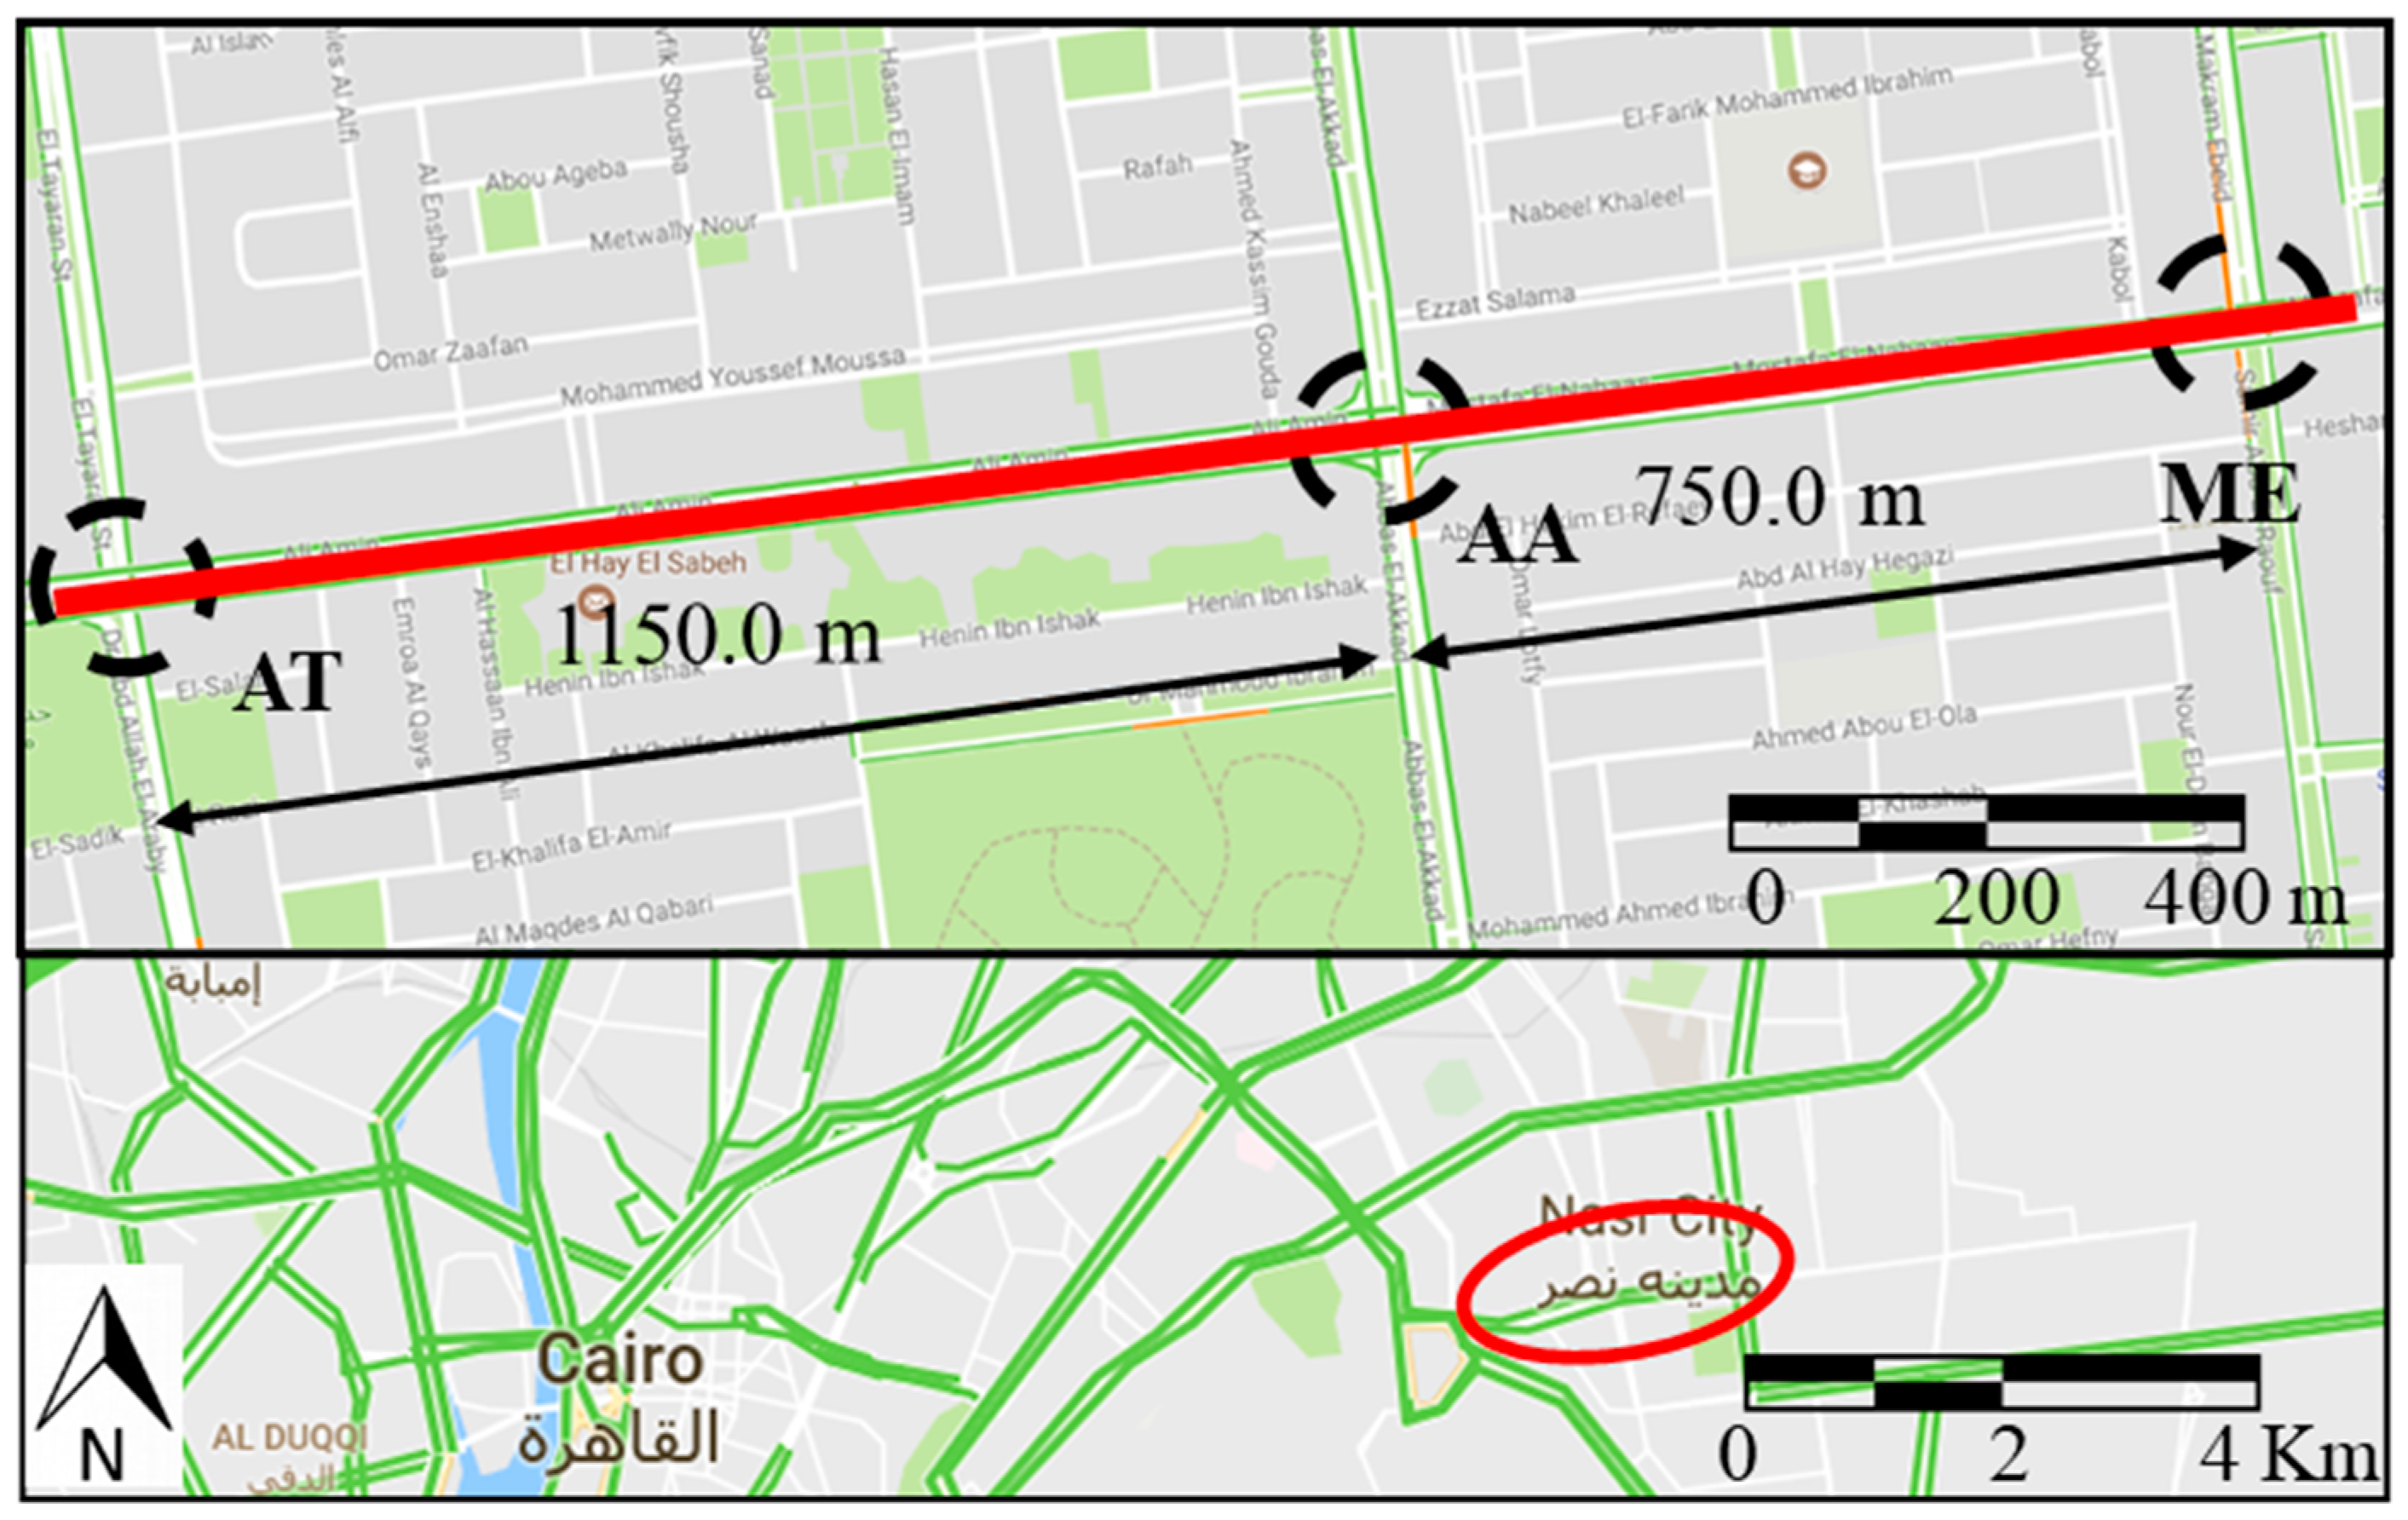
As a proof-of-concept, this research presents a real case study applying the proposed methodological framework. For credible results, three consecutive signalized intersections located in Cairo city center were selected, as shown in Figure 4. The studied arterial road connects Cairo downtown and the eastern new residential and recreational compounds. In addition, many commercial activities are observed along the side-roads, maximizing the travelling traffic and other existing transportation facilities along the studied corridor. Likewise, large residential areas are also located adjacent to the corridor. As a result, the studied corridor experiences a daily high traffic demand. We considered three conventional signalized intersections—namely, Abass Al-Aqad (AA), Makramm Ebied (ME), and Al-Tairan (AT)—which have four-leg directions with divided three-lanes-per-direction streets, as shown in Figure 5. Aggressive driving behavior, however, causes non-lane-based flow, resulting in low LOS at the studied intersections [5,6,7,8,24]. On the other hand, operational regulations restrict direct left-turns through traffic of southbound approach, in order to alleviate the congestion in the studied intersections (see Figure 5).
4.1. Data Collection
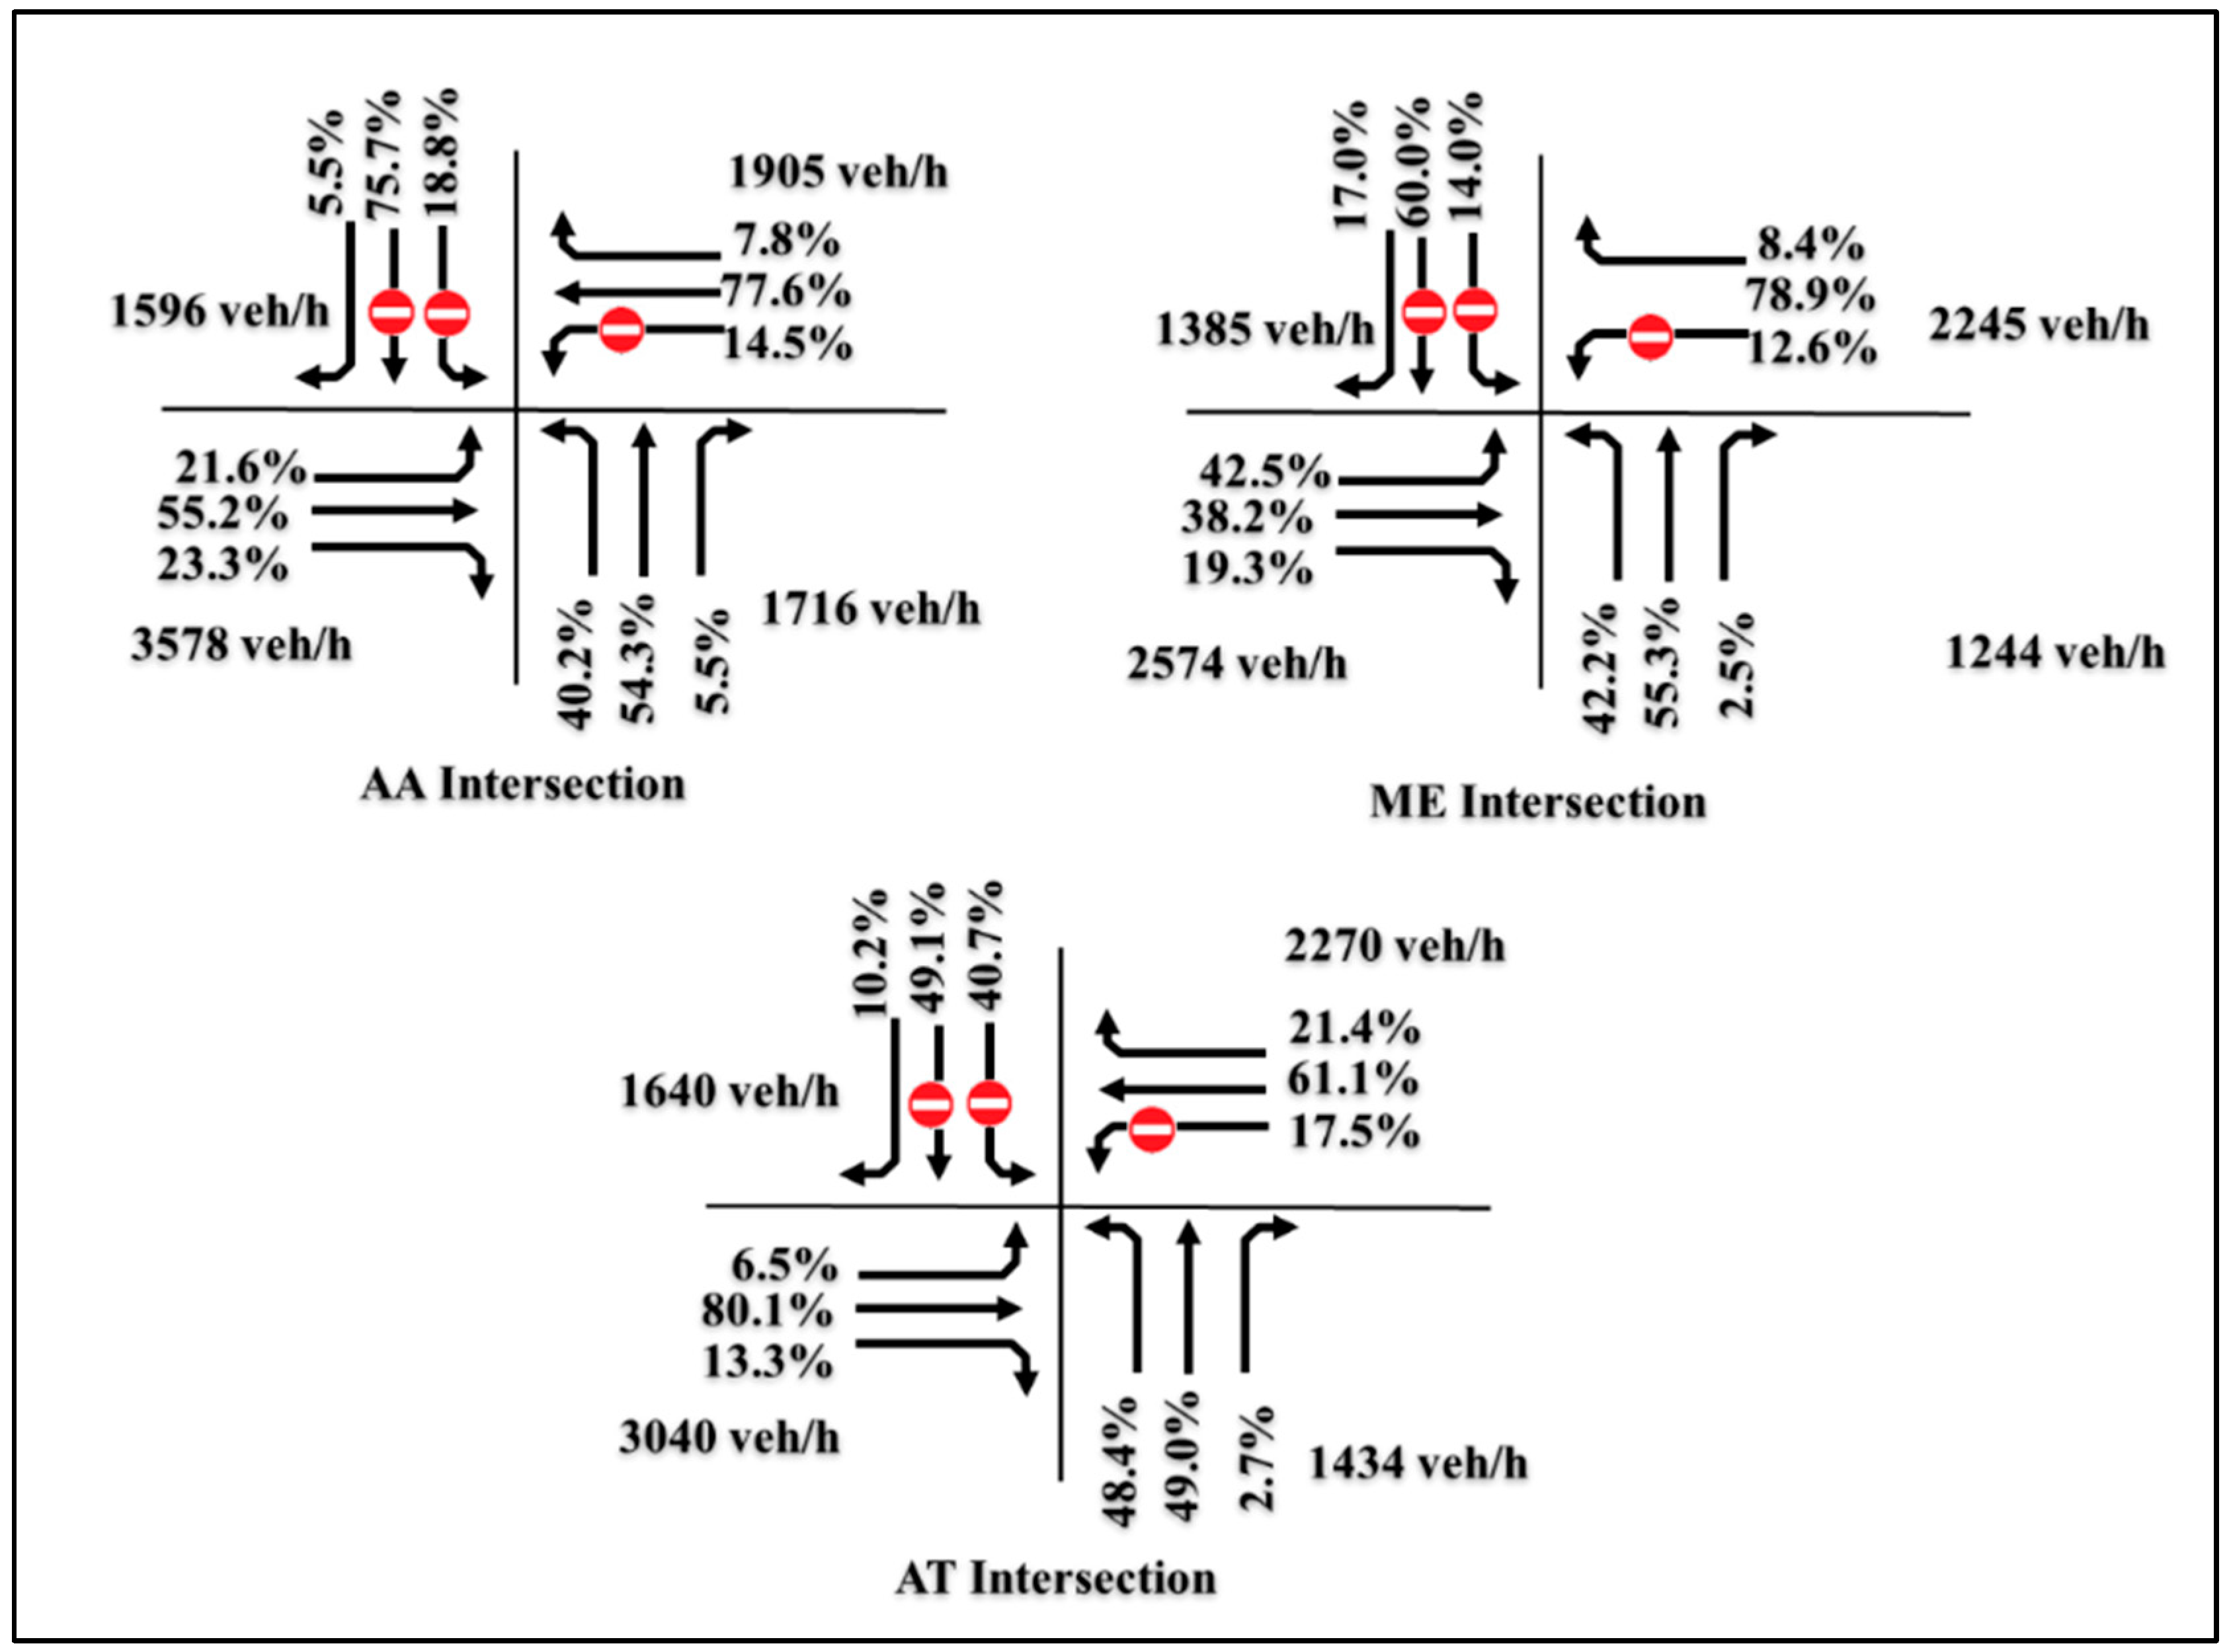
For accurate substitution into the aforementioned equations for road user estimation, the simulation outcomes for the existing intersections and other alternative schemes, in terms of operational performance determinants, are substantially required. Hence, a comprehensive field observation was carried out to collect the needed data, including traffic volumes in different periods, directional ratios, average travel time, average headway time, and traffic composition for each intersection on the studied road. The field observations were executed over 15 min intervals during the morning peak period (between 8:00 to 9:00) and the afternoon peak (16:00 to 17:00), while the non-peak period was observed from 10:00 to 11:00 AM.The field observation revealed that the traffic volumes at peak hours were 7450.0, 8790.0, and 8385.0 vehicles/h for ME, AA, and AT, respectively, as illustrated in Figure 6. The recorded directional ratios are shown in Figure 7. The field observations also yielded the vehicle composition along the studied corridor for each approach inside the studied intersection. Normal vehicles had the largest share, at 60% and 80% for the main and the minor approaches, respectively. Motorcycles were found to comprise 14% and 9% along the main and the minor approaches, respectively, while public buses were found at 23% along the main corridor and 11% for the minor streets.
4.2. Operational Performance Determinants
We aimed to provide a credible representation simulating the traffic complexities of the mixed traffic stochastic condition, as a prevailing condition in developing cities. Hence, the use of a simulation platform is the best practice to measure road user benefits and, so, to achieve the methodology enhancement of this research, we developed the lane-by-lane road networks presented above. The different aforementioned elements of obtained user benefits could be estimated by figuring out the potential operational performance indices (i.e., average running speed, the average delay per vehicle, and the total travel time) in both the base-case and the other proposed designs. Therefore, PTV-VISSIM (version 12) was employed as time-step model simulation software, which enables the representation of the different configurations similar to the real world, based on the car-following model approach. Selected parameters, however, must be re-adjusted carefully to fulfil the complex needs of such traffic conditions. Based on their significant effects on the simulated models, some selected parameter values were re-adjusted for our scenarios, including aggressive driving behavior, non-lane-based flow, and various static and dynamic properties of the high variant traffic compositions, as detailed in Table 1. Both calibration and validation processes were conducted to ensure the accuracy and efficiency of the model. The driving behavior parameters emergency stopping distance, lane change distance, standstill distance, minimum headway distance, and waiting time before diffusion were selected as candidate-sensitive parameters, as illustrated in Table 2.
Accordingly, a sensitivity analysis was carried out to reveal the model credibility, in terms of presenting the consistency between actual field data and the corresponding models. The travel time from and to westbound and eastbound directions between consecutive intersections was considered a measure of efficiency, at a threshold of 17.0% or less. Finally, an ANOVA, as a statistical test, was conducted to measure the consistency between the observed and simulated travel time records. The ANOVA single-factor test emphasized the significant consistency of the represented models, as an indication of the simulation efficiency. The variance analysis with a 95% confidence level indicated a small P-value, indicating the efficiency of the models.
The GEH empirical test, as a modified Chi-square statistical test, was employed to examine the model confidence, and the Root Mean Square Percent Error (RMSPE) was calculated to inspect the goodness-of-fit of the model. The GEH and RMSPE outcomes indicated the high accuracy of the simulated models [5,6,7,25,26,27]. To fulfil the heterogeneous traffic conditions needs—particularly while representing the CFI design—highly attention was paid to designing the exclusive left turn lane, in order to avoid any possibility of blockage. Moreover, coordination between the traffic signal groups of both the main intersection and the upstream crossovers was carefully considered by utilizing different coordination techniques; namely, bandwidth maximization and delay minimization [5,8,28]. On the other hand, all proposed designs were presented considering the issue of conflict points with high priority [5,6,7,8,24].
5. Results and Discussion
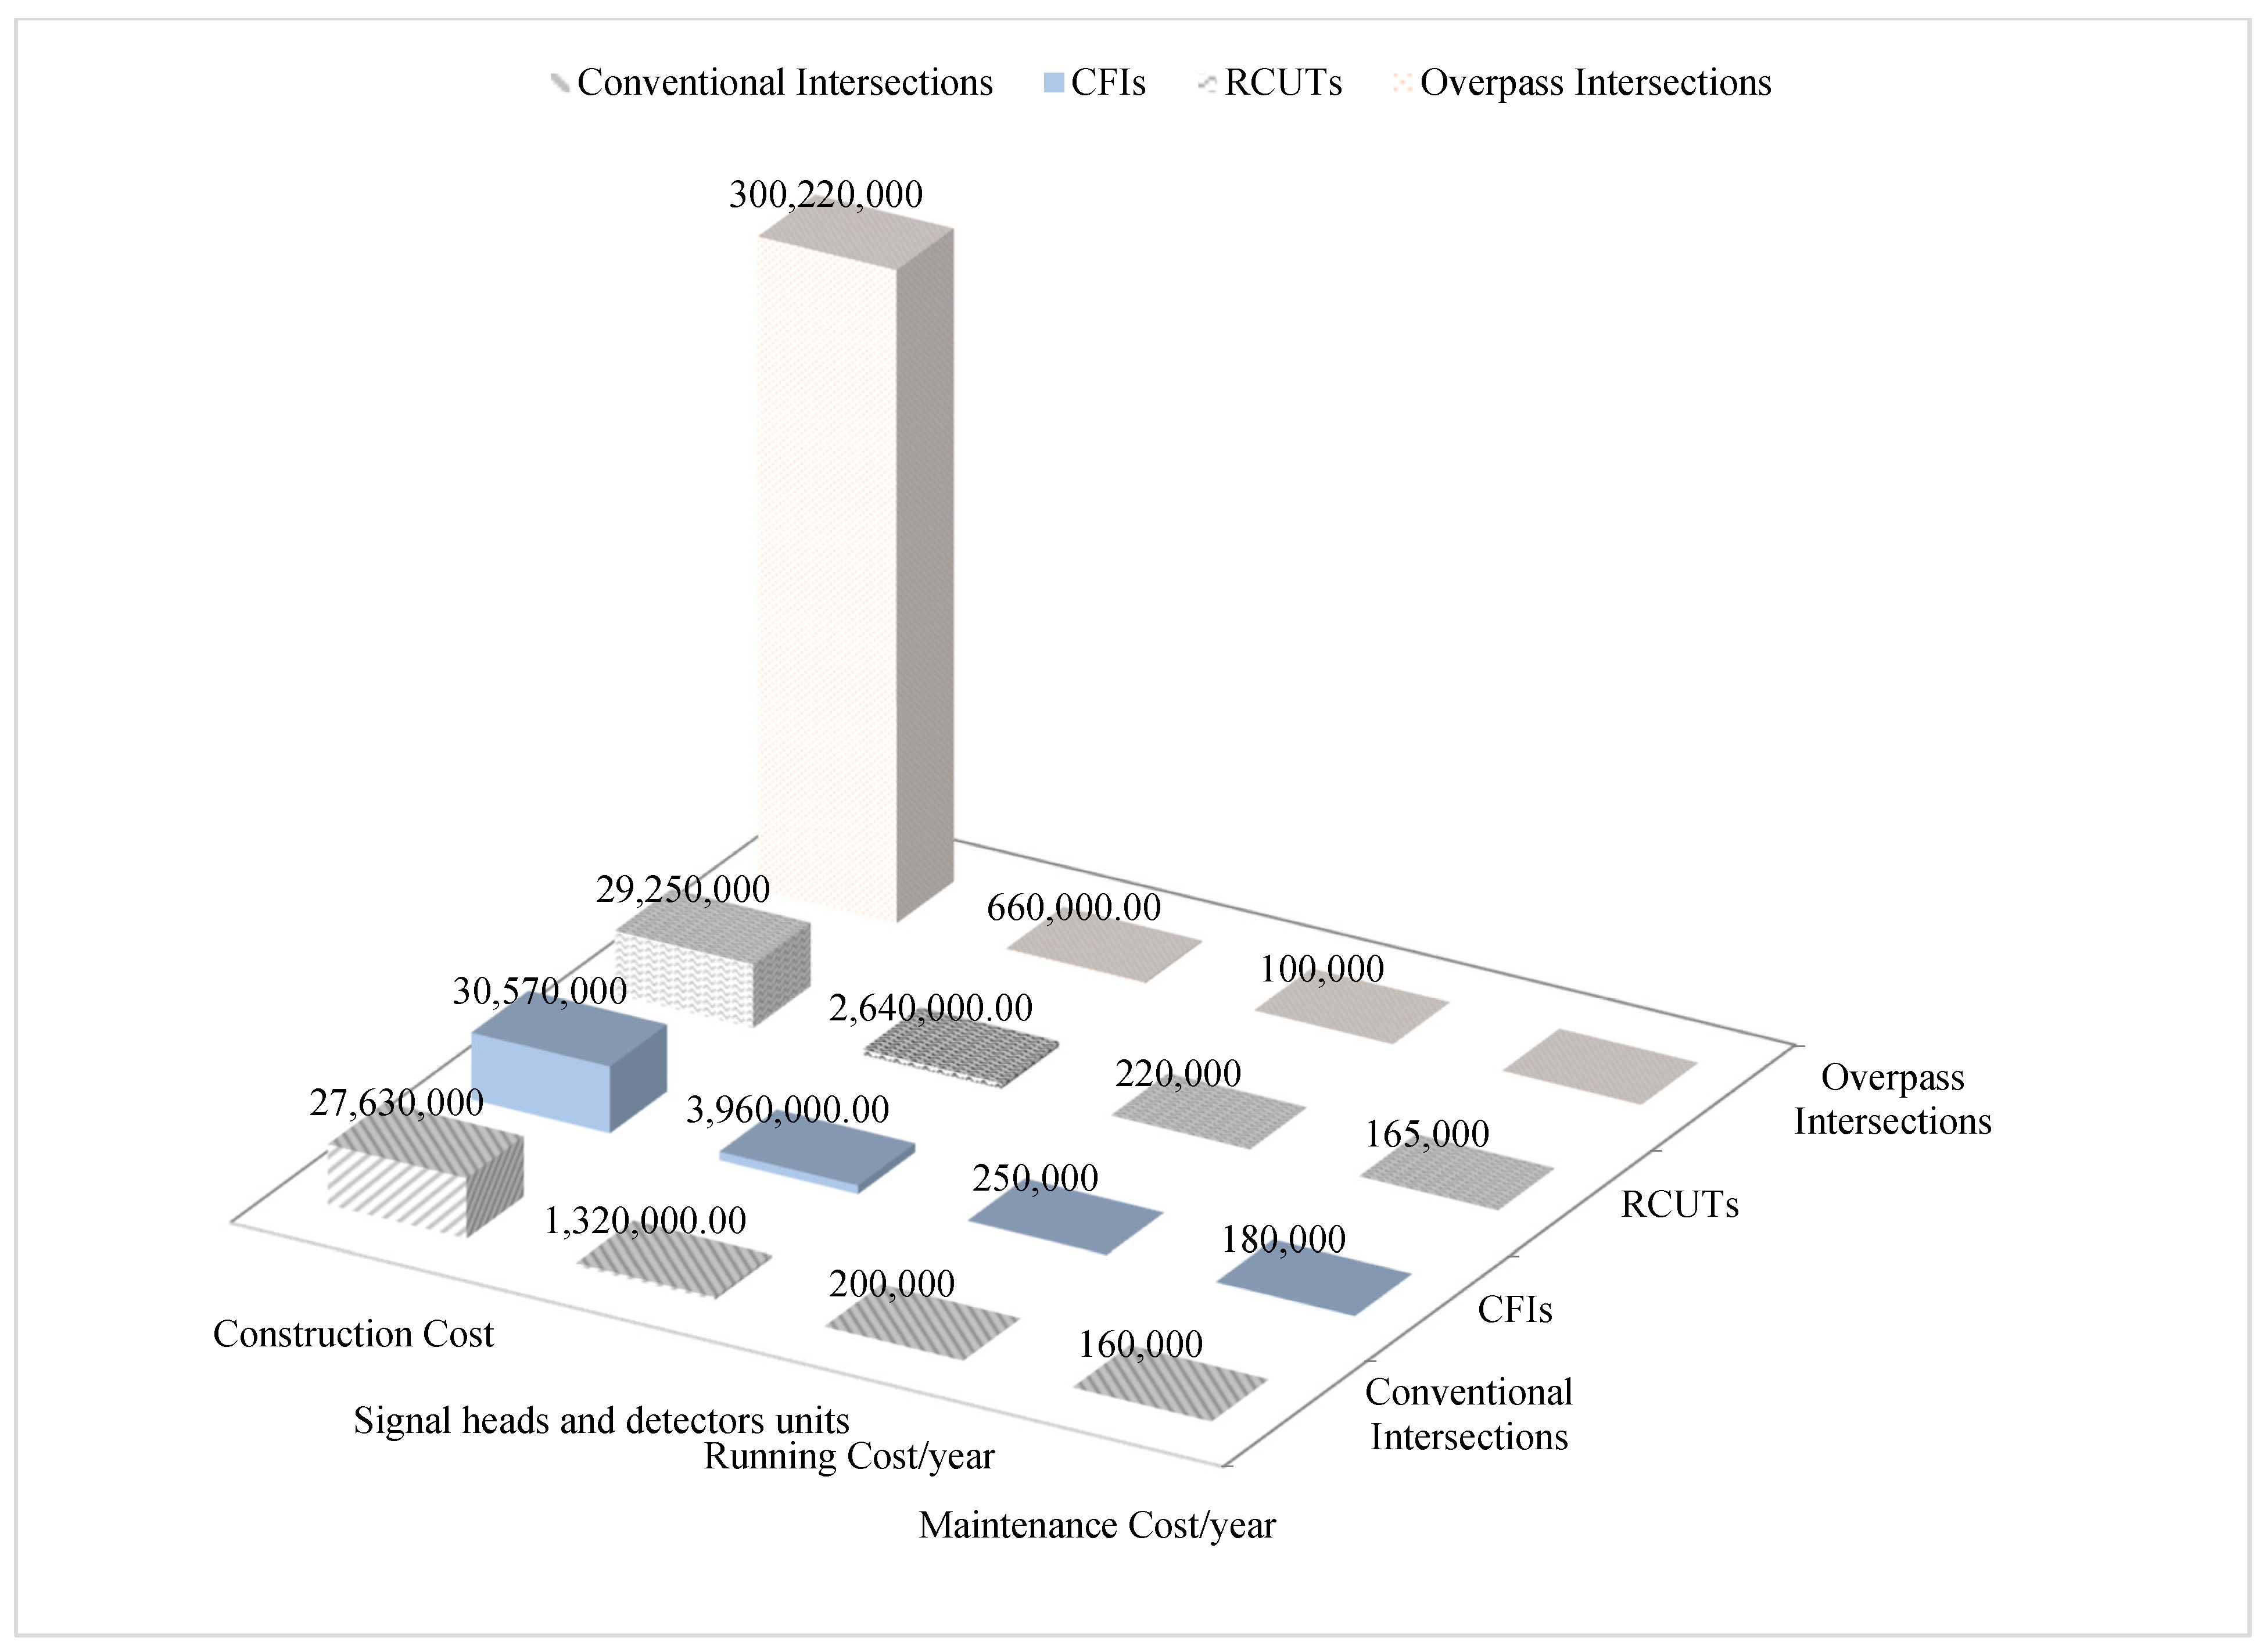
A cost breakdown was carried out following the annually published report of the Egyptian Ministry of Transport [20,21]. The construction cost analysis indicated the much higher construction cost of the overpass interchange, compared to the other alternatives, as shown in Figure 8. On the other hand, the CFI construction cost exceeded that of the RCUT, as a result of the excess essential construction elements such as exclusive left-turn lanes, medians, and crossover signal heads, compared to those needed to control the RCUTs. The running costs included the electricity consumption and the unexpected problem-solving costs. Due to the extra control units (i.e., signal heads and detectors units) needed to control the crossovers, the CFI running cost exceeded those of the RCUT and overpass interchange (250,000, 220,000, and 100,000 L.E, respectively). The cost of asphalt concrete, sidewalks, painting, signal heads, and detectors unit maintenance for all proposed treatments was collectively estimated as annual maintenance costs. The results indicated the higher maintenance cost of the overpass interchange (250,000 L.E) compared to the other alternatives (165,000 and 180,000 L.E for RCUT and CFI, respectively), due to the costly maintenance of pavement, superstructure, ramps, and other elements, as illustrated in Table 3.
An improvement in traffic LOS along the road was achieved as a result of operating cost savings due to traffic congestion alleviation by the proposed interventions, as shown in Figure 9. As the cost savings of CO2 emissions were mainly calculated based on excess fuel consumption, the CO2 savings were high, although the delay cost savings were small. The cost savings of CO2, shown in Figure 9, presented the same trend as the estimated fuel consumption savings cost, shown in Figure 10. The average fuel consumption was calculated to estimate the excess fuel consumption due to traffic congestion during the peak periods, as shown in Figure 10. To estimate the excess fuel consumption due to traffic congestion, the average fuel consumption was calculated to estimate the fuel consumption of vehicles running in congested conditions. The estimated value was adjusted to the fuel equation in the case of the Cairo metropolitan area [5]. The average life of travelling vehicles was assumed to be 10–12 years. The fuel consumption average value over 100 km for a vehicle with an engine size of 1600 CC is 10 L when travelling at 60 km/h average speed. The cost of fuel consumption for each of the road users is 45% of the total cost, subsidized by the government at 55% of the total cost. A report on traffic congestion in the Cairo metropolitan published by the World Bank [20] has emphasized that the government subsidy for fuel was 1.1 and 2.2 L.E/liter for diesel and gasoline, respectively (Equations (5) and (6)). The savings in wasted fuel reduction along the studied route were calculated, in order to assess the potential benefits achieved by such interventions’ implementation. The annual savings of CO2 emissions for the various intersection designs are shown in Figure 11.
The proposed interventions along the respective route were calculated based on the CO2 emissions standard rates, detailed in Equations (8) and (9). Based on the provided data obtained from previous reports, the annual total number of vehicles on the selected route segment in this study during peak hours was estimated. The average vehicle occupancy index value was 1.7, as recommended by international reports, such as the Japan International Cooperation Agency (JICA) studies for the Greater Cairo area and World Bank reports [20,21]. Delays encountered by road users resulting from random events such as traffic accidents, security checks, or even vehicle wreckages were included. The road traffic accident delay factor reflects unexpected events, and is determined by multiplying the delay when the volume of traffic exceeds the maximum capacity at a certain time of day at the same location. The value of the traffic accident delay factor was taken as 1.1, based on World Bank reports [20,21].
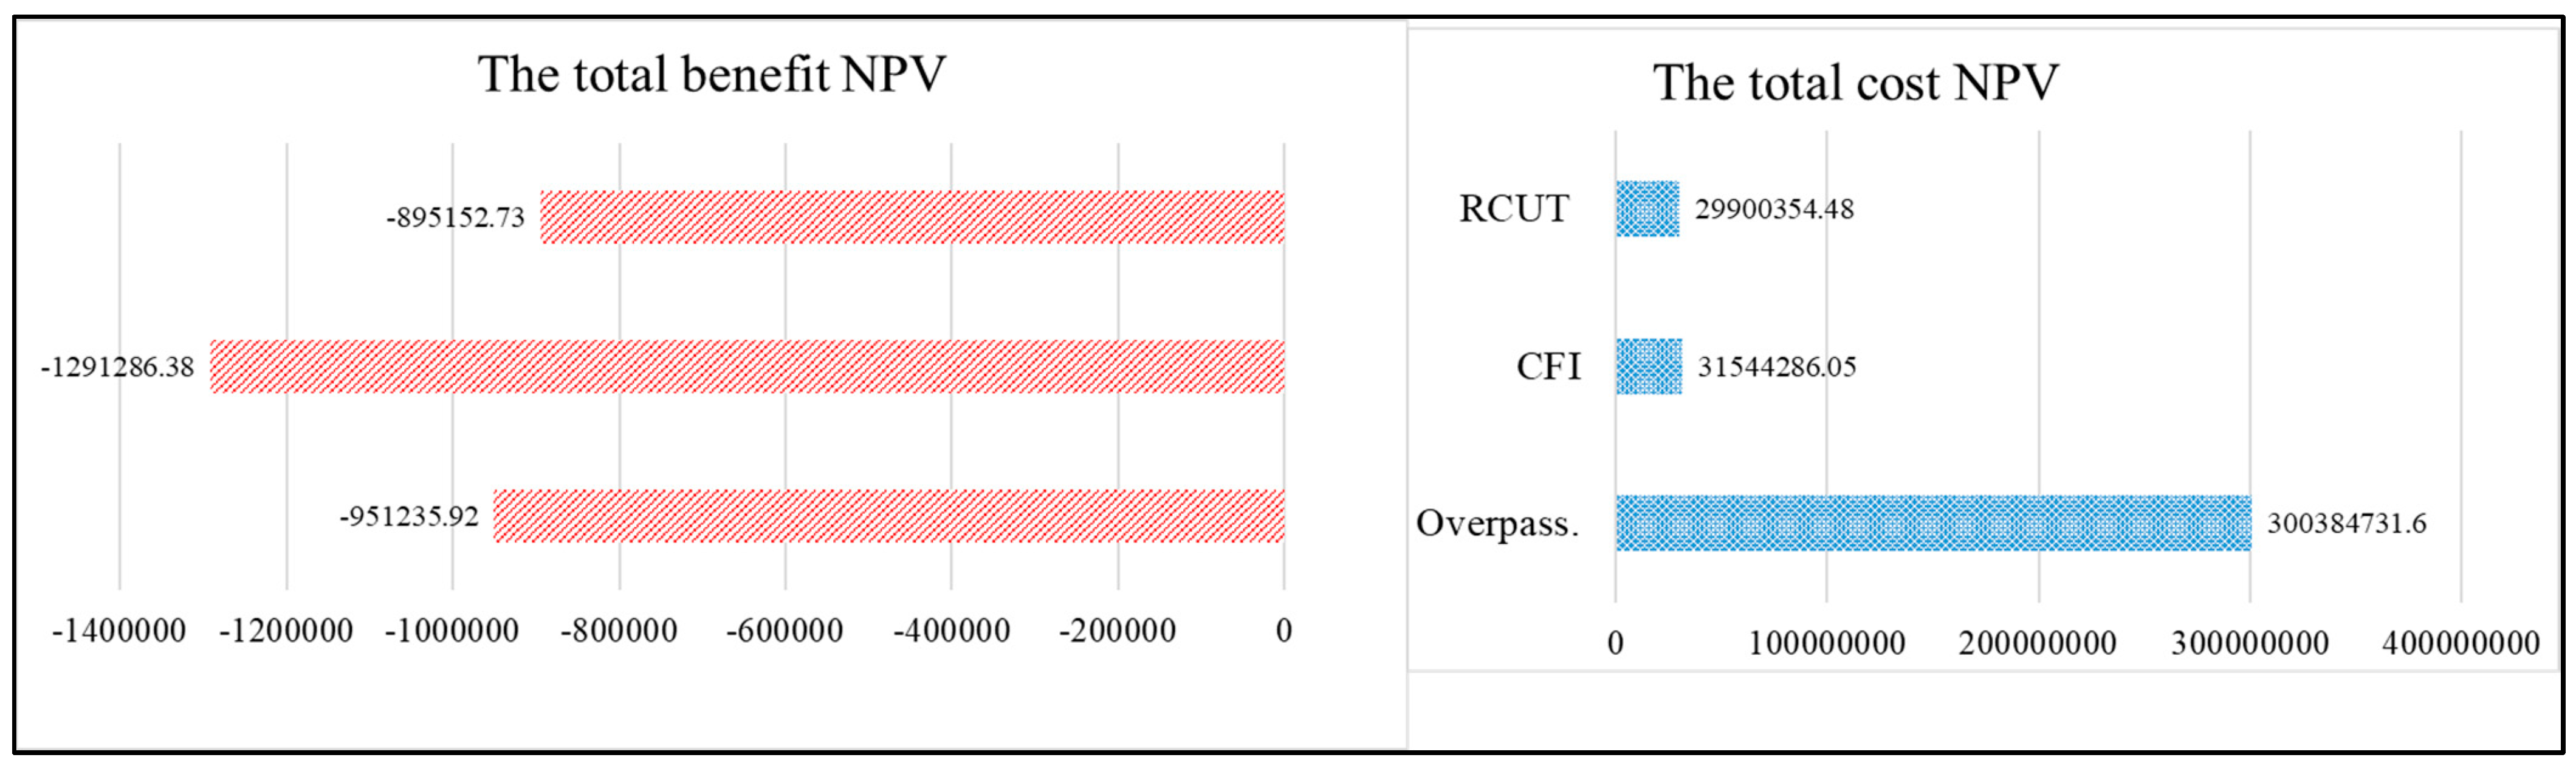
Data obtained from Cairo metropolitan master plan in 2009 by JICA were used to calculate the time value of delay costs [21]. It was found that the average monthly family income is 1134 L.E/household. Accordingly, the time value was adjusted for categories of road users in 2017, based on the expected hourly income of workers and the level of family income in the same year. Taking into account that the VOT of passenger car users increased by 80.0% along the studied road, the time value was taken as 18.19 L.E/hour. The saving cost of the total travel time was estimated accordingly, as shown in Figure 12. The UAIDs led to travel time cost-savings higher than that of the overpass interchange, as the overpass proposed in this study aims to alleviate congestion along the main corridor (i.e., in the eastbound–westbound direction); however, traffic flow to and from northbound and southbound still operates as a signalized at-grade intersection. As a result, the travel time at UAIDs led to higher savings than that of the overpass alternative. The social discount rate is equal to 17.20%, according to the Central Bank of Egypt data [29]. Substituting in Equation (13), the net present value of each cost and benefit of each proposal was calculated over the lifespan of the project, as shown in Figure 13. As mentioned earlier, the proposed total lifespan was 30 years for super-structure elements and sidewalks, while it was assumed to be 10 years for signal heads, detectors, and control units. The BCR value was estimated to reflect the efficiency of each scheme. In the case of CFI, the BCR value exceeded 4.0, while it was found to be 2.99 in the case of RCUT and less than 1.0 for the overpass interchange, which was thus considered an economically inefficient scheme. Table 4 summarizes the total cost savings and the BCA ratio over the project lifespan for the different alternatives, which indicates that the overpass interchange may save 43.0% for the delay costs, while the CFI and RCUT intersections may save 53.0% and 38.0%, respectively. The results also showed that the CFI saved 30% higher than that which could be saved at the overpass interchange and 40% than that of the RCUT intersection in delay cost savings, while the cost savings of the overpass interchange was higher than the RCUT alternative by 5.0%.
The fuel consumption cost showed significant savings for the UAIDs, compared to the overpass interchange. The fuel consumption cost savings for the overpass interchange was 19.0%, while the CFI and RCUT intersections may also save 74.0% and 13.0%, respectively. Likewise, the results showed that the cost savings of the CFI intersection were higher than the overpass interchange and the RCUT alternative by 74.0% and 83.0%, respectively. On the other hand, the cost savings of the overpass interchange increased the cost savings by 33.0% over the RCUT design.
The operational performance indicators indicated significant improvements with the implementation of the different studied interventions, instead of the existing intersections. The results indicated smoother travel along the road, emphasizing a significant improvement in average running speeds for all proposed solutions, as well as the better savings costs due to reduced wasted fuel consumption, showing considerable savings when compared to the conventional designs. The cost savings due to fuel consumption reduction were 19.0% for the overpass interchange, while they were found to be 74.0% and 13.0% for the CFI and RCUT intersections, respectively. The obtained results revealed that the cost savings with the CFI were higher than those of the overpass interchange and RCUT by 55.0% and 61.0%, respectively. Furthermore, the savings in control intersection costs were increased by 6.0%, compared to the RCUT. The total cost savings due to reduced CO2 emissions reflected significant savings with the implementation of the different proposed schemes. The savings were 19.0%, 75.0%, and 13.0% for the overpass, CFI, and RCUT, respectively. These results emphasize the superiority of the CFI, regarding CO2 emissions reduction. It was found that the CFI provides 56.0% and 62.0% higher reductions than the overpass and RCUT intersections, respectively. Moreover, the results revealed considerable savings in the total travel time-saving cost under the proposed interventions. The conventional signalized intersections saved 43.0% overall delay costs, while CFI and RCUT saved 53.0% and 38.0%, respectively. It was also found that CFI saved 10% higher than the conventional and overpass interchange, while RCUT recorded 15% higher than the same intersections; however, the overpass recorded 5.0% higher saving than the RCUT.
6. Conclusions
The cost–benefit analysis results presented in this paper emphasized the economical effectiveness of the considered UAIDs (i.e., CFI and RCUT), with significant potential benefits as a result of the implementation of the proposed schemes. The BCR value was less than 1.0 for the overpass interchange, reflecting the inefficiency of such a scheme. To the contrary, it exceeded 4.0 in the case of the CFI. It can be summarized that the considered UAIDs have economically effective performance, compared to overpass interchanges. Thus, UAIDs are recommended to mitigate traffic congestion at conventional intersections, in an effort toward sustainable development of the greater Cairo region. Future studies may consider land-use cost for the right-of-way needed under each intersection scheme. The issue we see with evaluating the proposed framework performance against other models is that, when possibly applying our assumptions to other models, they may not consider all of the factors which we considered. Considering this correlation is a challenge, and may be taken into account in future work.
Author Contributions
Conceptualization, S.S., S.T. and A.M.W.; methodology, S.S. and A.M.W.; software, S.S. and A.M.W.; validation, S.S. and S.T.; analysis, S.S., S.T. and A.M.W.; data S.S. and A.M.W.; writing—original draft preparation, S.S.; writing—review and editing, S.T. and A.M.W. All authors have read and agreed to the published version of the manuscript.
Funding
This research received no external funding. The APC was funded by the authors.
Institutional Review Board Statement
Ethical review and approval were waived for this study because it is not applicable.
Acknowledgments
The authors express their gratitude to The Center of Road Traffic Safety at Naif Arab University for Security Sciences for providing the facilities required for completing this research.
Conflicts of Interest
The authors declare that the paper has no financial/personal interest or any other matter that could affect its objectivity. The authors certify that potential competing interest do not exist for this paper.
References
- El Esawey, M.; Sayed, T. Analysis of Unconventional Arterial Intersection Designs (UAIDs): State-of-the-Art Methodologies and Future Research Directions. Transp. A Transp. Sci. 2013, 9, 860–895. [Google Scholar] [CrossRef]
- Federal Highway Administration. Displaced Left Turn Intersection Informational Guide, Chapter 3: Operational Characteristics; FHWA, U.S. Department of Transportation: Washington, DC, USA, 2014; pp. 53–63.
- El Esawey, M.; Sayed, T. Comparison of Two Unconventional Intersection Schemes: Crossover Displaced Left-Turn and Upstream Signalized Crossover Intersections. Transp. Res. Rec. J. Transp. Res. Board 2007, 2023, 10–19. [Google Scholar] [CrossRef]
- Federal Highway Administration. Alternative Intersections/Interchanges: Informational Report (AIIR); Publication FHWA-HRT-09-060; Federal Highway Administration: Washington, DC, USA, 2010.
- Shokry, S.; Tanaka, S.; Nakamura, F.; Ariyoshi, R.; Miura, S. Bandwidth Maximization Approach for Displaced Left-Turn Crossovers Coordination under Heterogeneous Traffic Conditions. J. Traffic Transp. Eng. 2018, 6, 183–196. [Google Scholar] [CrossRef]
- Shokry, S.; Tanaka, S.; Nakamura, F.; Ariyoshi, R.; Miura, S. Displaced Left-Turn Intersections under Heterogeneous Traffic Conditions in Cairo, Egypt. In Proceedings of the Conference of Eastern Asia Society of Transportation Studies; Eastern Asia Society of Transportation Studies: Ho Chi Minh City, Vietnam, 2017; pp. 11–58. [Google Scholar]
- Shokry, S.; Tanaka, S.; Nakamura, F.; Ariyoshi, R.; Miura, S. Performance Evaluation of Consecutive Signalized Intersections Under Heterogeneous Traffic Conditions In Cairo, Egypt. J. Jpn. Soc. Civ. Eng. 2018, 74, I_1207–I_1218. [Google Scholar] [CrossRef] [PubMed]
- Shokry, S.; Tanaka, S.; Nakamura, F.; Ariyoshi, R.; Miura, S. Operational Performance Comparison between Conventional Intersections and Two Unconventional Alternative Intersection Designs (UAIDs) Under Heterogeneous Traffic Conditions in Cairo, Egypt. Transp. Res. Procedia 2018, 48, 923–938. [Google Scholar] [CrossRef]
- Jagannathan, R.; Joe, B. Design and Operational Performance of Crossover Displaced Left-Turn Intersections. Transp. Res. Rec. J. Transp. Res. Board 2004, 1881, 1–10. [Google Scholar] [CrossRef]
- Chen, X.; Wu, S.; Shi, C.; Huang, Y.; Yang, Y.; Ke, R.; Zhao, J. Sensing data supported traffic flow prediction via denoising schemes and ANN: A comparison. IEEE Sens. J. 2020, 20, 14317–14328. [Google Scholar] [CrossRef]
- Li, X. The symmetric intersection design and traffic control optimization. Transp. Res. Part C Emerg. Technol. 2018, 92, 176–190. [Google Scholar] [CrossRef]
- Alemdar, K.D.; Tortum, A.; Kaya, Ö.; Atalay, A. Interdisciplinary Evaluation of Intersection Performances—A Microsimulation Based MCDA. Sustainability 2021, 13, 1859. [Google Scholar] [CrossRef]
- Hummer, J.E. Unconventional Left-Turn Alternatives for Urban and Suburban Arterials–Part One. Institute of Transportation Engineers. ITE J. 1998, 68, 26. [Google Scholar]
- Hummer, J.E.; Ram, J. An Update on Superstreet Implementation and Research. In Proceedings of the 8th National Conference on Access Management Transportation Research Board Federal Highway Administration Maryland State Highway Administration, Baltimore, Maryland, 13–16 July 2008. [Google Scholar]
- Bonneson, J.A.; McCoy, P.T.; Eitel, D. Interchange Versus At-Grade Intersection on Rural Expressways. Transp. Res. Rec. 1992, 1395, 39–47. [Google Scholar]
- Zhao, S.; Khattak, A.J.; Thompson, E.C. Safety and Economic Assessment of Converting Two-Way Stop-Controlled Intersections to Roundabouts on High-Speed Rural Highways Transportation Research Forum. Sour. J. Transp. Res. Forum. 2015, 54, 131–144. [Google Scholar]
- Steven, I.C.; Kita, K.; Jancie, D. Cost and Benefit analysis for optimized signal timing-case study: New Jersey route 23. ITE J. 2006, 76, 37–41. [Google Scholar]
- Morello, V.; Sangster, J. Evaluation of the Restricted Crossing U-turn Design as an Alternative to Grade Separated Interchanges on Rural Highways. In Proceedings of the Transportation Research Board 97th Annual Meeting, Washington, DC, USA, 7–11 January 2018; Volume 18. [Google Scholar]
- Texas A & M Transportation Institute. Urban Mobility Information; Technical Report; Texas A & M Transportation Institute: College Station, TX, USA, 1992.
- World Bank. Cairo Traffic Congestion Study Phase 1; Final Report; World Bank: Washington, DC, USA, 2010. [Google Scholar]
- JICA. The Strategic Urban Development Master Plan Study for Sustainable Development of the Greater Cairo Region; JICA: Tokyo, Japan, 2009.
- Federal Highway Administration. Average Vehicle Occupancy Factors for Computing Travel Time Reliability Measures and Total Peak Hour Excessive Delay Metrics; Technical Report; FHWA, U.S. Department of Transportation: Washington, DC, USA, 2018.
- User Benefit Analysis for Highways; American Association of State Highway and Transportation Officials: Washington, DC, USA, 2003.
- Shokry, S.; Tanaka, S. Evaluating the operational performance of signalized intersections involving U-turns in Aswan City, Egypt. J. East. Asia Soc. Transp. Stud. 2015, 11, 1754–1773. [Google Scholar]
- Feldman, O. The GEH Measure and Quality of the Highway Assignment Models. In Proceedings of the European Transport Conference, Glasgow, UK, 8–10 October 2012. [Google Scholar]
- Toledot, T.; Koutsopoulos, H. Statistical Validation of Traffic Simulation Models. Transp. Res. Rec. J. Transp. Res. Board 2004, 1876, 142–150. [Google Scholar] [CrossRef]
- Naghawi, H.; AlSoud, A.; Alhadidi, T. The Possibility for Implementing the Superstreet Unconventional Intersection Design in Jordan. Period. Polytech. Transp. Eng. 2018, 46, 122–128. [Google Scholar] [CrossRef] [Green Version]
- Shokry, S.; Tanaka, S.; Nakamura, F.; Ariyoshi, R.; Miura, S. A Proposal of a Real-Time Demand Responsive Signal Control Algorithm for Displaced Left-Turn Intersections Corridor in Developing Countries. J. Jpn. Soc. Civ. Eng. Ser. D3 (Infrastruct. Plan. Manag.) 2019, 75, I_1151–I_1165. [Google Scholar] [CrossRef]
- Central Bank of Egypt. Available online: https://www.cbe.org.eg/en/EconomicResearch/Statistics/Pages/DiscountRates.aspx (accessed on 21 January 2021).
Figure 1.
Continuous flow intersection (CFI) [2].
Figure 1.
Continuous flow intersection (CFI) [2].

Figure 2.
Restricted Crossing U-Turn (RCUT) [2].
Figure 2.
Restricted Crossing U-Turn (RCUT) [2].

Figure 3.
CBA methodological framework.

Figure 4.
The studied conventional intersections along an arterial corridor.

Figure 5.
Typical geometric layout of the studied intersections.

Figure 6.
Traffic volume among the studied intersections.

Figure 7.
Traffic directional ratio at the studied intersections.

Figure 8.
Total cost analysis of the different alternatives (L.E).

Figure 9.
Cumulative road user benefit estimates for the different alternatives (L.E).

Figure 10.
Estimated fuel consumption cost savings (L.E).

Figure 11.
Estimated CO2 emissions cost savings (L.E).

Figure 12.
Estimated total travel time cost savings (L.E).

Figure 13.
Net present value (NPV) estimation of costs and benefits (L.E).


Table 1.
Various static and dynamic properties of the different represented vehicles.
| Vehicle Type | Length (m) | Width (m) | Desired Speed (Km/h) | Acceleration | Deceleration | ||
|---|---|---|---|---|---|---|---|
| Max. | Desired | Max. | Desired | ||||
| Microbus | 5.0 | 1.9 | 50 | 1.5 | 1.2 | 1.2 | 1.0 |
| Minibus | 8.0 | 2.0 | 30 | 0.8 | 0.7 | 1.2 | 0.6 |
| Bus | 10.3 | 2.5 | 30 | 1.3 | 0.8 | 1.4 | 0.6 |
| Motorcycle | 1.8 | 0.6 | 40 | 2.5 | 1.7 | 1.7 | 1.2 |
| Car | 4.0 | 1.6 | 50 | 1.5 | 1.2 | 1.2 | 1.0 |
Table 2.
Tuned variables of the different parameters.
| VISSIM Parameters | Tuned Variables | |
|---|---|---|
| Avg. standstill distance | 0.5 m | |
| No. of observed Vehicles | 2 vehicles | |
| Look ahead distance | Min. 5.0 m | Max. 100.0 m |
| Look back distance | Min. 30.0 m | Max. 150.0 m |
Table 3.
Cost estimates for base case and various alternatives.
| Cost Element | Estimated Values in Egyptian Currency (L.E) | |||
|---|---|---|---|---|
| Base Case | UAIDs | Overpass Interchange | ||
| CFI | RCUT | |||
| Construction cost | 27,630,000.0 | 30,570,000.0 | 29,250,000.0 | 300,220,000.0 |
| Control unit cost | 1,320,000.0 | 3,960,000.0 | 2,640,000.00 | 660,000.0 |
| Annual operation total cost | 200,000.0 | 250,000.0 | 220,000.0 | 100,000.0 |
| Annual maintenance cost | 160,000.0 | 180,000.0 | 165,000.0 | 250,000.0 |
| Cumulative cost over project lifespan | 41,070,000.0 | 51,390,000.0 | 46,080,000.0 | 312,040,000.0 |
Table 4.
Total cost savings and BCA ratio over the project lifespans.
| Savings Element | Estimated Values in Egyptian Currency (L.E) | ||
|---|---|---|---|
| Overpass Interchange | UAIDs | ||
| CFI | RCUT | ||
| Delay cost savings | 3,336,030,142.0 | 4,422,084,682.0 | 3,151,148,122.0 |
| Fuel consumption cost savings | 23,422,462,070 | 90,001,271,578 | 15,614,974,714 |
| Total CO2 emission cost savings | 653,072,243,286 | 2,515,153,994,220 | 435,381,495,524 |
| The total cost savings | 679,830,735,498 | 2,609,577,350,480 | 454,147,618,360 |
| NPV (Costs) | 300,384,731.61 | 31,544,286.05 | 29,900,354.48 |
| NPV (Benefits) | 951,235.92 | 1,291,286.38 | 895,152.73 |
| BCA ratio | 0.32 | 4.09 | 2.99 |
Publisher’s Note: MDPI stays neutral with regard to jurisdictional claims in published maps and institutional affiliations. |
© 2022 by the authors. Licensee MDPI, Basel, Switzerland. This article is an open access article distributed under the terms and conditions of the Creative Commons Attribution (CC BY) license (https://creativecommons.org/licenses/by/4.0/).
Share and Cite
MDPI and ACS Style
Shokry, S.; Tanaka, S.; Wahaballa, A.M. Cost–Benefit Analysis of Unconventional Arterial Intersection Designs: Cairo as a Case Study. Sustainability 2022, 14, 17016. https://0-doi-org.brum.beds.ac.uk/10.3390/su142417016
AMA Style
Shokry S, Tanaka S, Wahaballa AM. Cost–Benefit Analysis of Unconventional Arterial Intersection Designs: Cairo as a Case Study. Sustainability. 2022; 14(24):17016. https://0-doi-org.brum.beds.ac.uk/10.3390/su142417016
Chicago/Turabian StyleShokry, Sherif, Shinji Tanaka, and Amr M. Wahaballa. 2022. "Cost–Benefit Analysis of Unconventional Arterial Intersection Designs: Cairo as a Case Study" Sustainability 14, no. 24: 17016. https://0-doi-org.brum.beds.ac.uk/10.3390/su142417016
Note that from the first issue of 2016, this journal uses article numbers instead of page numbers. See further details here.