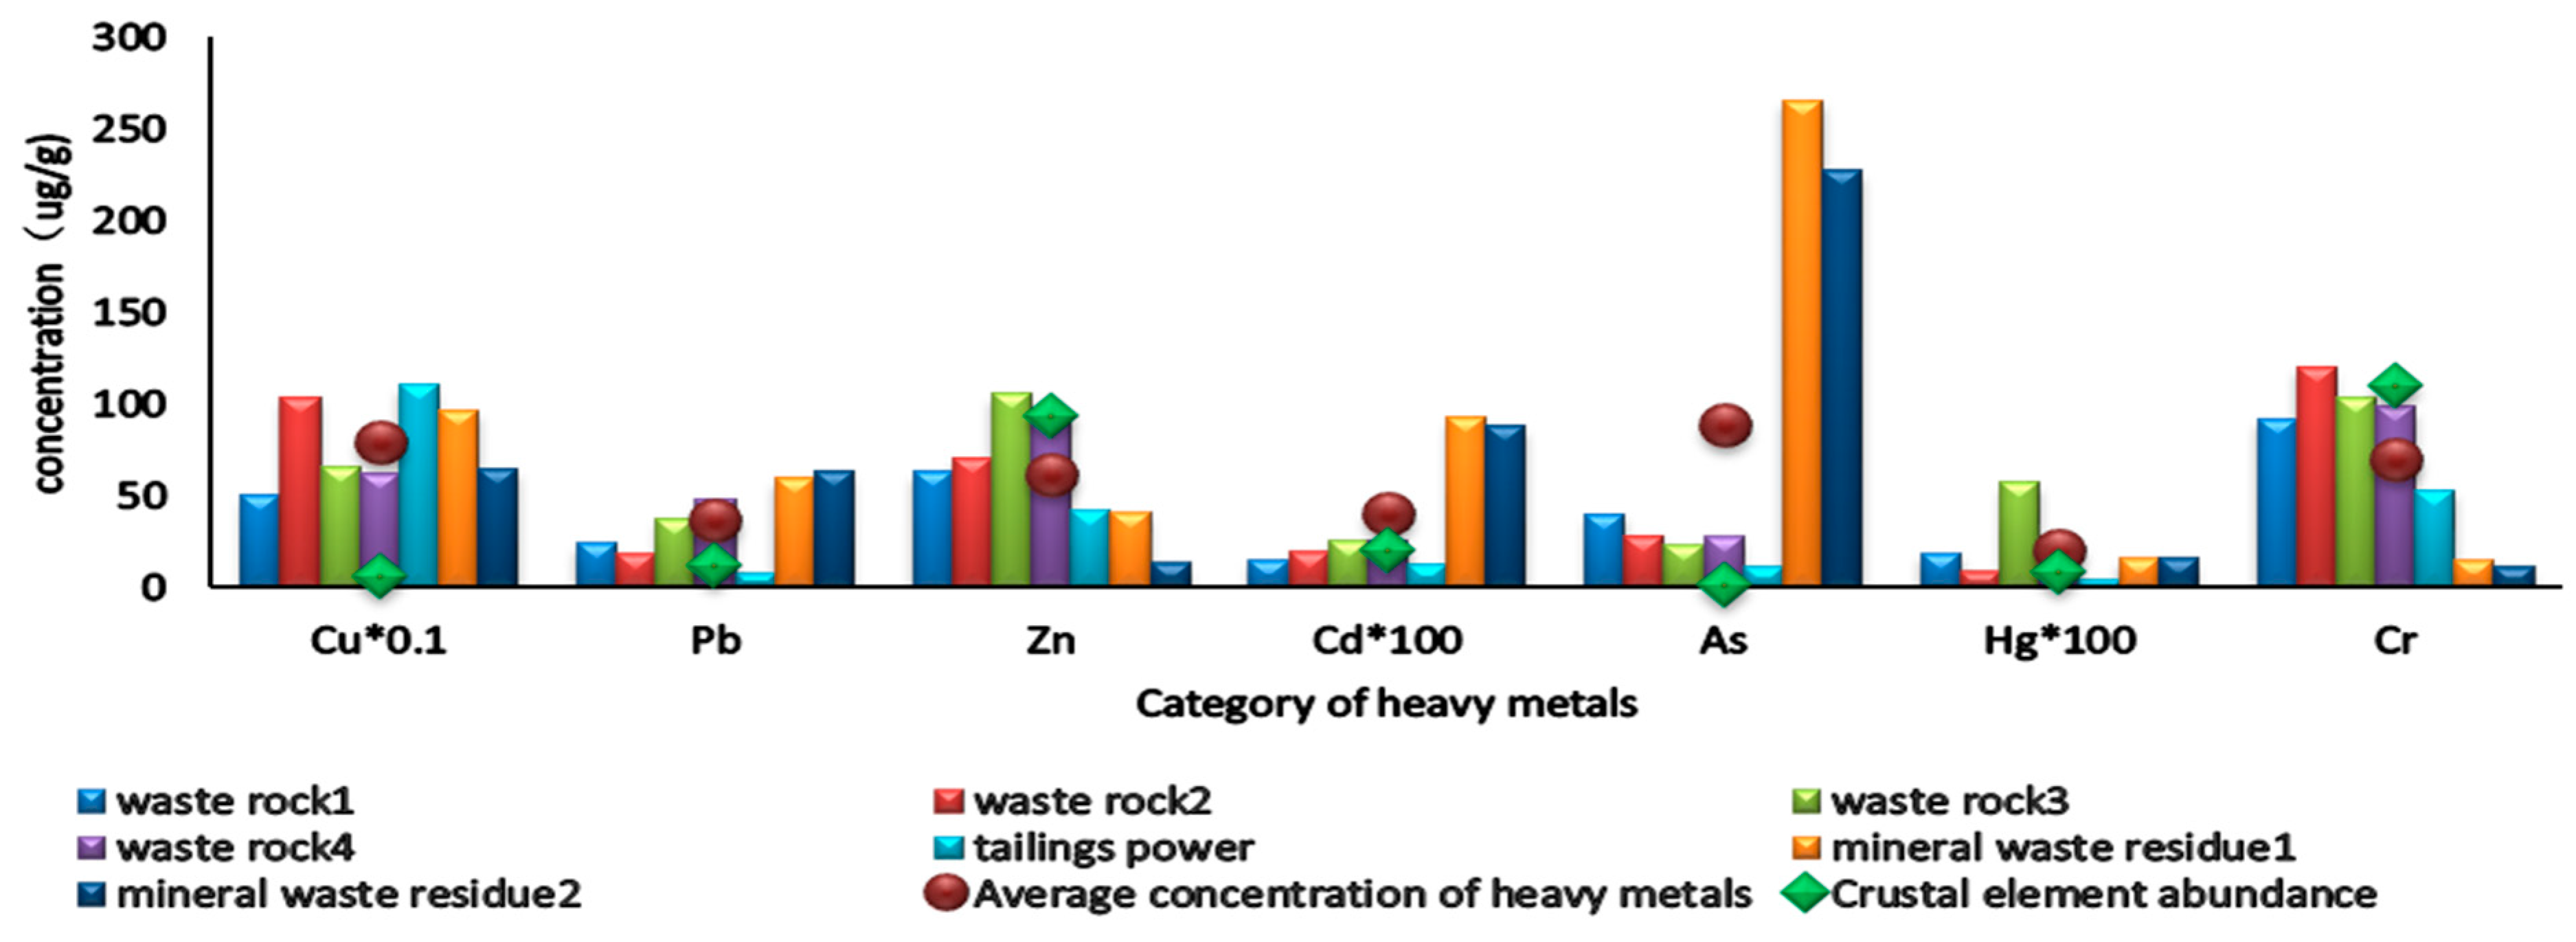
4.1. Environmental Hazard Assessment of Heavy Metals in Mining Waste Rock and Tailings Sand
The average concentrations of Cu, Pb, Cd, As and Hg in waste rock, slag and tailings samples were higher than Crustal element abundance. The heavy metal concentrations in 4# tailings sand were similar to those tested by Zhao Yuanyi et al. from 2011 to 2013 (
Table 4), which showed that the heavy metal concentrations of 4# tailings pond tailings sand had not changed significantly in the past 8 years. The average concentrations of Cu in waste rock and ore powder samples in this test were more than ten times of crustal element abundance. Zhao Yuanyi et al. tested the element form proportion of Cu in tailings, and the proportion of water-soluble, adsorbed and carbonate forms easy to be bioabsorbed accounted for 21.49%. Vulcanized state accounted for 73.57% [
30].
Mining and mineral processing are important ways for heavy metals to diffuse to soil [
31]. The research shows that sulfide minerals oxidized and leached on the surface (5–10 cm) and a large amount of heavy metals were released, and then migrated vertically downward to the deep (enrichment layer, 110–115 cm) to form secondary minerals (goethite, jarosite, chloralum, tetrahydrate alum, etc.). Large heavy metals were concentrated and the underlying soil was polluted. A large number of studies showed that [
32,
33] the typical contaminated soils in the mining area mainly included farmland and vegetable soils irrigated by mining and mineral processing wastewater, and soils at mining sites and plant areas.
In typical smelting contaminated areas, traffic, coal combustion, smelting and mining activities are recognized as the main anthropogenic inputs of metals accumulation. The variations in metal and metalloid concentrations in soils also related to geology [
34].
Chalcopyrite is the most important mineral in Dexing copper mine area. Under the action of oxygen and acidic water, copper-bearing sulfide produced water-soluble heavy metal compounds easily. Therefore, the waste rock and slag produced in the copper mine site at the upstream of Dawu River and a large amount of tailing sand stored in the 4# tailings dump of the copper mine threaten the surrounding environment.
4.2. Assessment of Heavy Metal Pollution and Source Apportionment of Heavy Metals in Soils
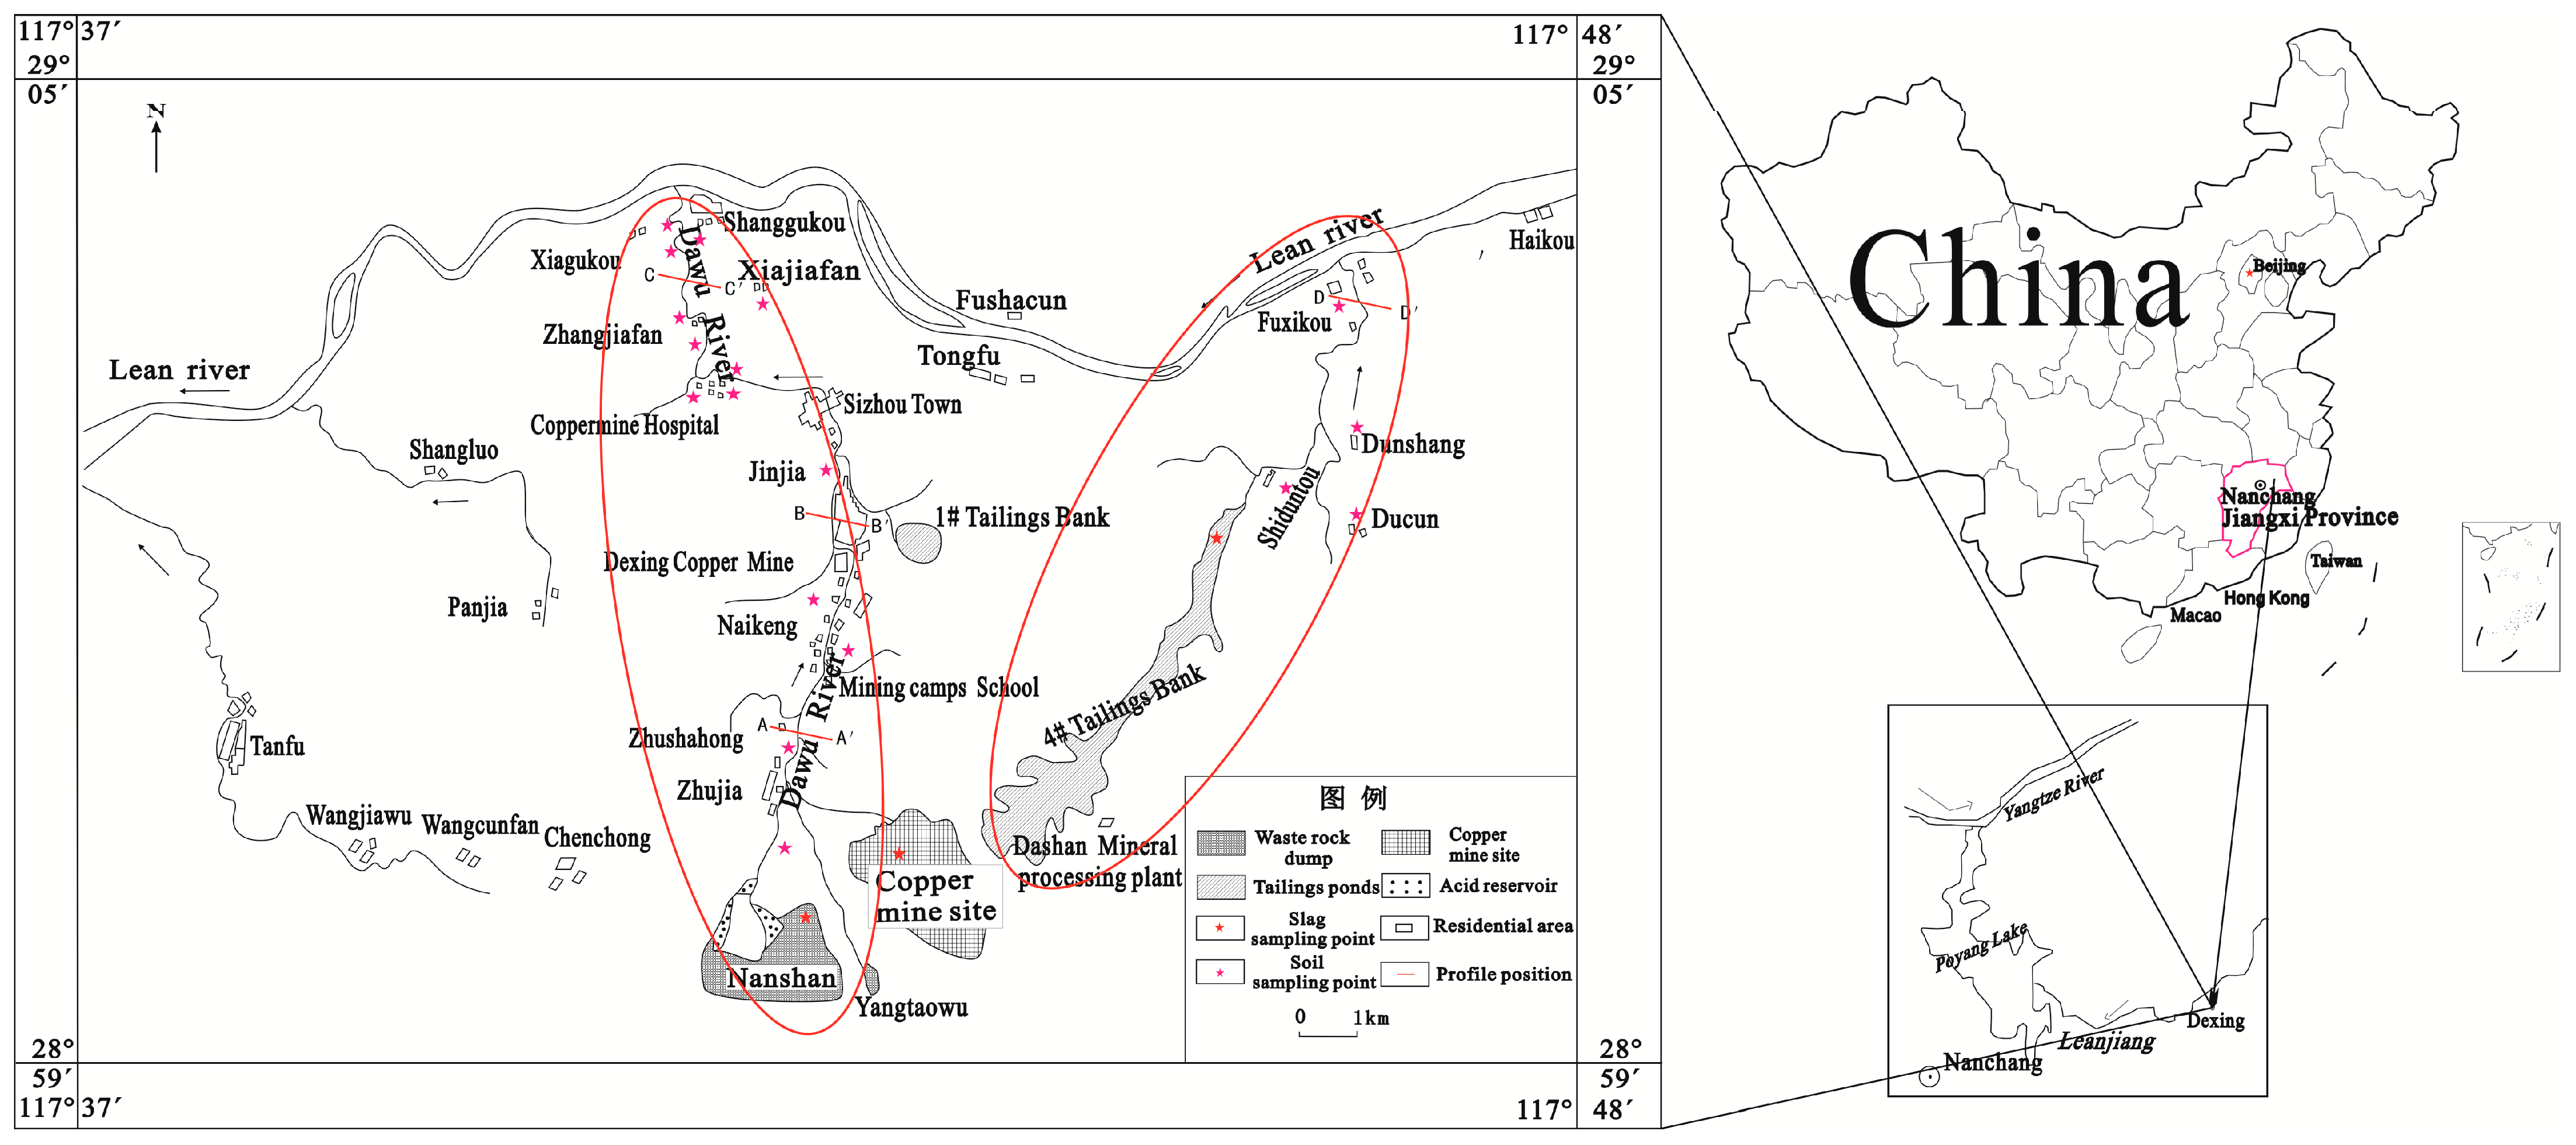
4.2.1. Evaluation of Heavy Metal Pollution in Soil around Dexing Copper Mine (Dawu River Basin and Tailings Pond Downstream)
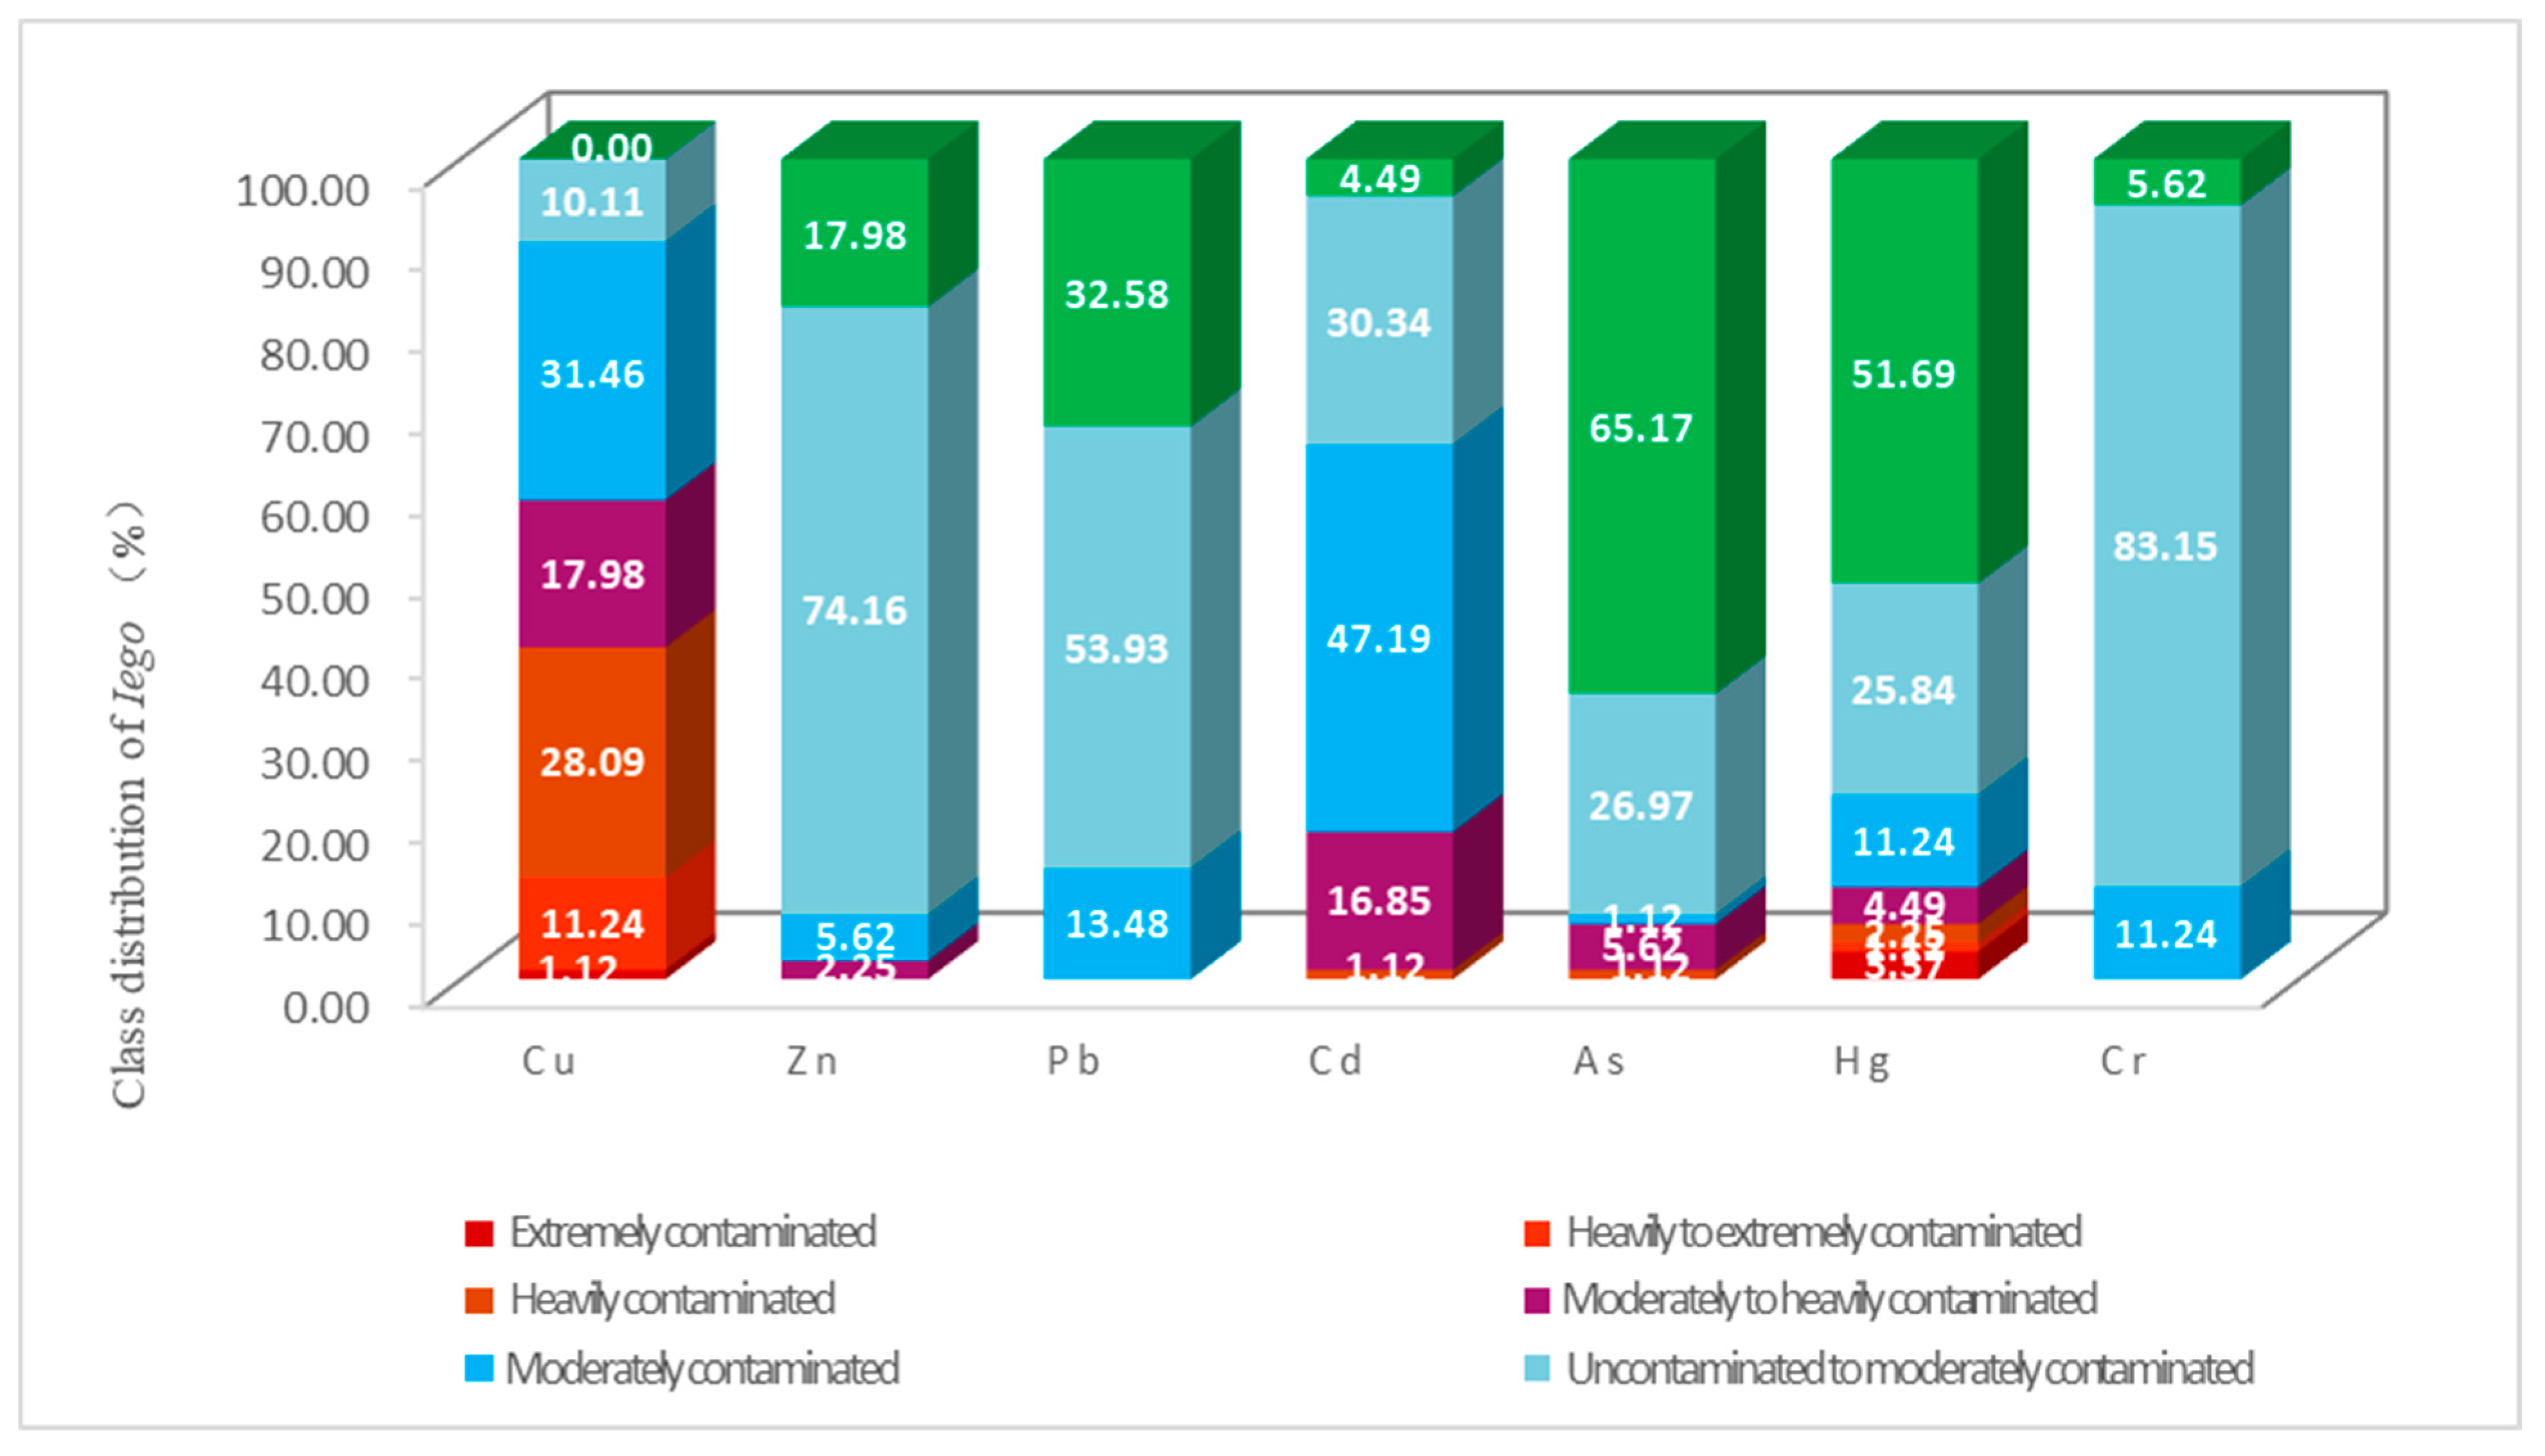
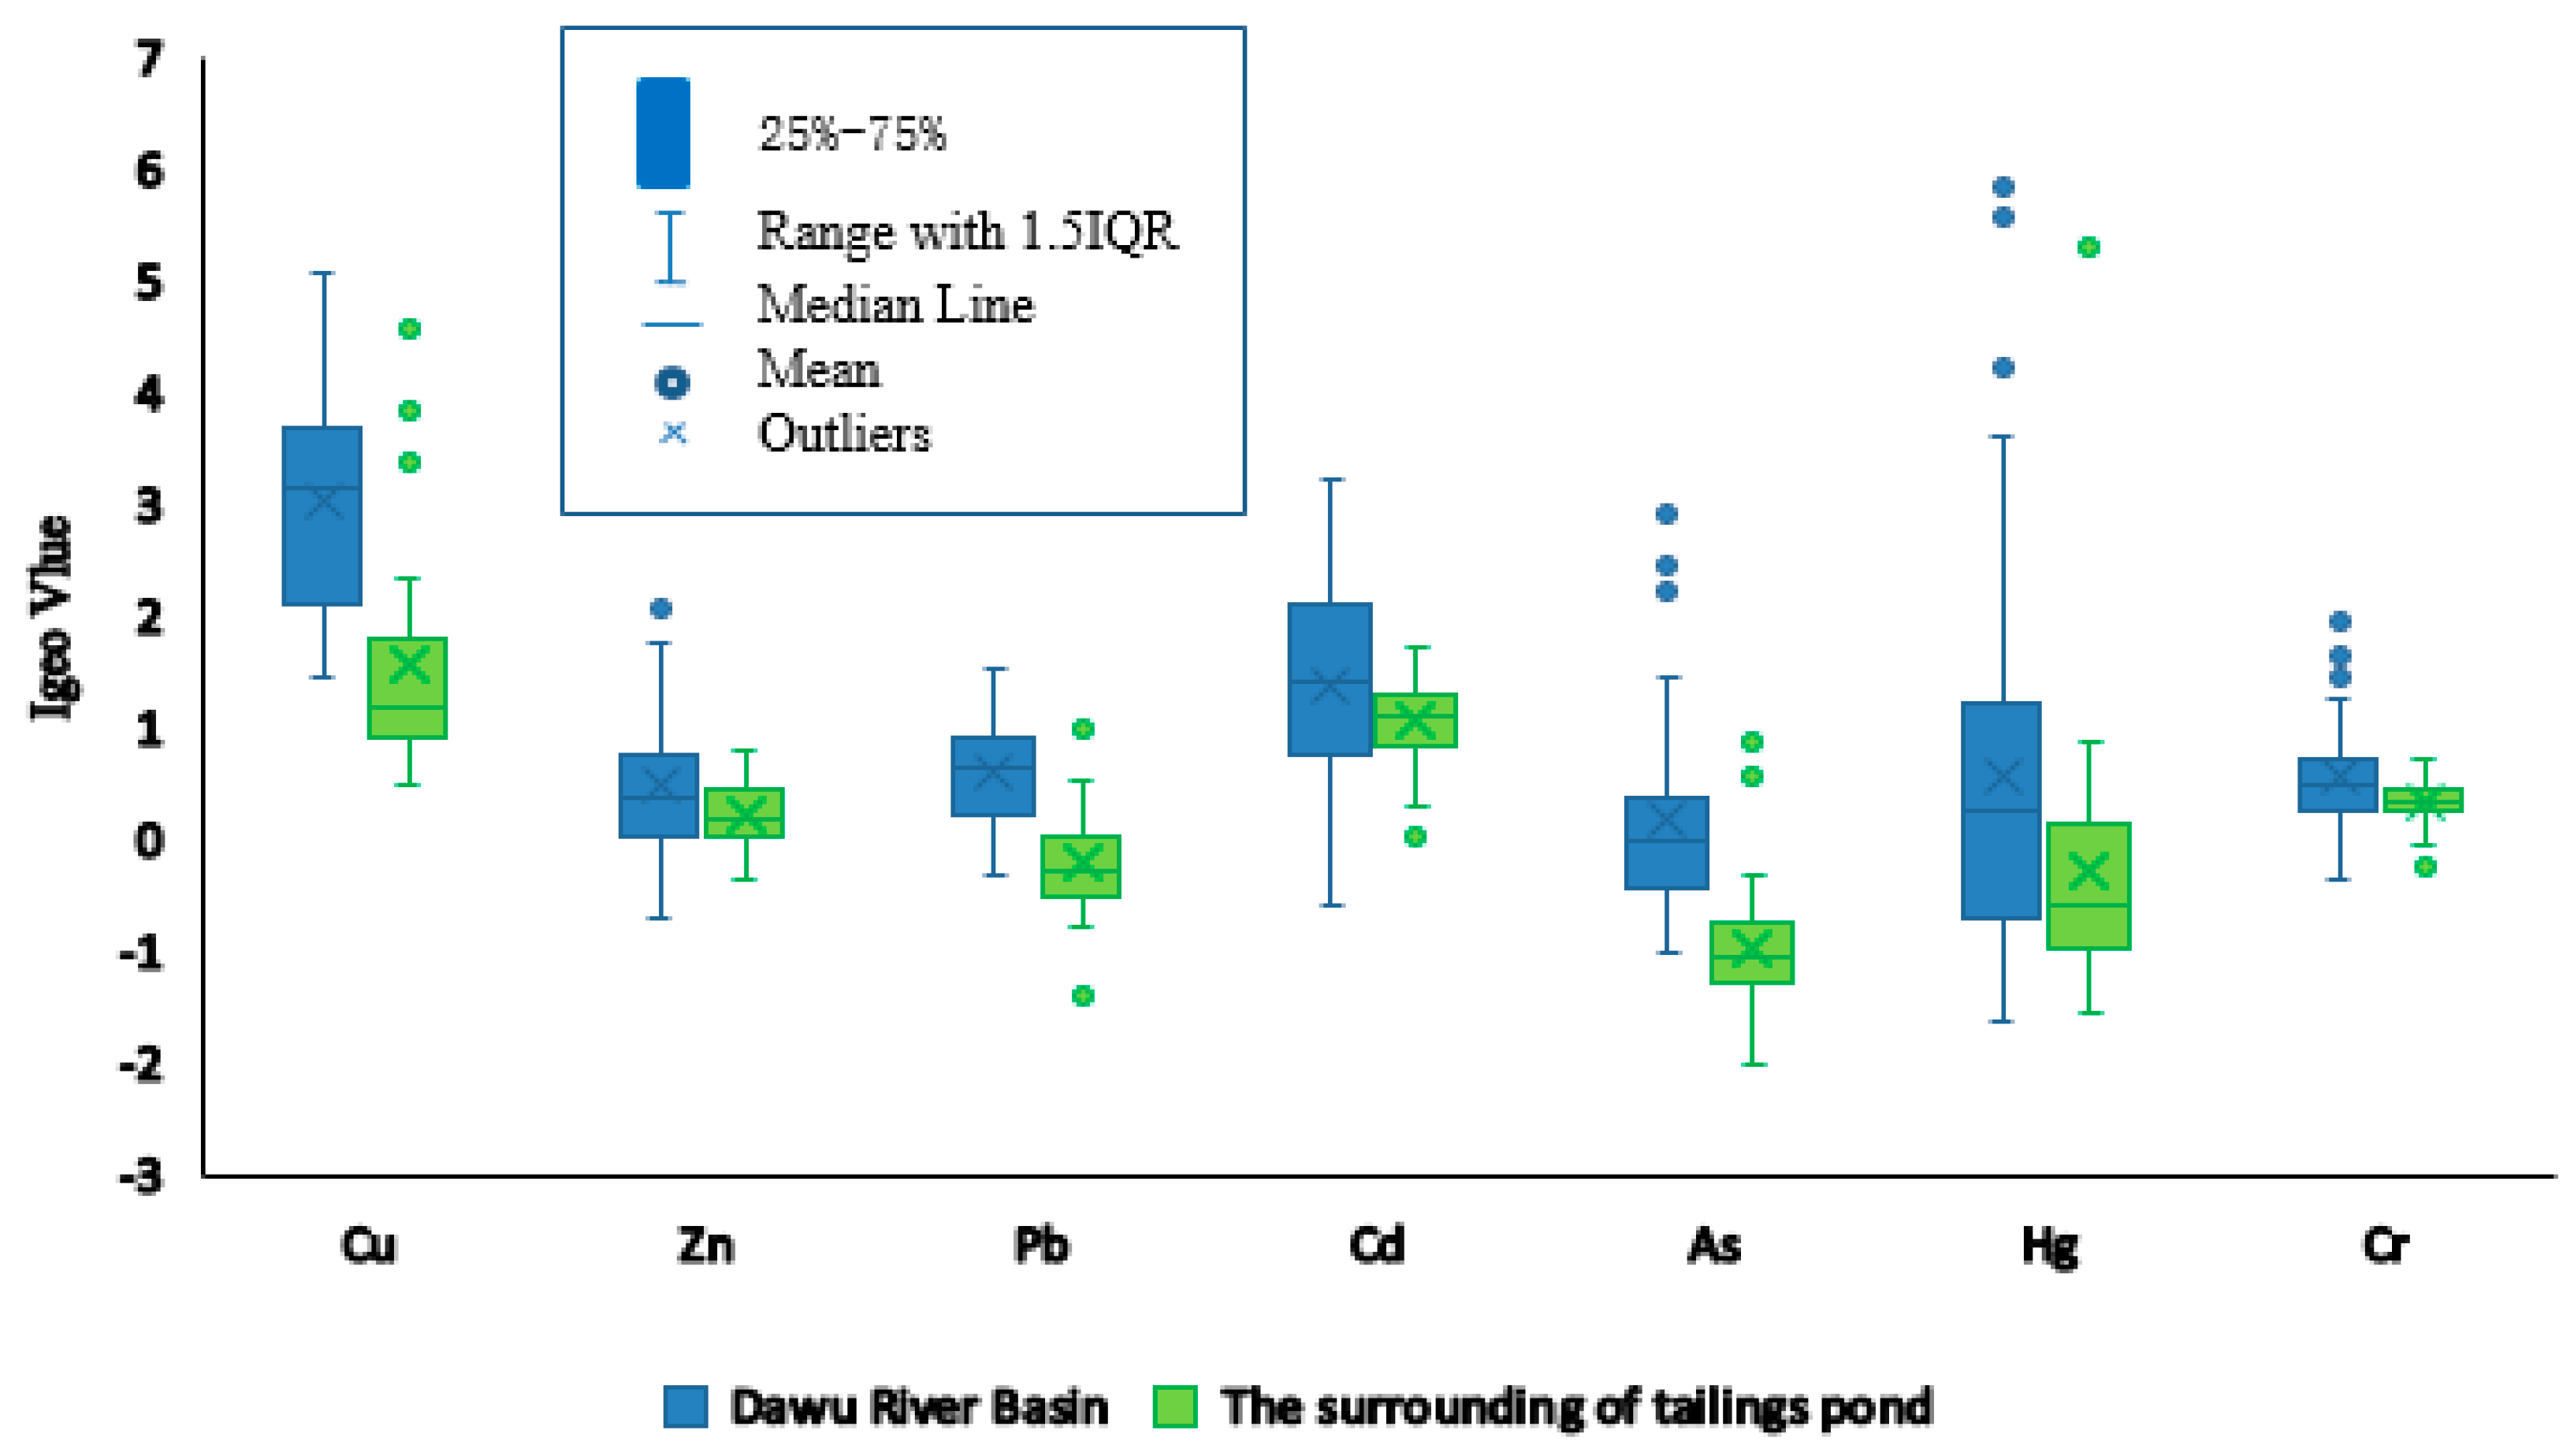
The I
geo values of the seven heavy metals (Cu, Zn, Pb, Cd, As, Hg, Cr) in the soil samples and their distribution percentage are shown in
Figure 4. The I
geo values of soil heavy metal showed that 100% of Cu were over an unpolluted-to-moderately-polluted level (I
geo > 0), and more than 50% of Cu were heavily polluted (I
geo > 3), indicating that the Cu pollution in most of the investigated sites reach the moderate to heavy contamination level. Cu pollution was serious. A total of 65.17% of the soil samples for Cd were over moderately polluted (I
geo > 1), reflecting that Cd pollution exists in this area. Totals of 22.47%, 7.87% and 7.87% of the soil samples for Hg, As and Zn were over moderately polluted (I
geo > 1), and 13.48% and 11.24% of the soil samples for Pb and Cr, and 7.87% of the soil samples for Hg, As and Zn were over moderately polluted (I
geo > 1), Pb and Cr pollution were generally moderately to lightly polluted, without moderately strong pollution.
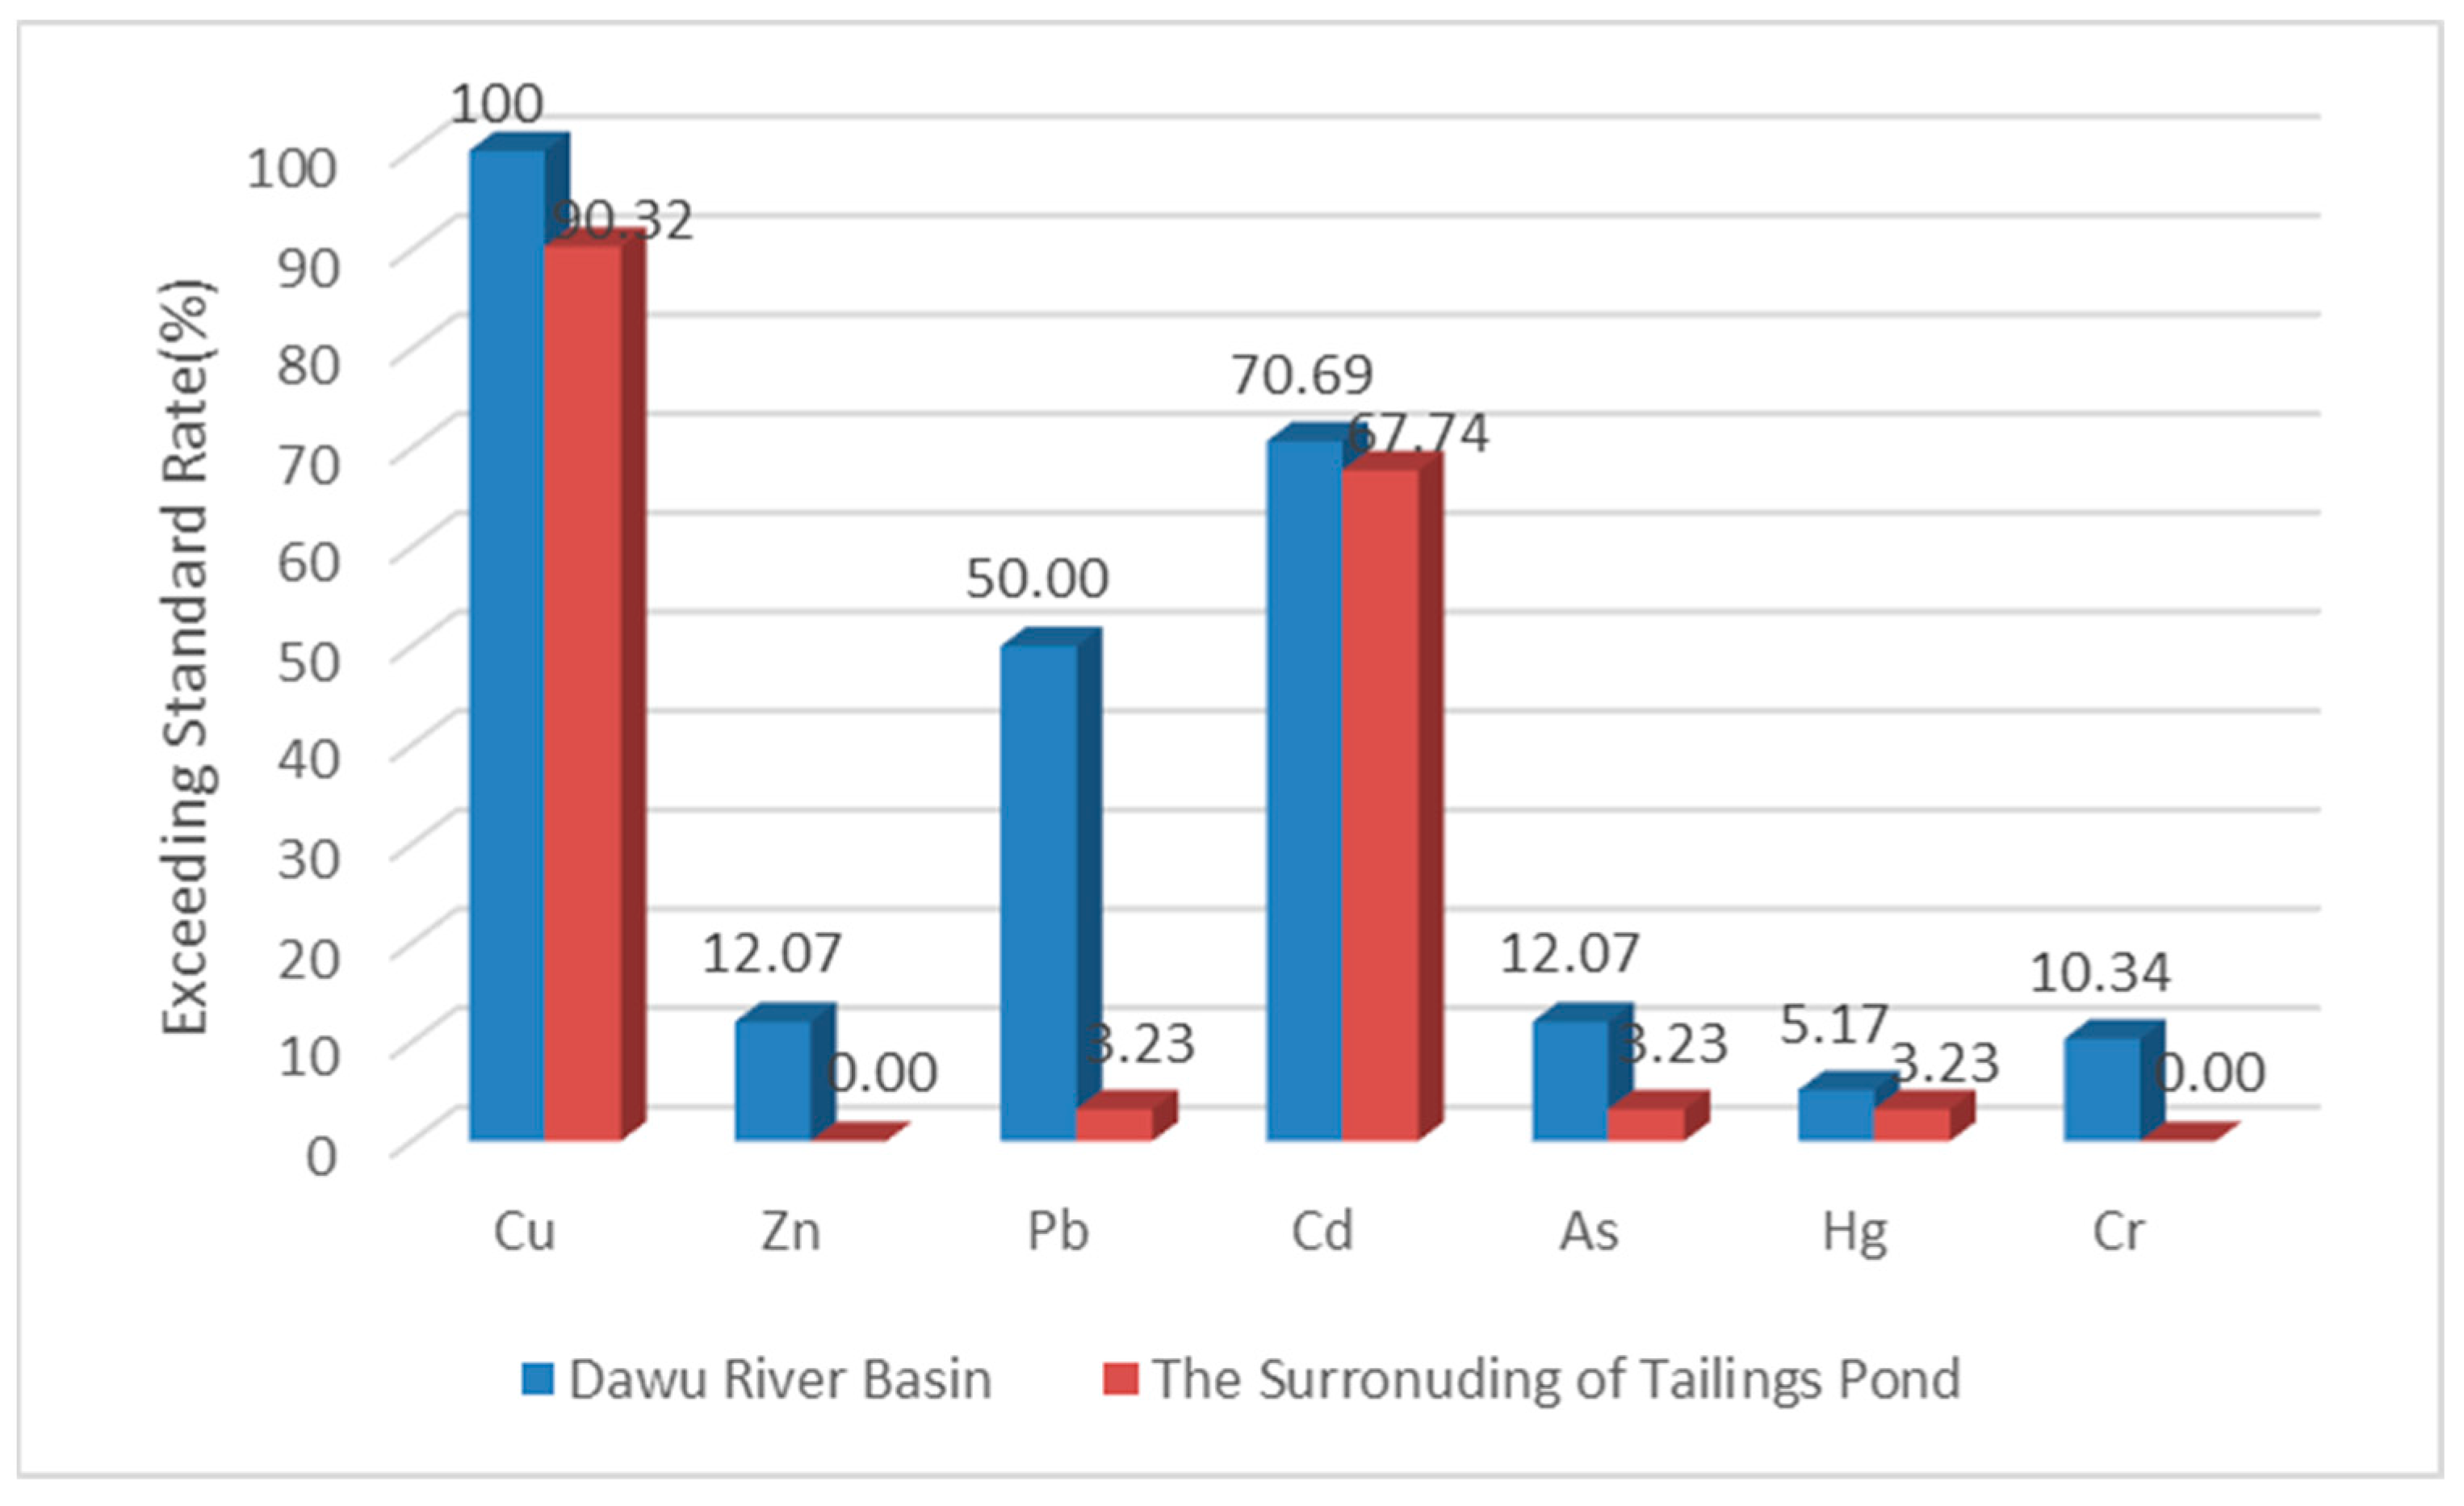
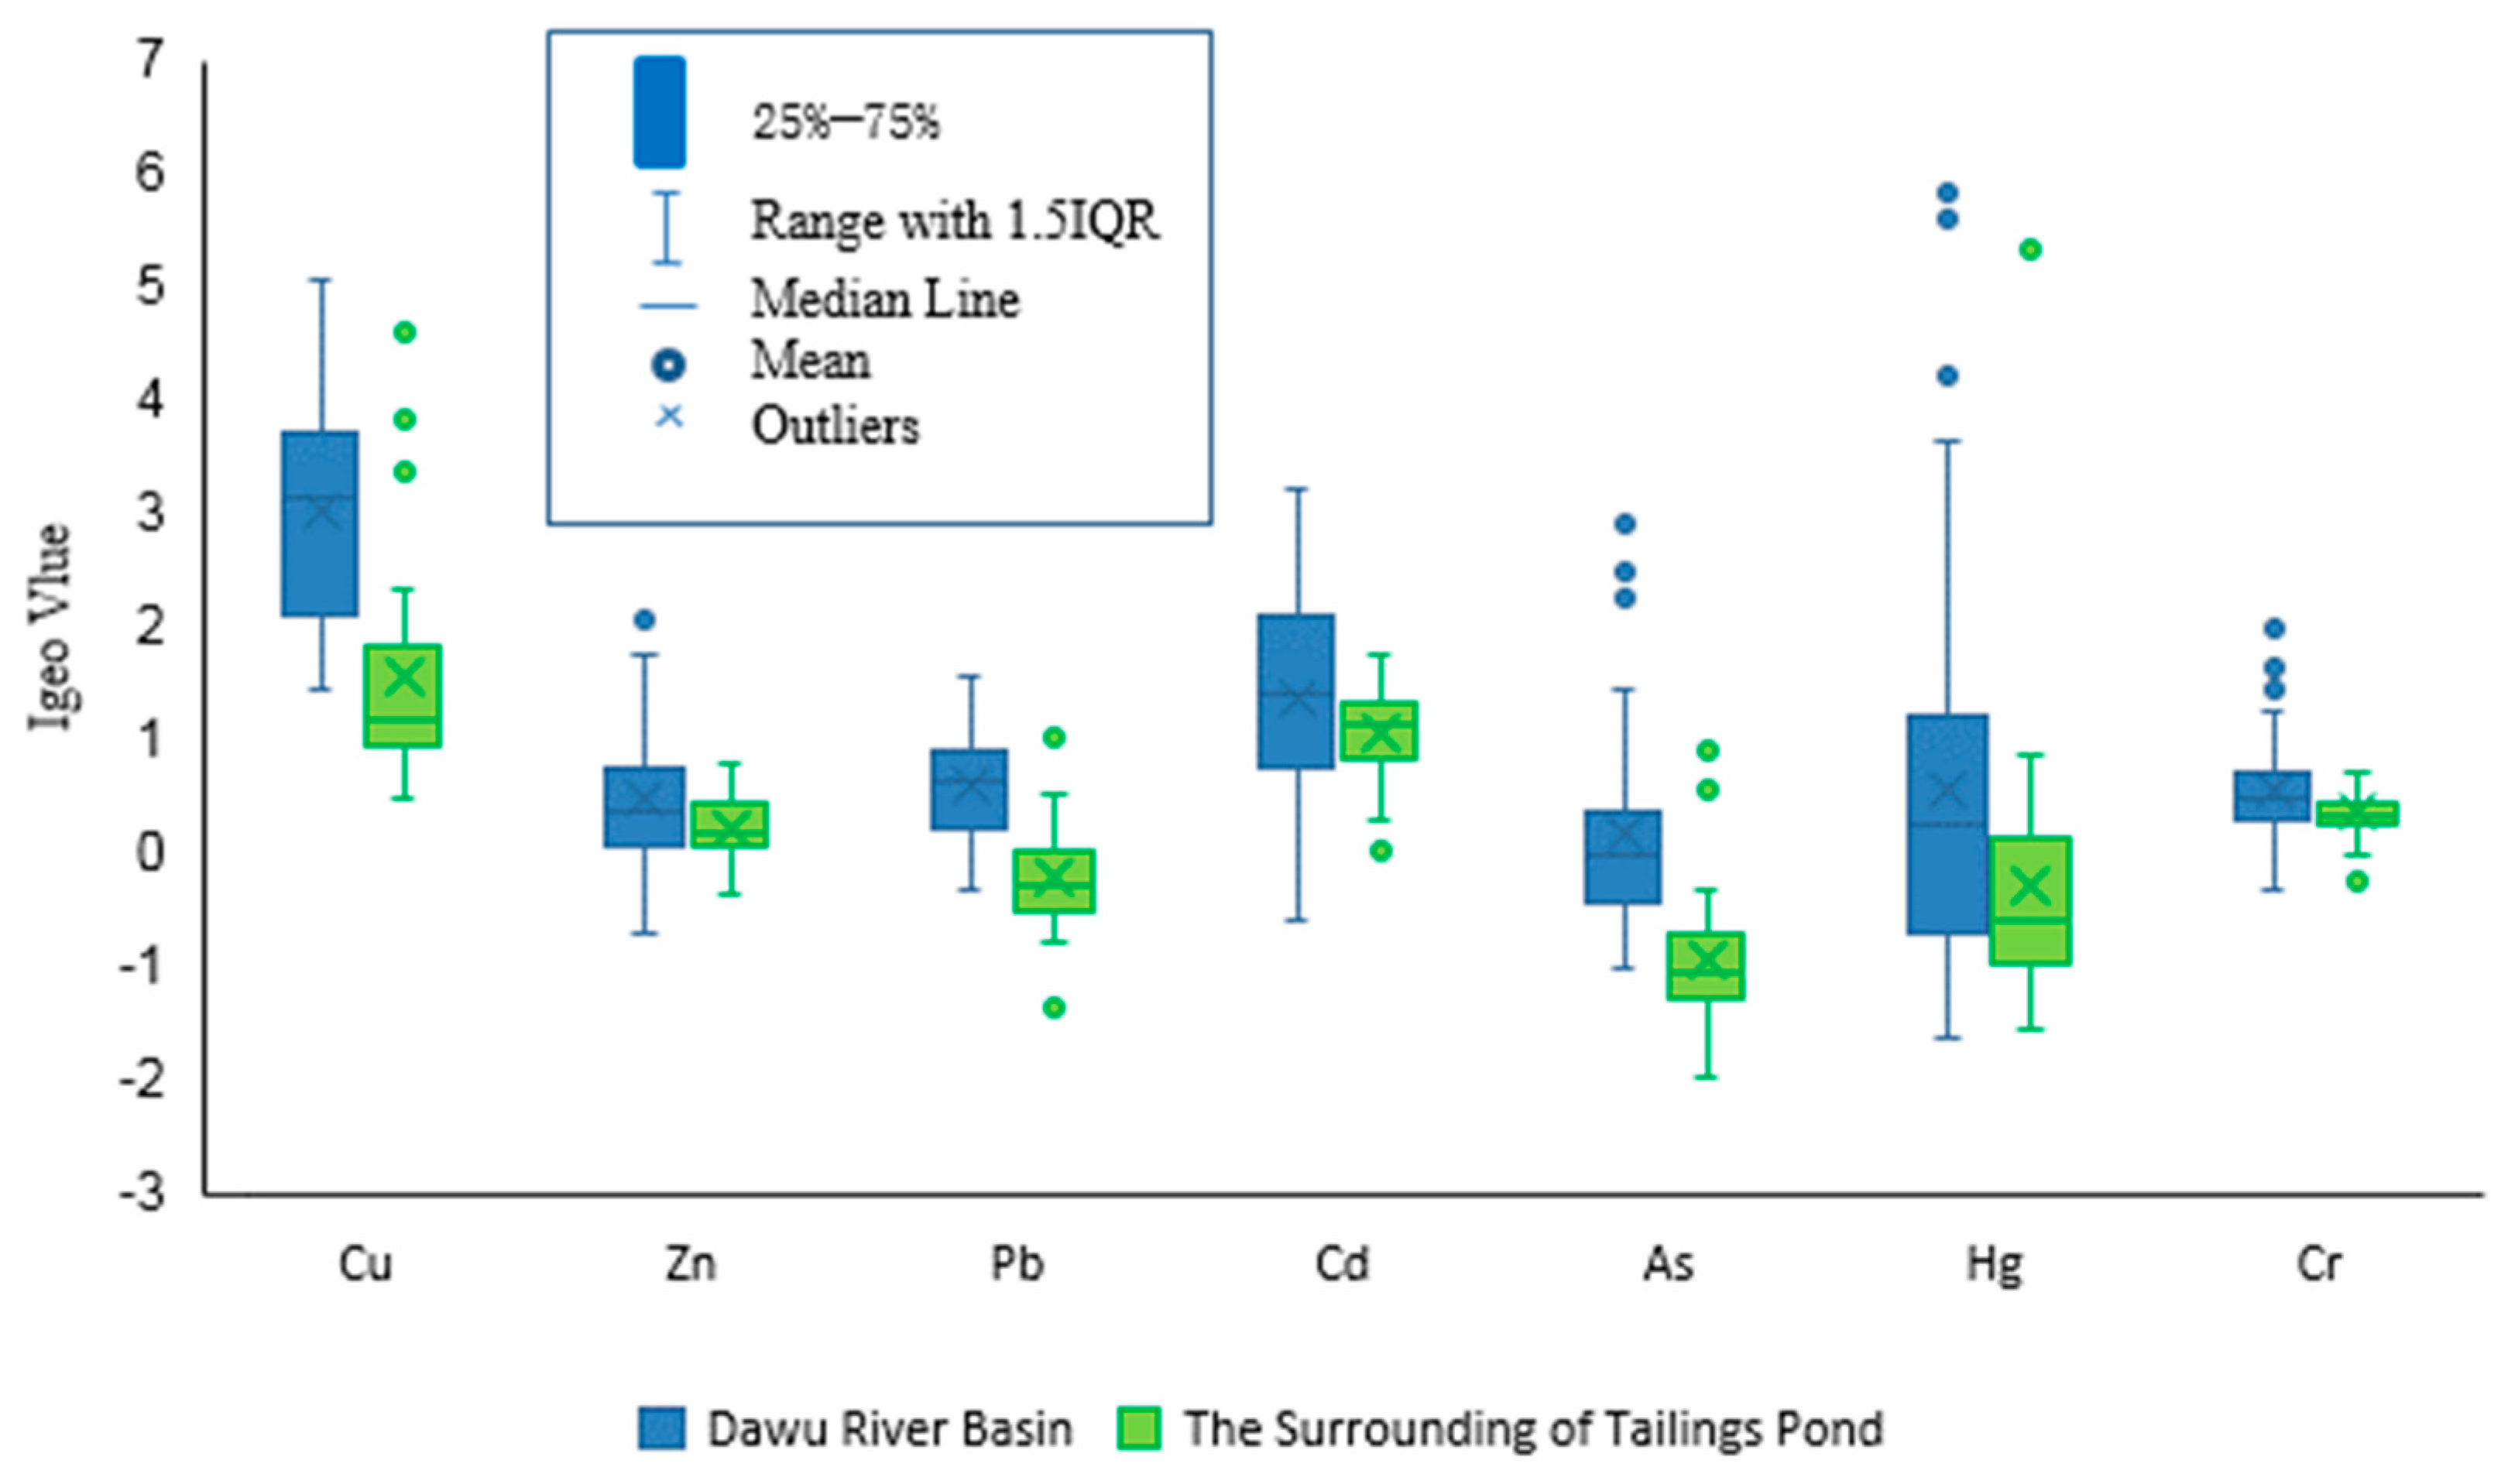
The pollution levels of soil pollution in Dawu River basin were higher than that in the tailings pond downstream (
Figure 5). The soil I
geo values showed that no matter the mean value, median value or maximum value, the concentrations of each heavy metal in the soil of Dawu River basin were greater than that in the tailings pond downstream. RSVCAL was as the standard, the exceeding standard rates of Cu, Zn, Pb, Cd, As, Hg and Cr in the soil from the Dawu River basin were higher than those from the tailings pond downstream. The exceeding standard rates of Cu in soil samples from the Dawu River basin reached 100%, while that from the tailings pond downstream reached 90%. The exceeding standard rate of Cd in soil samples from Dawu River basin were close to that from tailings pond downstream, which were 70.69% and 67.74%, respectively. The exceeding standard rate of Pb in soil samples from Dawu River basin reached 50%, and that from tailings pond downstream was only 3.23%. The exceeding standard rates of Zn, As and Cr were more than 10%, and that of Hg was 5.17% in soil samples from Dawu River. The exceeding standard rates of As and Hg soil samples were 3.23%, respectively, while Zn and Cr concentrations did not exceed RSVCAL in soil from tailings pond downstream.
According to Igeo and RSVCAL, the soil in the Dawu River basin and the tailings pond downstream were polluted by heavy metals to some extent, especially Cu pollution of soil was the most serious. RSVCAL refers to if the pollutant concentration in agricultural land soil is equal to or lower than RSVCAL, the risk to the quality and safety of agricultural products, crop growth or soil ecological environment is low and can be ignored generally; if the value exceeds RSVCAL, there may be risks to the quality and safety of agricultural products, crop growth or soil ecological environment. Heavy metal concentrations exceeding RSVCAL have threatened the safety of agricultural products; therefore, soil environment monitoring and agricultural product collaborative monitoring should be strengthened.
4.2.2. Changes of Heavy Metals Concentration in Soil Profile
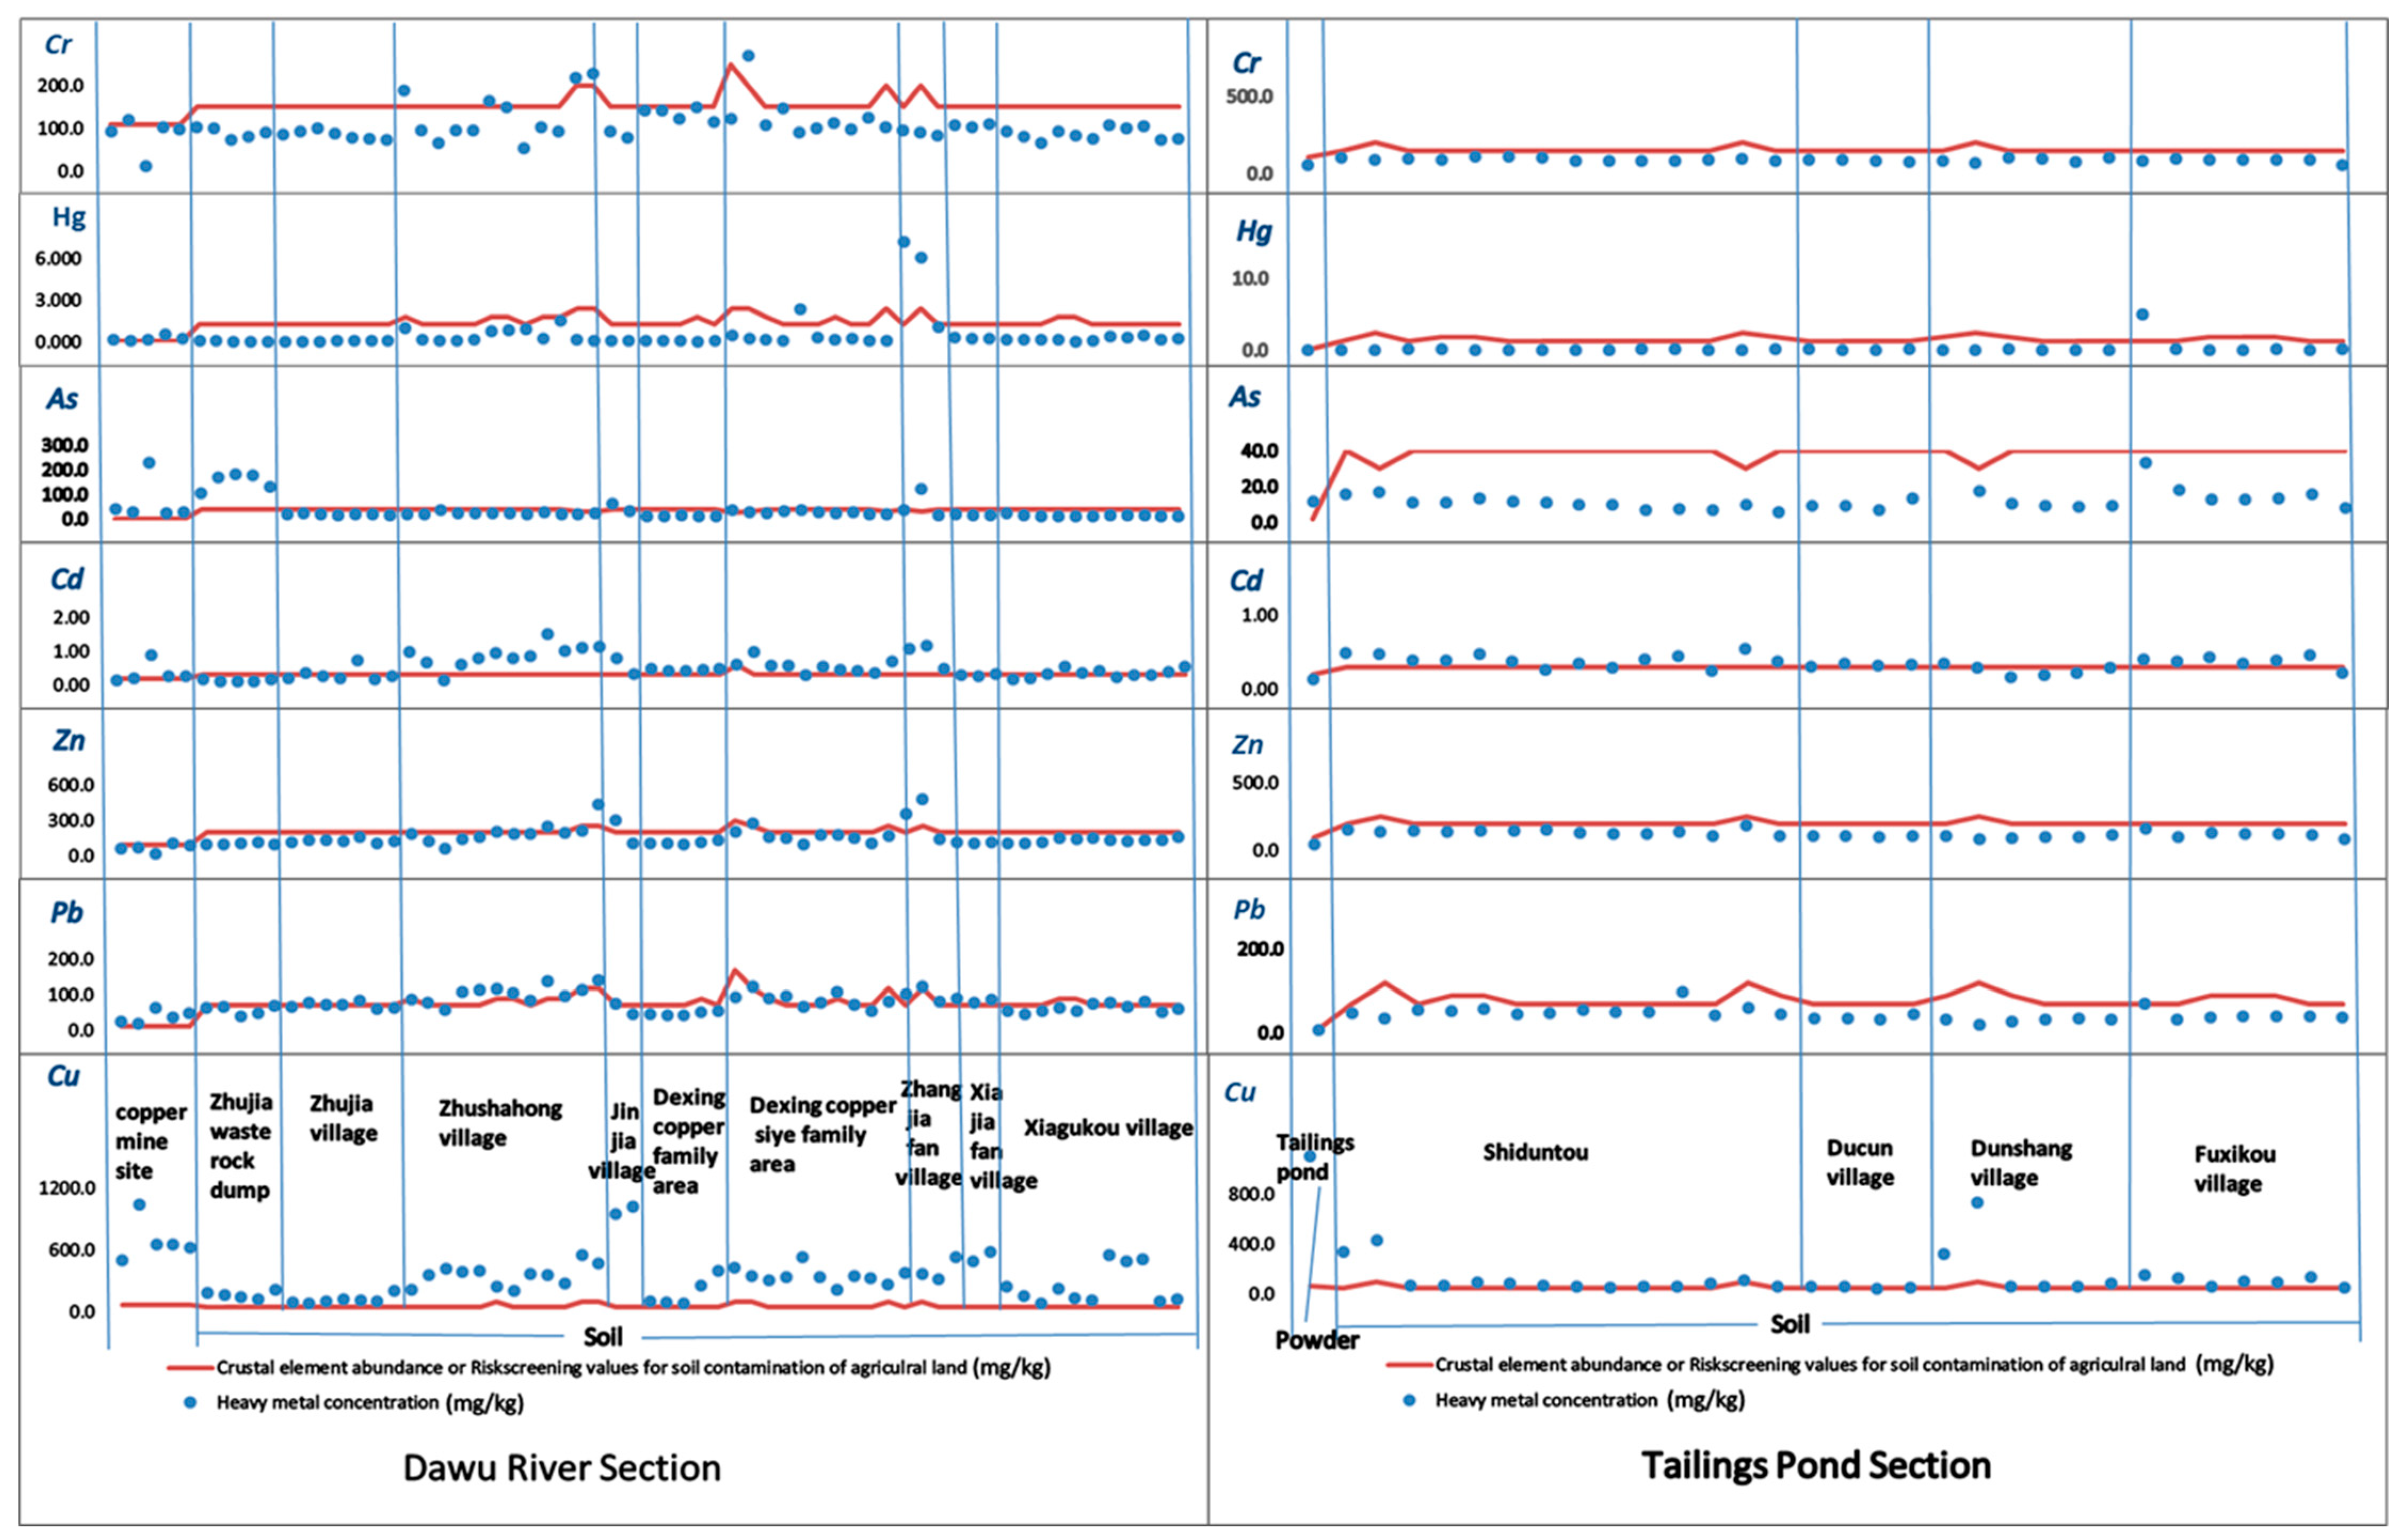
Shown as in
Figure 1, the Dawu River basin profile and tailings pond downstream profile were selected and compared from near to far according to the distance from copper mining site and tailings pond.
- (1)
The Dawu River basin profile
The Dawu River basin section is a successful copper mining site—Zhujia waste rock dump-Zhujia Village-Zhushahong Village-Jinjia Village-Dexing copper hospital-Zhangjiafan Village-Xiajiafan Village-Xiagukou Village. As shown in
Figure 6, the Cu concentration of waste rock in the mining site was the highest, but the Cu concentrations of soils in the Zhujia Village Waste Dump and Zhujia Village near copper mining site were the lowest. From Zhujia waste rock dump, the Cu concentration did not reflect the trend of decreasing Cu concentration from near to far. Cd concentration was higher in copper mining sites and the midstream of Dawu River than that in the upstream and downstream. The Pb, Zn, Hg and Cr concentrations were generally lower in the mining area than other areas. In the waste dump and Zhujia Village near the mining site were generally lower than those in the downstream of Dawu River. This may be due to the fact that the sampling points in the waste rock dump and Zhujia Village were far away from the Dawu River, while other sampling points were near the Dawu River. The As concentrations were higher in the mining site and the waste dump than in other villages.
The results of Dawu River section showed that the concentration of Cu was the highest in the rocks of the mining site, but it did not show regular changes in the soil section. The concentrations of Cd, Pb, Zn, As, Hg and Cr did not show that the rock concentrations in the mining site were higher than other in the soil.
- (2)
Tailings pond downstream profile
The profile of tailings pond was successively tailings pond—Shiduntou Village-Du Village-Dunshang Village-Fuxikou Village. The Cu concentration in tailings pond was the highest, the Cu concentration in the Shiduntou soil near tailings pond was next. The Cu concentration in Dunshang Village occurred abnormally high values. The Cd, Pb, Zn, As, Hg and Cr concentrations in tailing sand was lower than that in the soil from tailings pond downstream.
- 2.
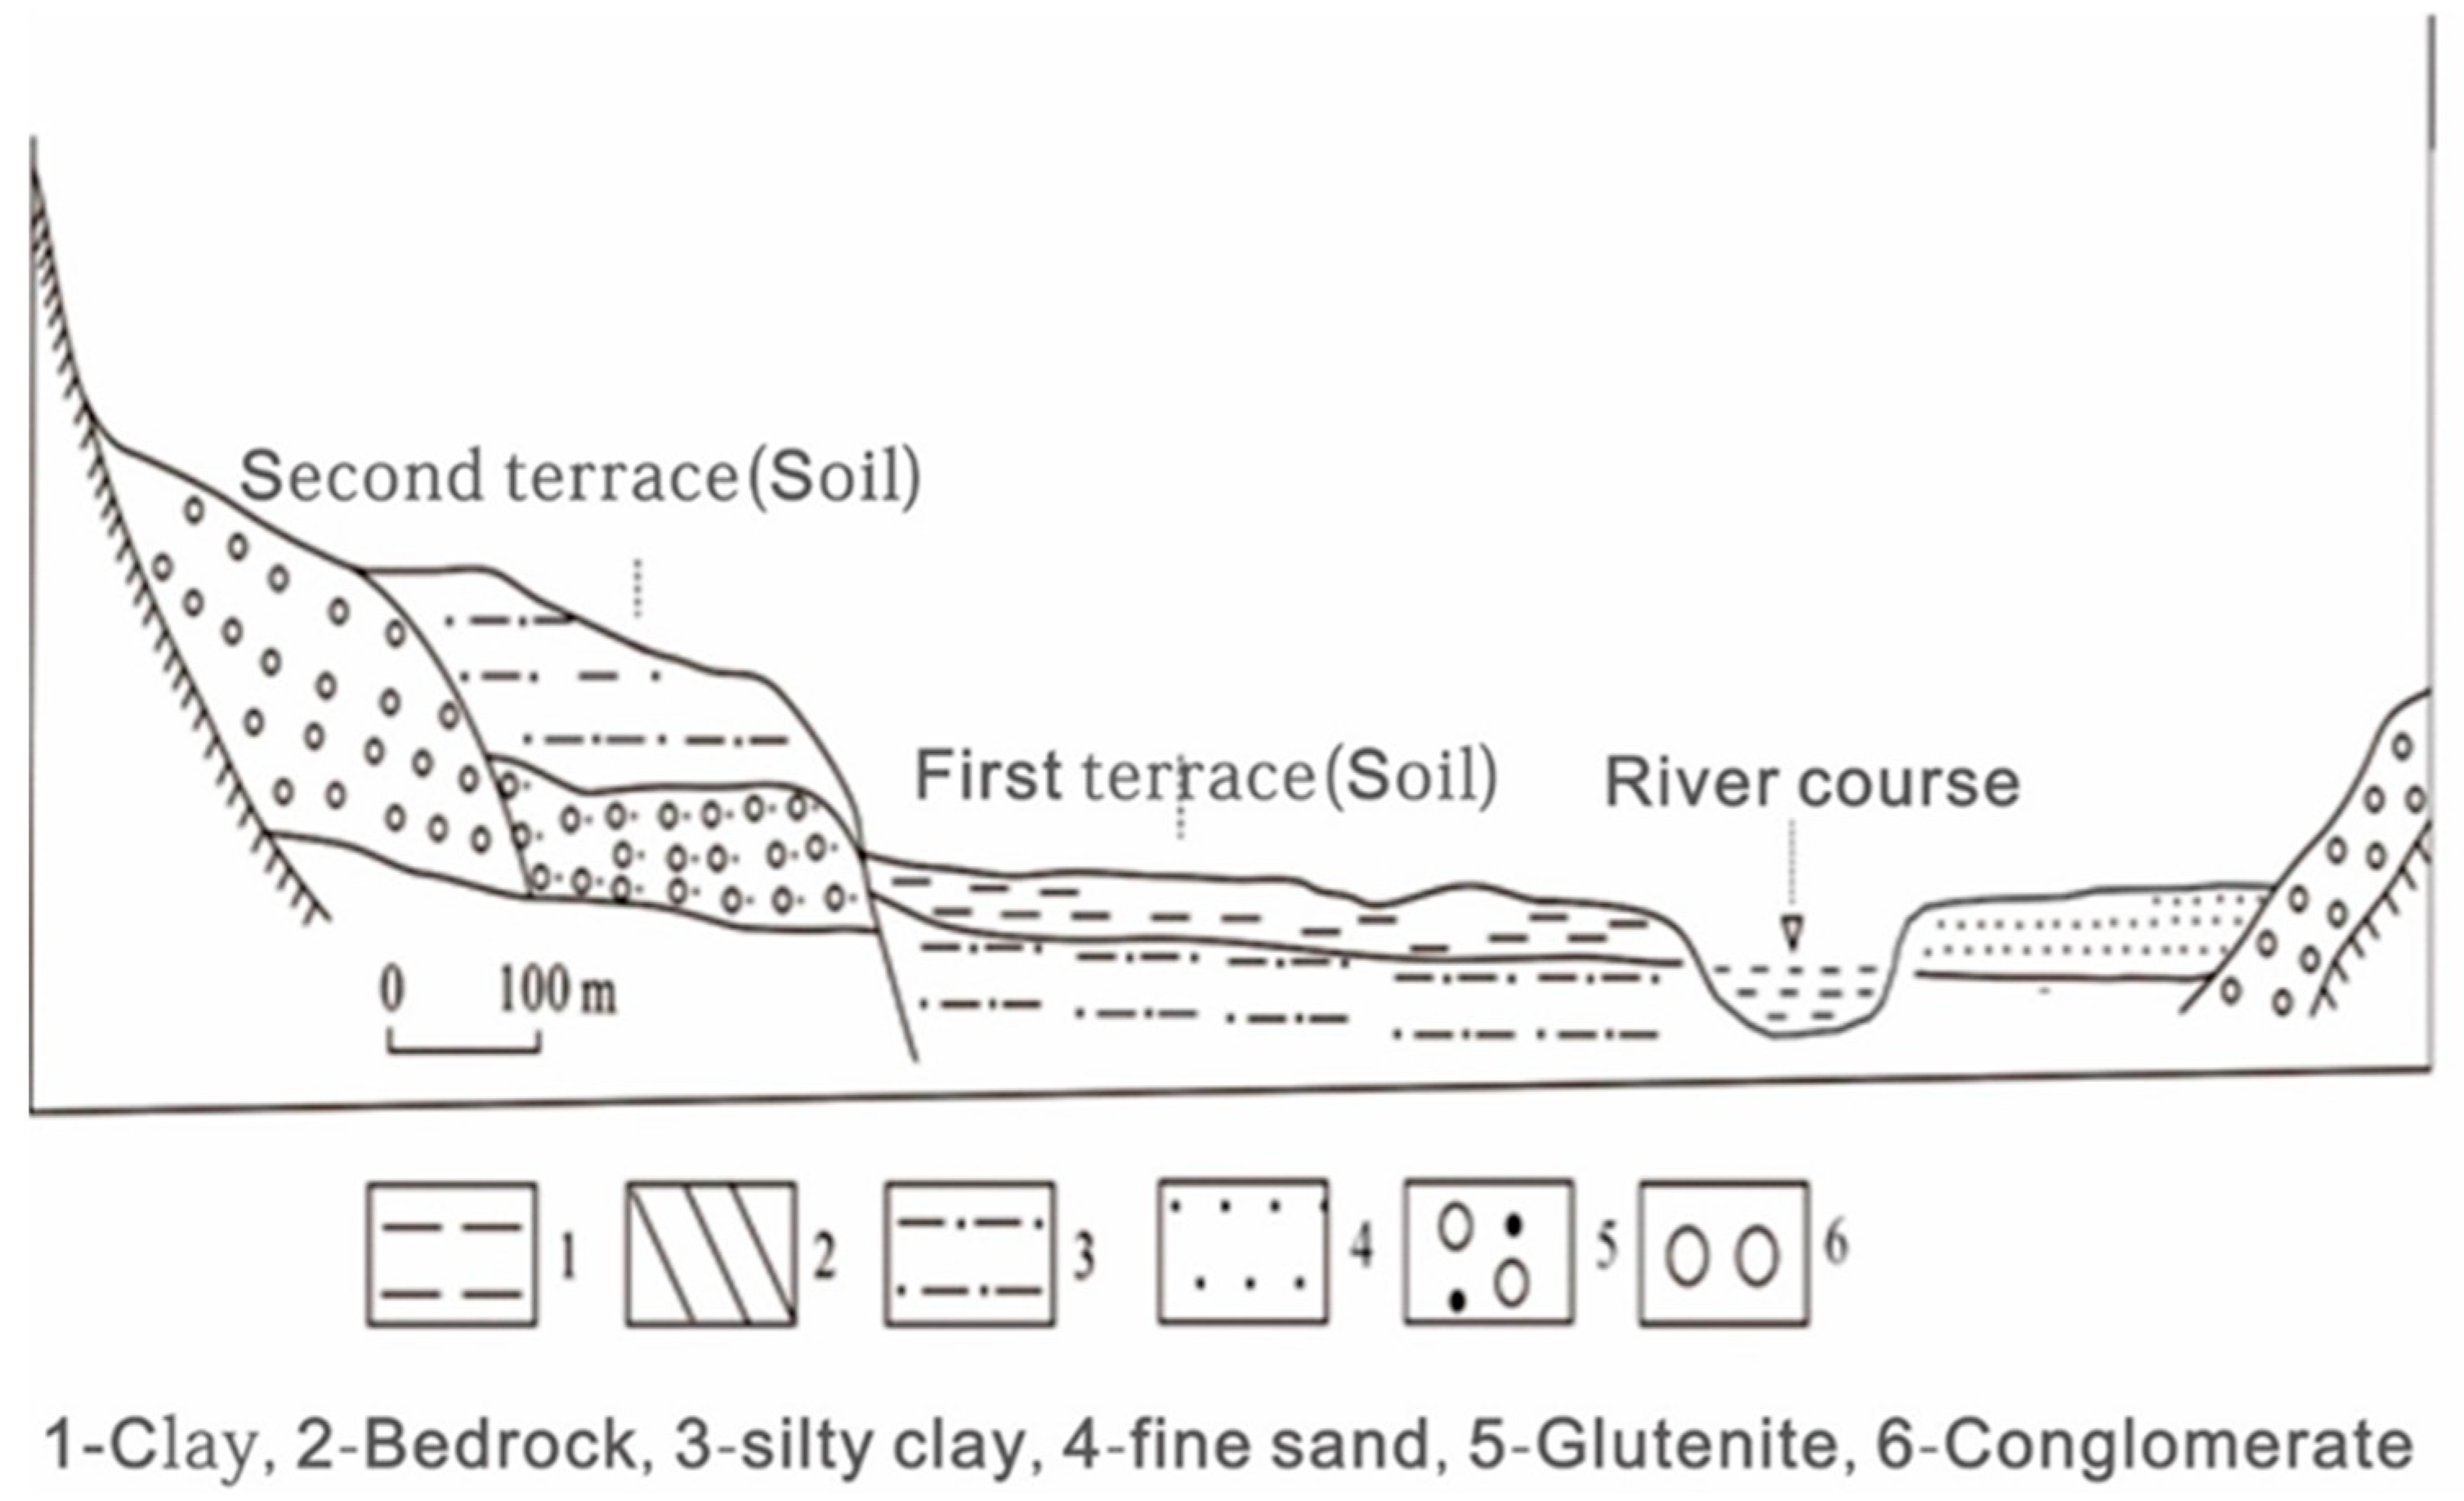
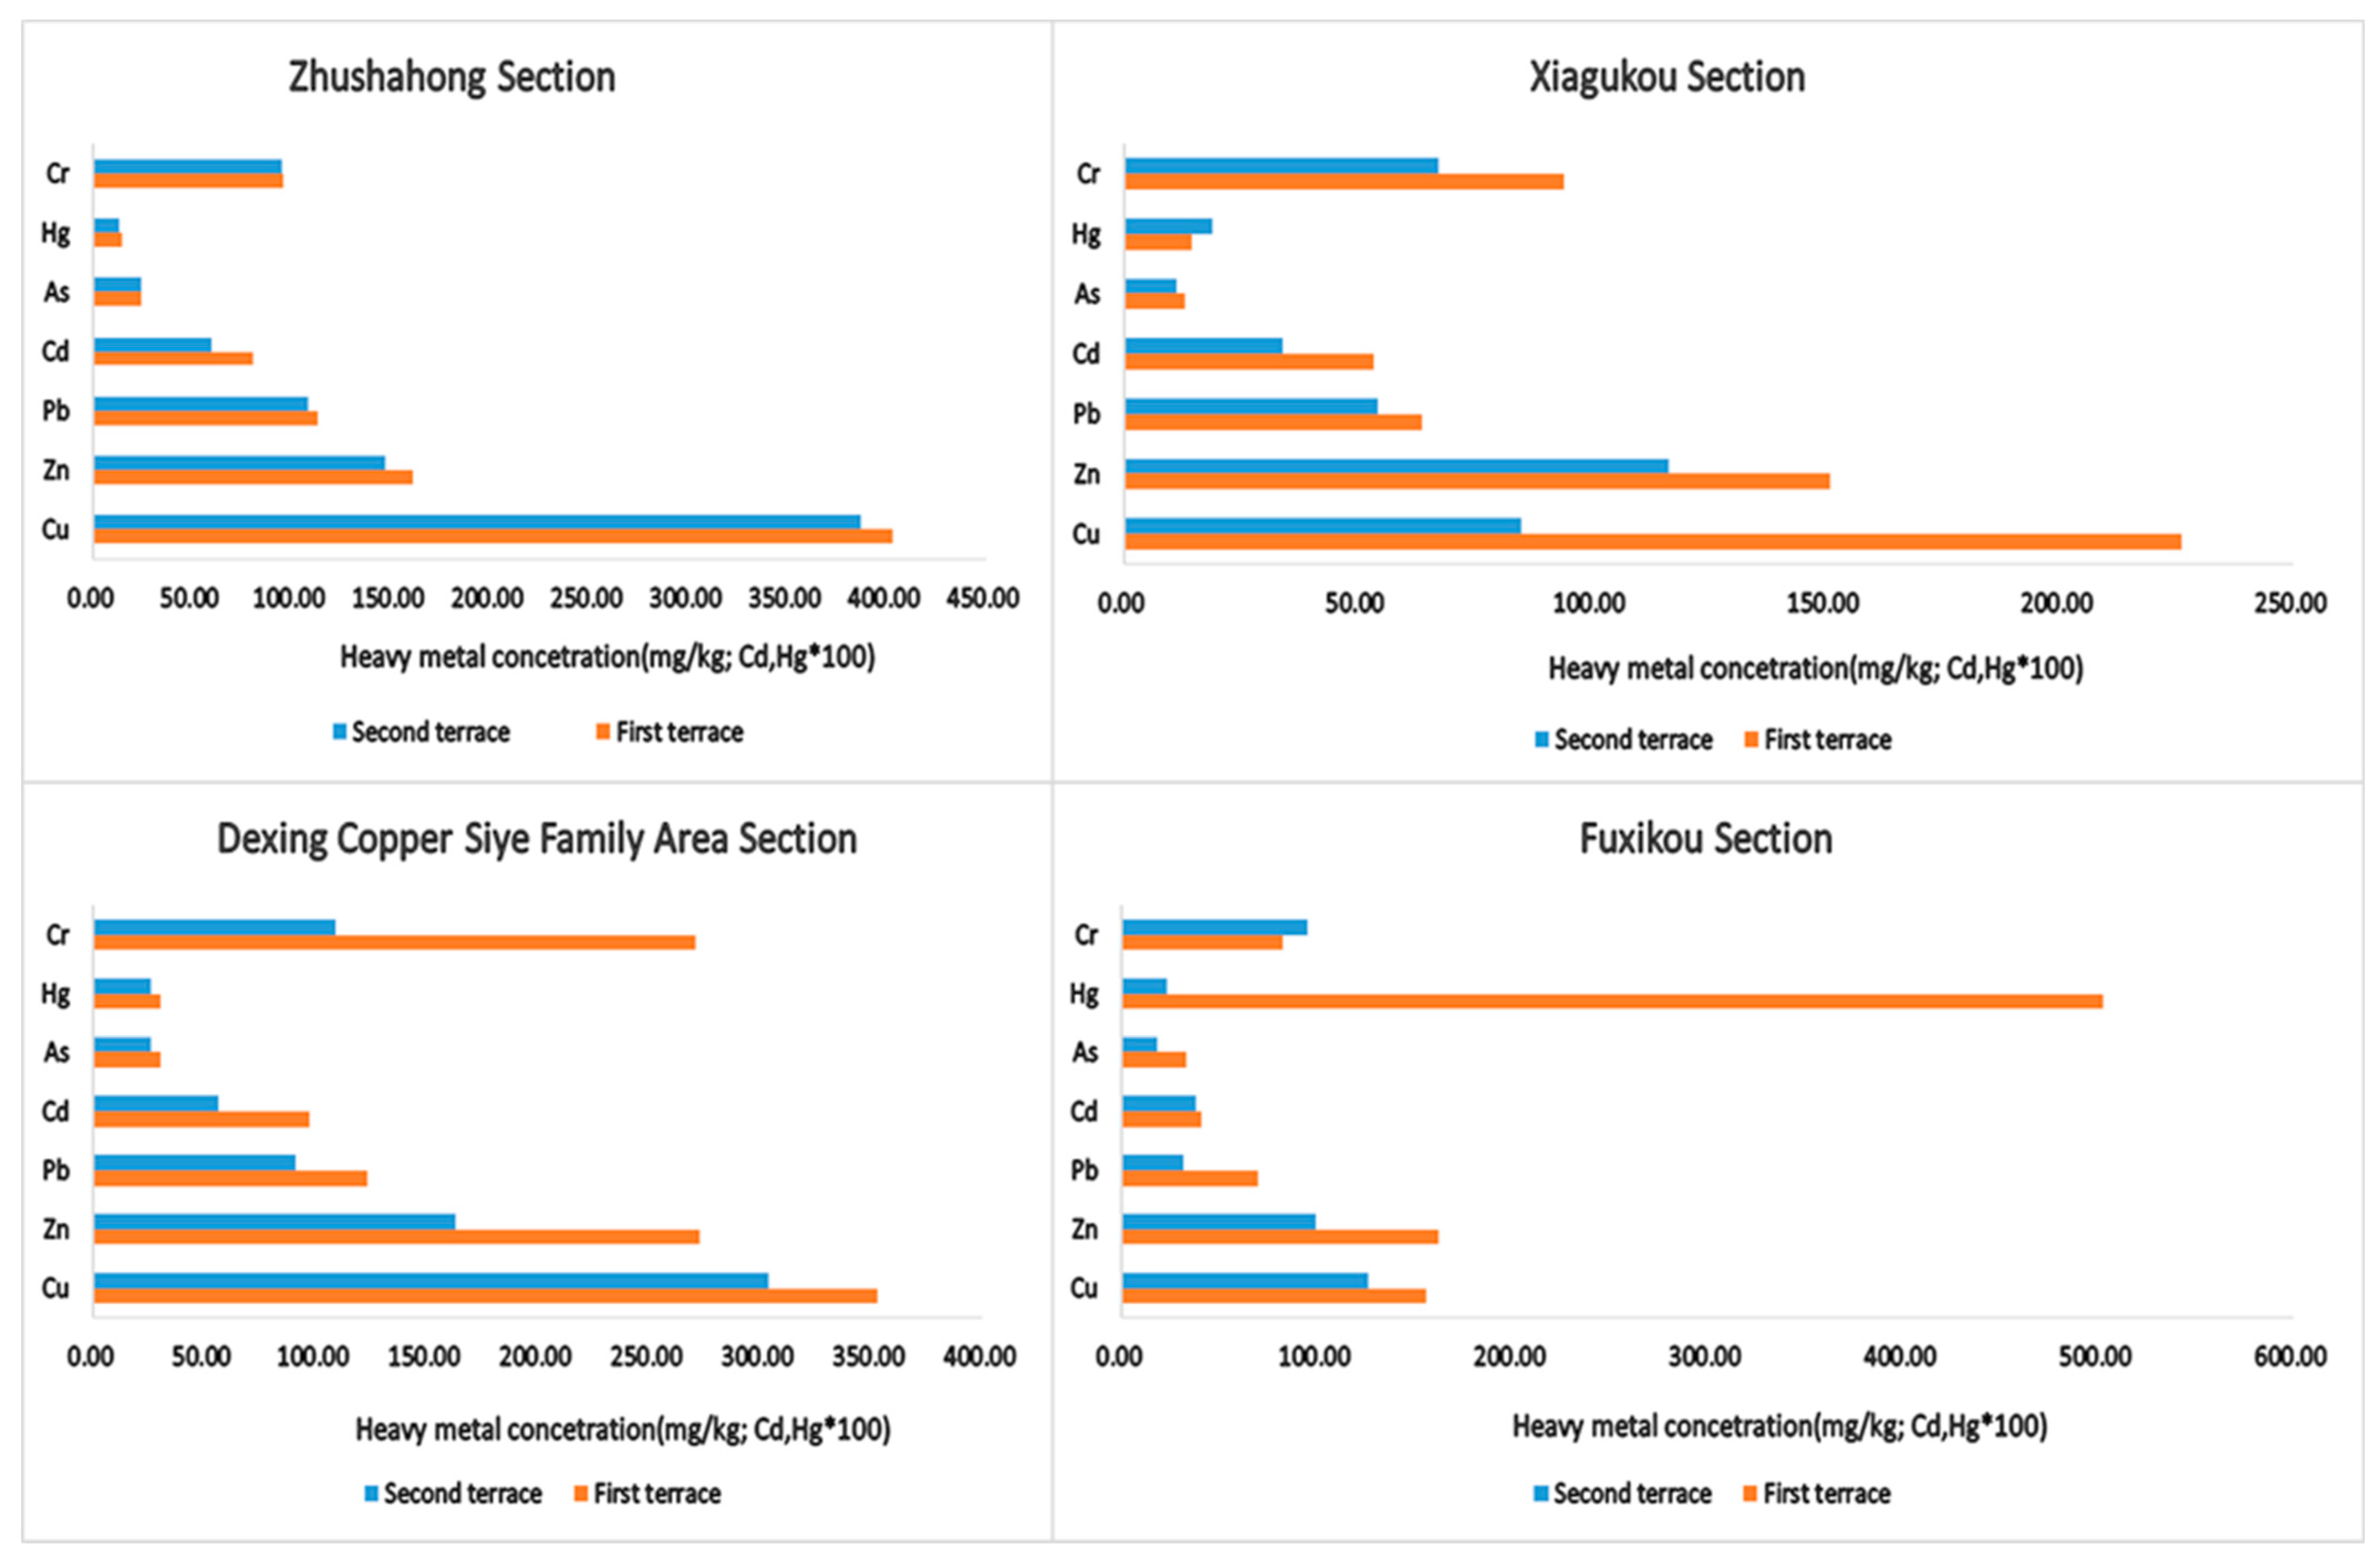
Change of heavy metals concentration in soil transverse terrace profile
Four transverse terrace profiles of Zhushahong village, Dexing copper site family area profile, Xiagukou village and Fuxikou village were selected. The profiles of Zhushahong Village, Dexing copper site family area profile and Xiagukou Village were the profiles of Dawu River terrace. The section of Fuxikou Village was the section of tailings pond downstream. The first terrace referred to the land close to the river with low terrain, while the second terrace was higher than the first terrace and far away from the river (
Figure 7).
The concentrations of Cu, Cd, Pb, Zn, As, Hg and Cr in the soil of the first terrace were compared with the second terrace. As shown in the
Figure 8, the concentrations of Cu, Cd, Pb, Zn, As and Cr of the first terrace were higher than that of the second terrace in four profiles. The concentration of Hg of the first terrace was higher than that of the second terrace, except for Xiagukou profile.
The concentration of heavy metal increased in each profile generally from the first terrace to the second terrace, reflecting that river water was an important source of heavy metals in the soil. The Dawu River flowing through the profiles of Zhushahong Village, Dexing copper siye family area profile and Xiagukou Village is the drainage river of Dexing Copper Mine. The Fuxi River flowing through the profile of Fuxikou Village is connected with 4# Tailings Pond small stream. To a large extent, this means that the concentration of heavy metals in the soil beside the river were affected by the development of copper mine.
4.3. Discussion on the Source of Heavy Metal Pollution in Soil around Dexing Copper Mine
The Cu concentrations in waste rocks and tailing sand were highest in the Dawu River profile and the tailings pond downstream, and the concentrations of Cu, Cd, Pb, Zn, As and Cr of the first terrace in four profiles were higher than that of the second terrace. All results point to that the development of Dexing Copper Mine may be the source of Cu pollution in the soil. Except Cu, the other heavy metal of Cd, Pb, Zn, As, Hg and Cr did not show significant high values in waste rocks and tailing sand. Principal component analysis (PCA) and cluster analysis (CA) were performed with SPSS 16 to explore the sources of heavy metals in soils. This study discussed the impact of mine development on the distribution of heavy metals in soil, and deeply analyzed the possible sources of heavy metals in soil.
A total of 79 soil and sediment samples were selected for principal component analysis and cluster analysis in the Dawu River basin. This is because the principal component analysis showed that the common factor variance extraction of 58 soil samples Cu concentration in Dawu River basin was only 0.139, and the principal component analysis could not reflect the soil Cu information. The common factor variance extraction of 79 soil and sediment samples for Cu concentration in Dawu River basin reached 0.898 (
Table 4), the principal component analysis could reflect most of the information of Cu. KMO index and Bartlett value of soil and sediment heavy metal concentration data in Dawu River basin were 0.718 and 0.000, respectively, which indicated that principal component analysis could be applied. In the tailings pond downstream, only 31 soil samples were selected, no sediment, and the common factor variance extractions of the soil samples heavy metal concentrations were above 0.5, which could reflect the information of heavy metals (
Table 4). The KMO index and Bartlett value of the soil heavy metal concentration data were 0.541 and 0.000, respectively, which indicated that principal component analysis could be applied. In the interpretations of PCA patterns, factor loadings greater than 0.71 are typically considered excellent, while those less than 0.32 are regarded as meaningless [
35,
36].
As shown in
Table 5, three principal components, extracted from the variables with eigenvalues > 1, were retained for further analysis which accounted for 75.21% of the total variance of the data in Dawu River basin.
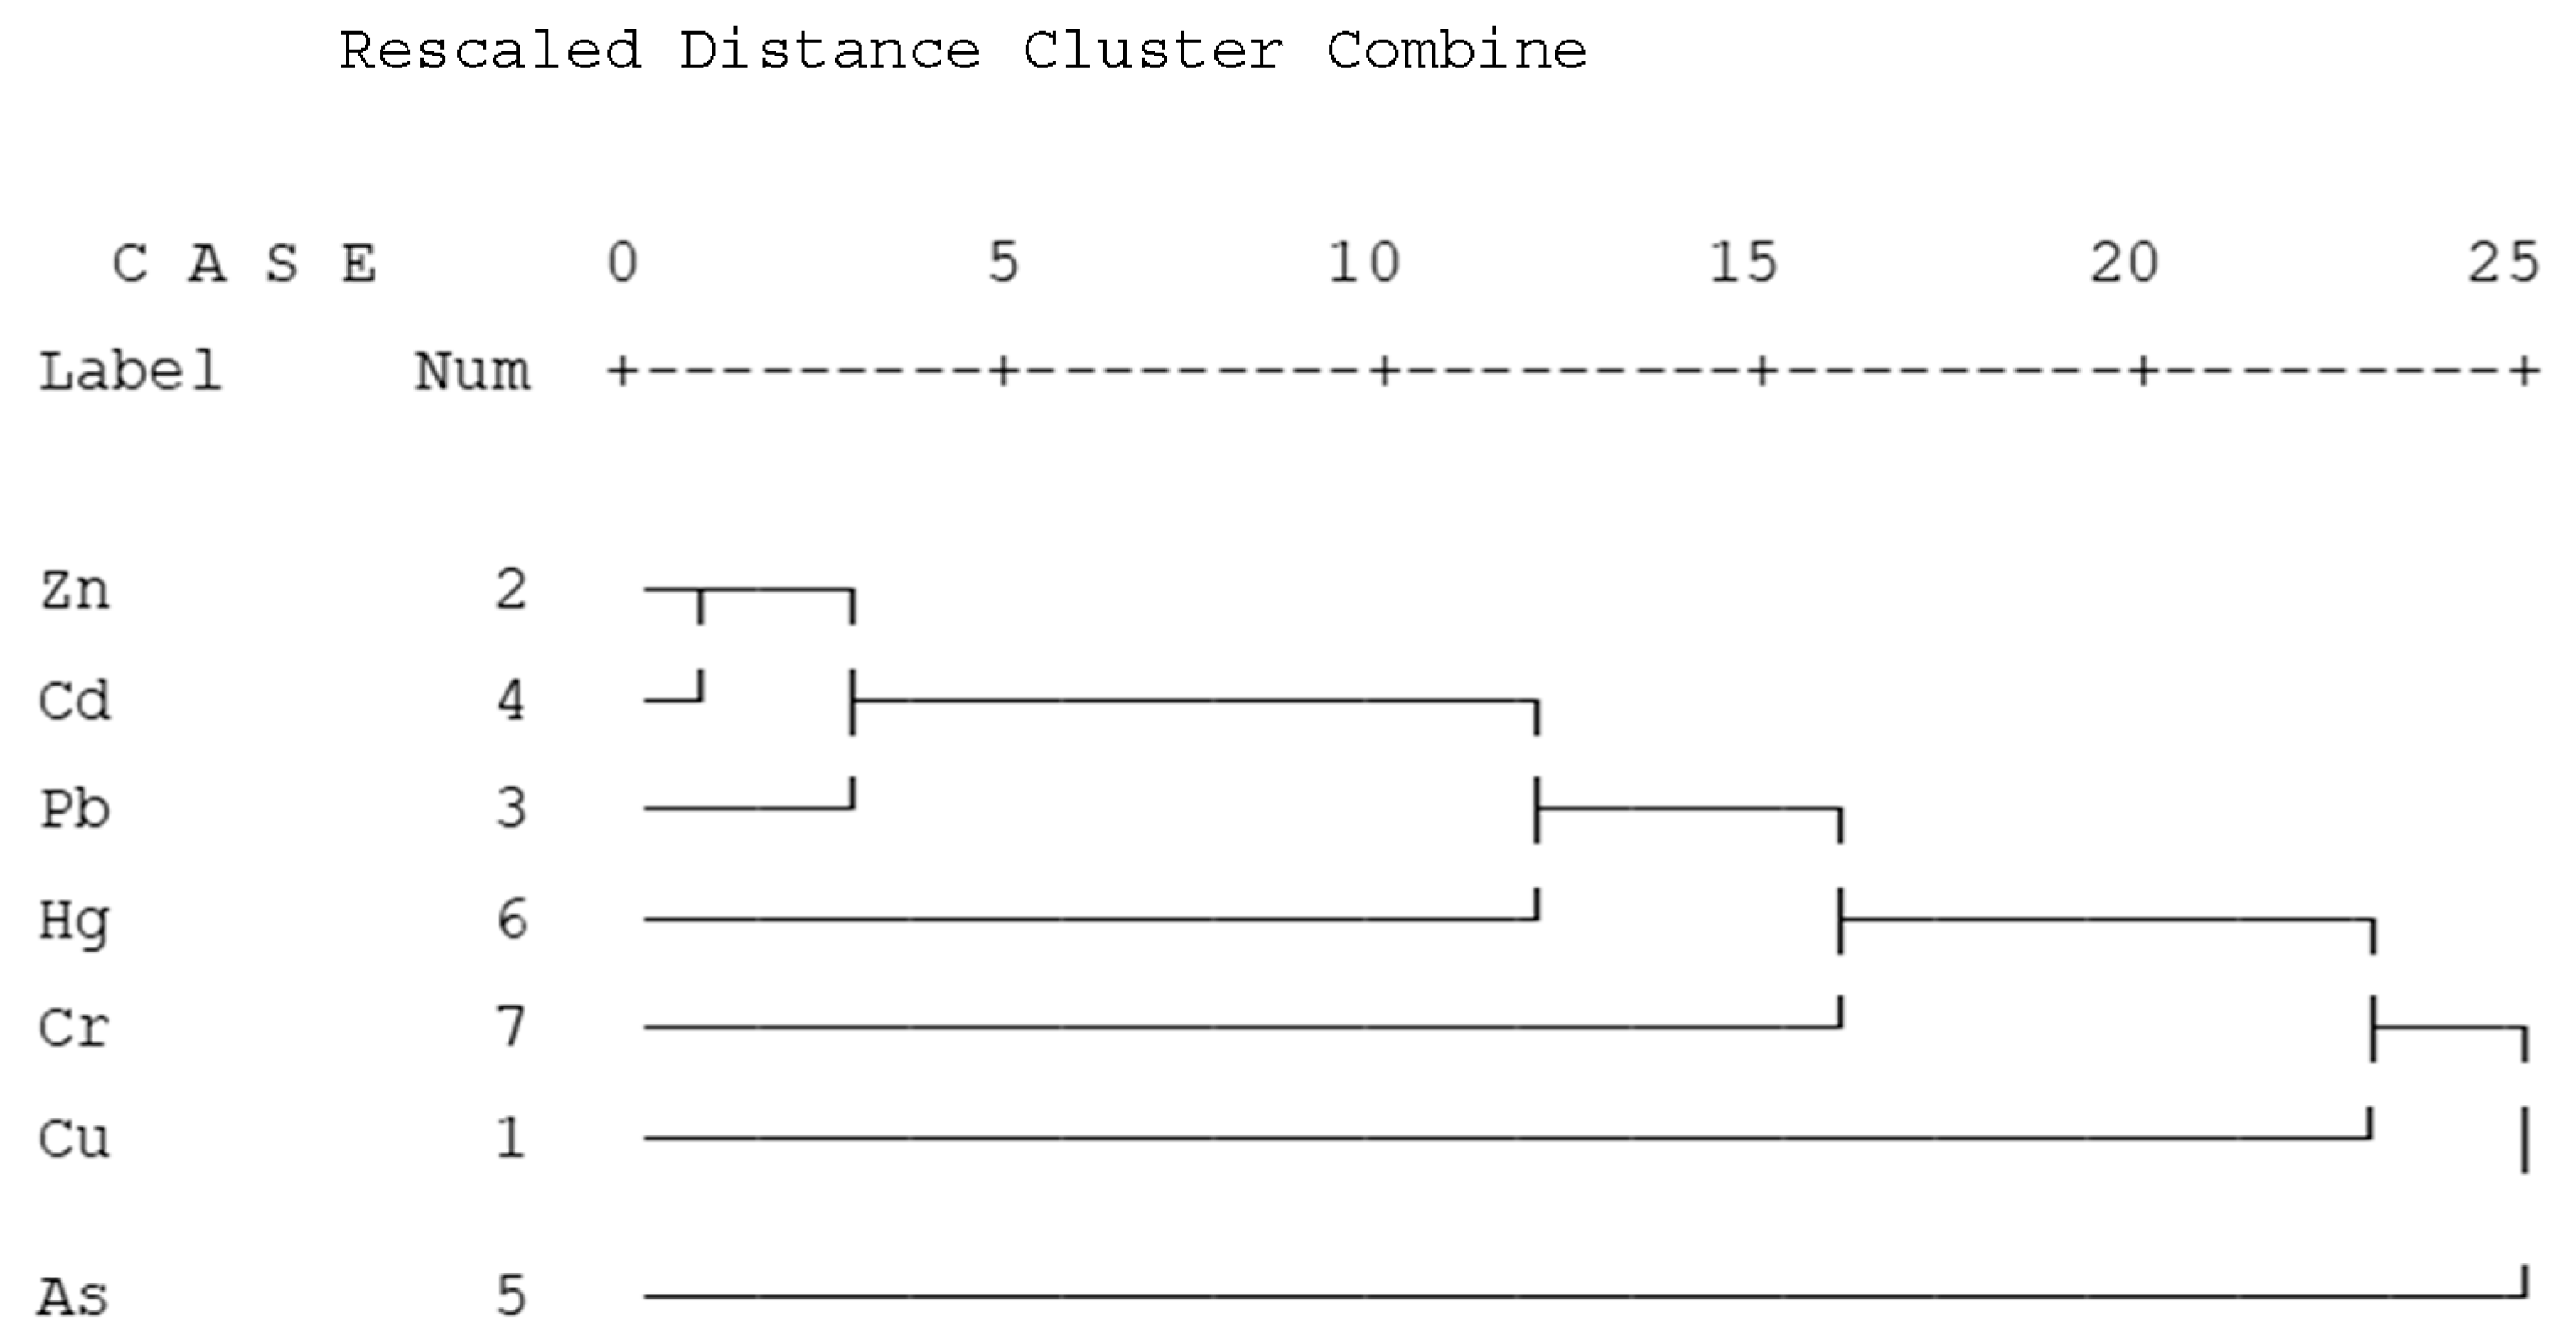
Factor 1 consisted of high significant positive loadings of Zn, Pb, Cd, Hg and Cr, which accounted for 42.72% of the total variance of the variables with an eigenvalue of 2.991. Factor 2 consisted of significant loadings of As, Hg and Cr, which accounted for 17.99% of the total variance of the variables with an eigenvalue of 1.258. Factor 3 consisted of significant positive loadings of Cu and As, which accounted for 14.51% of the total variance of the variables with an eigenvalue of 1.016. Soil heavy metal distribution can be affected by human activities severely [
37,
38]. The main factors of soil heavy metal pollution contained mineral development, industrial processing, sewage irrigation, fertilizer application, vehicle traffic, urban development, etc. [
39]. Factor 1 might be interpreted as representing influences from multiple factors, such as the vehicular exhaust from vehicle traffic, daily human activities, mining and smelting activities, because the Concentrations of Zn, Pb, Cd, Hg and Cr were lower in rocks of the mining site than in soil. Mining activity influence should account for a small part, and vehicle traffic and daily human activities (fertiliser application et al.) should be the major factors. In all Dawu River basin samples the Cu concentration in the rocks of the mining site was the highest, Cu concentration should be influenced mainly by Dexing copper development. Cu and As formed factor 3, As might be influenced by a mixed source of both Dexing copper development and human origin in agricultural soils. Cluster analysis (
Figure 9) reflected that Zn, Pb and Cd had a closer relationship than other heavy metals.
As shown in
Table 6, three principal components, extracted from the variables with eigenvalues >1, were retained for further analysis, which accounted for 78.95% of the total variance of the data in tailings pond downstream.
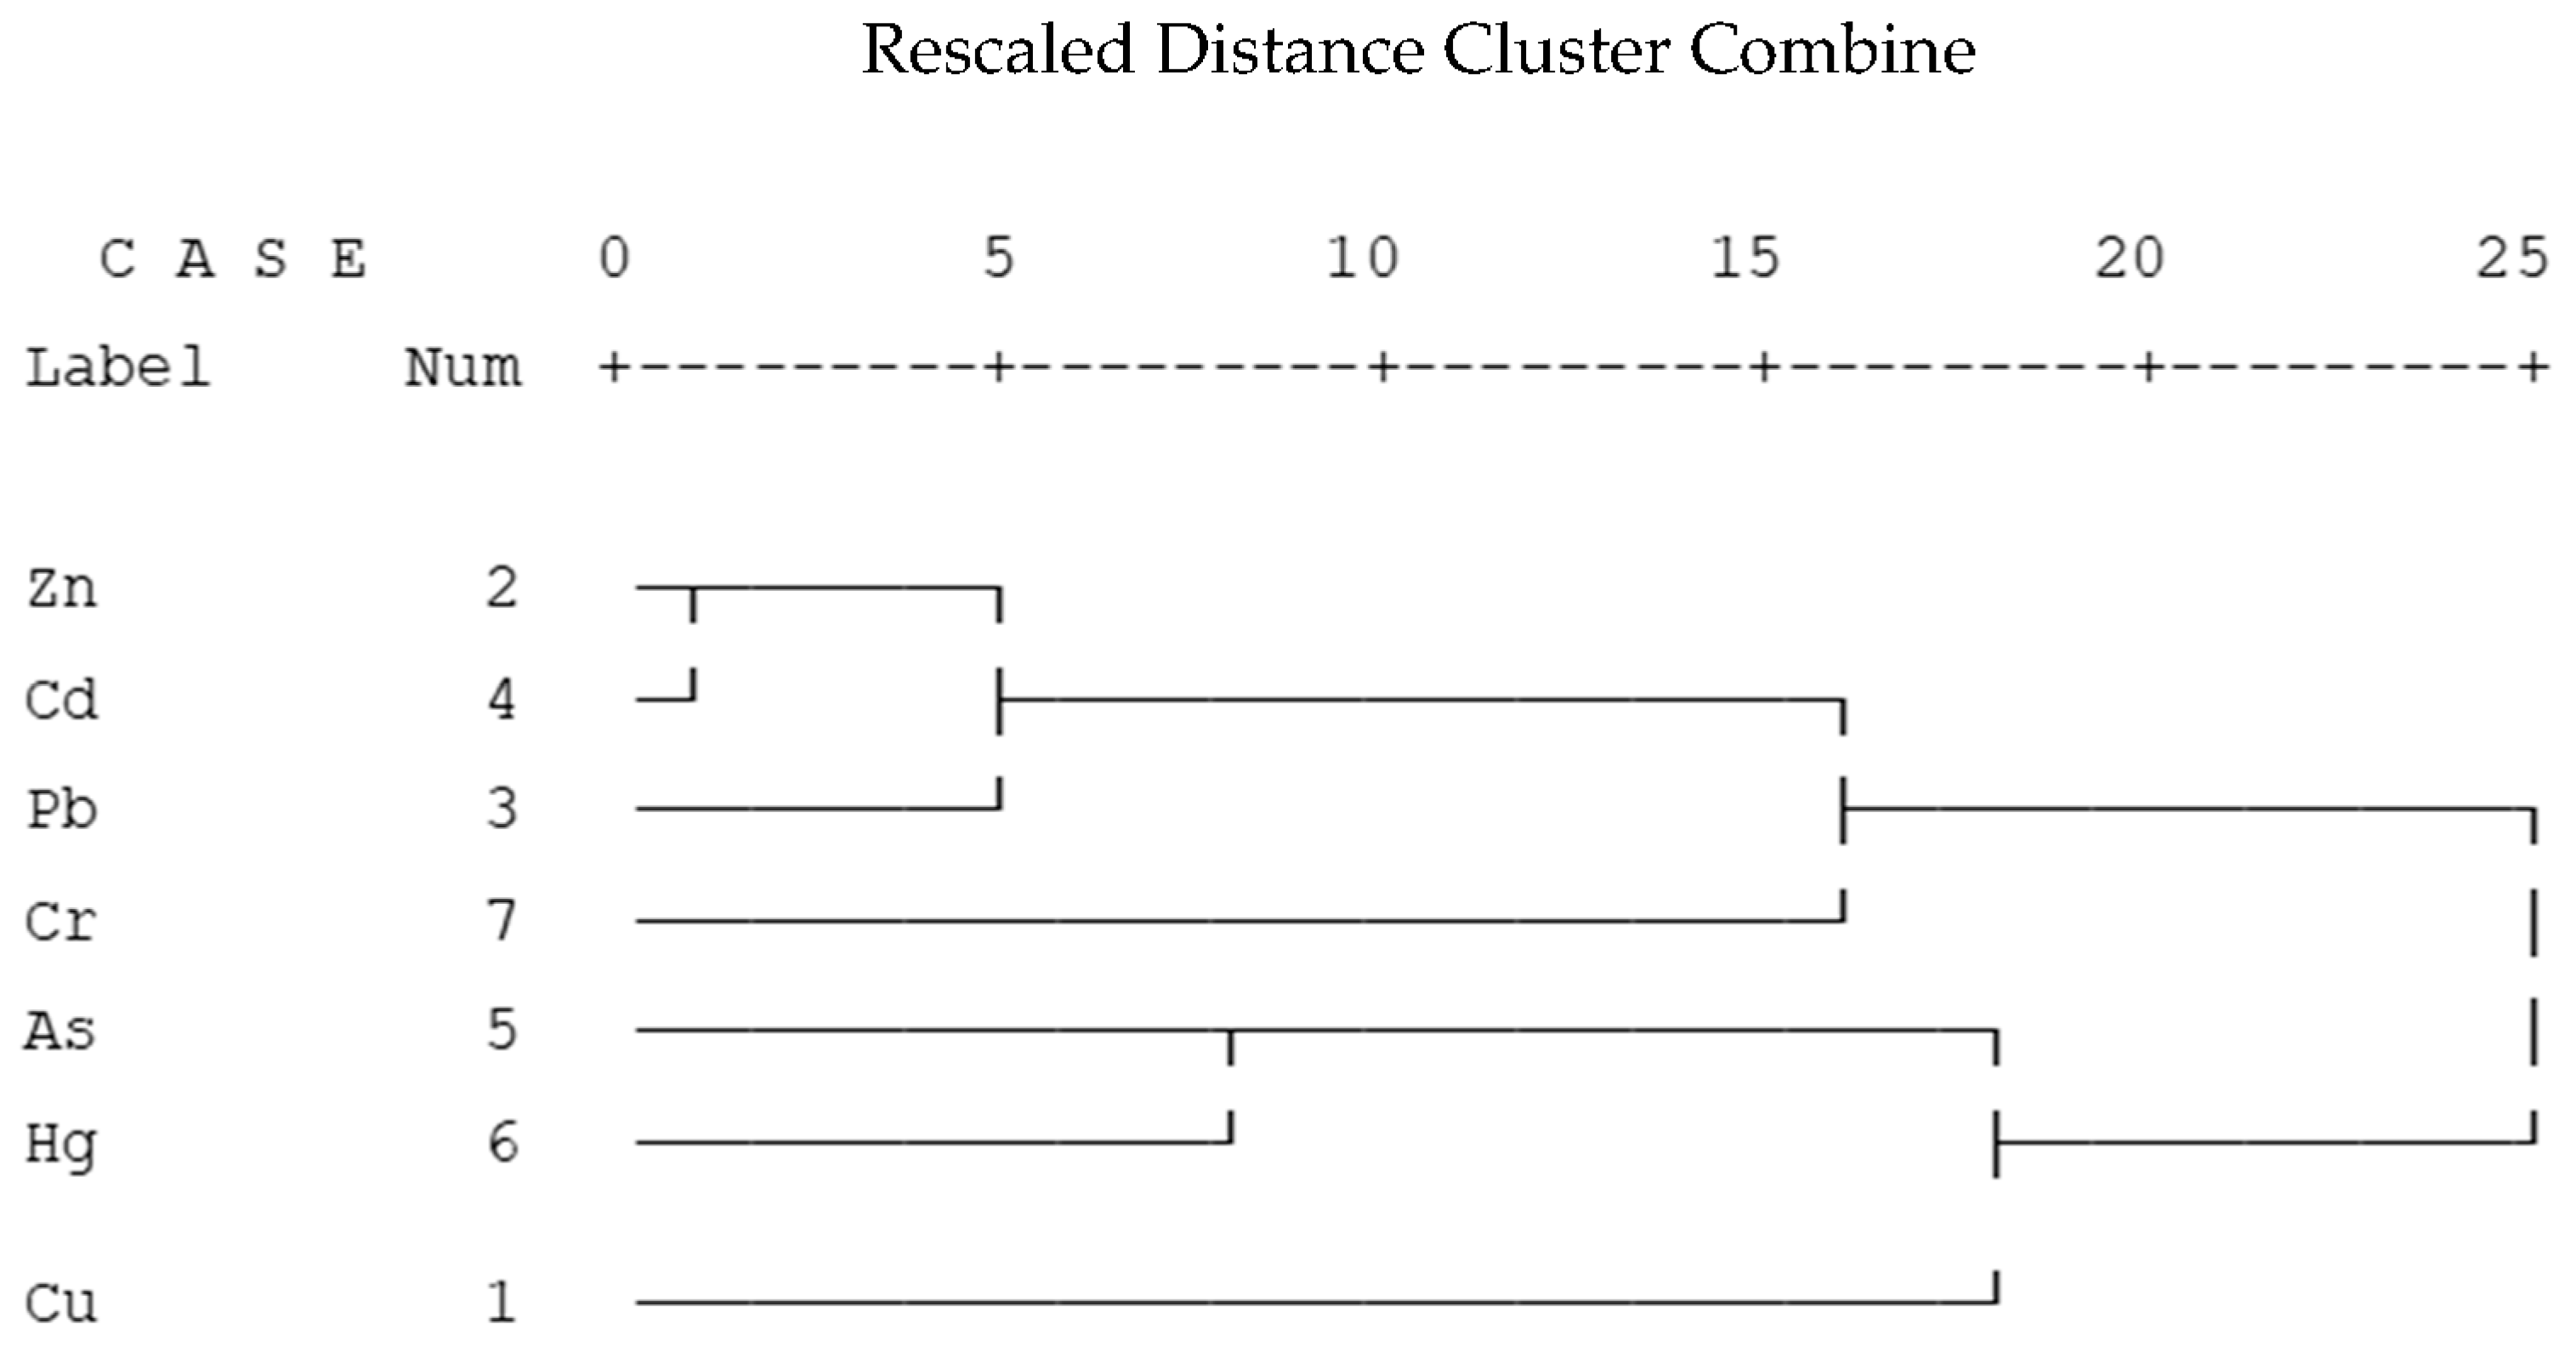
Factor 1 consisted of high significant positive loadings of Zn, Pb, Cd, Hg and Cr which accounted for 37.07% of the total variance of the variables with an eigenvalue of 2.595. Factor 2 consisted of significant positive loadings of Cu, As, Hg and Cr, which accounted for 25.088% of the total variance of the variables with an eigenvalue of 1.756. Factor 3 consisted of significant positive loadings of Cu, Pb, Cd, Hg and Cr, which accounted for 16.79% of the total variance of the variables with an eigenvalue of 1.016.
Principal Component Analysis of the tailings pond downstream dataset, compared with Dawu River basin dataset, showed that the components of factor 1 were similar, also reflected the influences on the concentration of Zn, Pb, Cd, Hg and Cr from multiple factors, such as the vehicular exhaust from vehicle traffic, daily human activities, mining and smelting activities, etc., with factor 2 and 3 containing Cu indicating the influences from copper mine development. The differences of factor 2 and 3 between the tailings pond downstream dataset and Dawu River basin dataset possibly reflect that the influences of heavy metal (Cu, Pb, Cd, Hg and Cr) pollution from mining were greater on the tailings pond downstream than on Dawu River basin. The results of the cluster analyses (
Figure 10) indicated that the relationships among different heavy metals.


