
Evaluating the Impact of COVID-19 on the Behaviour of Pedestrians


Department of Civil and Infrastructure Engineering, RMIT University, Melbourne, VIC 3000, Australia
*
Author to whom correspondence should be addressed.
Sustainability 2023, 15(3), 1874; https://0-doi-org.brum.beds.ac.uk/10.3390/su15031874
Submission received: 8 December 2022
/
Revised: 9 January 2023
/
Accepted: 13 January 2023
/
Published: 18 January 2023
(This article belongs to the Special Issue Impact of COVID-19 on Pedestrian Behavior, Road Safety and Sustainable Transportation)
Abstract
:The COVID-19 pandemic has considerably impacted pedestrians’ perceived comfort in a public setting. The virus’s transmissibility and social distancing restrictions have resulted in a shift in pedestrians’ perceived comfort, with more pedestrians becoming more conscious of other pedestrians and the distance between pedestrians. The changes in pedestrians’ perception have resulted in the Pedestrian Level Of Service (PLOS) models becoming outdated. The models may not accurately portray the actual status of pedestrians’ Level Of Service (LOS) according to the pedestrian needs during a pandemic, which generally lasts for a couple of years. These pandemics will happen in the future; hence, their impact on pedestrian comfort on sidewalks is worth considering. This research aims to analyse the effect of COVID-19 on PLOS by compiling data using a face-to-face questionnaire survey in the Melbourne Central Business District (CBD). From the 445 completed surveys, 72% of respondents extensively considered social distancing due to COVID-19 when commuting in the CBD, and 49% preferred a 1–1.5 m distance between pedestrians. In conjunction with an in-depth analysis of the data, an ordinal regression model has been used to analyse the factors that influence the perceived comfort of the pedestrians and estimate the PLOS. The model results show that pedestrian density, COVID-19 social distancing, continuous footpath, and pedestrian flow in opposite directions on the sidewalk greatly impacted the walking comfort of pedestrians during the pandemic.
1. Introduction
Walking and cycling are the active modes of transport that play a significant role in providing sustainable urban mobility [1]. To provide sustainable and green transportation for the city, the mayor of London proposed a strategy that 80% of the residents must travel within the inner city by walking, bicycle use, or public transport to reduce emissions and improve air quality [2]. The recent global pandemic that has resulted from the COVID-19 virus, which is airborne, has dramatically changed the overall cognition of pedestrian comfort while walking. With Melbourne, Victoria, exiting its final lockdown on 22 October 2021, it has been considered the world’s fourth most locked-down city. Australia’s repeated lockdown phases and COVID-19 restrictions have resulted in a significant shift in the perception of comfort in pedestrians and what people may perceive as socially distant and an invasion of personal space. Due to these changes in perception, there has been a shift in the Pedestrian Level Of Service (PLOS), and change in the factors affecting pedestrian comfort. Hence an updated analysis must be performed to assess the Level Of Service (LOS) and develop a suitable model to assess the PLOS during the COVID-19 pandemic which still has not been fully eradicated from the society.
PLOS is defined as the pedestrian perceived quality of comfort experienced by the pedestrians across all age groups and gender, while walking on a footpath with respect to location factors, user factors and physical or design factors, expressed on a scale of A to F, where A stands for the best and F stands for the worst experience of quality [3,4,5]. Jaskiewicz (2000) [6] has used a scale of 1 to 5 to describe the condition of features such as enclosure, complexity of path, buildings and spaces, overhangs, buffer, shade trees, transparency, and physical components to develop the measure of PLOS of the footpath.
The current research project consisted of a survey conducted in the Melbourne’s Central Business District (CBD) at three specified locations that directly align with pedestrian sensors that the City of Melbourne has placed. These surveys helped to assess various qualitative variables related to pedestrian walkway features, road traffic, pedestrian characteristics, and pedestrian traffic that influence the pedestrian perception of the current LOS. A review was conducted on the relevant literature to identify the existing approaches in evaluating and modelling the PLOS. Ordinal regression modeling has been used to develop a suitable model to classify the PLOS from A to E depending on the various levels of comfort experienced by the user. “A” stands for the best condition of PLOS, and “E” stands for the worst level of comfort provided on footpaths for pedestrians. Unlike usual traditional methods where the PLOS has been divided into six categories from A to F, this study uses only five categories to explain the comfort as the pedestrians will not be able to identify the difference in comfort over six grades at mid blocks, where the factors explaining the comfort will also have less variance compared to intersections and roads [7].
This paper consists of the following sections. In Section 2, the previous studies about PLOS and their methodologies will be discussed. Section 3 presents the information about the study area and data collection method. Section 4 provides a detailed discussion on significant variables and how they affect the PLOS during COVID-19. Section 5 explains the PLOS modelling using the ordinal regression model. The findings of this research will be summarised in Section 6, and the scope for future research will be presented.
2. Literature Review
Walking is an essential mode of transport, and the service level offered by walkways must be assessed from time to time to ensure that pedestrian walkways are in good condition to motivate more people to use the service. Walkable neighborhoods and other physical activities promote the health and well-being of people living in cities [8]. Not many people tend to walk, although walking has seemingly improved the health of individuals. A socio-ecological model has analysed the motivation to walk by finding a hierarchy of needs such as Feasibility, Accessibility, Safety, Comfort, and Pleasurability. People whose first three needs have been met will consider walking as a mode only if walkways are comfortable and walking makes them feel happy [9]. During COVID-19, people used walking and cycling as the common modes of transport not only to avoid travel by public transport but also to keep them fit and healthy [10,11]. Pedestrian Level Of Service (PLOS) and Walkability are the two leading indicators we can find in the literature that help to evaluate the service offered by pedestrian footpaths.
Walkability studies mainly relate to a region’s pedestrian route network, including connectivity and land use mix features to calculate the index. Giles-Corti et al. (2014) [12] used three components, population density, mixed-use planning, and land connectivity, to develop the walkability index of Melbourne city. An Integrated Walkability Index to assess street walkability in China has been established by an indicator classification system that aggregates factors such as connectivity, accessibility, suitability, serviceability, and sustainability [13]. Similarly, a quality index has been developed for each arc of the pedestrian network to evaluate walkability and the quality of pedestrian routes by establishing weights for indicators such as practicability, pleasantness, and safety of the street [14].
On the other hand, a PLOS model describes the comfort level of pedestrians while using pedestrian facilities. Pedestrian facilities can vary, affecting the cognition of pedestrians, including how they perceive their surroundings and how comfortable they feel in their environment [15]. Urban design qualities such as imageability—the unique quality of a space and transparency—what people can see clearly beyond the edge of the street seem to influence the walking behaviour and volume of people on the roads [16]. Although PLOS models have been widely used in the literature, different studies have been conducted to improve the PLOS models based on different pedestrian needs. A Pandemic LOS has been developed using quantitative variables such as pedestrian space, walkway width, and speed to assess the PLOS during COVID-19 in the city of Madrid [17].
Nag et al. (2020) [18] found that factors influencing pedestrian comfort can be categorised into three, including (1) flow characteristics of pedestrians and vehicular traffic, (2) physical elements of the built walking environment, and (3) users’ perception of the walking environment. Nag et al. contended that there was an overarching problem with the research literature. From analysing forty-seven PLOS studies and eight review papers between 1971 and 2019, it was noted that only 49% of these studies and papers reported quantitative and qualitative constructs for the basis of their research, with none of the documents using all three constructs linked together. From this, Nag et al. state that, as a result, there is an underlying flaw in this research. To fully understand the relevant PLOS, all factors must be considered to construct an in-depth LOS model. Each construct has its limitations when used individually and needs to be incorporated to understand the PLOS model fully. Furthermore, it was found that only the inclusion of both qualitative and quantitative parameters could satisfactorily ensure the reflection of the actual conditions in pedestrian movements, as the use of solely quantitative parameters would overestimate or underestimate the level of service beyond the volume of pedestrian or vehicle movements [19].
The previous studies about the pedestrian level of service have been analysed under various factors that were used to evaluate the PLOS of the facility. The data on these variables were collected through objective field measurements or by conducting surveys and collecting data about the perception of pedestrians. The data for variables such as volume of pedestrians, speed of pedestrians and volume of vehicles are collected by video recordings and are called quantitative variables. On the other hand, pedestrians’ feelings of comfort, safety and convenience are qualitative variables and could be collected only through surveys or focus groups.
2.1. Pedestrian Speed and Volume
Landis et al. (2001) [20] addressed these variables in their study, where he noted that not enough research papers had thoroughly studied the quantitative variables that affect LOS. The study consisted of seventy-five participants who ranged from thirteen to sixty-nine years of age. With a nearly even split of females to males (thirty-five to forty, respectively), the study aimed to assess the quantitative variables affecting LOS in an area with a high in-migration. Participants were set on an eight-kilometer course in Pensacola, Florida. The system sought to expose the participants to a large subset of traffic conditions that sought to emulate the standard metropolitan conditions in the United States. The participants would take a survey while they walked the course. The scorecard would ask for a rating from A to F for the conditions and comfort levels while ignoring significant intersections and the surrounding aesthetic. Based on the results, it was noted that the main factors that contributed to pedestrian comfort were the volume of motor vehicles, speed of the motor vehicles, lateral separation, and the importance of pedestrians. Later, these findings were confirmed by another study performed by Petritsch et al. (2006) [21], where one hundred people from the United States conducted a similar experiment in Sarasota, Florida.
A study by Lam et al. (2002) [22] sought to analyse how pedestrian flow, frequency, and speed affected the LOS standards at signalised crossings. The study was performed at four chosen locations in Hong Kong that had bi-directional and uni-directional flow rates with light rail transits. The analysis was performed using the time-lapse photography technique during peak flow rates (5:30–7:30 pm). The pedestrian movement was recorded at four locations, and two codes were programmed to analyse the recordings. Based on the results, it was found that the walking speeds were considerably faster in commercial areas than in shopping areas, and the lowest walking speeds recorded were during peak hours when the flow rate was highest. Lam and his party contended that the findings were not aligned with the Transport and Design manual and called for a re-evaluation of the current LOS infrastructure. A limitation was that it took a purely observational approach, did not consider pedestrians’ perceptions, and required additional infrastructure upgrades.
This shortcoming was explored by Lee et al. (2005) [23]. A very similar project was designed to capture similar results, update the current LOS model, and explore the pedestrian perception of flow rate and speed of other pedestrians. To further examine Lam’s and his partners’ research (2002) [22], Lee used the same methodology of time-lapse technology by recording the flow at a commercial/shopping area in Hong Kong at the same site. Recordings were taken during peak flow rates throughout the weekday, and an additional questionnaire survey was conducted. The 758 survey responses brought forth the notion of an acceptable flow rate based on bi-directional flow rates. During peak periods where the flow was the most constant and had the highest overall pedestrian speed, a good LOS was generated with the contention that pedestrians are more accepting of varying pedestrian speeds and maximum pedestrian frequency during peak bi-directional flow.
2.2. Width of Pedestrian Walkways
In a study performed by Kim et al. in Seoul, South Korea (2011) [24], they analysed the width of sidewalks for comfort perceived by pedestrians. The study was done by accommodating a variety of factors and surveys to gain a deeper understanding of pedestrians’ perception of the LOS. Current models were mainly based on the Korean highway capacity manual, which only considered the LOS of roads. An extensive survey was undertaken of fifty-five volunteers on how they perceived the pedestrian LOS vs. the vehicle LOS. The study was developed to accommodate pedestrian movements by asking the volunteers to walk with a GPS to analyse their actions and their effect on the LOS. From this, it was found that the wider the walkway was, the less the trajectory changed, and in turn, the LOS rating was higher. Although these findings were positive for the width playing a contributing factor to the LOS, there were limitations in the sample size, and we did not get to understand and build upon the findings fully.
These limitations were tested in a study by Kim et al. (2014) [25]. Kim et al. analysed how pedestrian service levels would be affected when a behavioural theory-based approach was taken. The study was done through the collation of two sets of data. Subjective data was obtained through a survey of pedestrians in Seoul, Korea, from 28 different commercial, residential, and leisure locations, and secondly, objective data was collected from video recordings. The recordings would be analysed and rated by a standardised model that would show how much pedestrians were required to perform evasive movements when crossing each other and the amount that pedestrians invaded each other’s personal space. After collating and analysing all the data, the quantitative data was collated with the two most highly rated factors impacting LOS being identified as walking speed and number of conflicts. This being plotted against the analysis performed on the evasive maneuver model showed that the width of the sidewalk played a significant contributing role in the overall LOS. If pedestrians had more space to walk and were not required to maneuver around other pedestrians, this would increase the LOS.
2.3. Impact of Vehicles on Pedestrian Comfort
When assessing the pedestrian level of service, an area that is often overlooked is the level of service at significant intersections with regions shared by pedestrians and motor vehicles. The Highway Capacity Manual (2010) [4] has been a resource that has been widely used since its release and has provided the basis for a significant contribution of current research on the level of vehicular service movement and, most predominantly, the effect that pedestrians and vehicles have on each other and the corresponding level of service.
Christopoulou and Pitsiava-Latinopoulou developed a PLOS model for use in Greek urban areas. They evaluated 11 methodologies to estimate pedestrian service along the axis of their movement without crosswalks or intersections. The main factors considered in these methodologies were volume (vehicle, pedestrian, or bicycle), traffic incidents, and safety/comfort, with the HCM method being the most popular. The model was used in parallel with five other appropriate methodologies and an extensive questionnaire survey for the Greek pedestrians. The questionnaire survey results revealed that the perceived quality of service of pedestrian movements was much closer to their model’s results than the other methodologies [26].
The PLOS model was developed for unsignalised mid-blocks in China considering factors such as traffic conflicts, crossing facilities, delays, the distance between marked and unmarked crosswalks, and pedestrians’ perception of safety and convenience on those crosswalks. Data about road geometry, traffic flow, and survey were collected at 30 crosswalks. Pearson’s correlation analysis was used to give weights for safety and convenience after they were found to be poorly correlated with each other. Factor analysis and stepwise regression analysis were performed on the data by taking safety and convenience as response variables, and the result shows that PLOS depends on the motor vehicle volume and distance between marked and unmarked crosswalks at unsignalised crossings [27].
Nikiforiadis et al. (2020) [28] created experiment that analysed the interaction between cyclists and pedestrians within a one-meter radius around each other. These events would be broken down into seven subcategories. The study was performed in Northern Greece at five different locations known for having a shared walkway in the Municipality of Thessaloniki. To build upon the limitations in the study of Hummers, Nikiforiadis et al. performed their experiment through three primary observers that observed a volunteer walk down a pre-determined distance of one hundred fifty meters at the midpoint of each of the five locations [29]. The first observer would focus on the travel time, the second on the recorded pedestrian and bicycle flow, and the third record the number of events that could be recorded. Based on the observations, it was found that whenever events occurred, they would significantly impact the overall comfort level of pedestrians and cyclists, causing hindrances to their general pathway.
2.4. Infrastructure
A factor that has been found to impact PLOS directly is the type and frequency of crossings and facilities part of a pedestrian’s route. The Danish Road Directorate sponsored a study in 2012 to objectively quantify pedestrian and cyclist satisfaction with roundabouts, signalised and non-signalised intersections, mid-block crossings, pedestrian bridges, and tunnels in the form of a given level of services (LOS) at crossroads. The study mainly was a stated preference survey, where each intersection was rated on a fixed scale. The methodology then had respondents view numerous crossings captured on videotape by a walking or cycling cameraman and rate these concerning how satisfied they would be walking or riding a bicycle under the given conditions shown on the videos. Respondents rated crossings on a six-point scale ranging from dissatisfied to satisfied. Pedestrian and cyclist satisfaction models were developed using cumulative logit regression of ratings and variables. The most significant variables were the presence and type of pedestrian and bicycle facilities, such as bike lanes or zebra crossings. This study allowed practitioners to better plan and design for pedestrian and bicycle traffic and to optimise budgets for improvements [30].
Although the previous study assessed the frequency of available infrastructure, it did not evaluate whether the service provided met the demands of pedestrians. Gopalakrishnan et al. (2019) [31] explored this when he analysed the impact of both motorised and non-motorised users sharing a common space at intersections. Based upon the results, it was found that the development of the pedestrian level of service and vehicular level of service (VLOS) significantly contributed to each other at these significant points of intersection. To improve upon such parameters and the PLOS, improvements would need to be made to the availability of infrastructure.
When assessing the PLOS, Transport for London [32] conducted an in-depth comfort analysis of pedestrians in London. To undertake this analysis, the process was divided into three main steps where they assessed pedestrian footway comfort, crossings, and a review of the scheme. When evaluating the PLOS, it is essential to classify the primary purpose of pedestrians that will use that path. The TFL broke these into five main classifications: high street, office and retail, residential, tourist attraction, and transport interchange. After a purpose had been identified, a comfort level analysis was generated. When assessing pedestrian comfort, this can be broken down into six main parameters paramount to the LOS: traffic volume, on-street parking, footpath, roadway width, traffic regulations, and the number of lanes. If these were not satisfactory, then changes to infrastructure design were necessary to provide a higher PLOS rating.
As the PLOS aims to provide a quantitative grading on the overall LOS in an area, it is essential to understand the individual perception of pedestrians. A city can aim to provide the infrastructure to accommodate findings in PLOS models. However, it ultimately does not decide whether the pedestrian wants to adhere to roadside safety rules. This results in an understanding of pedestrian behaviour becoming necessary. The movement of pedestrians in a public environment depends on how they perceptually respond to the detailed design of the streets and other environments [33].
To further explore this notion of pedestrian behaviour, the French Government provided the funding to analyse the specific behavioural patterns of residents in Paris. Marion Maestracci and his partners (2010) [34] examined this because of the unusually high fatality rate of pedestrian and motor vehicle incidents. A fourfold method-system approach was undertaken to understand better the environment’s impact on pedestrian behaviour to accommodate this project. This approach involved analysing the decision-making in an urban context, analysing the criteria applied by pedestrians when crossing, observing real-life scenarios, and investigating police reports to understand the circumstances where road accidents occur. To build on these research topics, various analytical methods were applied. These included conducting surveys at three different sites in Paris that were different in terms of infrastructure and residents’ rights. Observation of pedestrians crossing roads and whether they adhered to road safety rules and the speed and number of pedestrians, and finally, the consequences that can occur by analysing police reports by mapping the frequency of accidents and comparing it to the behaviour of pedestrians at those locations. From these different forms of analysis, it was found that two main variables came into account when pedestrians would partake in any behaviours that were against the law. These were attributed to the infrastructure being insufficient, resulting in pedestrians needing to participate in actions against roadside rules and the behaviour of pedestrians falling within the category of opportunistic or suspicious. The findings showed that the main areas that need improvement are building infrastructure and roadworks to accommodate pedestrian behaviour. Although the results showed that pedestrian behaviour played a contributing factor to the LOS, it is essential to note that a limitation of the experiment is that it only considers Parisian residents.
These limitations have been addressed in another study performed by McIlroy and his partners (2020) [35]. An analysis was performed to explore the relationship between pedestrian behaviours and traffic safety in six countries. The study was conducted by asking pedestrians to complete a 22-question survey that asked for their opinion on their general attitudes to general traffic safety instead of the behaviour of specific road user groups. The questionnaire was supplied digitally and physically across the UK, China, Kenya, Thailand, Vietnam, and Bangladesh; 3423 responses were accumulated and analysed. Because of the cultural differences and some countries having a much larger population size that use specific modes of transport, results were heavily skewed, with adjustments needing to be made to the original questionnaire. The analysis found that each country’s demographic and cultural differences significantly contributed to their perceptions of road safety. With a large population of younger males performing high-risk on-road behaviours as opposed to the rest of the surveys, it was also found that overall behaviour toward road safety in countries with a lower national income was more inadequate.
From the literature review, it is clear that both quantitative and qualitative factors affecting the PLOS have been considered to develop the model as shown in Table 1. However, we find that there are not many studies about the use of only qualitative variables that affect the PLOS in a given facility. During COVID-19, the pedestrian behaviour was impacted by the social distancing and personal views about the spread of the virus. Therefore, the subjective views or revealed perception of pedestrians are considered in this research for each factor affecting the LOS to develop a suitable model for the COVID-19 period.
3. Data
In this study, as mentioned in the literature review, the qualitative variables that influence pedestrians such as continuous footpath, road verge, onstreet parking, street furnitures, street benches, surface of footpath, lighting, pedestrian flow in both directions etc., are considered to evaluate the overall comfort perception of pedestrians. The data were collected through a random survey method where pedestrians walking on the sidewalks were randomly selected and told about the purpose of the survey; only those who were interested participated in the survey. It was conducted by distributing questions in paper formats to the pedestrians and asking them to fill out the forms by giving their ratings on different conditions of pedestrian facilities. Hence an ethics application was submitted to Ethics Committee, and the survey was conducted after the ethics approval was granted. To develop an accurate PLOS model, this study was carried out throughout the entire year and broken down into three stages. These stages are the data collection, data analysis, and PLOS modelling, with the data collection taking up the bulk of the research period.
3.1. Study Area
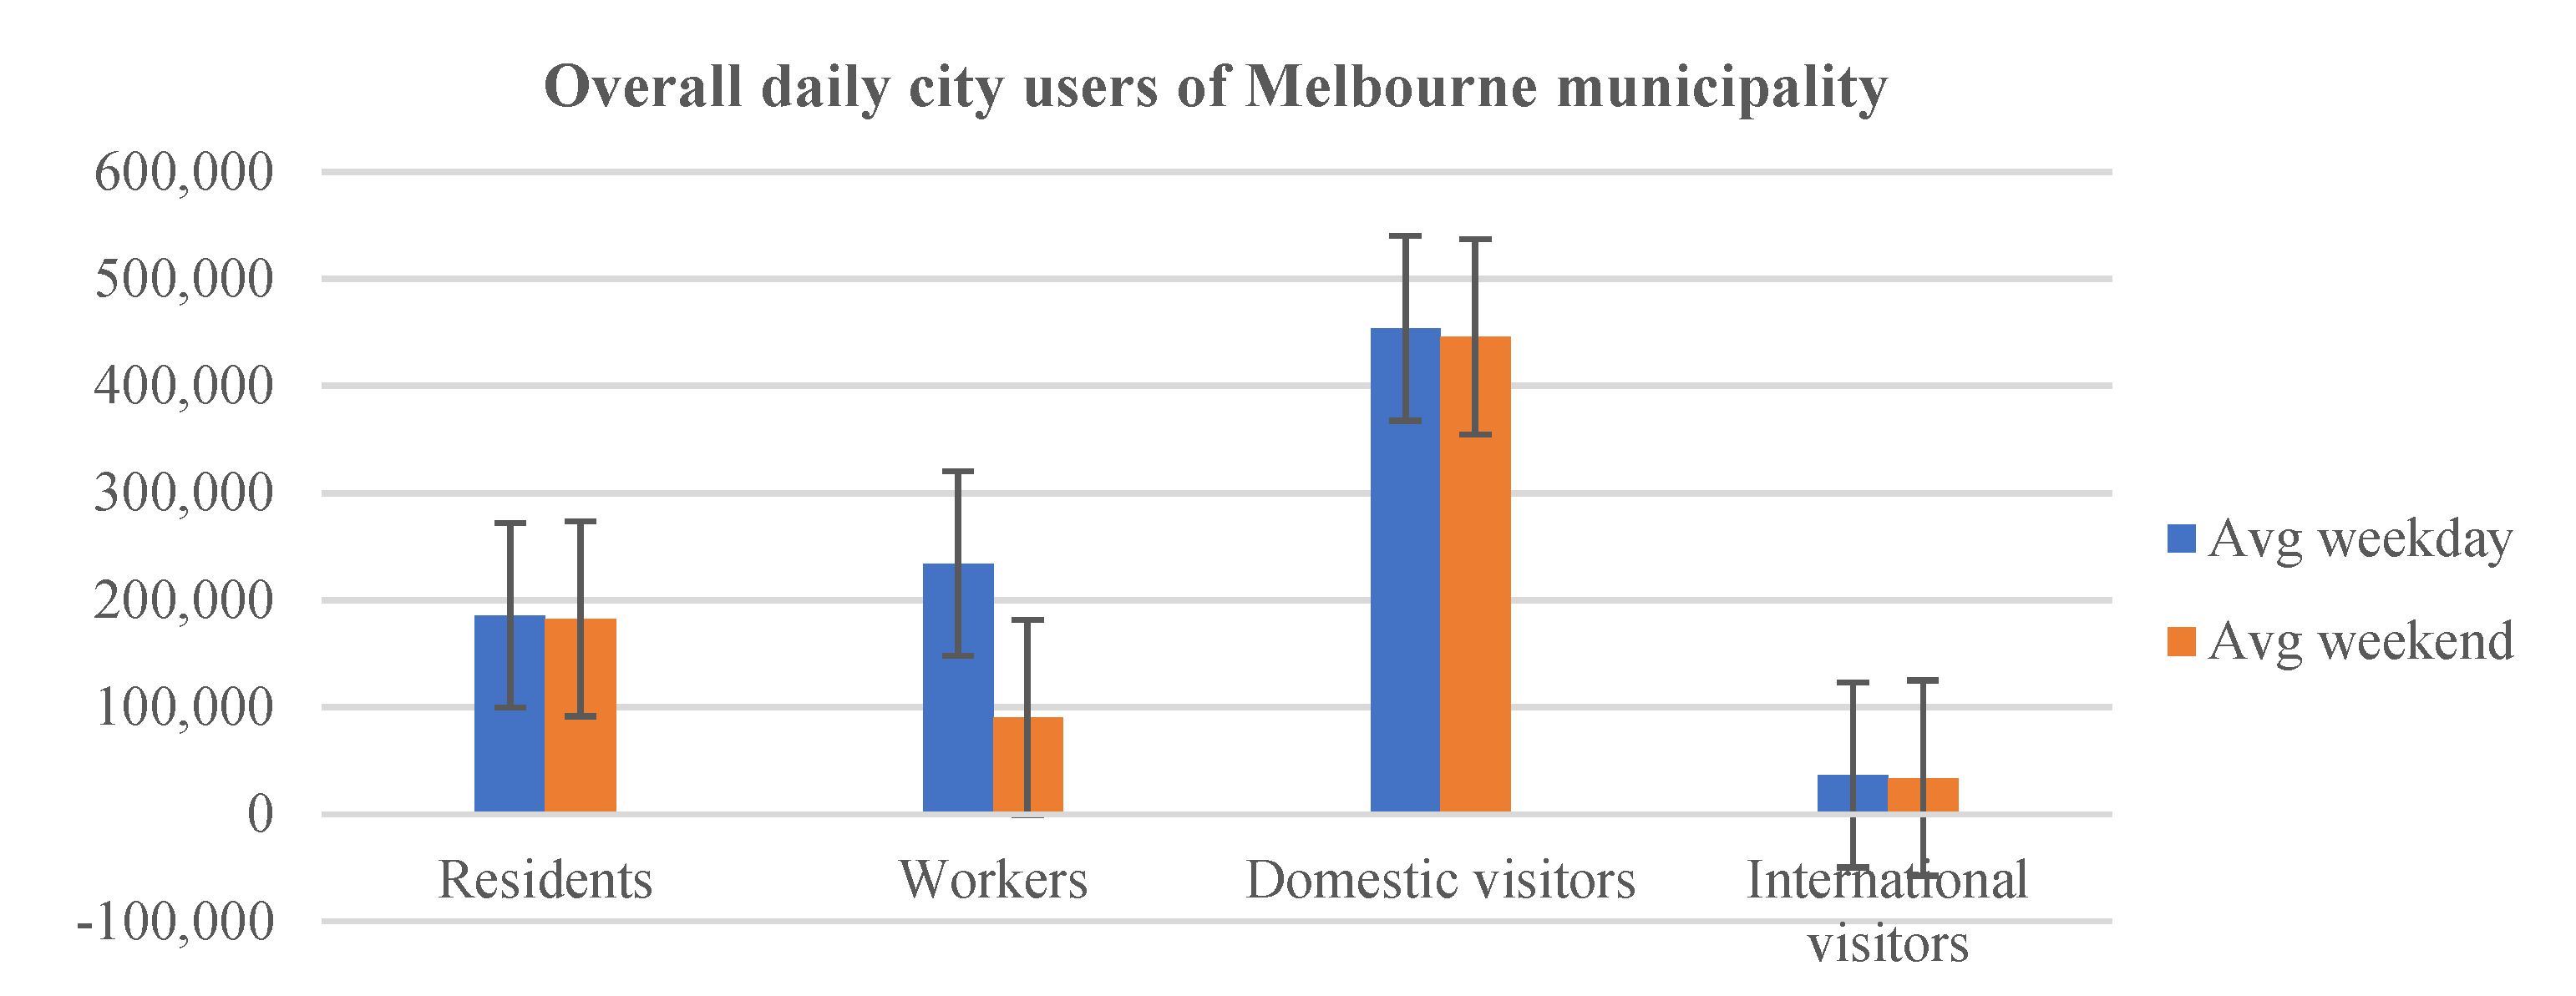
The survey was conducted in the Melbourne CBD, which has the most pedestrian activity compared to other areas of Melbourne. Melbourne is the second-largest city in Australia, and the CBD is the central hub for Melbourne’s business and finance and has a population of about 5.1 million. With the recent increase in the Melbourne population, many people are commuting to central Melbourne for education, tourism, business activities, and shopping. The graph in Figure 1 shows the daily city users in the CBD in 2019; it shows that on an average weekday, the count of people travelling for work is higher than on the weekends. It is ideal for surveying the CBD where there would be pedestrian movement even during COVID-19 restrictions. Flinders Street train station, Southern cross station, and RMIT university at Swanston Street were chosen to conduct surveys.
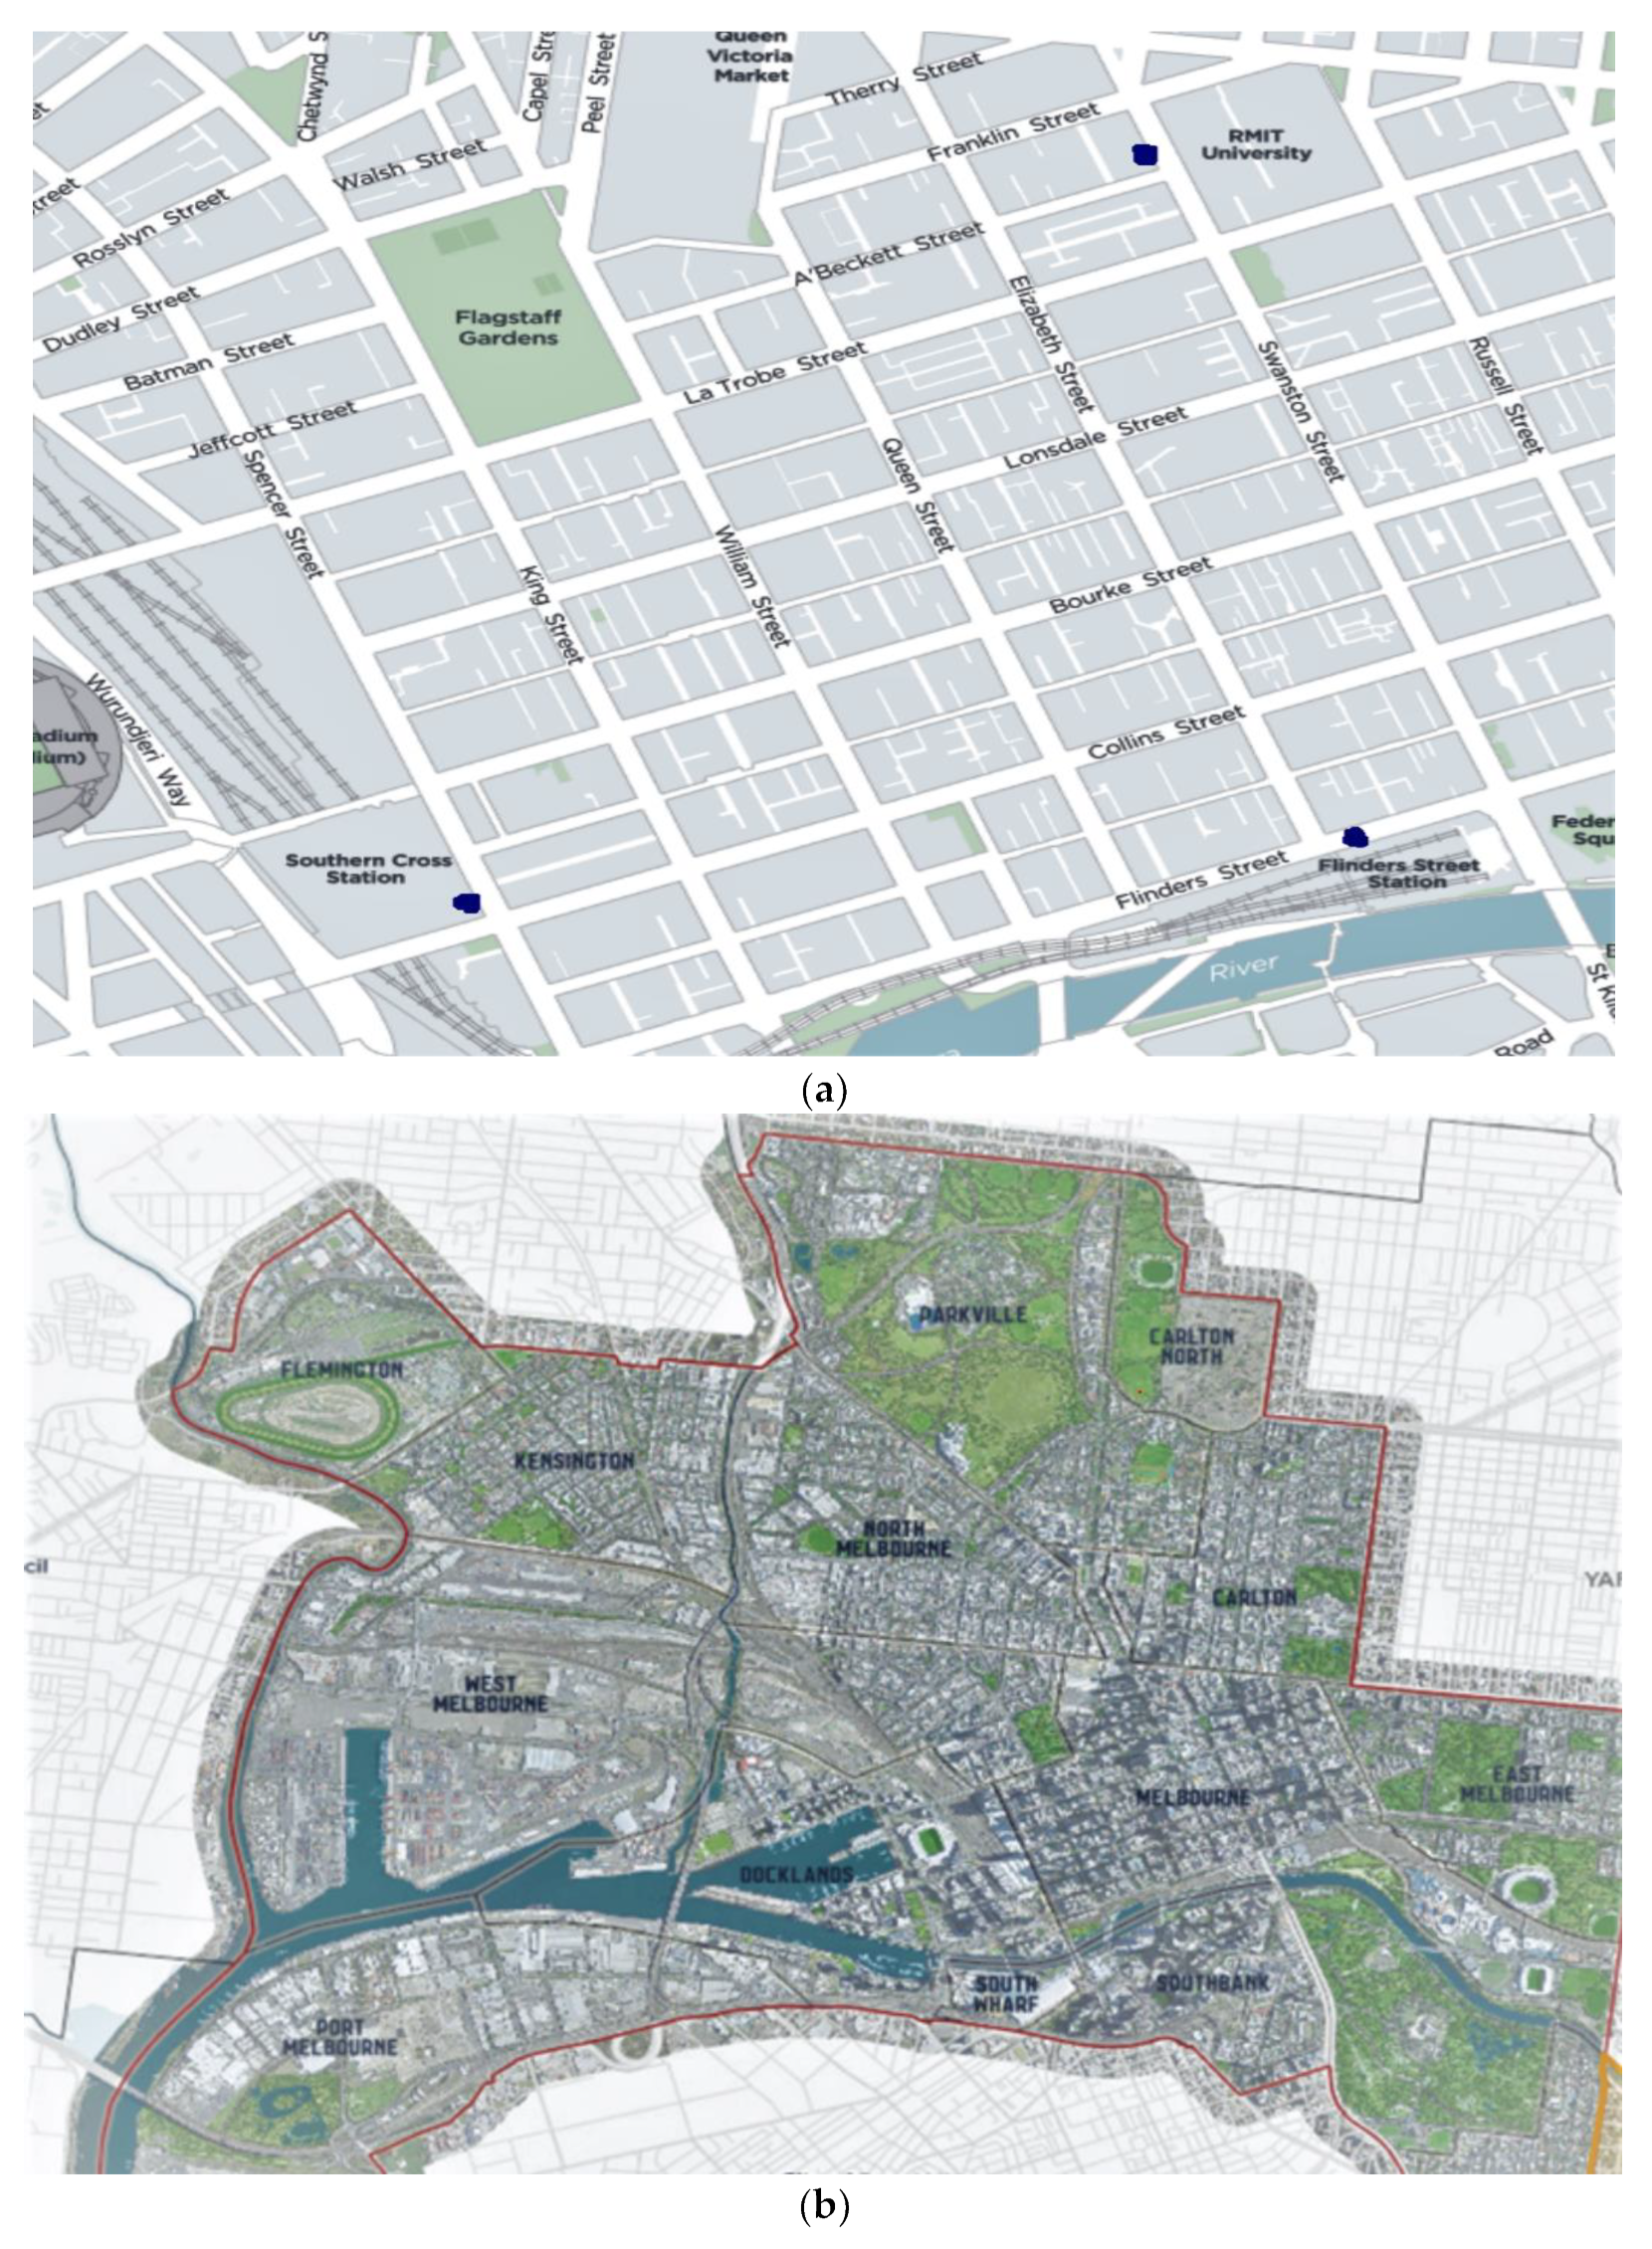
The survey locations are highlighted in blue in Figure 2a. This method of data collection gave access to collect feedback from everyday commuters and students who would have travelled the footpath many times. A pedestrian counting sensor was installed in these locations, showing a significant drop in pedestrian volume during the pandemic compared to before COVID-19. The peak hours at the train stations were morning, 7:00 am to 9:00 am, afternoon from 12:00 to 2:00 pm, and evening from 4:00 pm to 6:00 pm, whereas the university sites get crowded between 9:00 am and 4:00 pm. Therefore, the surveys were conducted from 7:00 am to 4:00 pm to accommodate peak and off-peak times.
3.2. Pilot Surveys
This phase was mainly used as the preliminary phase and to lay the foundations for the research project. After discussion with subject matter experts, the questions to be asked in the study based on the literature were finalised. Data was initially collected through two surveys, comprising a shorter qualitative survey with questions only about the pedestrian crowd and vehicle volume and a more detailed qualitative survey with questions about the pedestrian flow, walkway characteristics, and vehicle traffic; the aim was to check pedestrians’ willingness to respond to a survey during the pandemic. After two weeks of data collection and drawing from pedestrian feedback, the two surveys were scrapped and replaced under one qualitative survey to assess the sidewalks. The detailed qualitative study was shortened and presented more concisely. This was done as pedestrians found it more “daunting” when two double-sided pages needed to be flipped through, making pedestrians less cooperative in undertaking the survey. Another area of confusion was that the language used was often misunderstood and misinterpreted. The complexity of language and jargon used was reduced such that it would be easier for pedestrians to understand questions to reduce overall contact time and misinterpretation of questions.
3.3. Data Collection
Depending on the number of survey responses to be collected, the data collection process was initially planned to be held from the last week of May 2021 until late September to early October. However, this was shortened, and data was collected only until the first week of August 2021, due to the nature of the social climate. With Melbourne and Victoria having undergone three different lockdown stages throughout this period, heavy adjustments were made to the data analysis process and the amount of data collected to accommodate the government restrictions.
As shown in Table 2, the first part of the questionnaire consisted of questions related to pedestrian demographics such as gender, age group, purpose of the trip and occupation. The next part of the survey questionnaire had questions on pedestrian’s feeling about immediate surroundings such as pedestrian crowd, vehicle volume, social distancing and comfort distance of pedestrians. The final part of the questionnaire had questions about path characteristics and pedestrian flow features such as width of footpath, surface quality, slow moving pedestrians etc. These questions had to be rated by the pedestrians on a scale of 1 to 5 where 1 stands for strongly disagree on the good condition of the feature and 5 stands for strongly agree with the good condition of the feature. The last question was about the overall comfort of walking on that particular footpath which represents the pedestrian perception of the PLOS, rated on a scale of 1 to 5, where 1 represents a very poor quality of comfort (PLOS-E) and 5 stands for very good quality of comfort while walking on that sidewalk (PLOS-A).
The three primary locations were needed to provide a substantial variance in trip purpose and demographic to acquire enough data points to create a complex PLOS model. The total number of survey responses collected was 462. The table shows the descriptive statistics of the data collected at all the three sites. 54% of the responses were from male pedestrians and 45% of the surveys were completed by females, which is consistent with the previous research by Kadali and Vedagiri, where there has been a higher participation from male pedestrians compared to female pedestrians [7]. The questionnaire offered an option given as ‘Other’, for those pedestrians who did not wish to choose male or female. However, there was only one participant who answered as ‘Other’ and hence that data has been considered as an outlier and not included for analysis.
4. Data Analysis
4.1. Pedestrian Density
Pedestrian density has been a significant factor in determining the suitability of the LOS, with a wide variety of factors that affect the pedestrian density. With the current impact of COVID-19, a large majority of industries have been forced to work at a reduced capacity, with most workforces operating at 50% maximum capacity. Due to the current climate, this has been heavily represented in the pedestrian’s perception of comfort around them, with the current trends heavily supporting the pedestrians’ belief that the pedestrians in the Melbourne CBD have considerably lessened because of COVID-19 and, in turn, they feel comfortable with the pedestrian crowd around them at the point of survey.
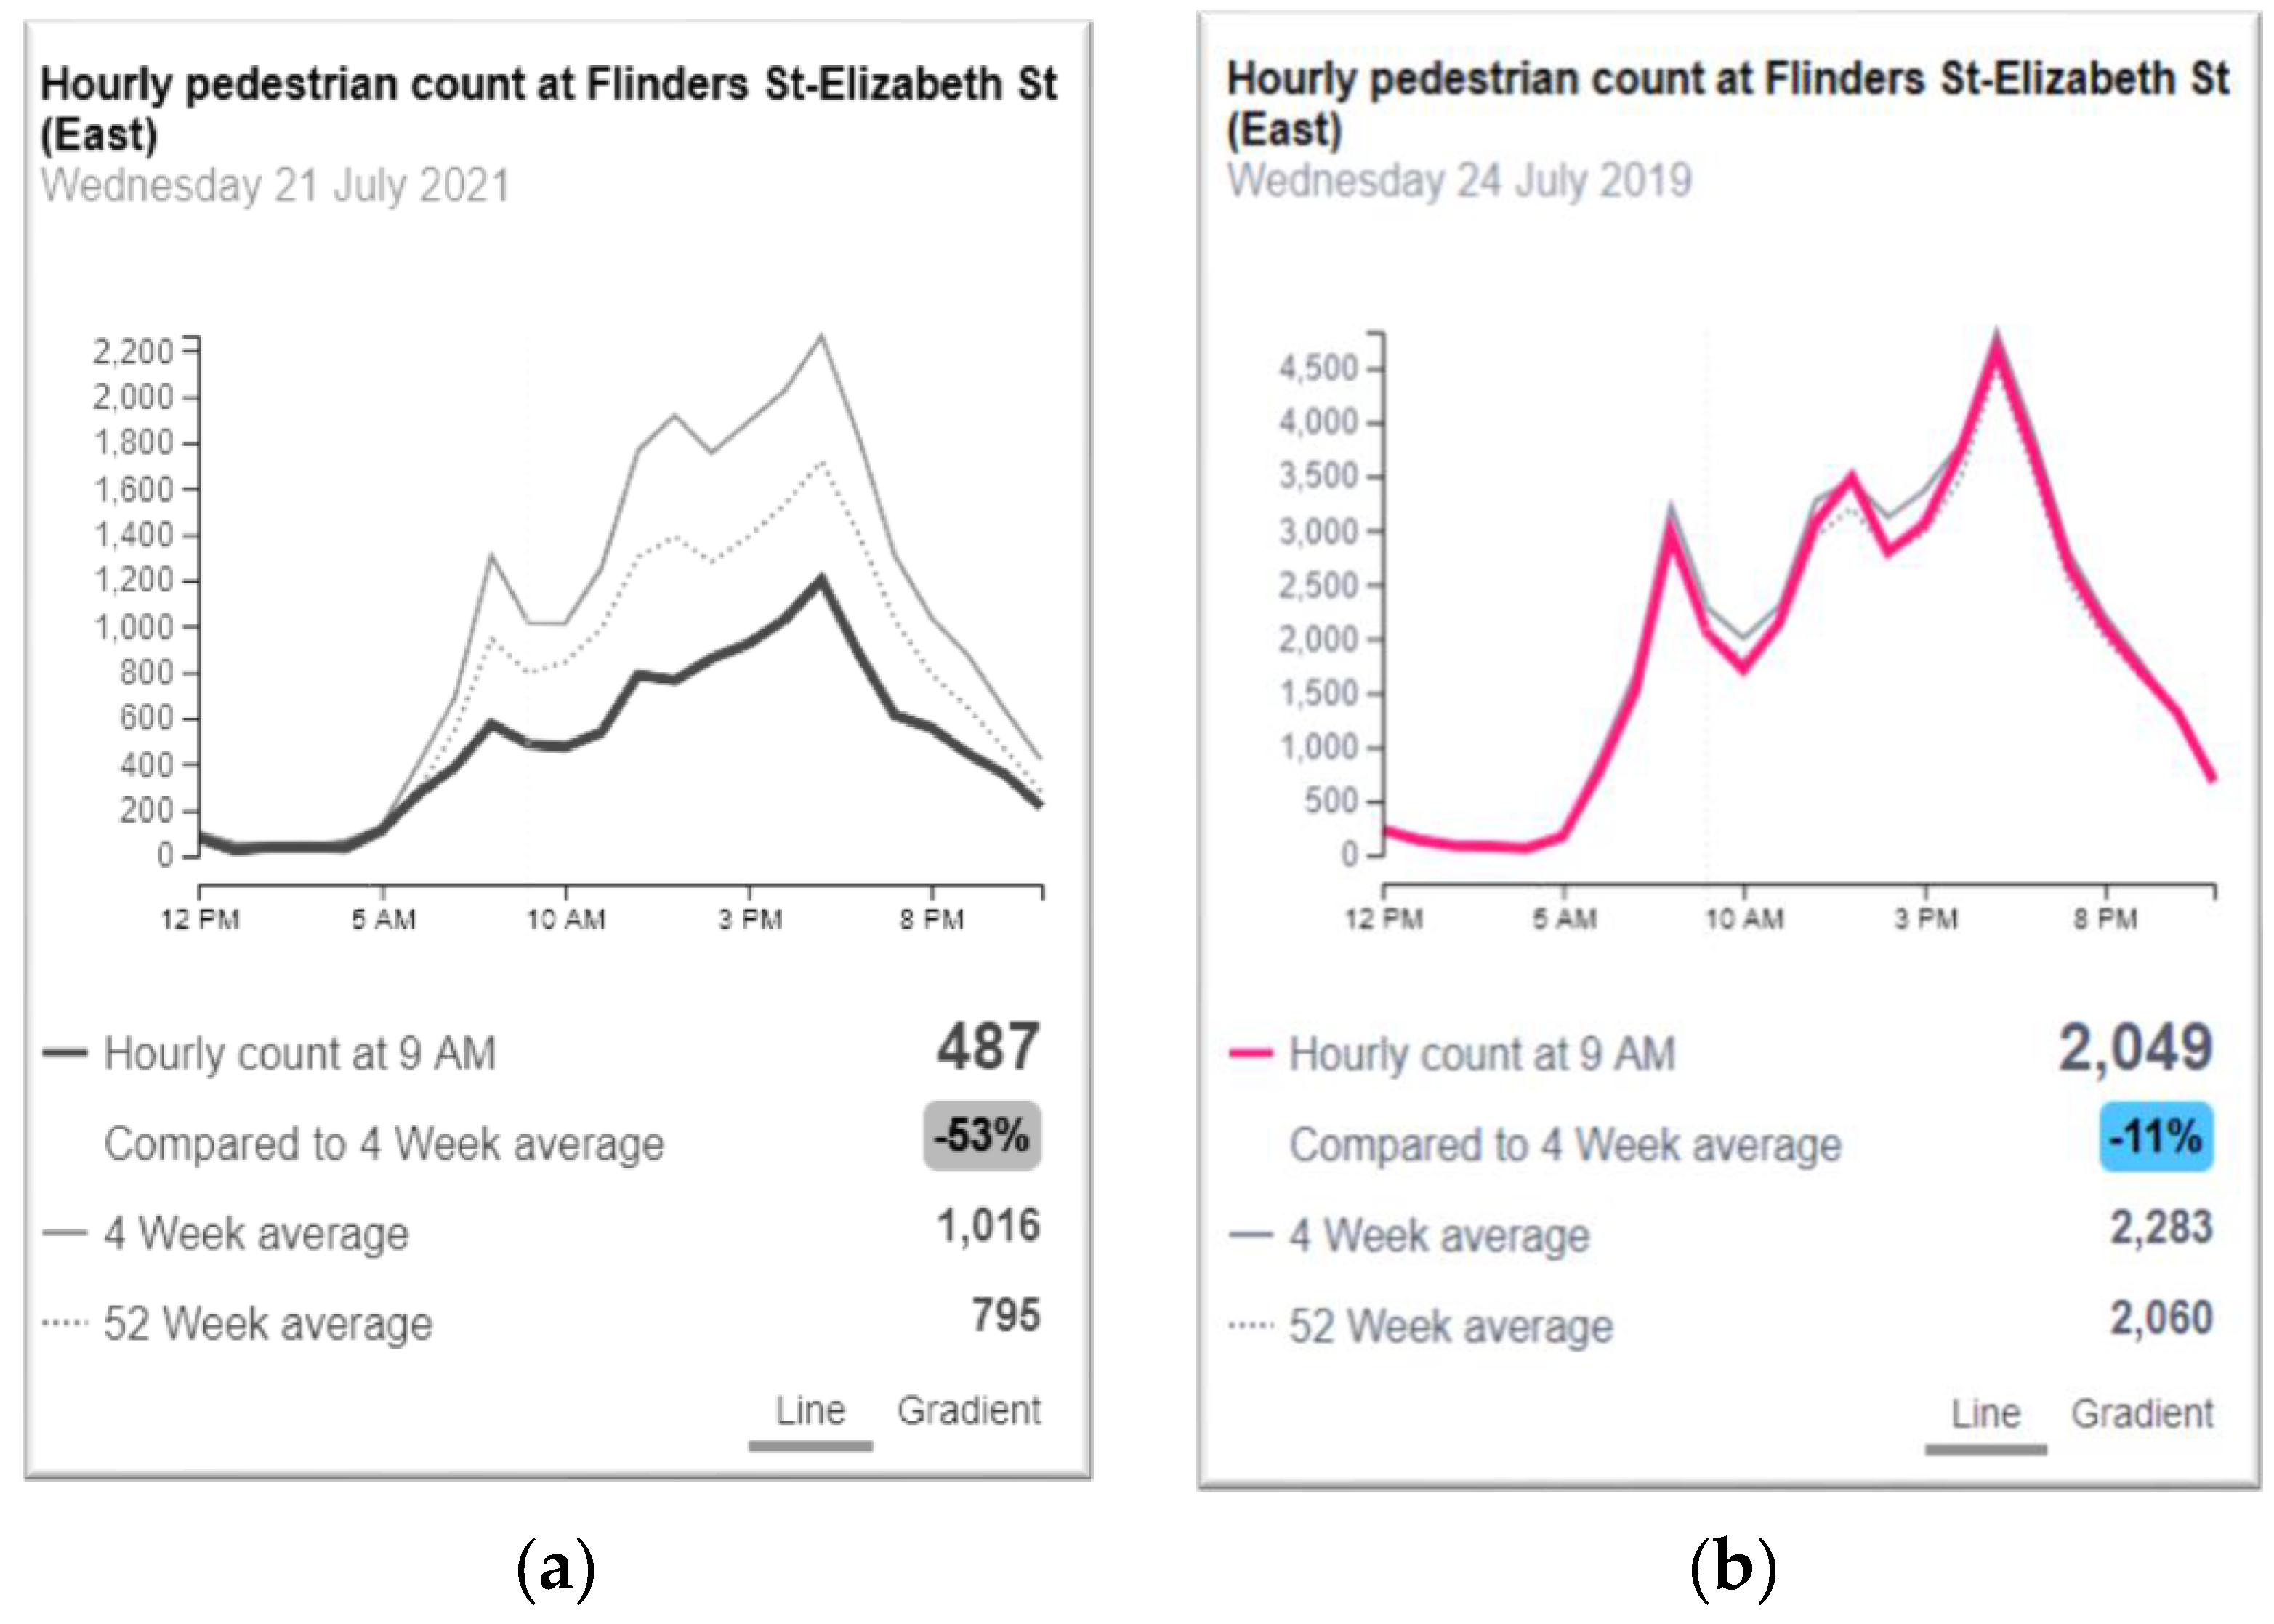
With the response to COVID-19 and the change in government restrictions, 82% of the respondents who participated in the survey were found to have at least agreed with the statement that pedestrian volume has decreased. When analysing the data provided from the pedestrian counters provided by the City of Melbourne, this further develops as there is an apparent disparity between the volume of pedestrians between pre-COVID conditions and during the epidemic. On 21 July 2021, roughly in the middle of Victoria’s fifth and sixth lockdown, the Flinders Street sensors found a similar pedestrian trend to the previous years. With a slight increase in pedestrian volume throughout the day, eventually reaching a peak during 5–6 pm when office work had finished, the volume would then see a dramatic drop as it became night-time. The Flinders Street Underpass is the busiest of the three locations analysed [37]. From the comparison, it is evident that COVID-19 had heavily impacted the overall volume of pedestrians in the CBD, with a peak of 2200 pedestrians over a 4-week average compared to 2019, when a rate of 4500 pedestrians was counted. Suppose an analysis was performed on the day’s volume. In that case, it is also apparent that the daily count was considerably lower than the average for the 2019 recording, which found an almost identical daily count as the average. All these factors highlight the impact of COVID-19 and overall pedestrian volume in the city, which has been reflected in pedestrians’ responses during the data collation.
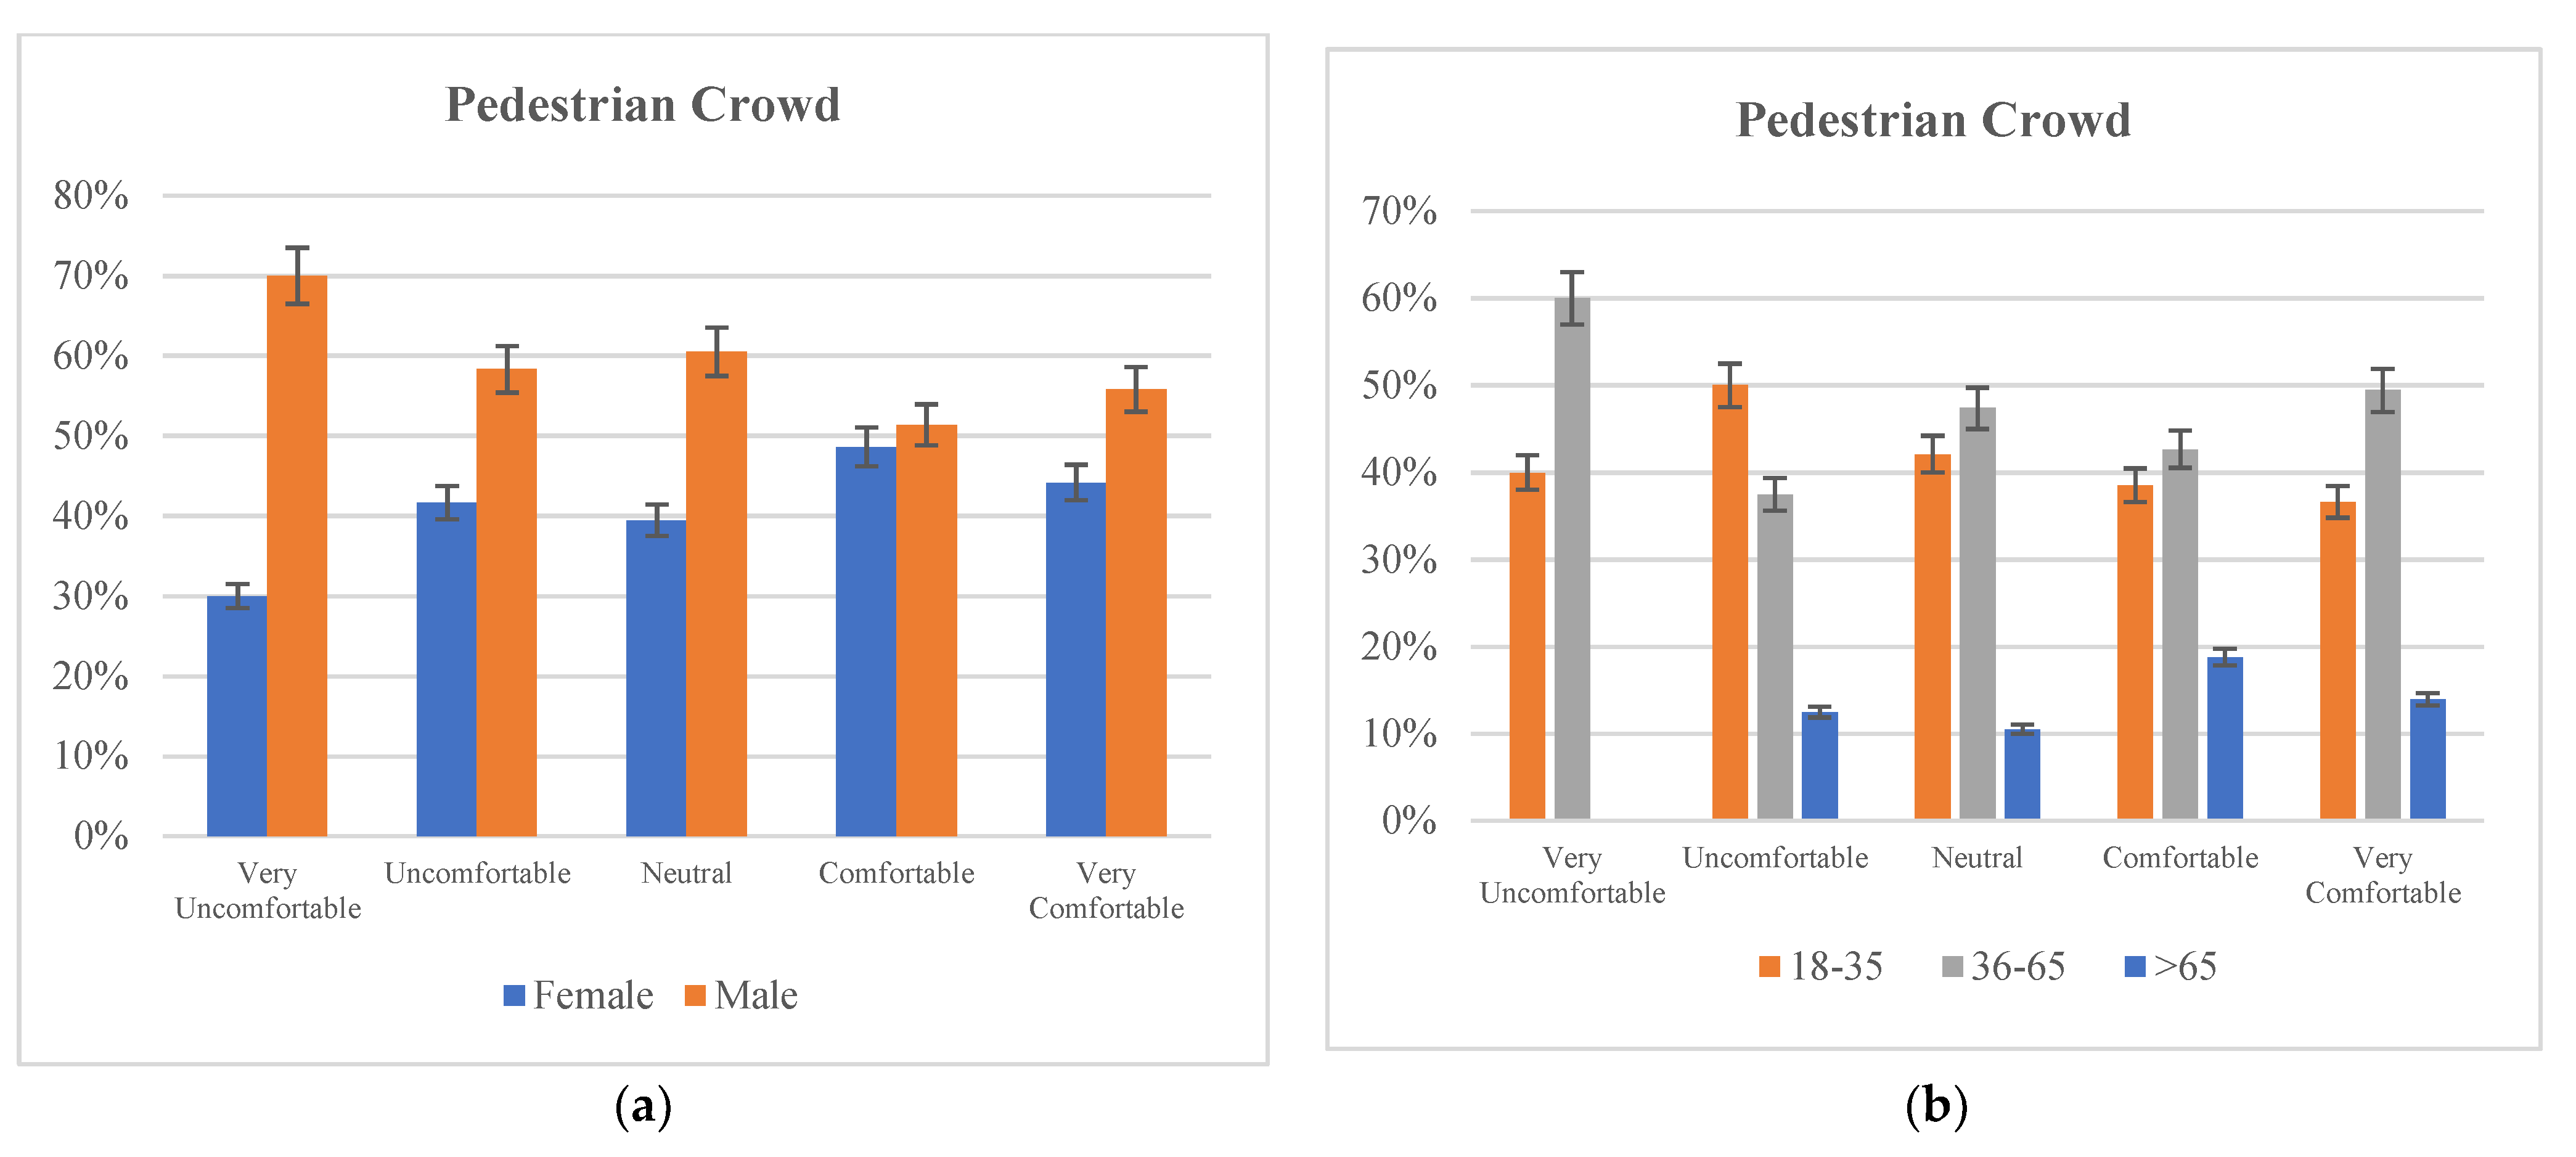
Pedestrians have also noticed this change with the overall decrease in pedestrian volume in the Melbourne CBD. As a result, overall comfort levels are maintainable, with 85% of pedestrians stating that they felt either comfortable or very comfortable with the pedestrian crowd around them. As stated in the Transport for London (2010) [32] analysis, having a pedestrian sidewalk that is conducive to the demands of pedestrians such that they feel comfortable and can support the demand during peak periods is extremely important for the PLOS. Having pedestrians perceive a state of comfort due to personal privacy and not being invaded by other pedestrians is one of the main contributors to the PLOS model. It can influence how pedestrians perceive other factors. These findings were similarly supported in a study performed by Choi et al. (2014) [38], where a similar analysis was conducted in the streets of Seoul, Korea. Their study further contended that there was a strong relationship between pedestrian comfort and the overall flow rate, density, and conflict with other pedestrians. Figure 3a shows that male pedestrians experienced a high comfort during COVID-19 compared to females and elderly pedestrians. This could be understood from the data in Table 2, which shows that 47% of the pedestrians felt ‘comfortable’ and 38% of the pedestrians felt ‘very comfortable’ with the pedestrian crowd around them. Hence for ratings 4 and 5, we find the percentage of male responses to be higher compared to females, and elderly pedestrians’ response percentage to be lower than other age groups as shown in Figure 3b.
4.2. Social Distancing
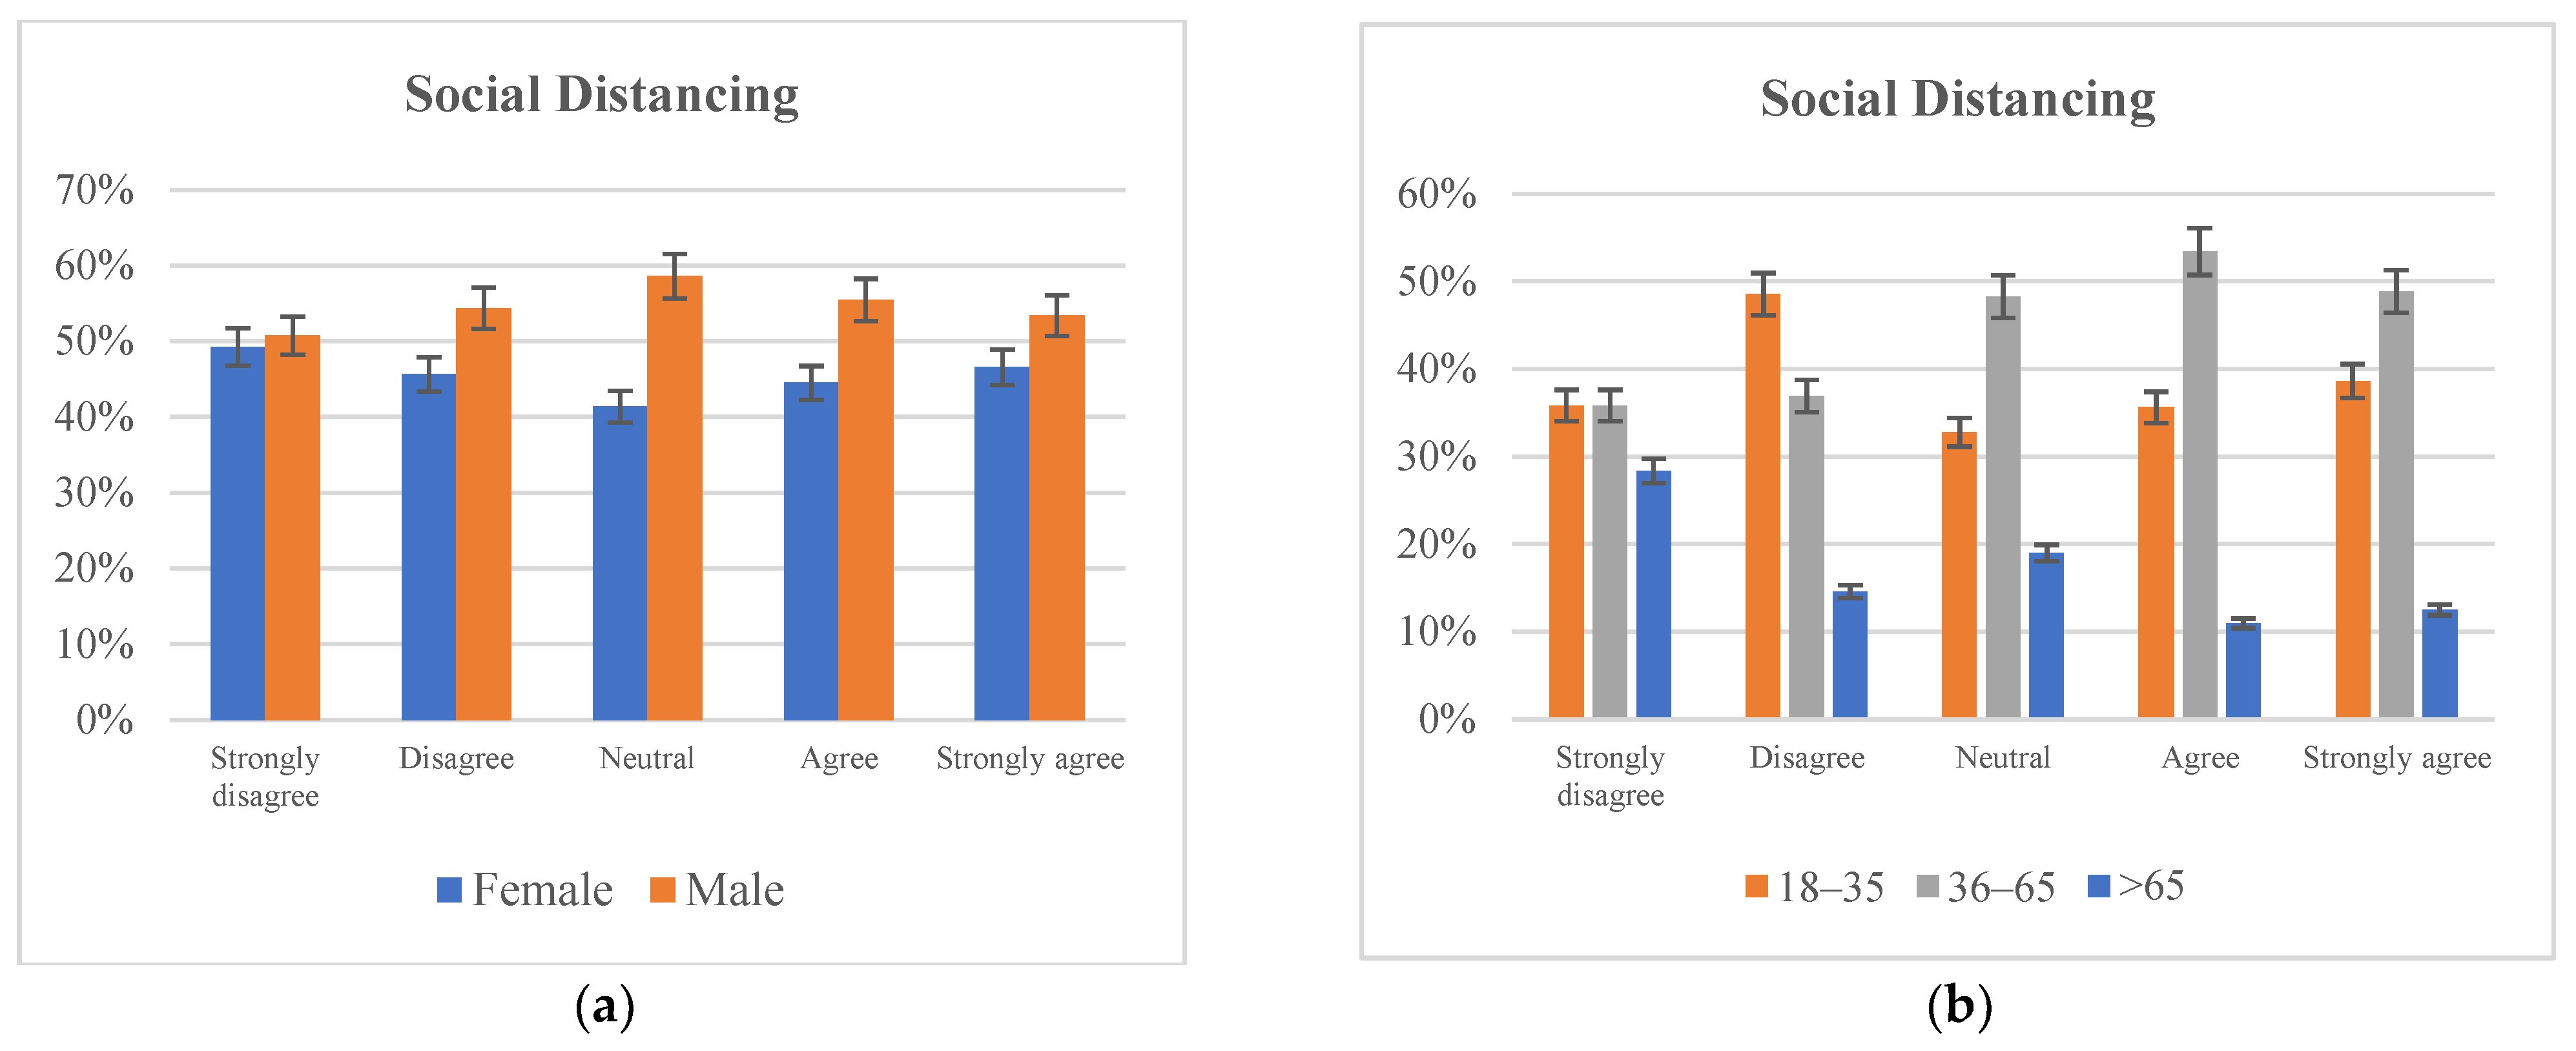
Social distancing emphasises minimising contact between individuals and socially distancing to reduce the spread of COVID-19. This perception is evident in the responses of surveyed individuals, with an apparent disparity of individuals who considered social distancing when walking along the footpath. With 72% of respondents answering that they think of social distancing when travelling along their pre-determined path, it’s evident that the impact of COVID-19 has had an apparent effect on the perception of pedestrians, as shown in Figure 4a,b. This perception was also consistent throughout all age groups, with the elderly pedestrians finding it hard to maintain a covid safe distance while walking on footpath compared to middle aged and younger pedestrians during the pandemic.
More individuals accounting for social distancing have impacted the overall comfort distance they prefer to maintain between themselves and other pedestrians. With 49% of respondents choosing a 1–1.5 m distance between them and other pedestrians, the number of responses dropped dramatically as the length increased above 2 m. It was also noted that males had an overall higher preference for the distance between other pedestrians, simply due to the circumstances and their perception of other pedestrians. All these factors clearly show the impact that COVID-19 has had on the perception of comfort for pedestrians. It is essential to consider this factor to make necessary provisions during the next pandemic.
4.3. Continuous Footpath
Continuous footpaths throughout the CBD have influenced the overall PLOS model. Having endless trails that ride alongside the road on either side has been a significant factor in determining the LOS those pedestrians currently represent.
With continuous footpaths, the need to reroute and detour becomes less apparent in pedestrian pathways, resulting in an overall increase in comfort. With a constant way on both sides of the road, pedestrians can safely travel between locations without feeling at risk of motor incidents and increasing overall comfort and ease of access for individuals with impairments [39]. The inclusion of continuous footpaths across either side allows pedestrian traffic to be split between either side without funneling and forcing pedestrians to travel along one way, which is extremely important with the current circumstances of the pandemic where pedestrians have become increasingly sensitive to the amount of space that is present between them and other pedestrians.
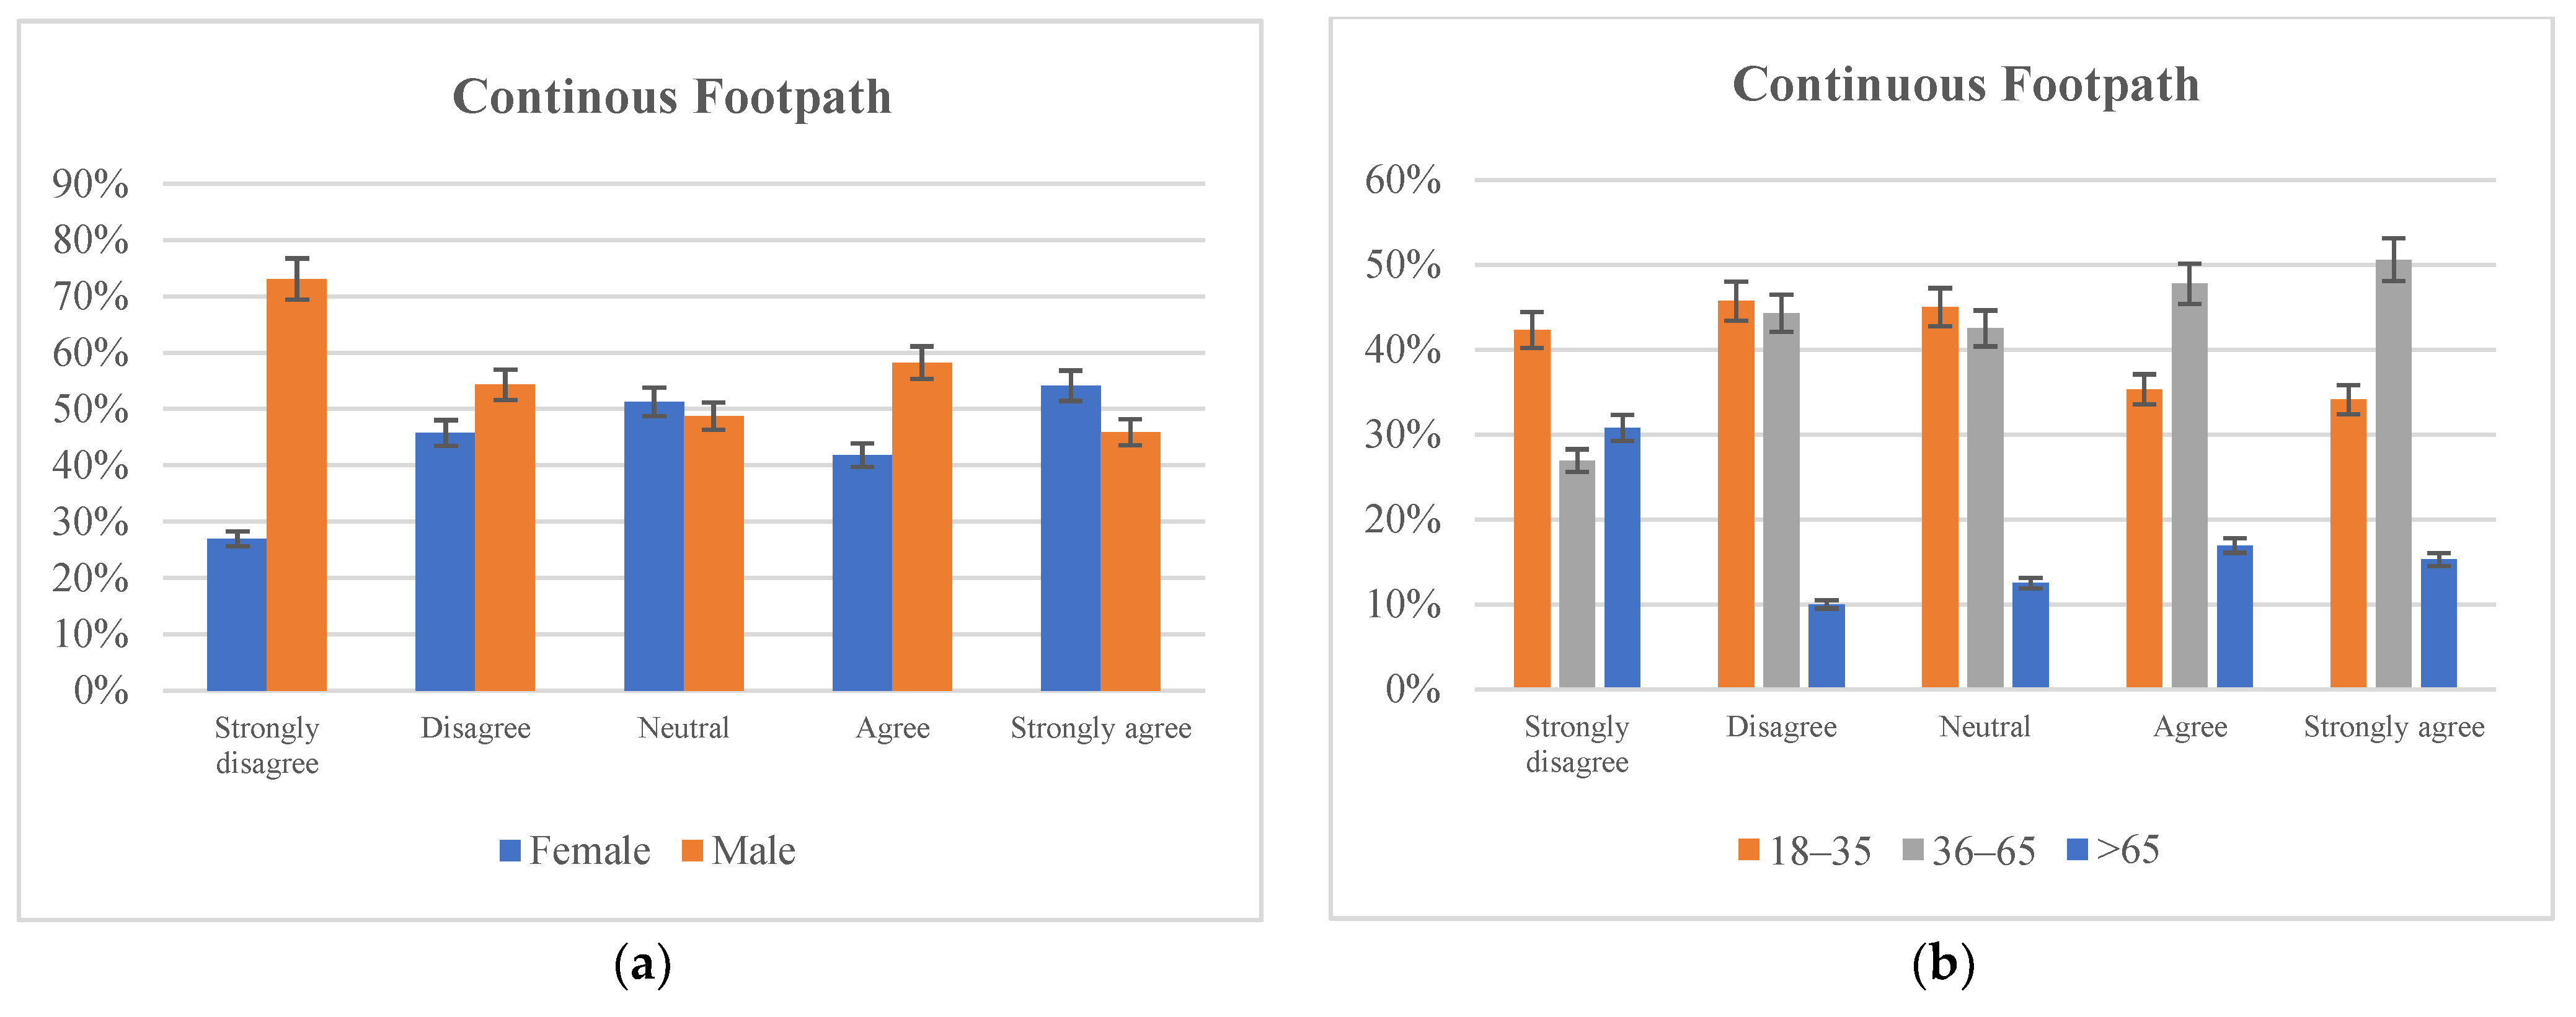
Based on the accumulated responses, it was found that male pedestrians were not happy with the continuity of footpaths as a higher percentage of them strongly disagree and a lesser percentage of them strongly agree to the availability of continuous footpaths on both sides of the street in the CBD as shown in Figure 5a. It was also evident that the elderly pedestrians were affected due to the discontinuity of footpaths as lesser percentages of them agree to the presence of continuous footpaths on both sides as shown in Figure 5b.
4.4. Pedestrian Flow
Overall pedestrian flow has been a significant factor in determining the suitability of the LOS, especially the impact that other pedestrians have on overall perceived comfort and the LOS of the given area. Based on the responses, it was apparent that two factors in terms of pedestrian flow that pedestrians found to be most impactful on the overall LOS were other slow-moving pedestrians and the flow of pedestrians coming in from the opposite direction.
Based on the responses, there was an even distribution with most pedestrians either agreeing or disagreeing with the statement. Responses indicated that 30% and 38% of respondents disagreed with the idea that other slow-moving pedestrians and pedestrians in the opposite direction rarely obstructed their path, respectively. With one of the central locations where data analysis occurred outside Flinders Street Station, the results may have been slightly skewed based on the data supplied by the City of Melbourne; this location sees one of the highest volumes of pedestrians in the CBD [37]. Figure 6a,b depicts the daily volume of pedestrians on 21 July 2021, and 2019, respectively, showing the impact that COVID-19 had on the overall volume of pedestrians. Based on the graph, the location has two prominent peaks, during 8–9 am and 5–6 pm, which coincides with business hours and pedestrians traveling to and from work. As the location where data collection occurred was one of the busiest locations, data collected may be skewed towards results where pedestrians were more inclined to answer negatively as the probability of pedestrians obstructing each other increases with an overall higher volume. Despite the impacts of COVID-19 heavily reducing overall pedestrian volumes by almost half, responses were still found to favour negativity, with respondents finding other pedestrians impeding their path and affecting their overall comfort.
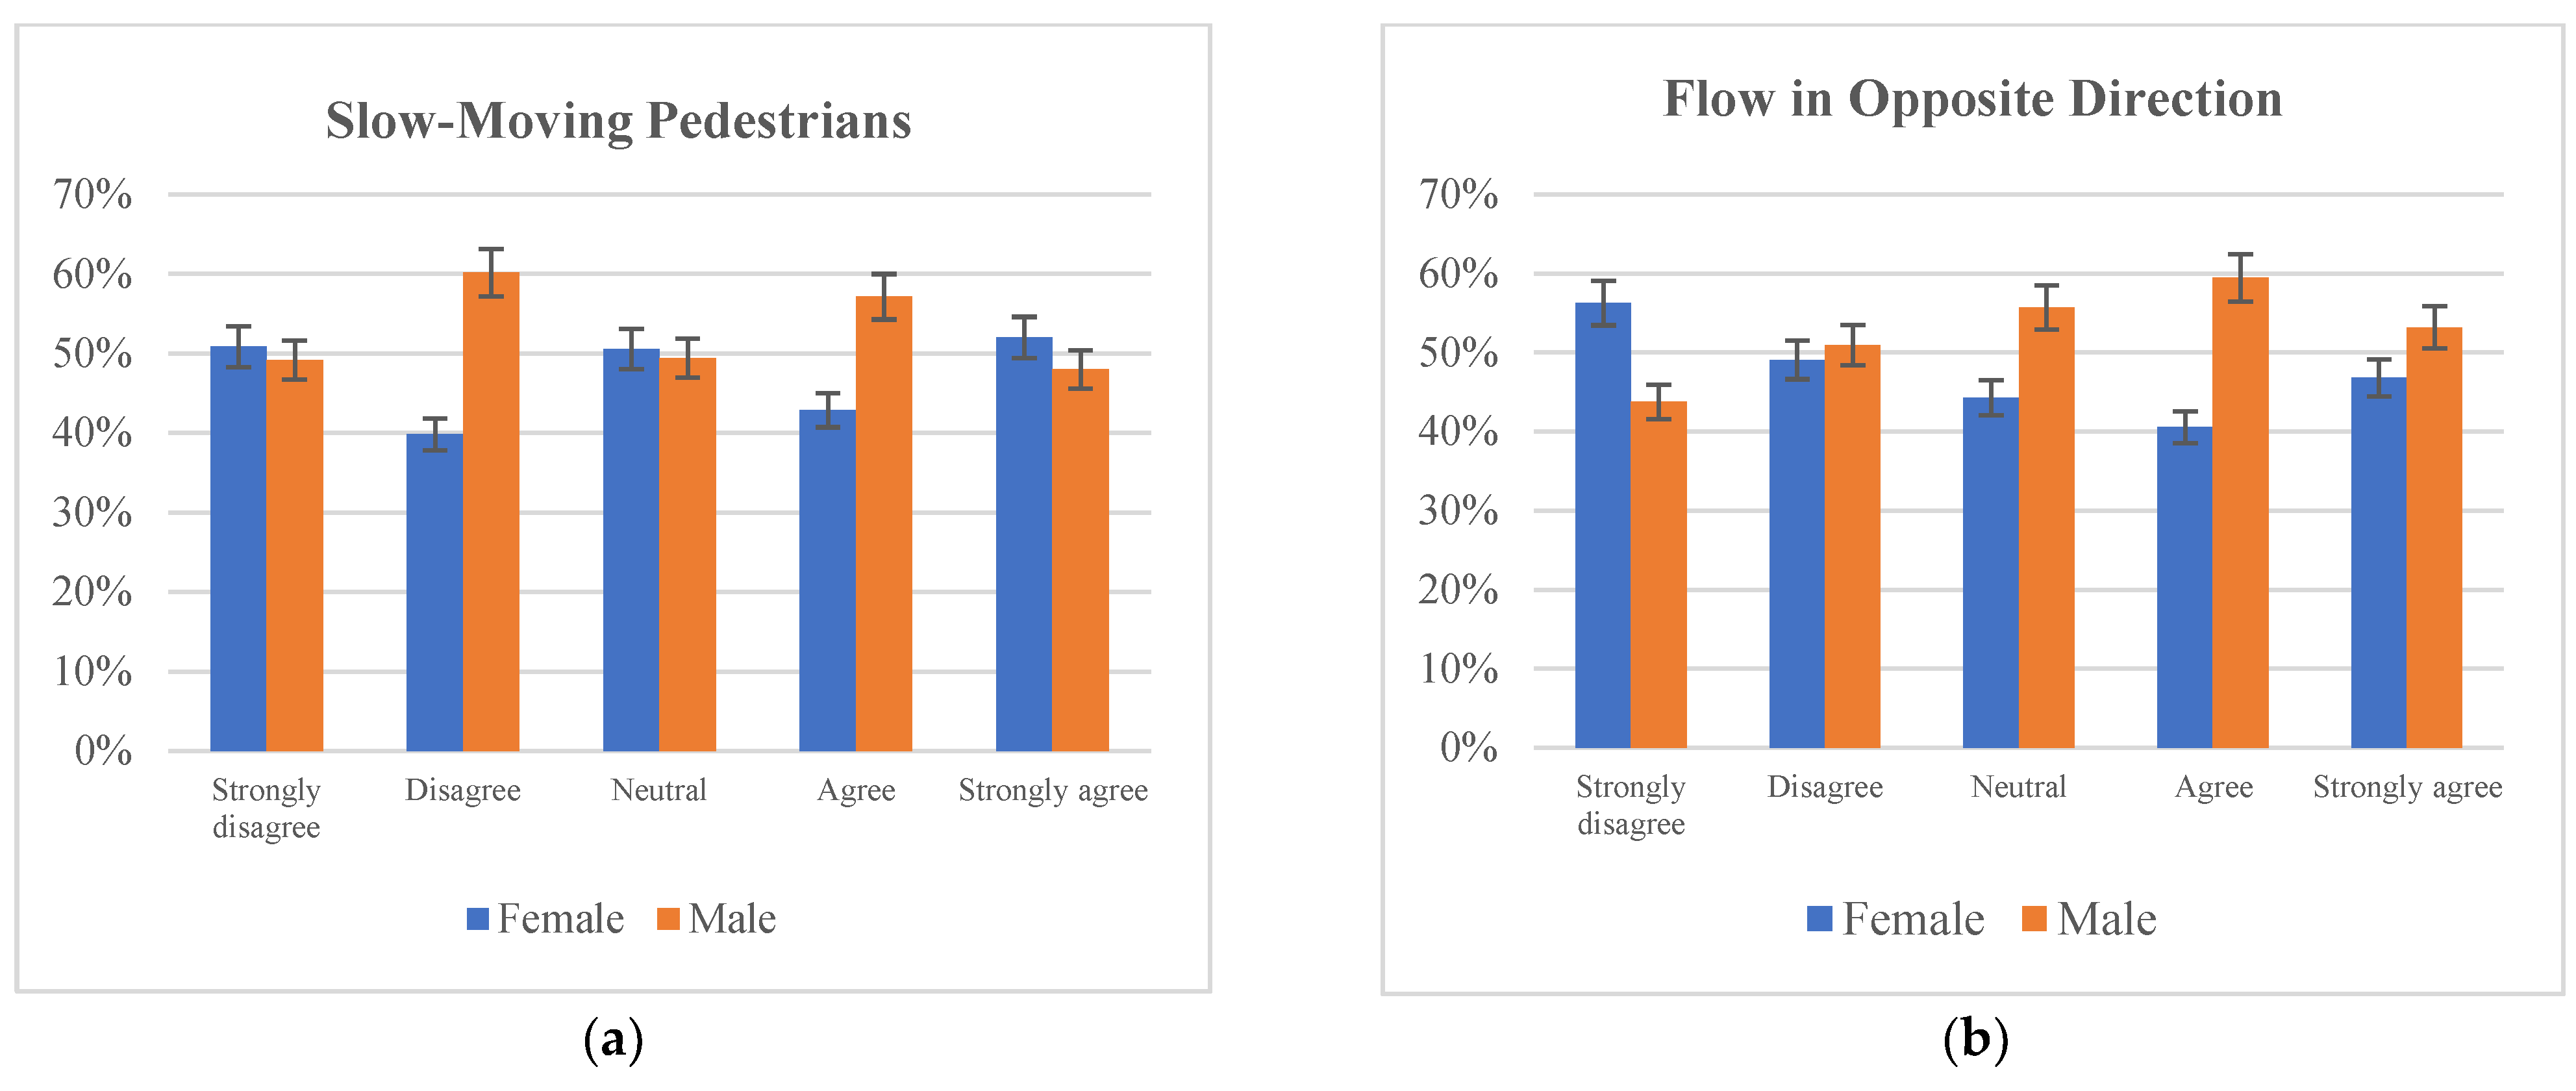
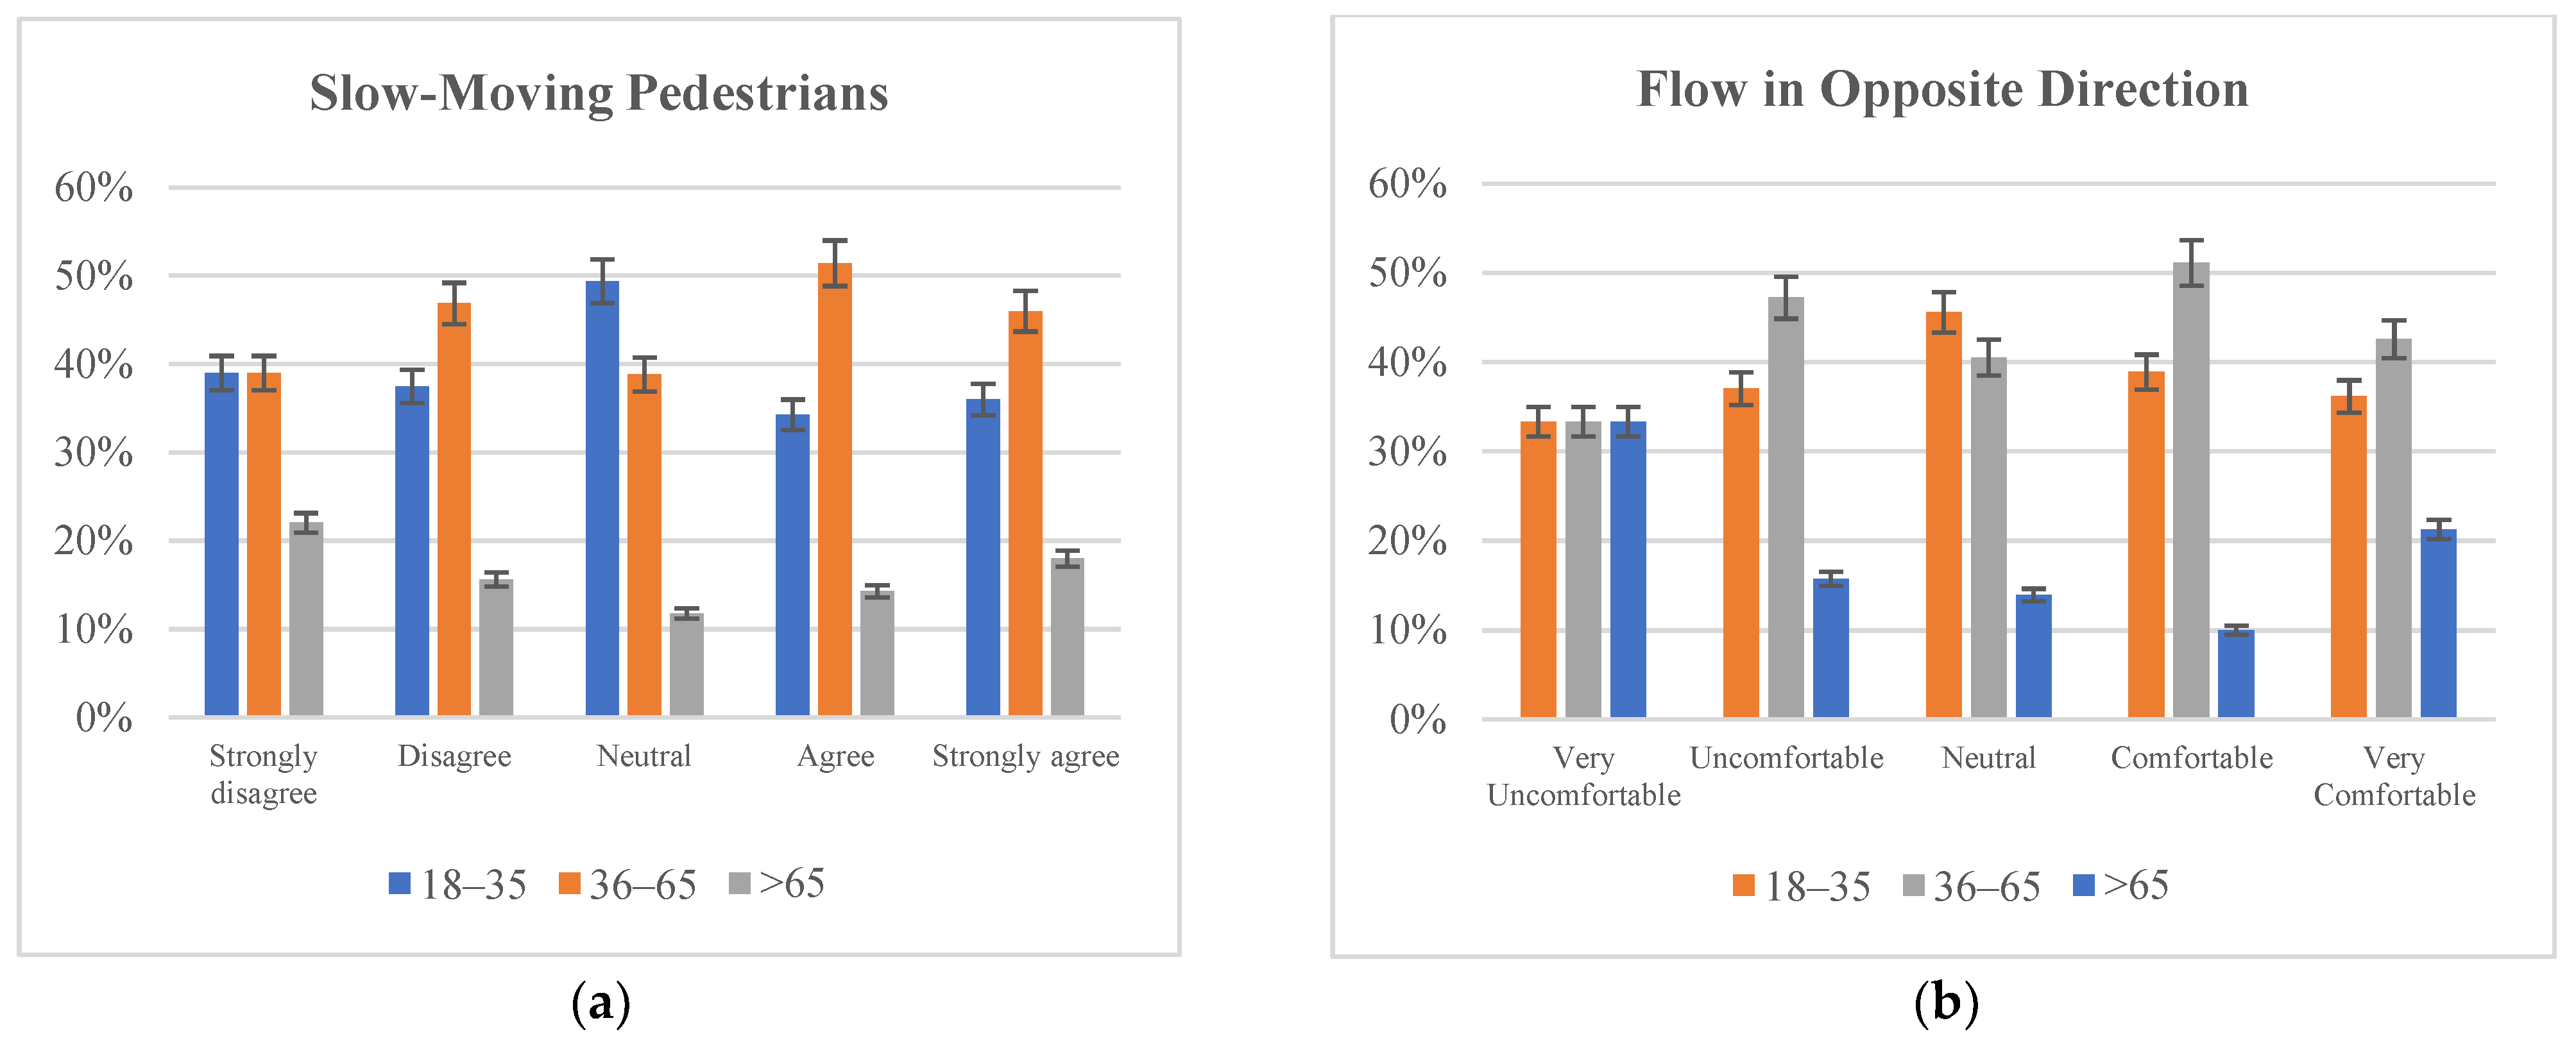
Based on the data collected, between the male and female pedestrians, the male pedestrians seem to agree more to the condition that flow of pedestrians is favorable for a good walking environment, than the female pedestrians as shown in Figure 7a,b. Trends could be analysed with middle-aged pedestrians favouring a more positive response with respect to the flow of pedestrians than other age demographics, as shown in Figure 8a,b. This may be partly due to middle-aged males having a higher average walking and crossing speed than females, followed by a younger demographic and the elderly [40]. As a result, the middle-aged males are less impacted by the fast flow of pedestrians on either direction whereas the females and elderly pedestrians who have less walking speed seem to be disturbed by the pedestrians coming from opposite direction and slow-moving pedestrians and phone users obstructing the footpath.
5. PLOS Model
After the data collection was finalised, or a substantial amount of data had been collected, ordinal regression was used to find the significant variables that affect the PLOS and hence the model to predict the LOS in similar scenarios. Due to the constraints placed by the Australian Government and the lockdowns that Victorians were facing, the number of surveys completed was not satisfactory, and the model’s accuracy could not be improved more than 54%. With the PLOS model being rated from A–E, A is the best possible grading for the PLOS, and E is the worst.
Table 3 shows the mean ratings and standard deviation for the responses received from the pedestrians for the survey questions.
5.1. Ordinal Logistic Regression
Ordinal logistic regression can analyse the interaction between independent and ordered dependent variables. It can interpret the odds that each group has a lower or higher value on the dependent variable. It involves making four assumptions: the dependent variable is ordinal, independent variables must be treated as either continuous or categorical, there is no multicollinearity between the predictor variables, and it has proportional odds. The log odds is also known as the logit. The ordinal regression model can be defined as,
where Y is the ordinal outcome and I is the number of categories. P (Y ≤ i) is the cumulative probability of I less than or equal to a specific class or category i = 1, 2, ……, I-1, and βi0, βi1, and βin coefficients of parameters, for n predictors. The proportional odds assumption indicates that the impact of independent variables is similar for each log of odds calculation. As the premise involves the assumption of parallel lines, the intercepts are different for each class or category, and the slopes are the same across all types; hence the equation can be re-written as:
Logit (P (Y ≤ i)) = βi0 + βi1 x1+………………..+ βn x n
Logit (P (Y ≤ i)) = βi0 + β1 x 1 +…………………..+ βn x n
In R, the ordinal logistic regression gives values of coefficients, intercepts, standard errors, and t-values. R parameterises the ordinal regression model as below,
where ηi = −βi
Logit (P (Y ≤ i)) = βi0 − η1 x 1 +…………………..− ηnx n
In R version 3.6.2, the ordinal logistic regression gives values of coefficients, intercepts, standard errors, and t-values. The value of the coefficient explains how the unit increase in the variable affects the response variable when other variables are held constant. The intercepts are the expected odds when other predictor variables are assigned a zero value. After the model is created, it is evaluated on the test data by creating a confusion matrix.
5.2. Results
All the variables mentioned in Table 3 were used in the ordinal regression model, and the standard error and p-values of the variables are shown in Table 4.
The coefficients of the ordinal regression model show that most variables tend to enhance the value of PLOS except for variables such as the presence of road verges, wider footpaths, slow-moving pedestrians, and the presence of personal space, which will reduce the value of PLOS. The accuracy of this model in predicting the PLOS for test data is about 47%. Since the p-values of some variables are more than 0.05, the model accuracy could be improved by considering only the significant variables whose p-values are less than 0.05. The most significant variables determined from Table 4 are pedestrian crowd, continuous footpath, opposite direction flow, and COVID-19 safe distance. The model is re-run by considering only the most significant variables that affect the PLOS, and the results are shown in Table 5. The significance of the variables is indicated by the insignificance of the p-values. The accuracy of predicting the PLOS using the significant variables for the test data was 54%.
Mathematically, the model equation can be written as,
Logit (P (Y ≤ 1)) = 0.804 − 0.737*Pedestrian Crowd − 0.325*Continuous footpath − 0.177*Opposite direction flow –0.454*Covidsafe distance
Logit (P (Y ≤ 2)) = 3.029 − 0.737*Pedestrian Crowd − 0.325*Continuous footpath − 0.177*Opposite direction flow –0.454*Covidsafe distance
Logit (P (Y ≤ 3)) = 5.092 − 0.737*Pedestrian Crowd − 0.325*Continuous footpath − 0.177*Opposite direction flow –0.454*Covidsafe distance
Logit (P (Y ≤ 4)) = 7.116 − 0.737*Pedestrian Crowd –0.325*Continuous footpath − 0.177*Opposite direction flow –0.454*Covidsafe distance
For any given set of ratings for ‘Pedestrian Crowd’, ‘Continuous footpath’, ‘Opposite direction flow’ and ‘Covidsafe distance’ the above equations will help to predict the rating of ‘Overall comfort’ or PLOS. P (Y ≤ 1) will give the probability value for PLOS E, P(Y ≤ 2) will return a probability value for PLOS D, P (Y ≤ 3) will give the probability value for those ratings to be aligned to PLOS C and finally P (Y ≤ 4) will give the probability for PLOS B. The sum of all the probability values subtracted from 1 will give the probability for PLOS A. The higher probability value will be the predicted PLOS for the given set of ratings. This model could be used in scenarios while evaluating the perceived LOS of footpaths where pedestrian feedback is essential to make necessary adjustments. It will also come in handy when new parameters such as COVID-19 safe distance and parameters which take subjective values have to be included in evaluating the PLOS of a facility for short-term changes in an area.
Using R version 3.6.2, the PLOS of test data can be calculated using the ‘predict’ function, and without using the above equations; the confusion matrix in Table 6 shows the number of times the model was able to predict the correct outcome. The results in Table 5 show that for every unit increase in ‘pedestrian crowd’ rating, we can expect a 0.74 increase in PLOS rating on the log odds scale provided all other variables in the model are held constant. Similarly, for every unit increase in the rating of ‘continuous footpath’, the log odds of expecting a higher PLOS rating would increase by 0.325, when all other variables remain constant. In addition, every unit increase in the rating for ‘Covidsafe distance’ will increase the expected value of the PLOS rating by 0.45 on a log odds scale while all the other variables are kept constant.
We thus find that the significant variables contributing to the PLOS rating in this model, which are the pedestrian density, continuous footpath and pedestrians coming from the opposite direction, are consistent with the previous studies. Pedestrian volume and flowrate have been considered for finding PLOS of urban off-street facilities and width of sidewalks along with pedestrian flow rates were found as significant variables for finding the PLOS of sidewalks [41,42]. Continuous sidewalk and absence of obstructions are factors considered for finding the PLOS of sidewalks using structural equation modelling [43]. Personal space and pedestrian evasive movements have been found to be significant variables for finding the PLOS of sidewalks in Korea, which is similar to COVID-19 safe distance and pedestrian flow from the opposite direction being considered significant in the current research [25]. Personal space has been a main factor in evaluating the PLOS using disaggregated methods in various facilities [44]. During COVID-19, it is noted that this variable has been replaced by COVID-19 safe distance as pedestrian personal space was not found to be correlated with overall comfort (PLOS) during the pandemic. A study conducted in Italy has shown that the PLOS has been impacted during COVID-19 due to social distancing, and hence there is a need for increase in effective walkway width. The suggestions for creating new urban spaces and widening of pathways has been brought to the attention of urban design and policy makers [45].
Further to the misclassification error rate of test data which is 0.46, the confusion matrix in Table 6 shows that the most misclassification happens with PLOS B and C, which are mentioned as 4 and 3, with the largest misclassification happening for class C. PLOS A has hardly any item in the test data and shows zero; PLOS D and E have lesser data, too, as the total data collected for those service levels are also less.
To evaluate the PLOS, by applying traditional methods such as HCM (2010) [4], pedestrian space (m2/pedestrian), pedestrian speed (m/s) and pedestrian unit flow rate (pedestrians/min/m) will be considered. These are field measurements and does not consider the diversity in pedestrian feelings and comfort. Whereas the method suggested in this research will be useful in situations where diverse kinds of pedestrians use the sidewalk and personal preferences such as social distancing impact the comfort of walking.
6. Conclusions and Future Research Directions
This research study aimed to present the methodology involved in formulating a PLOS model and to assess how the change in social climate due to COVID-19 has impacted the PLOS and pedestrian behaviour during the pandemic. An extensive literature review was performed by finding the various components involved in examining the LOS of pedestrians in mid-blocks and intersections. These components are studied under various factors affecting the PLOS, giving a thorough understanding of different data collection and analysis methods. In the past, only quantitative variables such as pedestrian density and speed were considered for LOS calculation, mirroring the variables used for finding the LOS of roads. In the recent past, qualitative variables such as pedestrian perception of various factors has been considered by collecting pedestrian data through questionnaire surveys. In this study, a similar approach is used by adopting a questionnaire survey to collect information from pedestrians about their perception of various walkway features and traffic conditions. Hence the variables used for measuring PLOS are only qualitative. This article focuses mainly on the effect of COVID-19 on pedestrian behaviour which can only be collected through direct interaction with pedestrians.
Through the collation of a questionnaire survey, an understanding of current pedestrian comfort levels and their perception of the current LOS were consolidated during COVID-19. An in-depth analysis was performed on the collated data points, with clear findings that there were apparent differences in response depending on age and gender. Based on the analysis performed, a statistical model was generated outlining four variables that impacted the overall comfort of pedestrians the most, based on the collected data points: pedestrian crowd or density, continuous footpath, COVID-19 safe distance, and opposite direction flow of pedestrians. This kind of methods can be used for decision making while implementing sustainable mobility plans and sharing mobility plans during an epidemic [46].
The current model developed has been reflective of the situation in developed countries where it is mandatory for pedestrian networks to adhere to the safety design and policies, but comfort is the factor of concern for most pedestrians. Hence, in this research overall comfort is considered as the PLOS unlike previous research where safety and comfort perception of pedestrians are considered to be PLOS. Melbourne is a city with mixed socio-demographic pedestrians where people come from various countries and cultural backgrounds. These factors may cause a difference in the comfort experienced by its footpath users. The varied response from different gender and age groups displayed in the data analysis section proves that it is worth conducting this type of study in Victoria.
Although the work completed thus far has provided a good base for evaluating the change in perceptions resulting from the pandemic and how this has affected the PLOS, limitations in the conducted research need to be addressed in future research. Several areas were found to be a limiting factor of this research project and should be considered for any future research. A higher accumulation of sample size is needed. With a more significant amount of data points in the study, and more balanced classes of data for PLOS A to E, a more accurate model can be generated, which would be most reflective of the current status of pedestrian perception on the PLOS. Data collection could be spread over more periods, accounting for variation in weather and opinion. A more significant amount of time during the data collection phase could accumulate a more significant subset of data to create a model that can account for more substantial variance in gender, occupation, and age demographic. Increasing the grading scale from a 1–5 rating to a 1–6 rating can remove neutral answers and force pedestrians to agree or disagree with the statement. It will help to interpret the results of the model better. Another limitation that can be improved is that the results reflect the current circumstances in Melbourne and Victoria and are not reflective of other cities and countries. The results expressed here may not be indicative of the situation in other countries, where the findings may be different.
Author Contributions
Conceptualization, D.P. and S.M.; methodology, D.P. and S.M.; software, D.P.; validation, D.P.; formal analysis, D.P.; investigation, S.M.; resources, D.P. and L.A.N.; data curation, D.P.; writing—original draft preparation, D.P. and L.A.N.; writing—review and editing, D.P. and S.M.; visualization, D.P.; supervision, S.M.; project administration, D.P. and S.M. All authors have read and agreed to the published version of the manuscript.
Funding
This research received no external funding.
Institutional Review Board Statement
The study was conducted in accordance with the National Statement on Ethical Conduct in Human Research and approved by the RMIT University College Human Ethics Advisory Network (CHEAN) (project number 24001, approved on the 25 February 2021).
Informed Consent Statement
Informed consent was obtained from all subjects involved in the study.
Data Availability Statement
The data that support the findings of this study are available from the corresponding author upon reasonable request.
Conflicts of Interest
The authors declare no conflict of interest related to this work.
References
- Wefering, F.; Rupprecht, S.; Bührmann, S.; Bohler-Baedeker, S. Guidelines—Developing and Implementing a Sustainable Urban Mobility Plan; Rupprecht Consult-Forschung und Beratung GmbH: Berlin, Germany, 2013. [Google Scholar]
- Mayor of London. Green Transport. 2018. Available online: https://www.london.gov.uk/what-we-do/transport/green-transport (accessed on 20 October 2021).
- Gallin, N. Quantifying Pedestrian Friendliness—Guidelines for Assessing Pedestrian Level of Service. Road Transp. Res. 2001, 10, 47. [Google Scholar]
- HCM. Highway Capacity Manual; Transportation Research Board: Washington, DC, USA, 2010. [Google Scholar]
- Lazou, O.; Sakellariou, A.; Basbas, S.; Paschalidis, E.; Politis, I. Assessment of LOS at pedestrian streets and qualitative factors. A pedestrians’ perception approach. In Proceedings of the 7th International Congress on Transportation Research, Athens, Greece, 14–15 April 2015. [Google Scholar]
- Jaskiewicz, F. Pedestrian level of service based on trip quality. In Transportation Research Circular; Transportation Research Board: Washington, DC, USA, 2000. [Google Scholar]
- Kadali, B.R.; Vedagiri, P. Evaluation of pedestrian crosswalk level of service (LOS) in perspective of type of land-use. Transp. Res. Part A Policy Pract. 2015, 73, 113–124. [Google Scholar] [CrossRef]
- Ambrey, C.L. Walkable neighbourhoods, physical activity and well-being in Melbourne, Australia. In Proceedings of the 7th State of Australian Cities Conference, Gold Coast, Australia, 9–11 December 2015. [Google Scholar]
- Alfonzo, M.A. To walk or not to walk? The hierarchy of walking needs. Environ. Behav. 2005, 37, 808–836. [Google Scholar] [CrossRef]
- Vos, J. The effect of COVID-19 and subsequent social distancing on travel behavior. Transp. Rev. Interdiscip. Perspect. 2020, 5, 100121. [Google Scholar] [CrossRef]
- Abdullah, M.; Dias, C.; Muley, D.; Shahin, M. Exploring the impacts of COVID-19 on travel behavior and mode preferences. Transp. Rev. Interdiscip. Perspect. 2020, 8, 100255. [Google Scholar] [CrossRef]
- Giles-Corti, B.; Mavoa, S.; Eagleson, S.; Davern, M.; Roberts, B.; Badland, H.M. Transport Walkability Index: Melbourne; McCaughey VicHealth Centre for Community Wellbeing, The University of Melbourne: Melbourne, Australia, 2014. [Google Scholar]
- Su, S.; Zhou, H.; Xu, M.; Ru, H.; Wang, W.; Weng, M. Auditing Street walkability and associated social inequalities for planning implications. J. Transp. Geogr. 2019, 74, 62–76. [Google Scholar] [CrossRef]
- D’Orso, G.; Migliore, M. A GIS-based method for evaluating the walkability of a pedestrian environment and prioritised investments. J. Transp. Geogr. 2020, 82, 102555. [Google Scholar] [CrossRef]
- Cepolina, E.M.; Menichini, F.; Gonzalez Rojas, P. Level of service of pedestrian facilities: Modelling human comfort perception in the evaluation of pedestrian behaviour patterns. Transp. Res. Part F Traffic Psychol. Behav. 2018, 58, 365–381. [Google Scholar] [CrossRef]
- Hamidi, S.; Moazzeni, S. Examining the Relationship between Urban Design Qualities and Walking Behavior: Empirical Evidence from Dallas, TX. Sustainability 2019, 11, 2720. [Google Scholar] [CrossRef] [Green Version]
- Talavera-Garcia, R.; Pérez-Campaña, R. Applying a Pedestrian Level of Service in the context of Social Distancing: The Case of the City of Madrid. Int. J. Environ. Res. Public Health 2021, 18, 11037. [Google Scholar] [CrossRef]
- Nag, D.; Goswami, A.; Gupta, A.; Sen, J. Assessing urban sidewalk networks based on three constructs: A synthesis of pedestrian level of service literature. Transp. Rev. 2020, 40, 204–240. [Google Scholar] [CrossRef]
- Georgiou, A.; Skoufas, A.; Basbas, S. Perceived pedestrian level of service in an urban central network: The case of a medium size Greek city. Case Stud. Transp. Policy 2021, 9, 889–905. [Google Scholar] [CrossRef]
- Landis, B.; Varrikuti, V.; Ottenberg, R.; Mcledo, D.; Guttenplan, M. Modeling the roadside walking environment: Pedestrian level of service. Transp. Res. Rec. 2001, 1773, 82–88. [Google Scholar] [CrossRef]
- Petritsch, T.; Landis, B.; McLeod, P.; Huang, H.; Challa, S.; Skaggs, C.; Guttenplan, M.; Vattikuti, V. Pedestrian Level-of-Service Model for Urban Arterial Facilities with Sidewalks. Transp. Res. Rec. 2006, 1982, 84–89. [Google Scholar] [CrossRef]
- Lam, W.; Lee, J.; Cheung, C. A study of the bi-directional pedestrian flow characteristics at Hong Kong signalized crosswalk facilities. Transportation 2002, 29, 169–192. [Google Scholar] [CrossRef]
- Lee, J.; Goh, P.; Lam, W. New Level-of-Service Standard for Signalized Crosswalks with Bi-Directional Pedestrian Flows. J. Transp. Eng. 2005, 131, 957–960. [Google Scholar] [CrossRef]
- Kim, S.; Choi, J.; Kim, Y. Determining the sidewalk pavement width by using pedestrian discomfort levels and movement characteristics. KSCE J. Civ. Eng. 2011, 15, 883–889. [Google Scholar] [CrossRef]
- Kim, S.; Choi, J.; Kim, S.; Tay, R. Personal space, evasive movement and pedestrian level of service. J. Adv. Transp. 2014, 48, 673–684. [Google Scholar] [CrossRef]
- Christopoulou, P.; Pitsiava-Latinopoulou, M. Development of a Model for the Estimation of Pedestrian Level of Service in Greek Urban Areas. Procedia Soc. Behav. Sci. 2012, 48, 1691–1701. [Google Scholar] [CrossRef] [Green Version]
- Zhao, L.; Bian, Y.; Lu, J.; Rong, J. Method to Determine Pedestrian Level of Service for the Overall Unsignalized Midblock Crossings of Road Segments. Adv. Mech. Eng. 2015, 6, 652986. [Google Scholar] [CrossRef]
- Nikiforiadis, A.; Basbas, S.; Garyfalou, M. A methodology for the assessment of pedestrians-cyclists shared space level of service. J. Clean. Prod. 2020, 254, 120172. [Google Scholar] [CrossRef]
- Hummer, J.; Rouphail, N.; Hughes, R.; Fain, S.; Toole, J.; Patten, R.; Schneider, R.; Monahan, J.; Do, A. User perceptions of the quality of service on shared paths. Transp. Res. Rec 2005, 1, 28–36. [Google Scholar] [CrossRef]
- Jensen, S.U. Pedestrian and Bicycle Level of Service at Intersections, Roundabouts, and other Crossings. In Proceedings of the 92nd Annual Meeting of the Transportation Research Board, Washington, DC, USA, 13–17 January 2013. [Google Scholar]
- Gopalakrishnan, A.; Ram, S.; Sarkar, P. Development of Composite Level of Service for Signalized Intersections Under Heterogeneous Traffic Conditions. Transp. Dev. Econ. 2019, 5, 1–11. [Google Scholar] [CrossRef]
- Transport for London. Pedestrian Comfort Guidance London, Guidance Document, First Edition 2010. Available online: https://content.tfl.gov.uk/pedestrian-comfort-guidance-technical-guide.pdf (accessed on 20 May 2021).
- Zacharias, J. Pedestrian Behavior and Perception in Urban Walking Environments. J. Plan. Lit. 2001, 16, 3–18. [Google Scholar] [CrossRef]
- Maestracci, M.; Prochasson, F.; Vanni, D.; Pene, C.; Louvet, N. Analyzing Behaviour to Increase the Safety of Pedestrian-Movements; Association for European Transport: London, UK, 2010. [Google Scholar]
- McIlroy, R.; Nam, V.; Bunyasi, B.; Jikyong, U.; Kokwaro, G.; Wu, J.; Hoque, M.; Plant, K.; Preston, J.; Stanton, N. Exploring the relationships between pedestrian behaviours and traffic safety attitudes in six countries. Transp. Res. Part F Traffic Psychol. Behav. 2020, 68, 257–271. [Google Scholar] [CrossRef]
- City of Melbourne. (2019). Daily Population Estimates Summary Report 2019. Available online: https://www.melbourne.vic.gov.au/SiteCollectionDocuments/daily-population-estimates-summary-2019.pdf (accessed on 16 December 2022).
- City of Melbourne. (2021). Pedestrian Counting System. Available online: http://www.pedetrian.mebourne.vic.gov.au/#date=09-05-2021&time=13 (accessed on 10 May 2022).
- Choi, J.; Kim, S.; Kim, S.; Jin, M.; Kim, Y.; Kim, J. Pedestrian Conflicts, Pedestrian Comfort Levels, and Current Pedestrian Levels of Service. In Pedestrian and Evacuation Dynamics; Weidmann, U., Kirsch, U., Schreckenberg, M., Eds.; Springer: Cham, Switzerland, 2014. [Google Scholar] [CrossRef]
- Victoria Walks. Assessing Walkability, Footpaths. 2022. Available online: https://www.victoriawalks.org.au/Footpaths/ (accessed on 10 October 2021).
- Goh, B.H.; Subramaniam, K.; Wai, Y.T.; Mohamed, A.A. Pedestrian Crossing Speed: The Case of Malaysia. Int. J. Traffic Transp. Eng. 2021, 2, 323–332. [Google Scholar] [CrossRef] [Green Version]
- Sahani, R.; Bhuyan, P.K. Pedestrian Level of Service Criteria for Urban Off-Street Facilities in Mid-Sized Cities. Transport 2014, 32, 221–232. [Google Scholar] [CrossRef] [Green Version]
- Zhao, L.; Bian, Y.; Rong, J.; Liu, X.; Shu, S. Evaluation method for pedestrian level of service on sidewalks based on fuzzy neural network model. J. Intell. Fuzzy Syst. 2016, 30, 2905–2913. [Google Scholar] [CrossRef]
- Bivina, G.R.; Parida, M. Modelling Perceived Pedestrian Level of Service of Sidewalks: A Structural Equation Approach. Transport 2019, 34, 339–350. [Google Scholar] [CrossRef] [Green Version]
- Cepolina, E.M. Pedestrian Level of Service: The Impact of Social Groups on Pedestrian Flow Characteristics. Int. J. Sustain. Dev. Plan. 2017, 12, 839–848. [Google Scholar] [CrossRef]
- Cirianni, F.M.M.; Comi, A.; Luongo, A.S. A sustainable approach for planning of urban pedestrian’s routes and footpaths in a pandemic scenario. Evidence from Italian cities. Tema. J. Land Use Mobil. Environ. 2022, 15, 125–140. [Google Scholar] [CrossRef]
- Barbarossa, L. The Post Pandemic City: Challenges and Opportunities for a Non-Motorized Urban Environment. An Overview of Italian Cases. Sustainability 2020, 12, 7172. [Google Scholar] [CrossRef]
Figure 1.
Daily city users of Melbourne CBD in 2019 [36].
Figure 1.
Daily city users of Melbourne CBD in 2019 [36].

Figure 2.
(a) Pedestrian survey locations marked in blue colour [37]. (b) Map of Melbourne Central Business District [37].

Figure 3.
(a) Gender distribution of responses for Pedestrian Crowd (b) Age distribution of responses for Pedestrian Crowd.
Figure 3.
(a) Gender distribution of responses for Pedestrian Crowd (b) Age distribution of responses for Pedestrian Crowd.

Figure 4.
(a) Gender distribution of responses for social distancing (b) Age distribution of responses for social distancing.
Figure 4.
(a) Gender distribution of responses for social distancing (b) Age distribution of responses for social distancing.

Figure 5.
(a) Gender distribution of responses for continuous footpath (b) age distribution of responses for continuous footpath.
Figure 5.
(a) Gender distribution of responses for continuous footpath (b) age distribution of responses for continuous footpath.

Figure 6.
(a) Flinders Street underpass pedestrian count, 2021 [37] (b) Flinders Street underpass pedestrian count, 2019 [36].

Figure 7.
(a) Gender distribution for slow moving pedestrians (b) Gender distribution for opposite direction flow.
Figure 7.
(a) Gender distribution for slow moving pedestrians (b) Gender distribution for opposite direction flow.

Figure 8.
(a) Age distribution for slow moving pedestrians (b) Age distribution for opposite direction flow.
Figure 8.
(a) Age distribution for slow moving pedestrians (b) Age distribution for opposite direction flow.


Table 1.
Pedestrian service quality models—State of the art.
| Reference | Variables Used | Study Area |
|---|---|---|
| Landis et al. (2001) [20] | The main factors that contributed to pedestrian comfort were the volume of motor vehicles, speed of the motor vehicles, lateral separation, and the pedestrian rating of LOS. | Pensacola, Florida |
| Lam et al. (2002) [22] | Pedestrian flow rate at locations of bi-directional and uni-directional flow | Hong Kong, China |
| Lee et al. (2005) [23] | Pedestrian flow rate and speed at locations of bi-directional flow in addition to pedestrian’s perception of flow rate by questionnaire survey | Hong Kong, China |
| Kim et al. (2011) [24] | Effective walkway width and pedestrian perception of PLOS and VLOS | Seoul, Korea |
| Kim et al. (2014) [25] | Effective walkway width, number of evasive movements, pedestrian volume, and the top two important factors among pedestrian facilities, pedestrian rating of LOS | Seoul, Korea |
| Christopoulou and Pitsiava-Latinopoulou (2012) [26] | Traffic factors, geometry/environmental/sidewalk factors, and pedestrian movement factors | Thessaloniki, Greece |
| Zhao et al. (2015) [27] | Traffic conflicts, crossing facilities, delays, the distance between marked and unmarked crosswalks, and pedestrian’s perception of safety and convenience | China |
| Nikiforiadis et al. (2020) [28] | Pedestrian flow rate, bicycle flow rate, and the number of events happening between bicycles and pedestrians such as ‘delayed passing’, ‘passing a pedestrian’, ‘meeting a pedestrian’, ‘being passed by a cyclist’, etc. | Thessaloniki, Greece |
| Jensen (2012) [30] | Variables such as type, width, and height of pedestrian and bicycle facility, length of the crossing, size of the roundabout, the width of roadway, traffic volume, waiting time, and speed limit | USA |
| Gopalakrishnan et al. (2019) [31] | Pedestrian volume, pedestrian delay, vehicle volume, vehicle delays, and cycle time. | India |
| TFL (2010) [32] | Traffic volume, on-street parking, footpath, roadway width, traffic regulations, and the number of lanes | London |
Table 2.
Descriptive statistics of categorical variables used in the study.
| Variable Name | Description | Values | Frequency |
|---|---|---|---|
| Location | Survey location | 1. Flinders Street station | 70% (324) |
| 2. Southern cross station | 16% (73) | ||
| 3. RMIT 80 | 14% (65) | ||
| Gender | Gender of respondents | 0. Male | 54% (251) |
| 1. Female | 46% (211) | ||
| TripPurpose | Trip purpose of respondents | 1. Education | 17% (77) |
| 2. Work | 40% (184) | ||
| 3. Recreation | 40% (188) | ||
| 4. Other | 3% (13) | ||
| SocialDistancing | Pedestrians follow social distancing on the sidewalk | 0. No | 19% (90) |
| 1. Yes | 81% (372) | ||
| AgeGroup | Age of respondents | 0. 18–35 | 38% (179) |
| 1. 36–50 | 27% (126) | ||
| 2. 51–65 | 19% (86) | ||
| 3. >65 | 16% (71) | ||
| ComfortDistance | Comfort distance of a pedestrian from other pedestrians on the sidewalk | 0. 0–1 | 17% (78) |
| 1. 1–1.5 | 55% (252) | ||
| 2. 1.5–2 | 23% (107) | ||
| 3. >2 | 5% (25) | ||
| PedestrianCrowd | Pedestrian’s feeling of comfort with respect to other pedestrians around them | 1.Very uncomfortable | 2% (10) |
| 2.UnComfortable | 5% (24) | ||
| 3.Neutral | 8% (38) | ||
| 4. Comfortable | 47% (218) | ||
| 5.Very comfortable | 38% (172) | ||
| VehicleVolume | Pedestrian’s feeling of comfort with respect to cars and vehicles on the road next to them | 1.Very uncomfortable | 1% (6) |
| 2.UnComfortable | 7% (35) | ||
| 3. Neutral | 17% (76) | ||
| 4. Comfortable | 45% (208) | ||
| 5. Very comfortable | 30% (136) | ||
| Continuous Footpath | Footpaths are continuous on both sides of the road | 1. Strongly disagree | 3% (13) |
| 2. Disagree | 8% (39) | ||
| 3. Neutral | 10% (45) | ||
| 4. Agree | 50% (231) | ||
| 5. Strongly agree | 29% (134) | ||
| Wide Footpath | Footpaths are wide enough to walk | 1. Strongly disagree | 4% (17) |
| 2. Disagree | 8% (39) | ||
| 3. Neutral | 7% (32) | ||
| 4. Agree | 43% (198) | ||
| 5. Strongly agree | 38% (176) | ||
| FootpathSurface | Footpath surface is safe and in good condition | 1. Strongly disagree | 4% (21) |
| 2. Disagree | 12% (55) | ||
| 3. Neutral | 16% (75) | ||
| 4. Agree | 47% (216) | ||
| 5. Strongly agree | 21% (95) | ||
| Lighting | Street and footpath lighting are always good | 1. Strongly disagree | 2% (11) |
| 2. Disagree | 7% (32) | ||
| 3. Neutral | 13% (60) | ||
| 4. Agree | 45% (207) | ||
| 5. Strongly agree | 33% (152) | ||
| Nonslippery | Footpaths are not slippery even after rain | 1. Strongly disagree | 16% (68) |
| 2. Disagree | 23% (108) | ||
| 3. Neutral | 24% (113) | ||
| 4. Agree | 31% (145) | ||
| 5. Strongly agree | 6% (28) | ||
| RoadVerge | Road verge is present on footpaths | 1. Strongly disagree | 19% (88) |
| 2. Disagree | 29% (136) | ||
| 3. Neutral | 16% (75) | ||
| 4. Agree | 26% (116) | ||
| 5. Strongly agree | 10% (47) | ||
| StreetBenches | Street benches are widely available | 1. Strongly disagree | 10% (48) |
| 2. Disagree | 23% (107) | ||
| 3. Neutral | 21% (95) | ||
| 4. Agree | 34% (155) | ||
| 5. Strongly agree | 12% (57) | ||
| StreetVendors | Street vendors and outdoor seating are not disturbing to walk | 1. Strongly disagree | 3% (16) |
| 2. Disagree | 11% (52) | ||
| 3. Neutral | 15% (70) | ||
| 4. Agree | 43% (196) | ||
| 5. Strongly agree | 28% (128) | ||
| OnstreetParking | On-street parking does not affect visibility | 1. Strongly disagree | 10% (44) |
| 2. Disagree | 19% (86) | ||
| 3. Neutral | 20% (93) | ||
| 4. Agree | 35% (166) | ||
| 5. Strongly agree | 16% (73) | ||
| Slowmoving Pedestrians | Slow-moving pedestrians rarely block the footpath | 1. Strongly disagree | 13% (59) |
| 2. Disagree | 28% (128) | ||
| 3. Neutral | 18% (85) | ||
| 4. Agree | 30% (140) | ||
| 5. Strongly agree | 11% (50) | ||
| OppositedirectionFlow | Pedestrians in the opposite direction rarely get in the way | 1. Strongly disagree | 10% (48) |
| 2. Disagree | 23% (108) | ||
| 3. Neutral | 17% (79) | ||
| 4. Agree | 40% (180) | ||
| 5. Strongly agree | 10% (47) | ||
| PersonalSpace | A comfortable personal space can always be maintained | 1. Strongly disagree | 8% (38) |
| 2. Disagree | 19% (86) | ||
| 3. Neutral | 17% (80) | ||
| 4. Agree | 41% (190) | ||
| 5. Strongly agree | 15% (68) | ||
| Detours | Detours on footpaths due to roadworks are minimal | 1. Strongly disagree | 17% (80) |
| 2. Disagree | 20% (91) | ||
| 3. Neutral | 21% (97) | ||
| 4. Agree | 33% (153) | ||
| 5. Strongly agree | 9% (41) | ||
| ConstructionSites | Safe passage is available when footpaths are occupied by construction sites | 1. Strongly disagree | 5% (25) |
| 2. Disagree | 12% (56) | ||
| 3. Neutral | 15% (71) | ||
| 4. Agree | 49% (224) | ||
| 5. Strongly agree | 19% (86) | ||
| CovidsafeDistance | It is always possible to maintain COVID-19 safe social distancing (1.5 m) | 1. Strongly disagree | 15% (67) |
| 2. Disagree | 22% (103) | ||
| 3. Neutral | 13% (58) | ||
| 4. Agree | 31% (146) | ||
| 5. Strongly agree | 19% (88) | ||
| Overallcomfort (PLOS) | Overall comfort of walking on the footpath | 1. Very poor (E) | 3% (13) |
| 2. Poor (D) | 11% (52) | ||
| 3. Average (C) | 41% (190) | ||
| 4. Good (B) | 33% (151) | ||
| 5. Very Good (A) | 12% (56) |
Table 3.
Mean and standard deviation of variables.
| No. | Question | M | SD |
|---|---|---|---|
| 1 | Pedestrian crowd | 4.13 | 0.92 |
| 2 | Speed and volume of vehicles | 3.94 | 0.95 |
| 3 | Width of footpaths | 4.05 | 1.05 |
| 4 | Continuous footpaths | 3.53 | 1.13 |
| 5 | Footpath surface | 3.67 | 1.07 |
| 6 | Street and footpath lighting | 4.00 | 0.99 |
| 7 | Footpaths are non-slippery | 2.90 | 1.18 |
| 8 | Road verge | 2.79 | 1.29 |
| 9 | Street benches | 3.15 | 1.21 |
| 10 | Street vendors and outdoor seating | 3.81 | 1.08 |
| 11 | On-street parking | 3.31 | 1.21 |
| 12 | Slowing moving pedestrians | 3.01 | 1.24 |
| 13 | Pedestrians in the opposite direction | 3.16 | 1.19 |
| 14 | Personal space | 3.36 | 1.18 |
| 15 | Detours | 2.95 | 1.27 |
| 16 | Safe passage in construction sites | 3.62 | 1.09 |
| 17 | Social distancing or COVID-19 safe distance | 4.27 | 1.02 |
| 18 | Overall comfort | 4.31 | 1.02 |
M-Mean; SD—standard deviation.
Table 4.
Coefficients, t-value, standard deviation error, and p-value of all variables.
| Qualitative Variables | Value | Std Error | t-Value | p-Value |
|---|---|---|---|---|
| Pedestrian crowd | 0.712 | 0.134 | 5.304 | 000 * |
| Vehicle volume | 0.015 | 0.122 | 0.129 | 0.897 |
| Wide footpaths | −0.044 | 0.109 | −0.407 | 0.683 |
| Continuous footpath | 0.235 | 0.096 | 2.416 | 0.015 * |
| Footpath surface | 0.144 | 0.113 | 1.271 | 0.203 |
| Lighting | 0.138 | 0.121 | 1.141 | 0.253 |
| Buffers | 0.096 | 0.109 | 0.876 | 0.380 |
| Non-slippery | 0.010 | 0.092 | 0.111 | 0.911 |
| Road verge | −0.062 | 0.078 | −0.804 | 0.420 |
| Street benches | −0.045 | 0.088 | −0.515 | 0.605 |
| Street vendors | 0.106 | 0.107 | 0.986 | 0.324 |
| On-street parking | 0.180 | 0.093 | 1.941 | 0.543 |
| Slow-moving pedestrians | −0.176 | 0.087 | −2.029 | 0.052 |
| Opposite direction flow | 0.076 | 0.095 | 0.797 | 0.042 * |
| Personal space | −0.052 | 0.102 | −0.513 | 0.425 |
| Noise of traffic | −0.065 | 0.101 | −0.645 | 0.607 |
| Detours | 0.067 | 0.100 | 0.808 | 0.518 |
| Construction sites | 0.086 | 0.115 | 0.754 | 0.450 |
| COVID-19 Safe Distance | 0.588 | 0.112 | 5.223 | 000 * |
* significant variables whose p-values are less than 0.05.
Table 5.
Coefficients, t-value, standard deviation error, and p-value of significant variables.
| Significant Variables | Value | Std Error | t-Value | p-Value |
|---|---|---|---|---|
| Pedestrian crowd | 0.737 | 0.117 | 6.256 | 000 |
| Continuous footpath | 0.325 | 0.089 | 3.628 | 000 |
| Opposite direction flow | 0.177 | 0.079 | 2.235 | 0.025 |
| COVID-19 safe distance | 0.454 | 0.101 | 4.478 | 000 |
| 1/2 | 0.803 | 0.423 | 1.900 | 0.05 |
| 2/3 | 3.029 | 0.437 | 6.928 | 000 |
| 3/4 | 5.092 | 0.492 | 10.336 | 000 |
| 4/5 | 7.116 | 0.596 | 11.925 | 000 |
Table 6.
Confusion matrix for test data.
| Actual Outcome | ||||||
|---|---|---|---|---|---|---|
| Predicted Outcome | PLOS Rating | A | B | C | D | E |
| A | 2 | 0 | 0 | 0 | 0 | |
| B | 5 | 17 | 11 | 0 | 0 | |
| C | 2 | 11 | 28 | 7 | 2 | |
| D | 0 | 1 | 0 | 2 | 0 | |
| E | 0 | 0 | 0 | 0 | 1 | |
Disclaimer/Publisher’s Note: The statements, opinions and data contained in all publications are solely those of the individual author(s) and contributor(s) and not of MDPI and/or the editor(s). MDPI and/or the editor(s) disclaim responsibility for any injury to people or property resulting from any ideas, methods, instructions or products referred to in the content. |
© 2023 by the authors. Licensee MDPI, Basel, Switzerland. This article is an open access article distributed under the terms and conditions of the Creative Commons Attribution (CC BY) license (https://creativecommons.org/licenses/by/4.0/).
Share and Cite
MDPI and ACS Style
Paul, D.; Moridpour, S.; Nguyen, L.A. Evaluating the Impact of COVID-19 on the Behaviour of Pedestrians. Sustainability 2023, 15, 1874. https://0-doi-org.brum.beds.ac.uk/10.3390/su15031874
AMA Style
Paul D, Moridpour S, Nguyen LA. Evaluating the Impact of COVID-19 on the Behaviour of Pedestrians. Sustainability. 2023; 15(3):1874. https://0-doi-org.brum.beds.ac.uk/10.3390/su15031874
Chicago/Turabian StylePaul, Deborah, Sara Moridpour, and Le Andrew Nguyen. 2023. "Evaluating the Impact of COVID-19 on the Behaviour of Pedestrians" Sustainability 15, no. 3: 1874. https://0-doi-org.brum.beds.ac.uk/10.3390/su15031874
Note that from the first issue of 2016, this journal uses article numbers instead of page numbers. See further details here.