


Modify the Injection Machine Mechanism to Enhance the Recycling of Plastic Waste Mixed with MHD Nanoparticles

Abstract
:1. Introduction
2. The Problem Description and Motivation
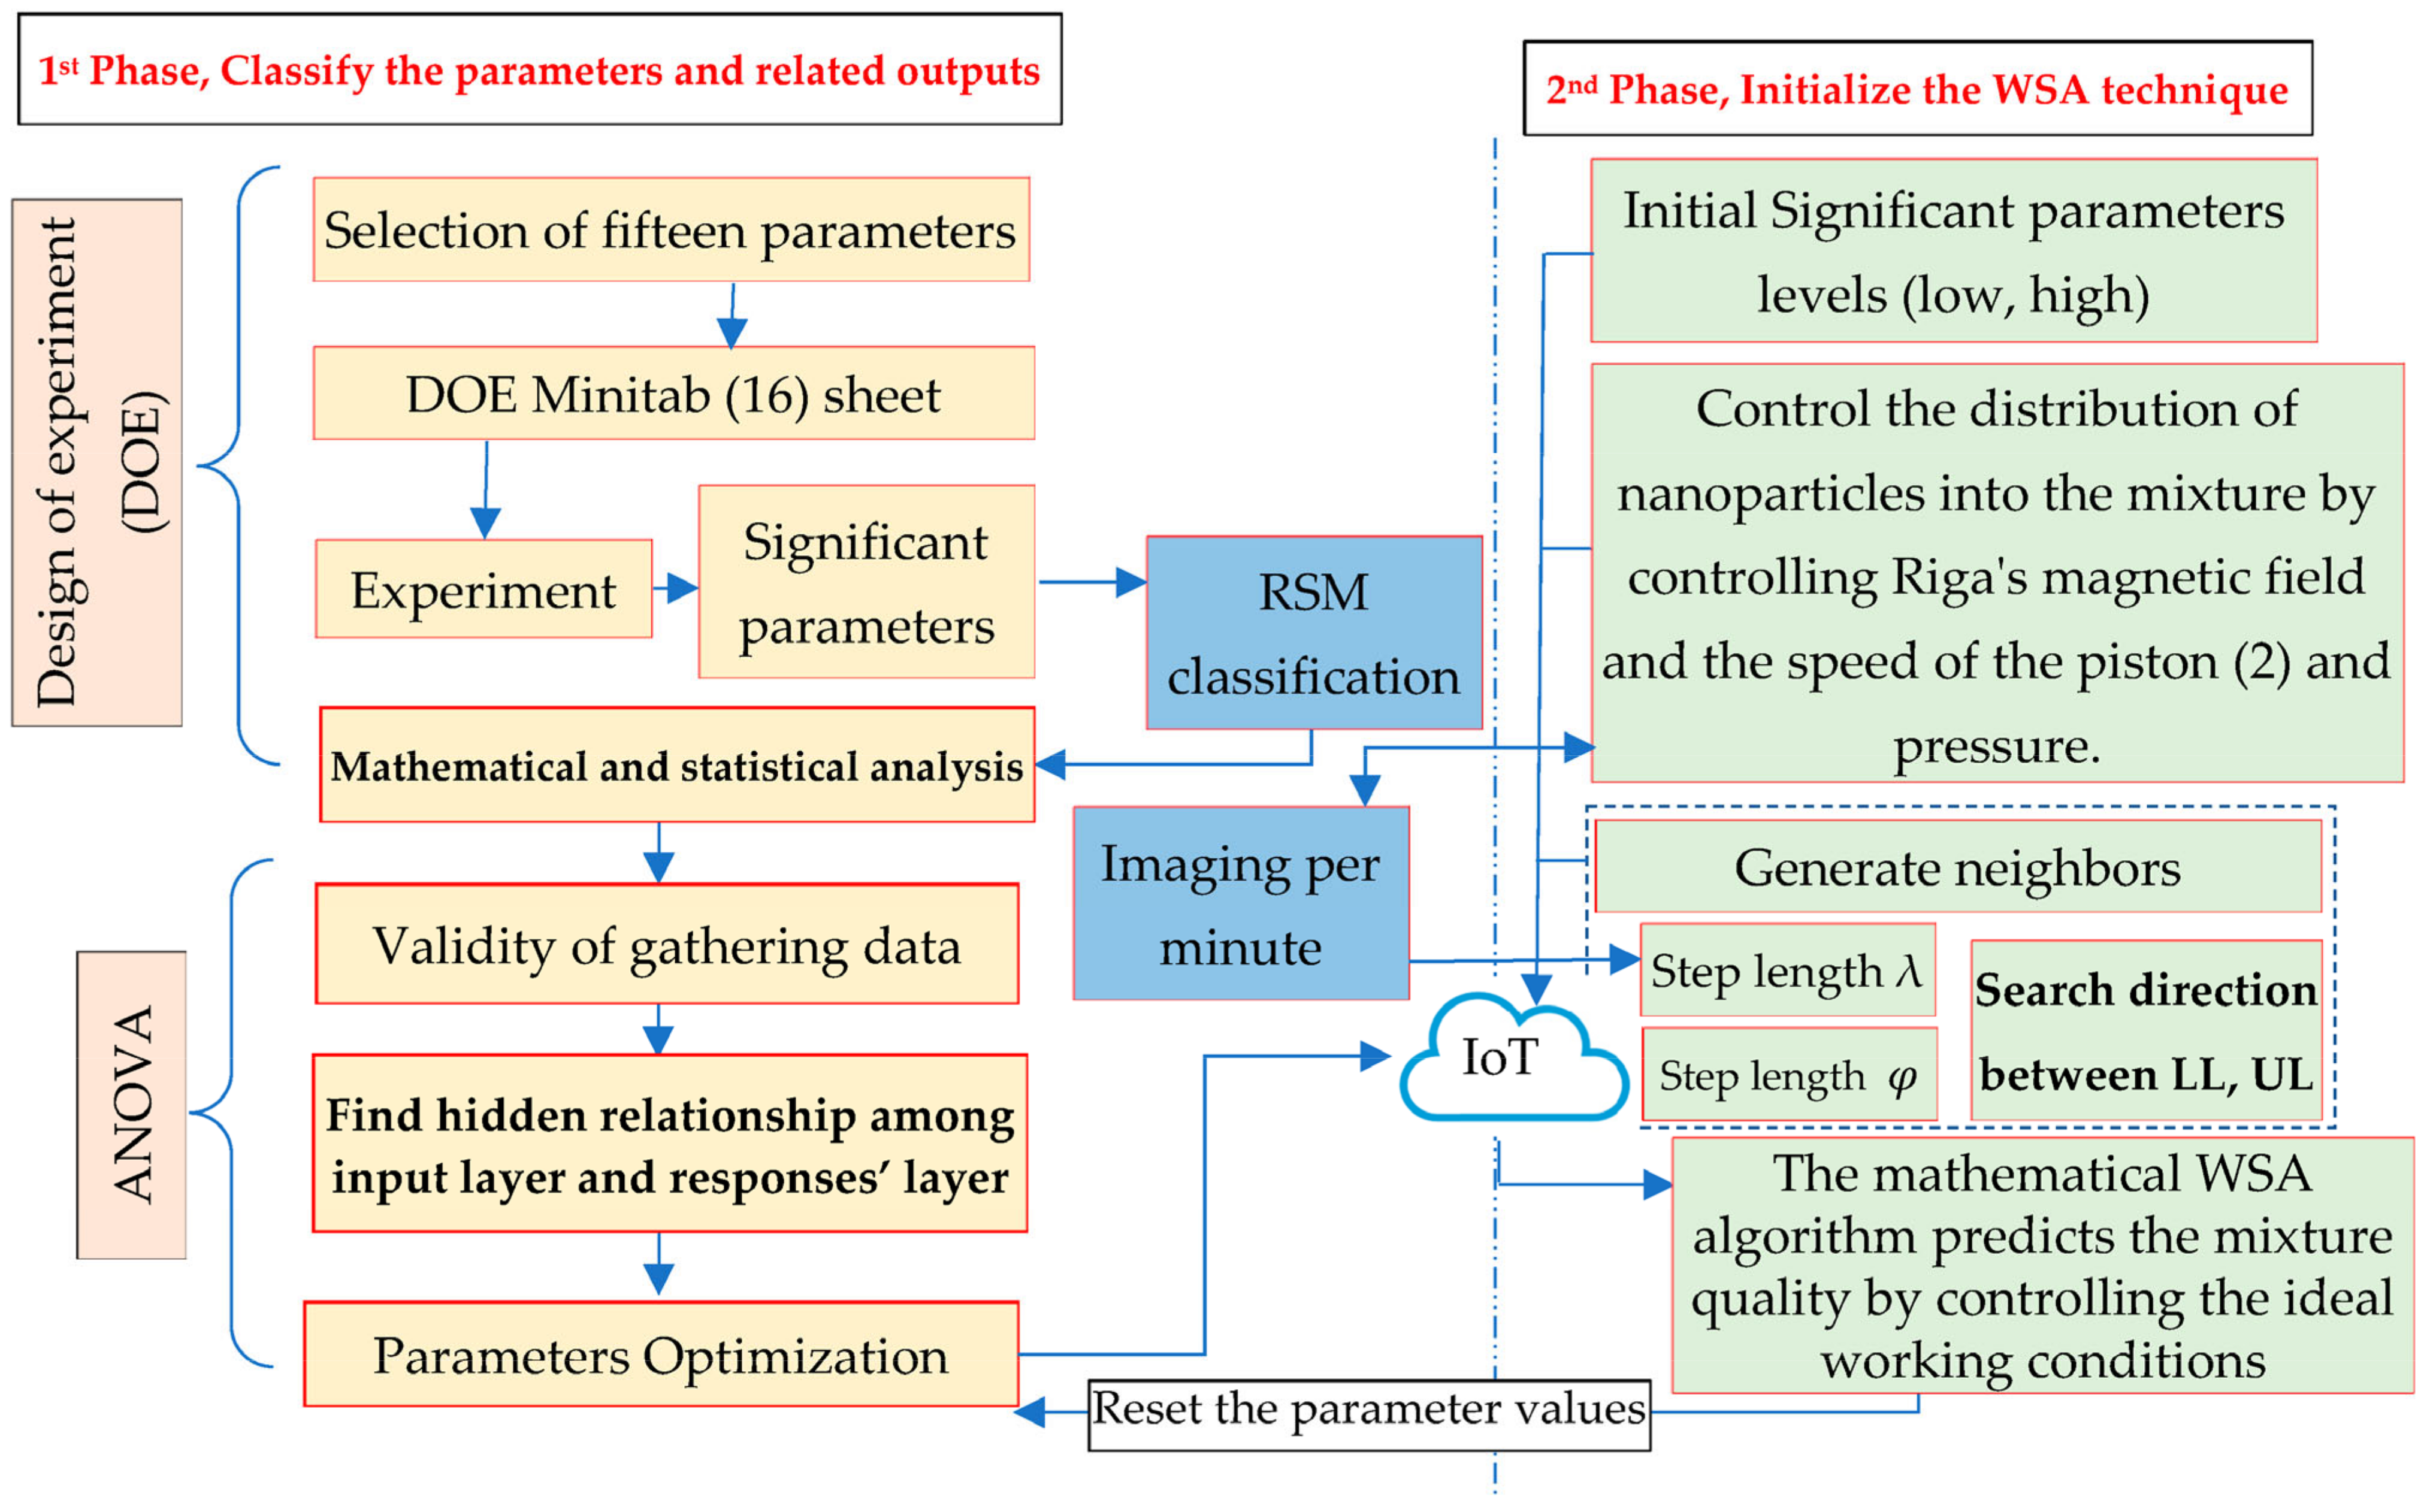
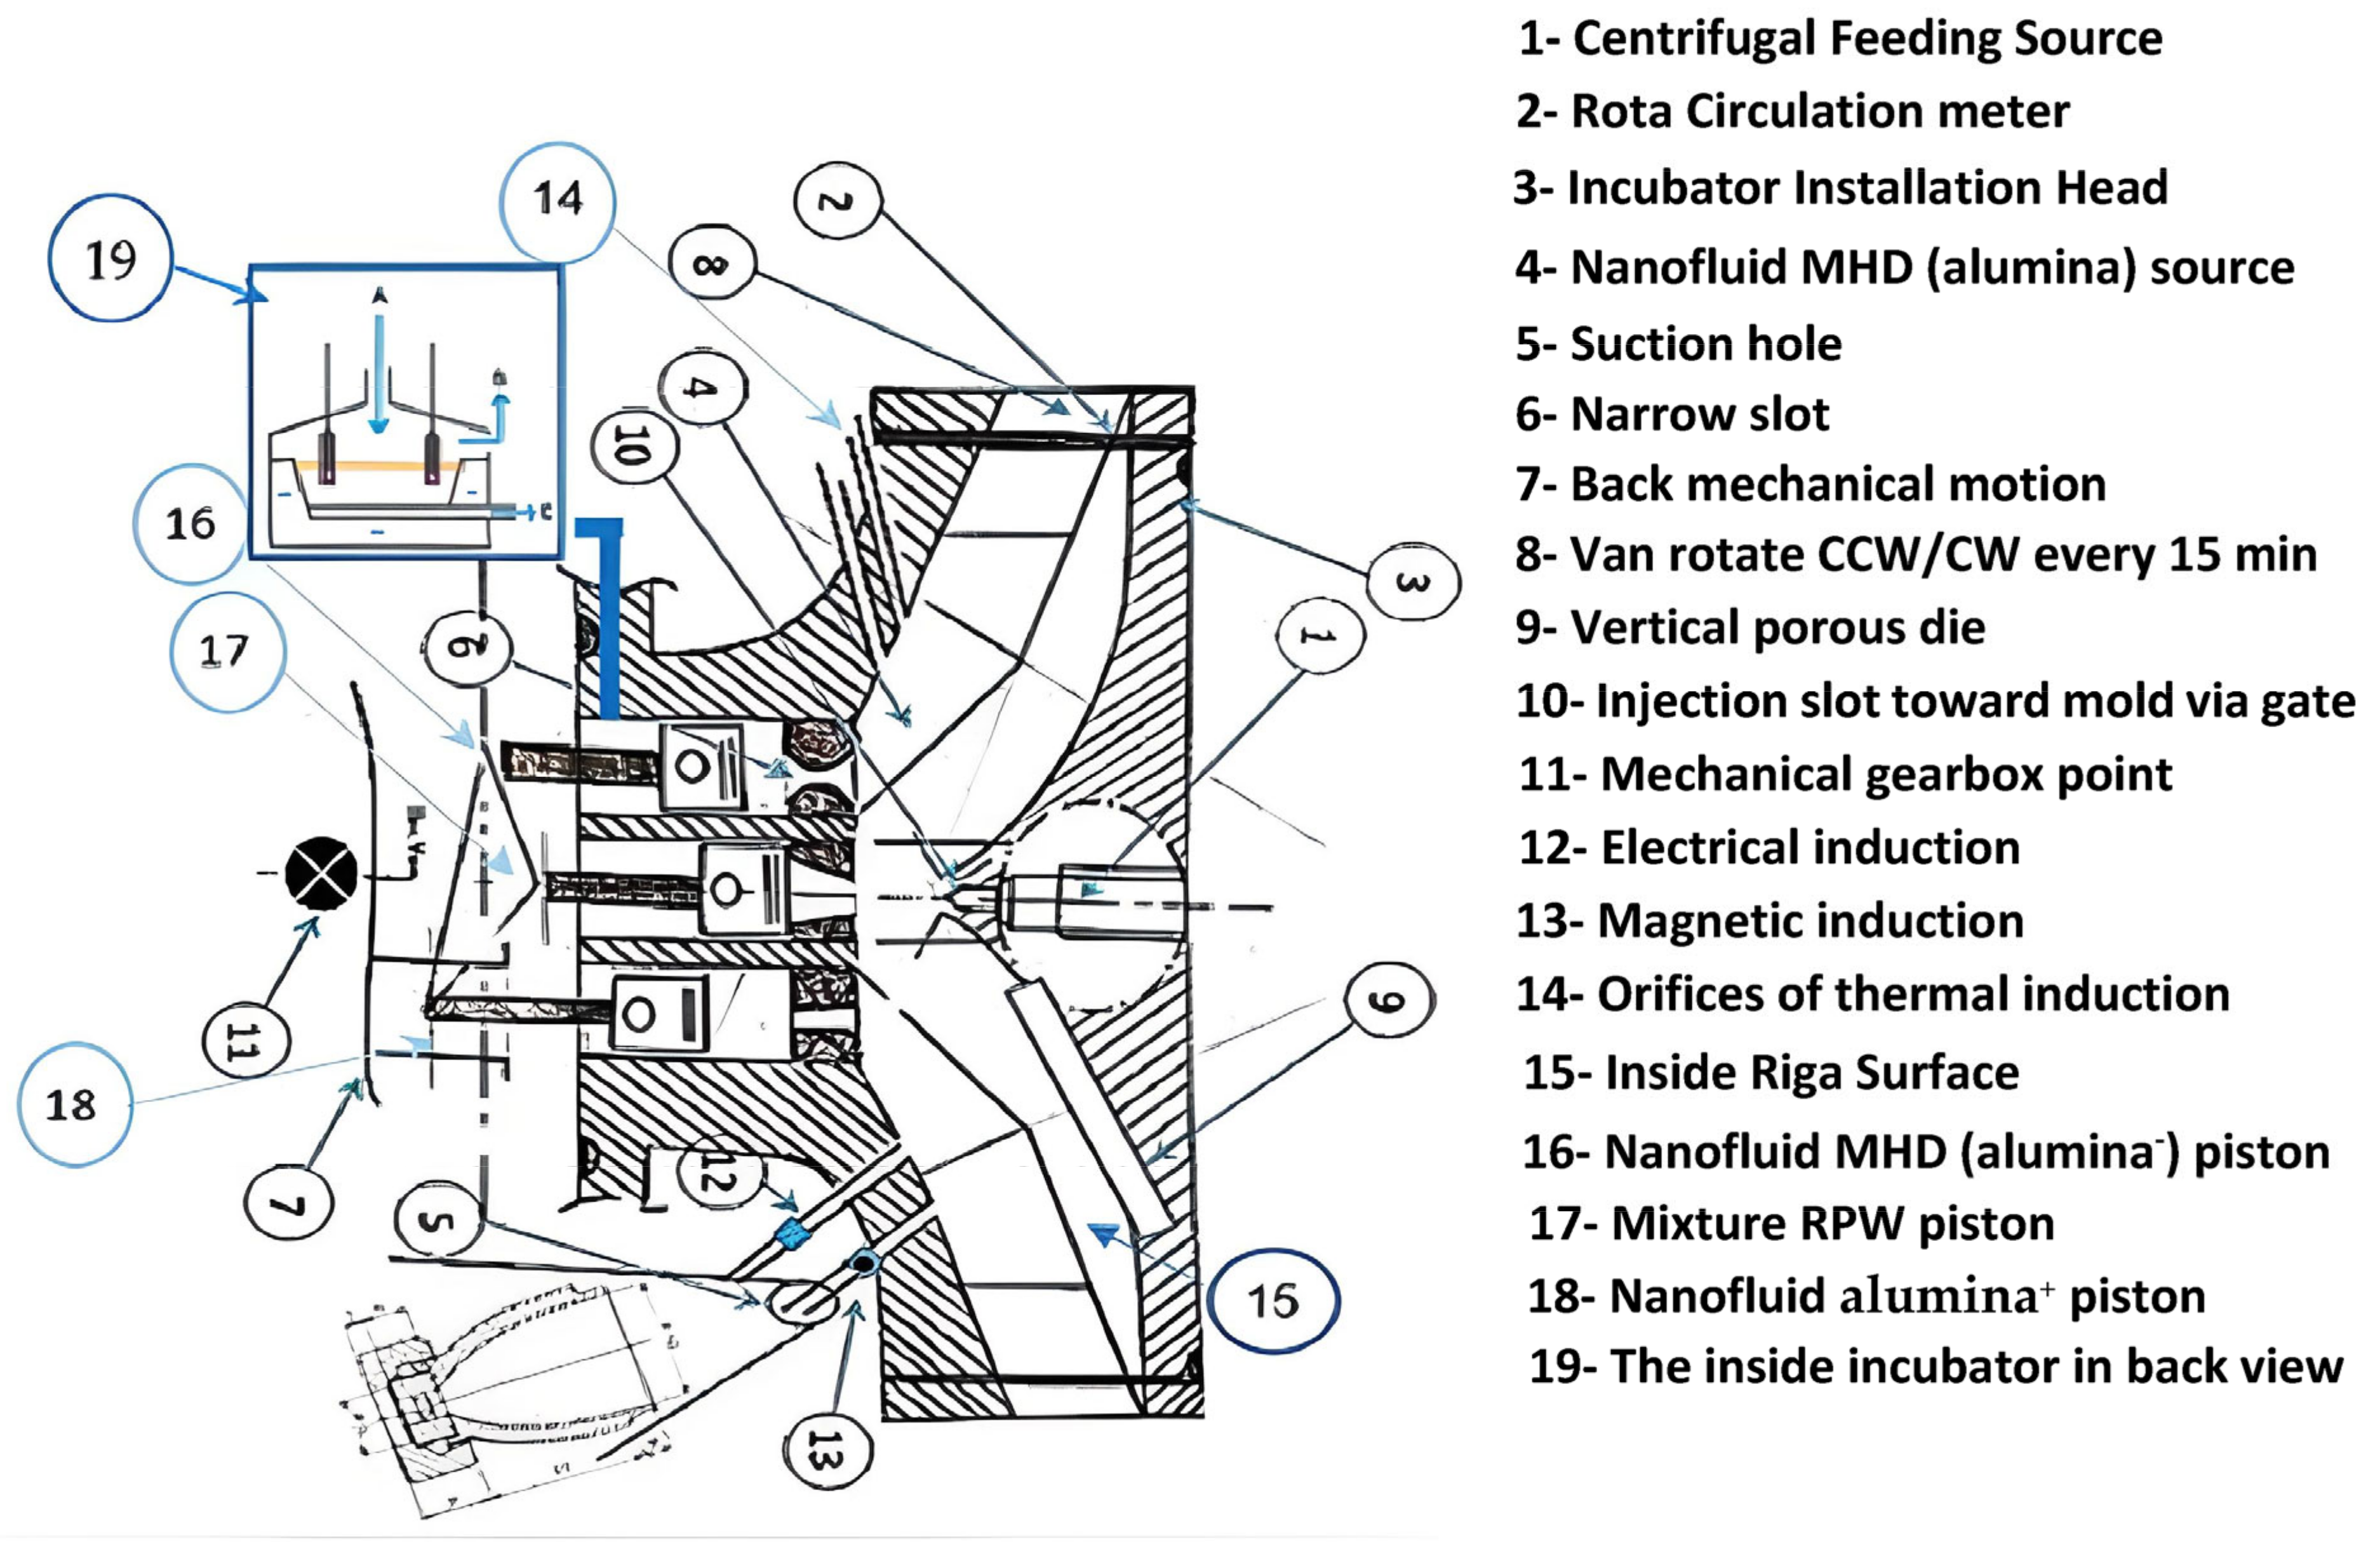
3. The Mechanism of the IFM Network Methodology

| Step | Action Identification |
|---|---|
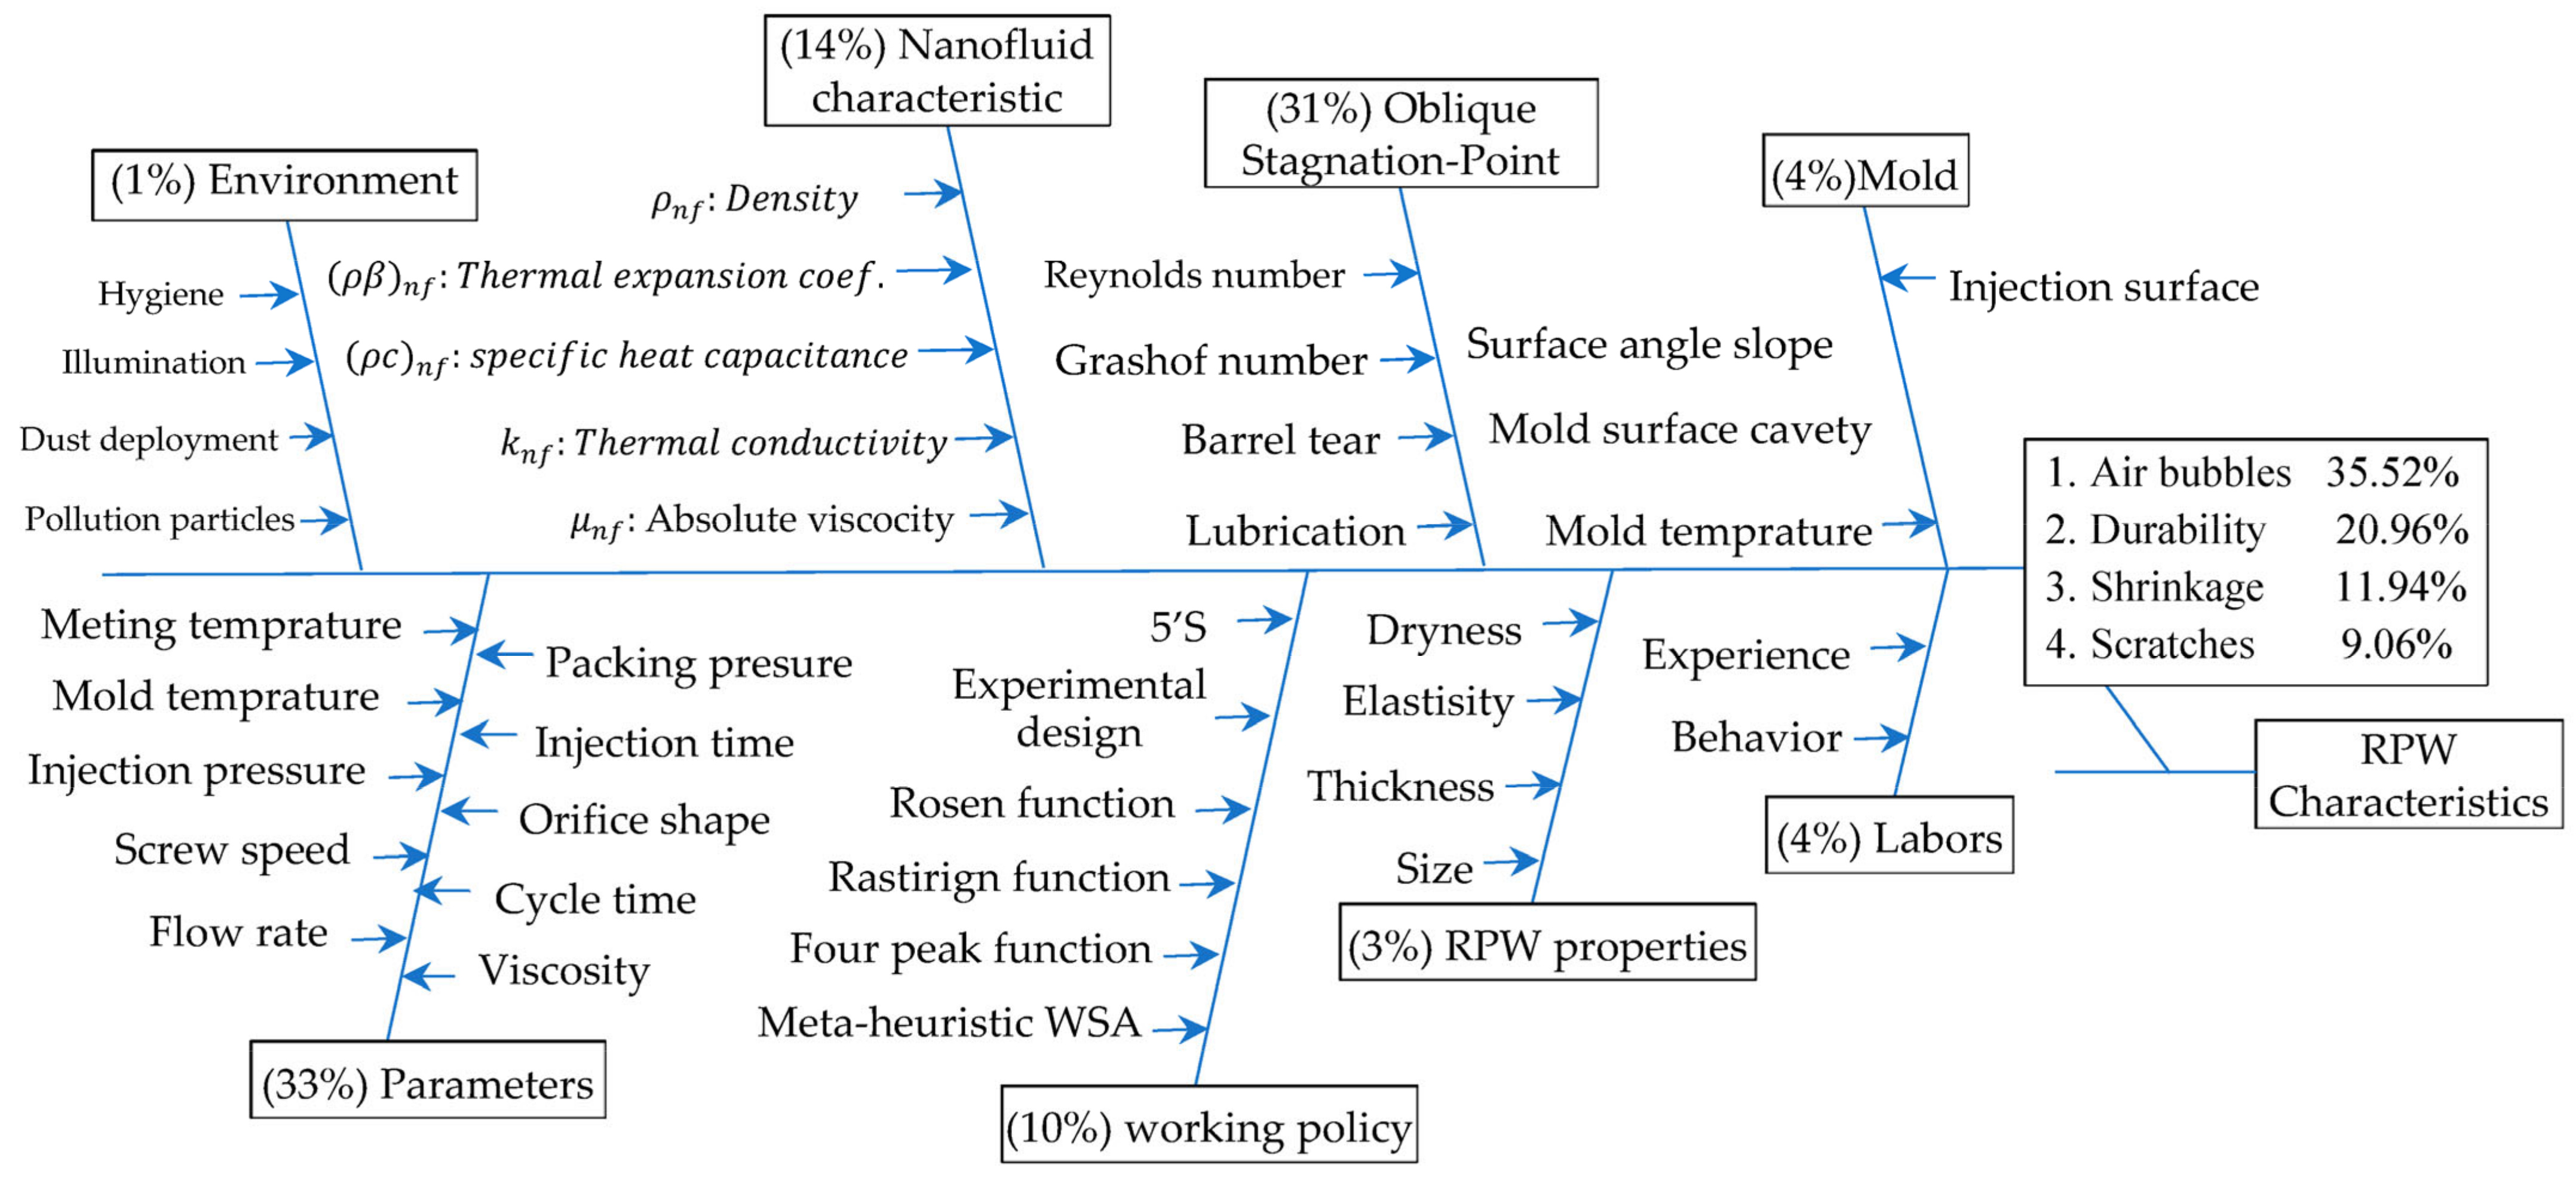
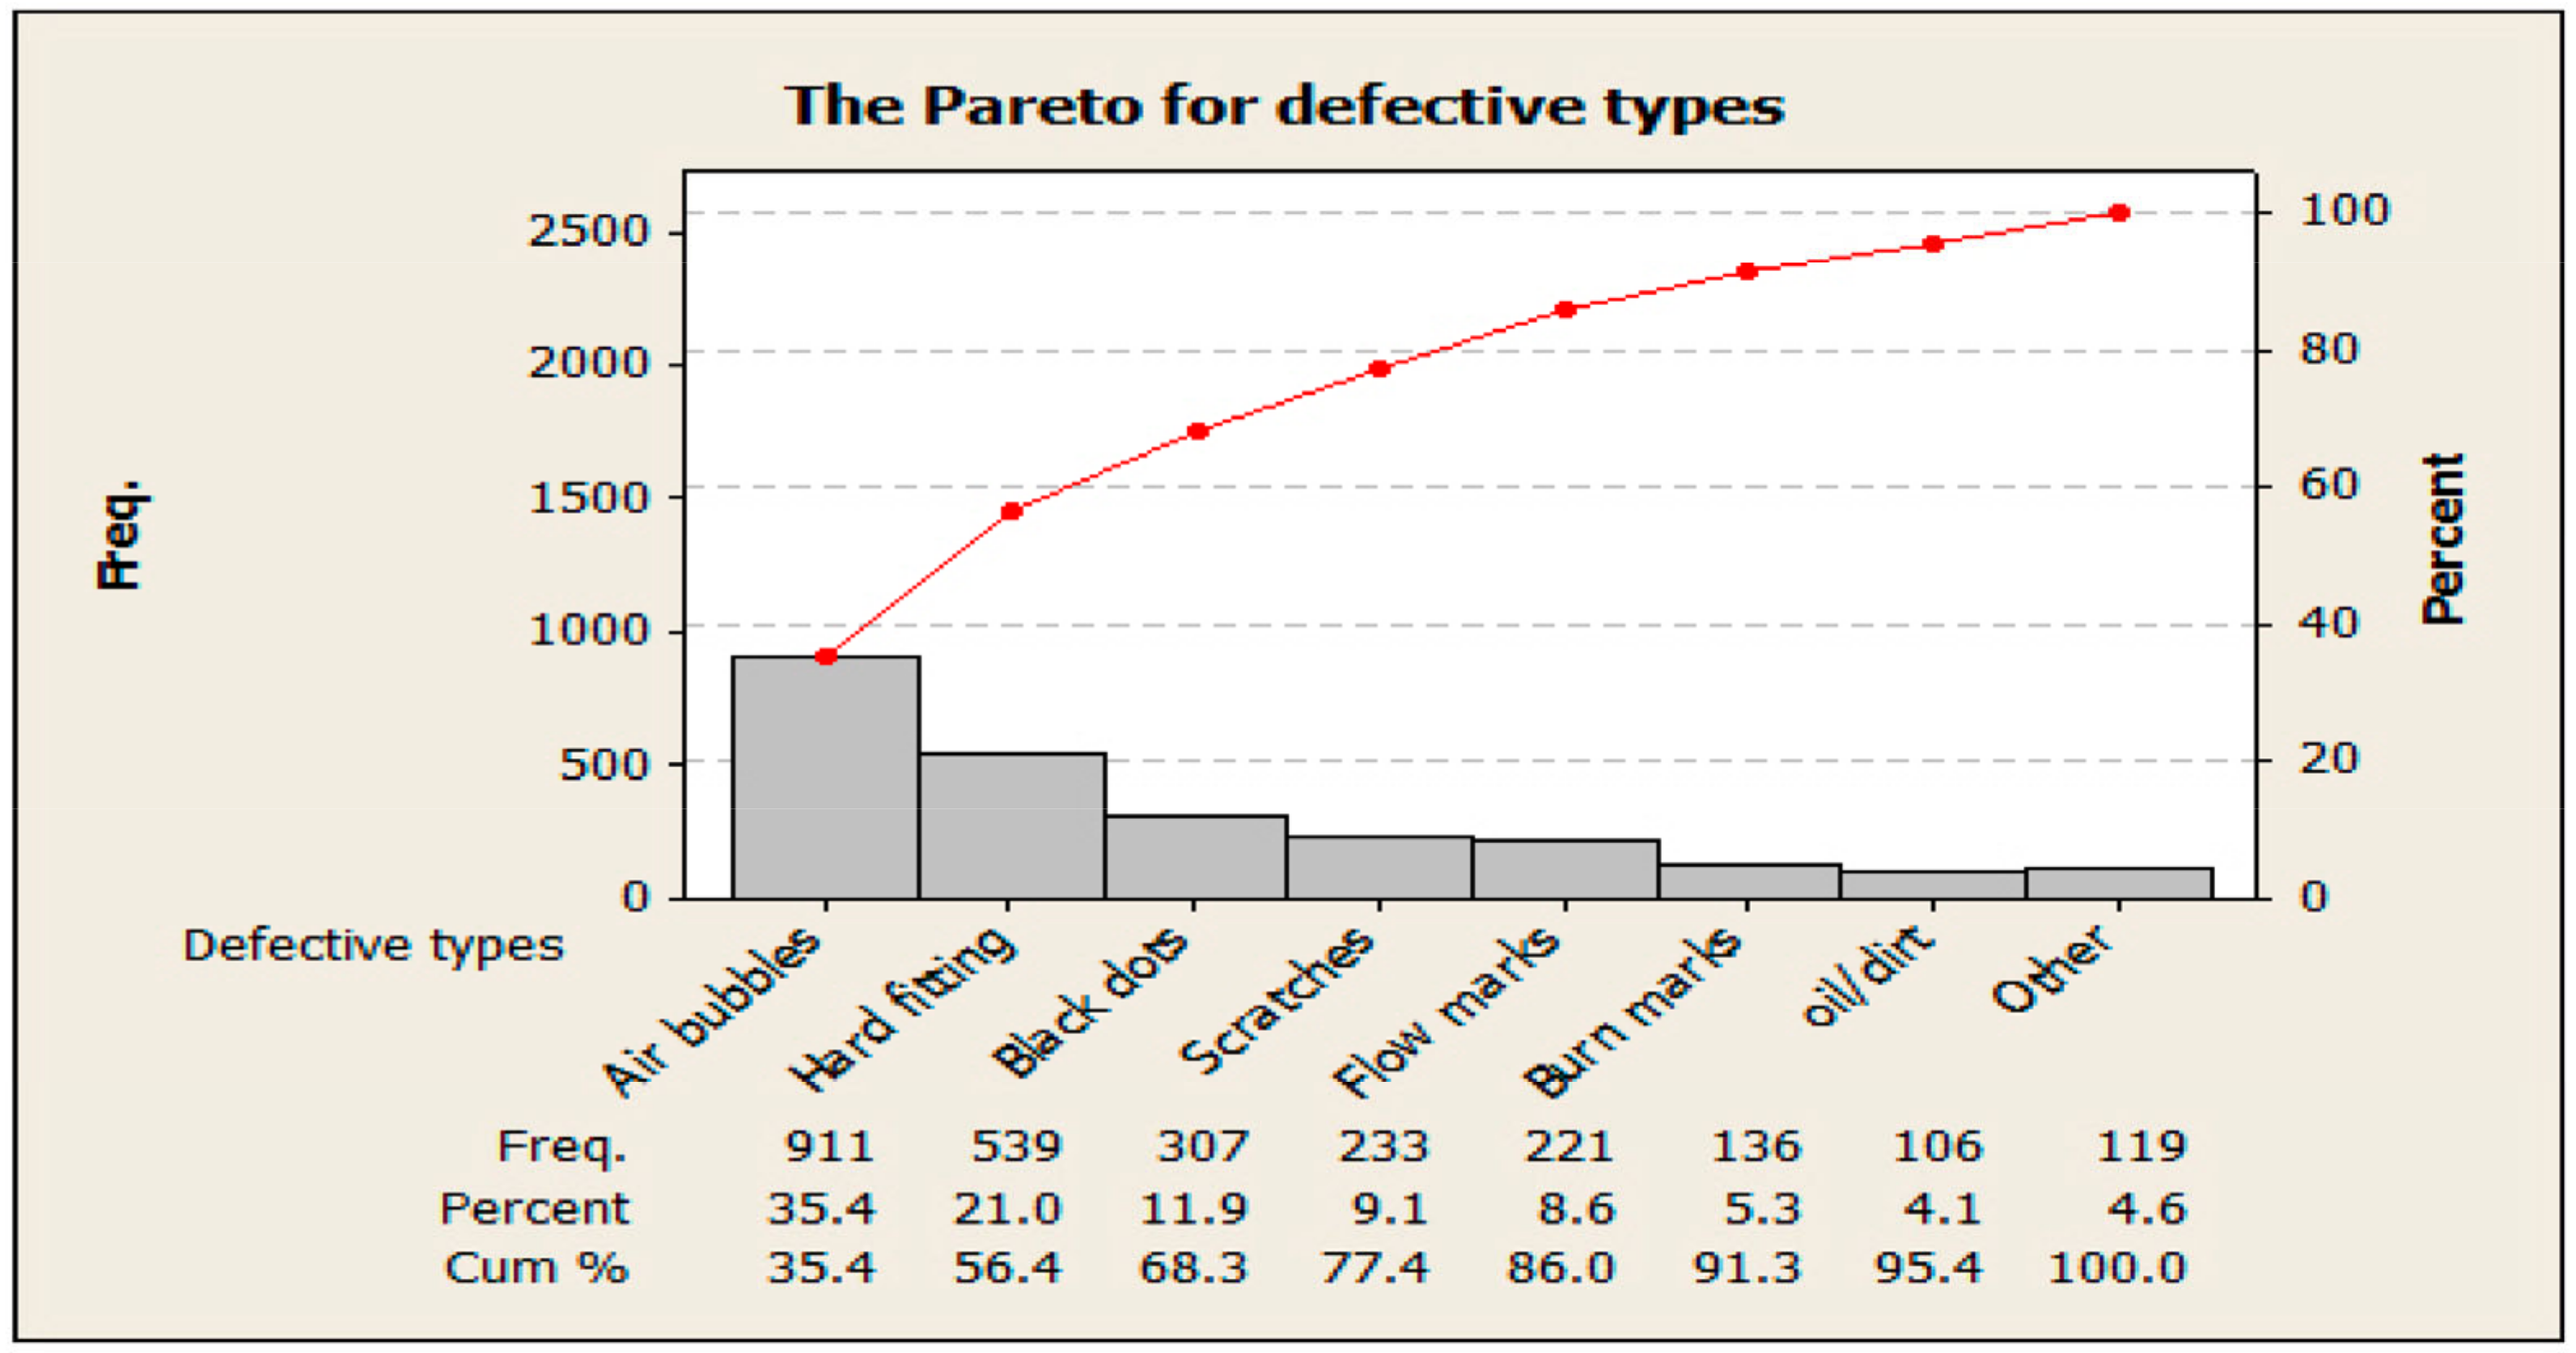
| Pace (1): | Initialize the picking parameters from the cause and effect diagram for a specific defect opportunity that has a maximum frequency as discussed in the Pareto chart for the whole defect opportunities. |
| Pace (1.1): | with n limits for all candidate parameters of the injection machine. |
| Pace (1.2): | with m limits for all candidate parameters of the incubator device. |
| Pace (1.3): | . |
| Pace (2): | Prepare a parameter range, estimate the constraint, and then generate the pre-defined number of initial solutions i.e., Cast product quality (Shock-absorbing, dimensional, air bubble-free). |
| Pace (3): | Analyse individuals’ degree of fitness. |
| Pace (3.1): | Evaluate fitness values of the initially picked solutions to modify significant variables and their related fitness |
| Pace (4): | Move to pace (11) if the wanted objective is met; otherwise, jump to Pace (5). |
| Pace (5): | }. |
| Pace (5.1): | While Iteration < Max_iter |
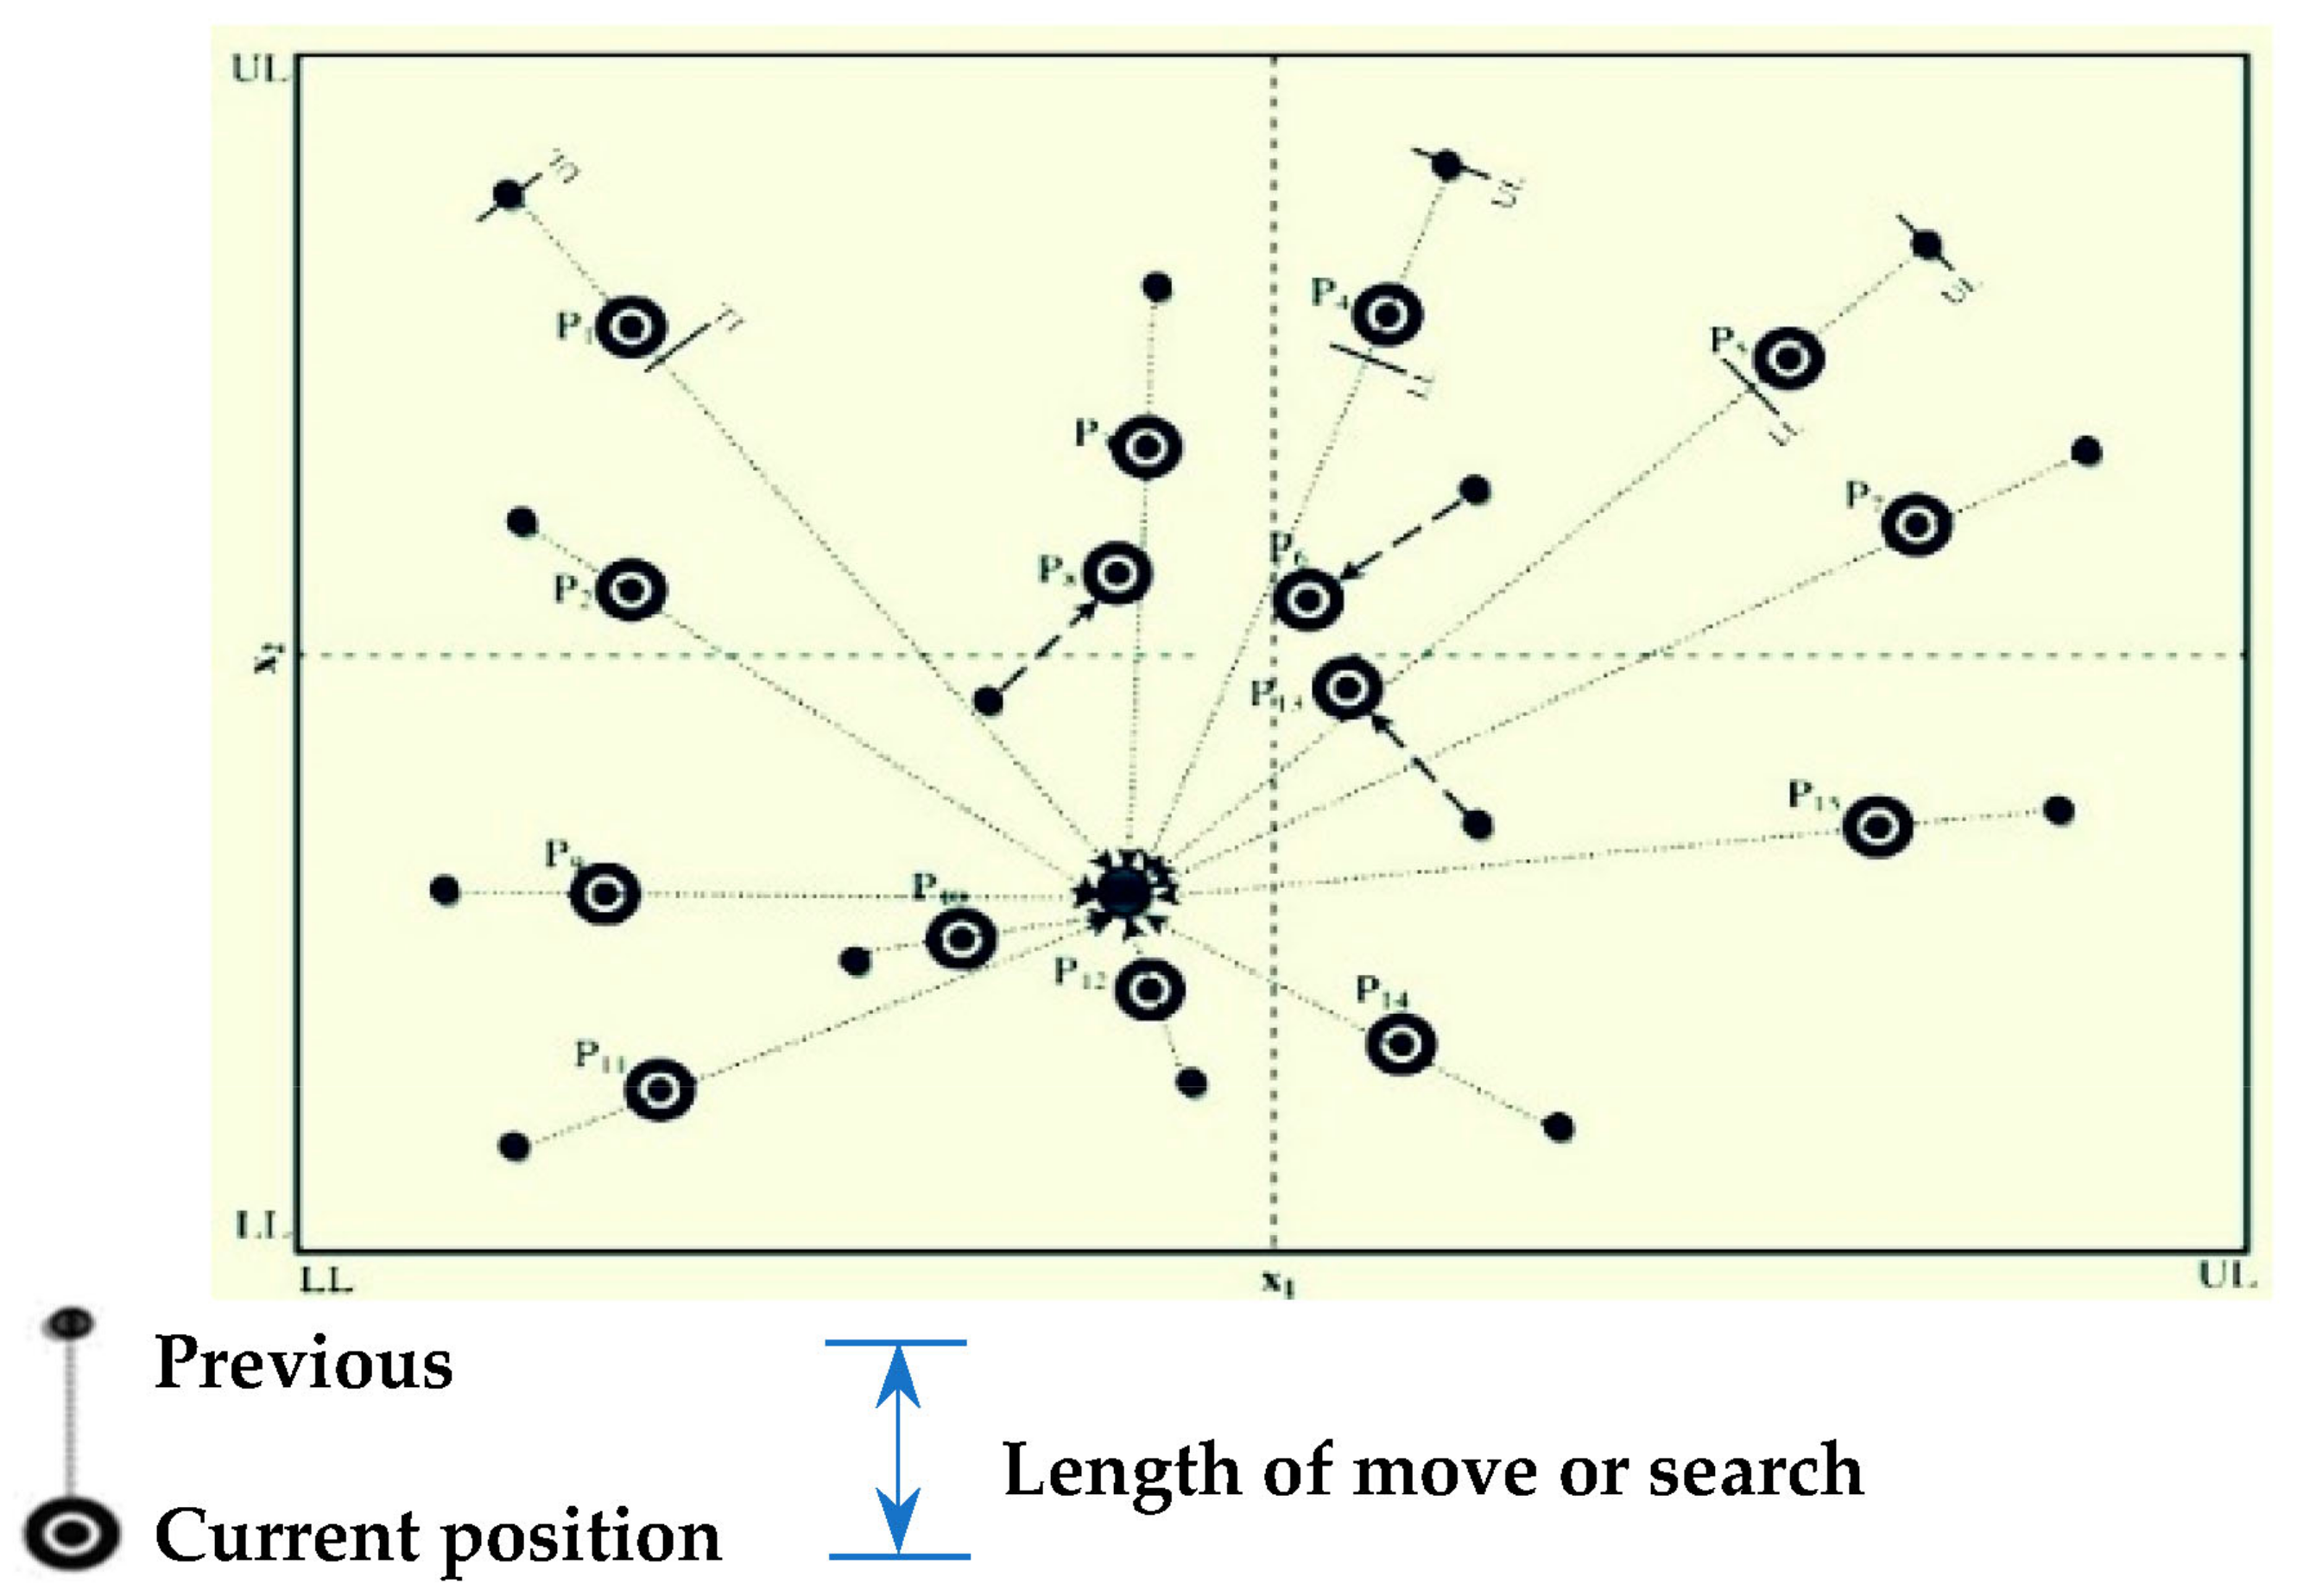
| Pace (5.1.1): | Rank solutions according to their fitness values |
| Pace (5.1.2): | Assign a weight to each solution by considering their ranks |
| Pace (5.1.3): | Determine a target point (superposition) to move the solution toward it |
| Pace (5.1.4): | Evaluate the fitness value of the target point |
| Pace (5.1.5): | Determine the search direction for each solution by considering the target point (superposition) and its fitness value. |
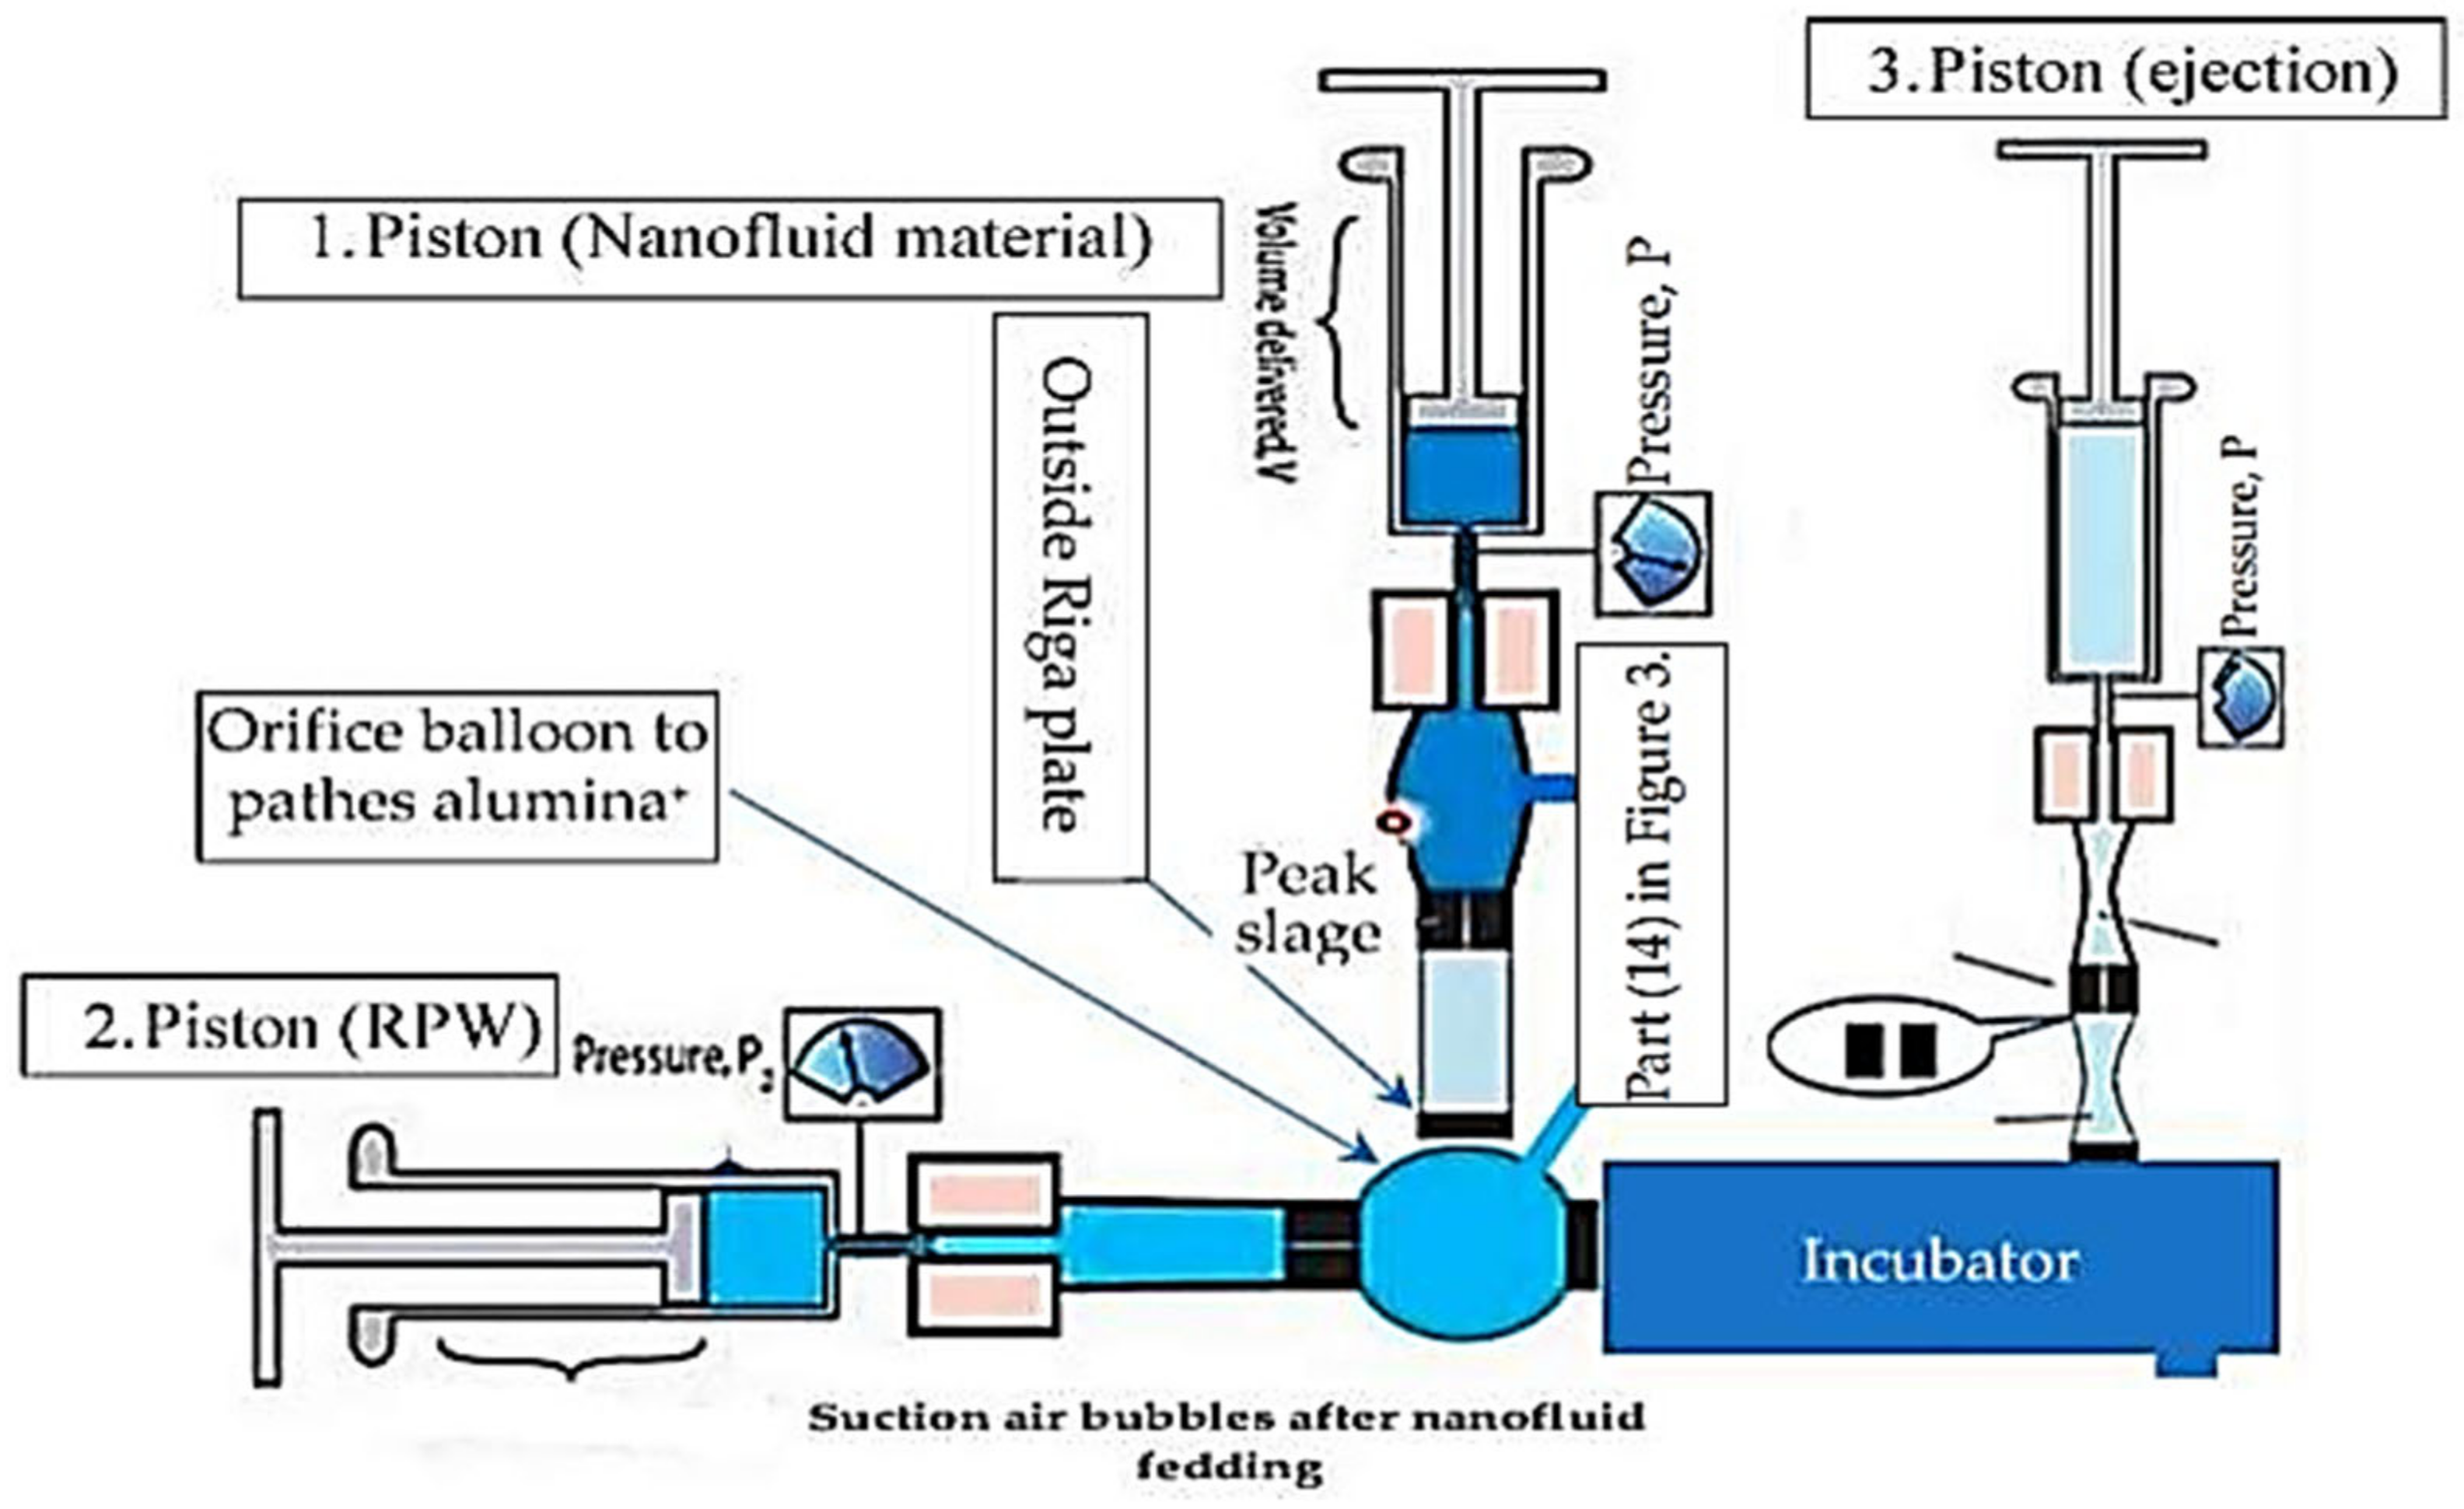
3.1. The Incubator Device Mechanism (RPW Preparation)
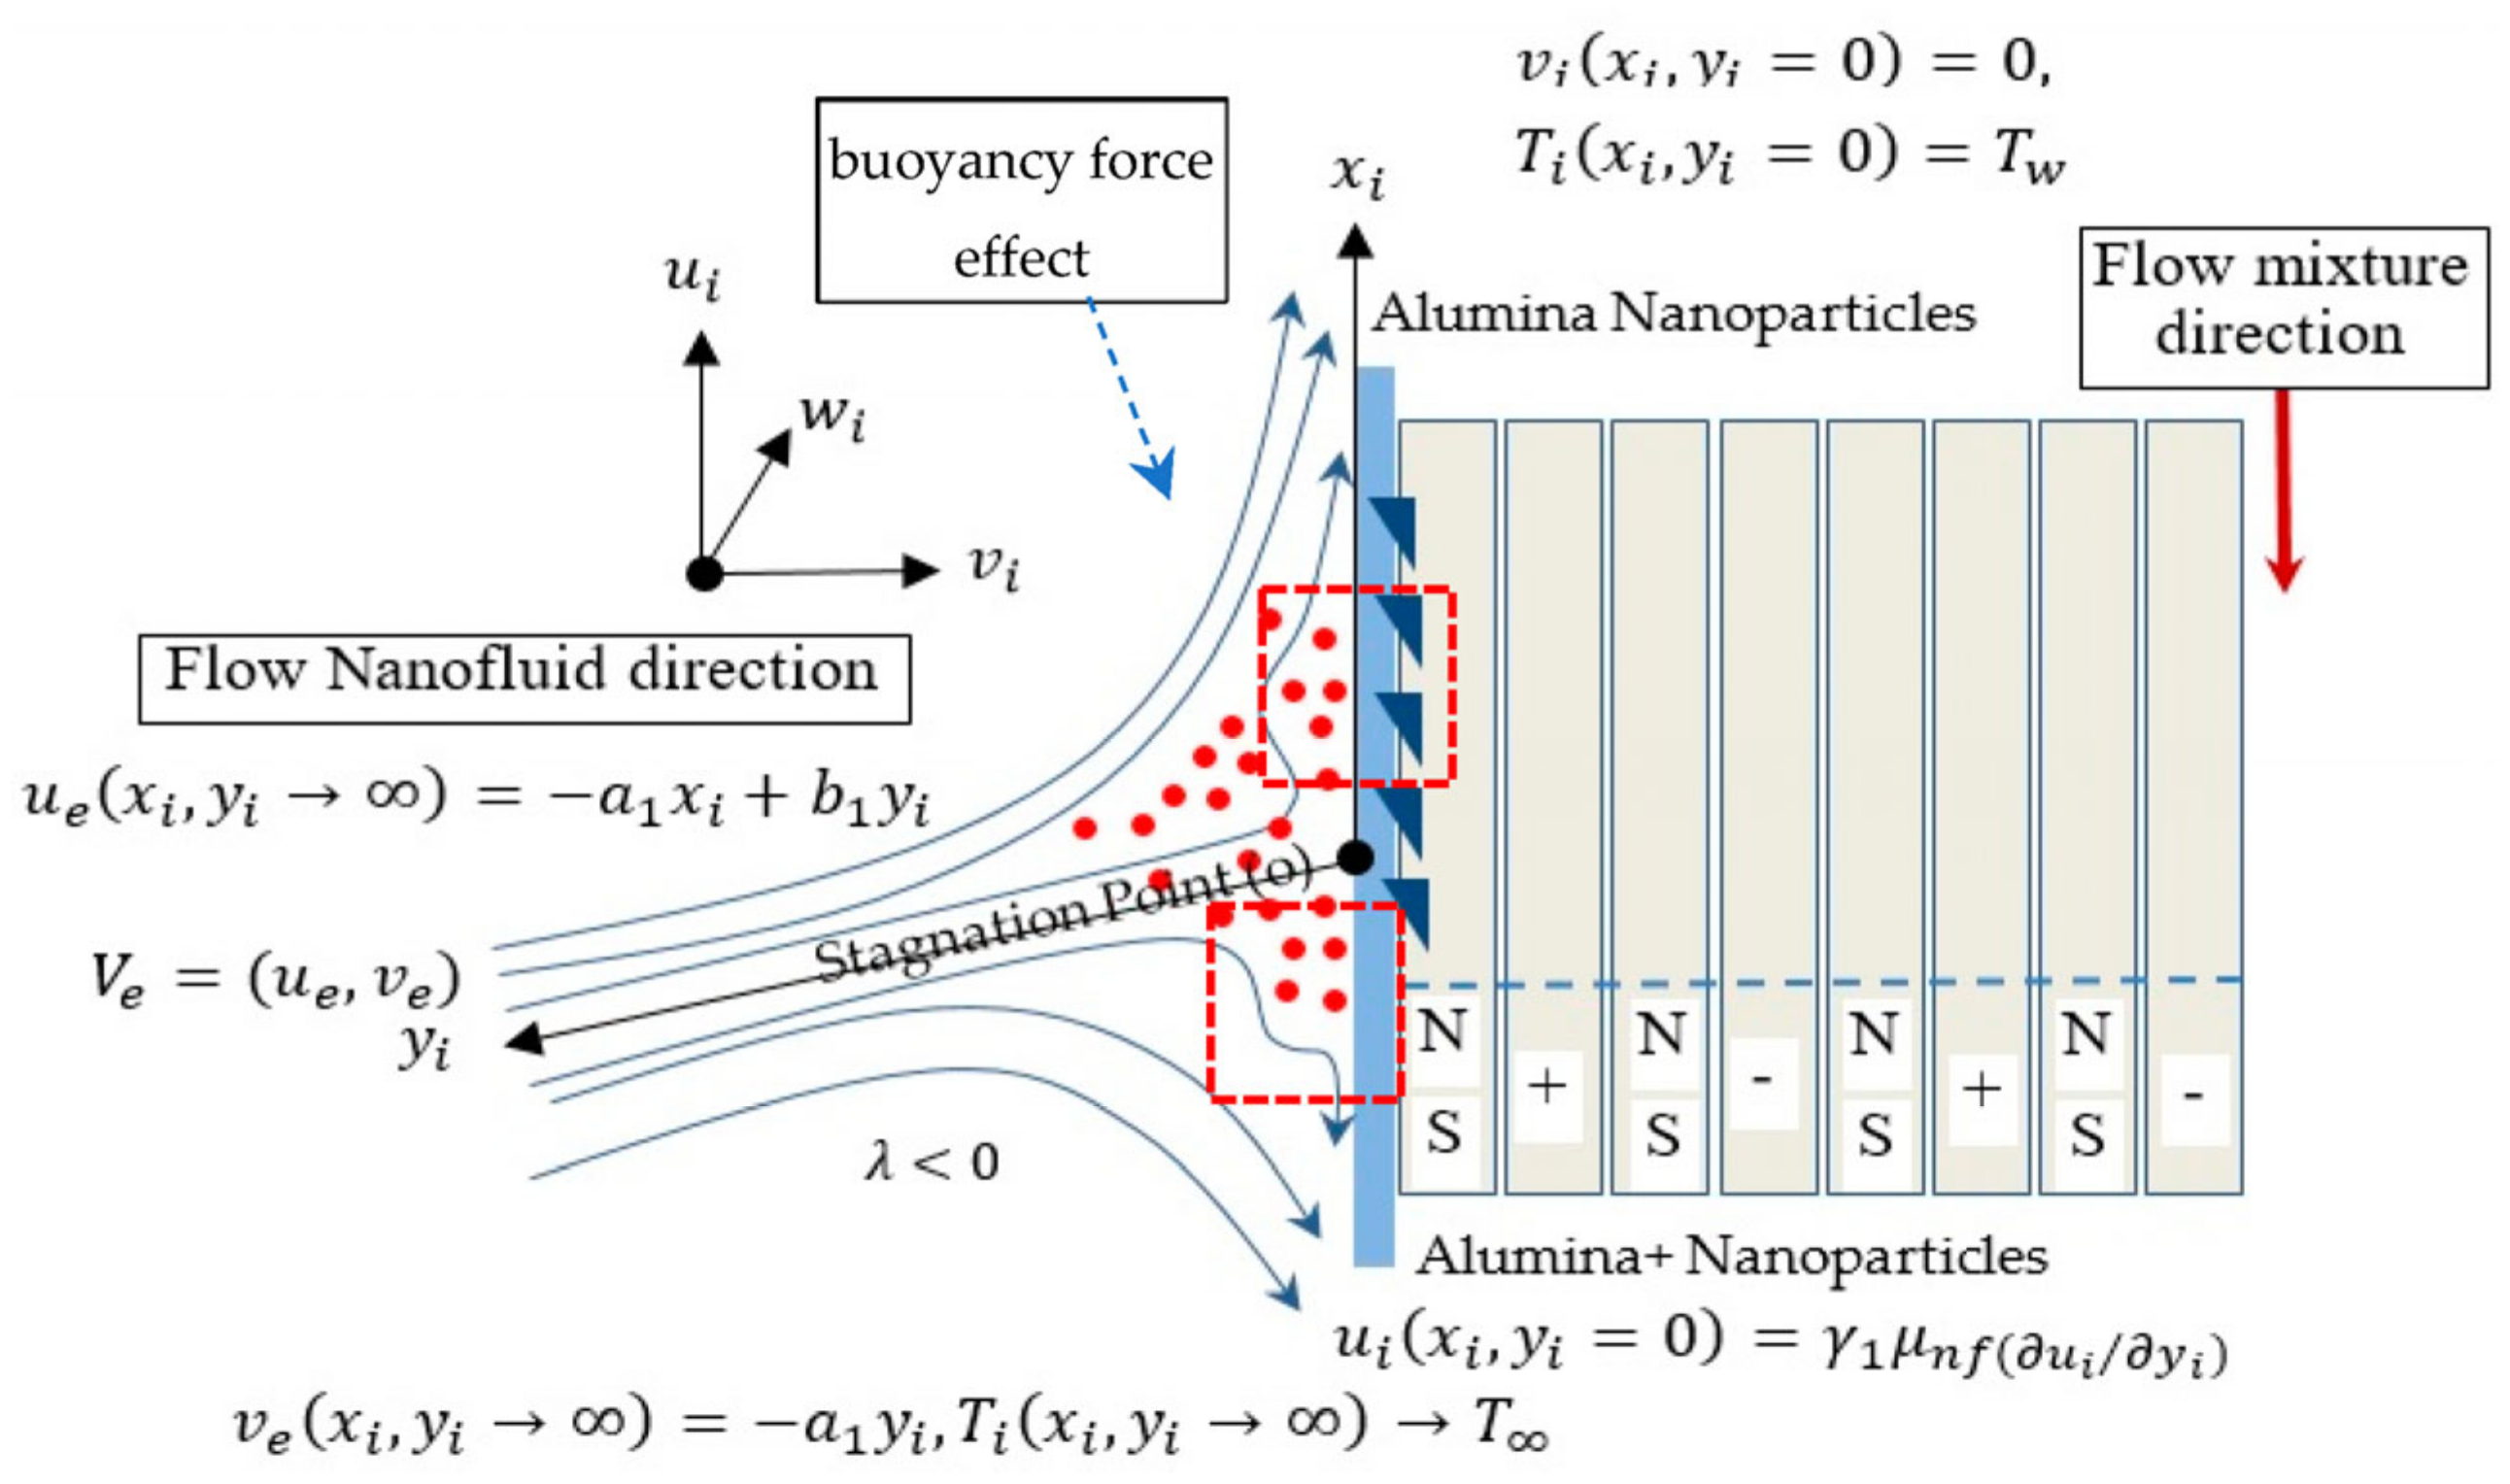
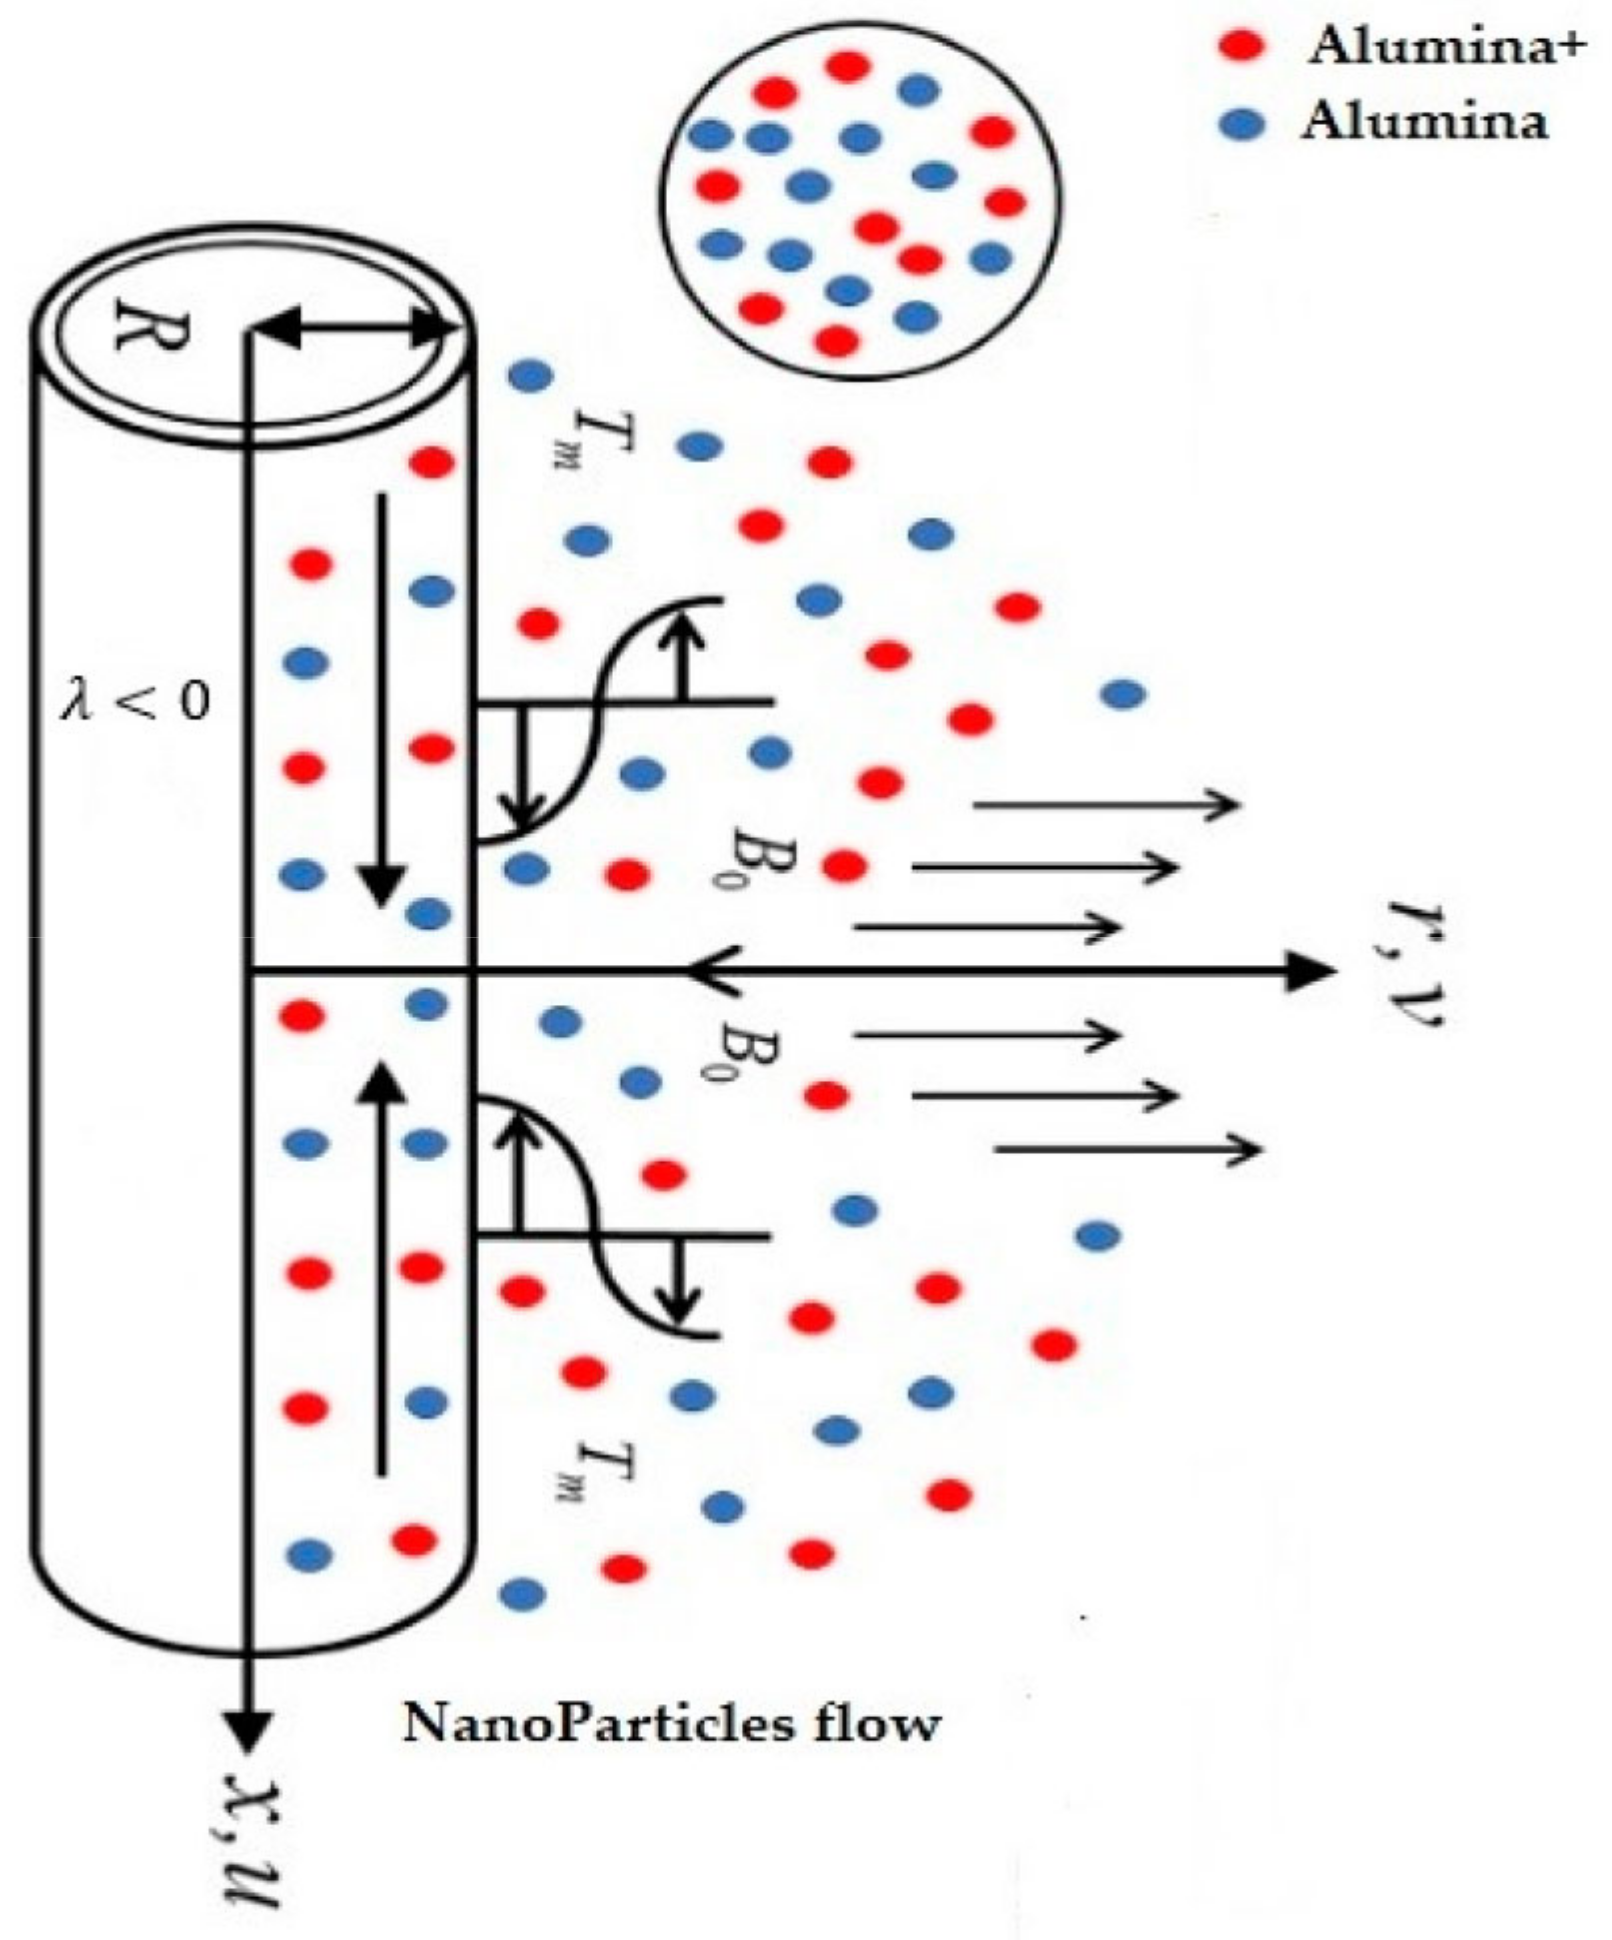
3.2. The Physical Mixture Characteristics
4. The Experimental of IFM Network
5. The Election of Significant Working Parameters
6. The Validation of the IFM mechanism
The Analysis of Results
7. Case Study Limitations
8. Conclusions
9. Future Work
Supplementary Materials
Author Contributions
Funding
Institutional Review Board Statement
Informed Consent Statement
Data Availability Statement
Conflicts of Interest
References
- Tanwer, N.; Vashistha, S.; Anand, P.; Khosla, B.; Khosla, B. Plastic Waste Disposal. Plastic Waste Management: Turning Challenges into Opportunities Publisher: Bharti Publications Plastic Waste Management: Turning Challenges into Opportunities, Bharti Publications. 2022. Available online: www.bhartipublications.com (accessed on 29 September 2022).
- Kim, J.K.; Jeon, E.S. Optimization of injection molding process parameters to improve mechanical strength of LFT specimen. Int. J. Appl. Eng. Res. 2017, 12, 3671–3676. [Google Scholar]
- Singh, K.D.; Sharma, R. Three dimensional free convective flow and heat transfer through a porous medium with periodic permeability. Indian J. Pure Appl. Math. 2002, 33, 941–949. [Google Scholar]
- Pal, S.L.; Jana, U.; Manna, P.K.; Mohanta, G.P.; Manavalan, R. Nanoparticle: An Overview of Preparation and Characterization. J. Appl. Pharm. Sci. 2011, 1, 228–234. [Google Scholar]
- Das, S.; Satapathy, A.; Das, J.; Panda, J. Mass transfer effects on MHD flow and heat transfer past a vertical porous plate through a porous medium under oscillatory suction and heat source. Int. J. Heat Mass Transf. 2009, 52, 5962–5969. [Google Scholar] [CrossRef]
- Khan, S.K.; Sanjayanand, E. Viscoelastic boundary layer flow and heat transfer over an exponential stretching sheet. Int. J. Heat Mass Transf. 2005, 48, 1534–1542. [Google Scholar] [CrossRef]
- Postelnicu, A. Influence of a magnetic field on heat and mass transfer by natural convection from vertical surfaces in porous media considering Soret and Dufour effects. Int. J. Heat Mass Transfer. 2004, 47, 1467–1472. [Google Scholar] [CrossRef]
- Kim, Y.J. Unsteady MHD convective heat transfer past a semi-infinite vertical porous moving plate with variable suction. Int. J. Eng. Sci. 2000, 38, 833–845. [Google Scholar] [CrossRef]
- Kumar, D.; Kapoor, A. Optimization of Process Parameters in Injection-Molding by Recent Methods for Optimization—Literature Review. In Proceedings of the National Conference on Sustainable and Emerging Trends In Mechanical Engineering “NCSETME 2018”, Jaipur, India, 28 March 2018. [Google Scholar]
- Abed, S.A.; Khalaf, A.A.; Mnati, H.M.; Hanon, M.M. Optimization of mechanical properties of recycled polyurethane waste microfiller epoxy composites using grey relational analysis and taguchi method. East.-Eur. J. Enterp. Technol. 2022, 1, 48–58. [Google Scholar] [CrossRef]
- Larsen, A.G.; Olafsen, K.; Alcock, B. Determining the PE fraction in recycled PP. Polym. Test. 2021, 96, 107058. [Google Scholar] [CrossRef]
- Zhao, P.; Zhou, H.; Li, Y.; Li, D. Process parameters optimization of injection molding using a fast strip analysis as a surrogate model. Int. J. Adv. Manuf. Technol. 2010, 49, 949–959. [Google Scholar] [CrossRef]
- Xu, Y.; Zhang, Q.; Zhang, W.; Zhang, P. Optimization of injection molding process parameters to improve the mechanical performance of polymer product against impact. Int. J. Adv. Manuf. Technol. 2014, 76, 2199–2208. [Google Scholar] [CrossRef]
- Rajalingam, S.; Vasant, P. Optimization of Injection Molding Process Parameters by Response Surface Methods. J. Inf. Technol. Softw. Eng. 2016, 42, 2047–2061. [Google Scholar] [CrossRef]
- Kavade, M.V. Parameter Optimization of Injection Molding of Polypropylene by using Taguchi Methodology. IOSR J. Mech. Civ. Eng. 2012, 4, 49–58. [Google Scholar] [CrossRef]
- Ajorloo, M.; Ghodrat, M.; Kang, W.-H. Incorporation of Recycled Polypropylene and Fly Ash in Polypropylene-Based Composites for Automotive Applications. J. Polym. Environ. 2020, 29, 1298–1309. [Google Scholar] [CrossRef]
- Strangl, M.; Lok, B.; Breunig, P.; Ortner, E.; Buettner, A. The challenge of deodorizing post-consumer polypropylene packaging: Screening of the effect of washing, color-sorting and heat exposure. Resour. Conserv. Recycl. 2020, 164, 105143. [Google Scholar] [CrossRef]
- Mansur, A.; Mu’Alim; Sunaryo. Plastic Injection Quality Controlling Using the Lean Six Sigma and FMEA Method. IOP Conf. Series Mater. Sci. Eng. 2016, 105, 012006. [Google Scholar] [CrossRef]
- Hidayah, M.H.N.; Shayfull, Z.; Noriman, N.Z.; Fathullah, M.; Norshahira, R.; Miza, A.T.N.A. Optimization of warpage on plastic part by using response surface methodology (RSM). AIP Conf. Proc. 2018, 2030, 020155. [Google Scholar] [CrossRef]
- Zhai, M.; Xie, Y. A study of gate location optimization of plastic injection molding using sequential linear programming. Int. J. Adv. Manuf. Technol. 2009, 49, 97–103. [Google Scholar] [CrossRef]
- Kapadia, D. Shrinkage and Warpage in Polymer Injection Moulding: Models and Simulation. Institute of Polymer Injection Moulding and Process Automation. Master’s Thesis, Universität Linz, Linz, Austria, 2019. [Google Scholar]
- Zuraimi, R.; Sulaiman, M.A.; Mohamad, E.; Ghani, J.A. Tensile strength analysis of high density polyethylene for injection moulded parts. J. Adv. Manuf. Technol. 2017, 11, 151–164. [Google Scholar]
- Timans, W.; Ahaus, K.; Antony, J. Six Sigma methods applied in an injection moulding company. Int. J. Lean Six Sigma 2014, 5, 149–167. [Google Scholar] [CrossRef]
- Shyam, R.; Barode, K.; Jain, S. Improvement in production rate by reducing the defects of injection moulding by DMAIC approach. Int. J. Adv. Res. Ideas Innov. Technol. 2018, 4, 905–908. [Google Scholar]
- Klement, N.; Abdeljaouad, M.A.; Porto, L.; Silva, C. Lot-Sizing and Scheduling for the Plastic Injection Molding Industry—A Hybrid Optimization Approach. Appl. Sci. 2021, 11, 1202. [Google Scholar] [CrossRef]
- Pirc, N.; Bugarin, F.; Schmidt, F.; Mongeau, M. Cooling Channel Optimization for Injection Molding. AIP Conf. Proc. 2007, 908, 525. [Google Scholar] [CrossRef]
- Baum, M.; Jasser, F.; Stricker, M.; Anders, D.; Lake, S. Numerical simulation of the mold filling process and its experimental validation. Int. J. Adv. Manuf. Technol. 2022, 120, 3065–3076. [Google Scholar] [CrossRef]
- Nurcahyo, R.; Rini, L.; Ishak, D.P. Qualtiy improvement in plastic based toy manufacturer using six sigma method. In Proceedings of the International Conference on Industrial Engineering and Operations Management, Kuala Lumpur, Malaysia, 8–10 March 2016; pp. 2634–2643. [Google Scholar]
- Bharara, P. Implementation of DMAIC Methodology for reduction of weighted-defects in a vehicle assembly process. Int. J. Appl. Eng. Res. 2018, 13, 73–80. [Google Scholar]
- Baykasoğlu, A. Optimising cutting conditions for minimising cutting time in multi-pass milling via weighted superposition attraction–repulsion (WSAR) algorithm. Int. J. Prod. Res. 2021, 59, 4633–4648. [Google Scholar] [CrossRef]
- Nguyen, T.T.; Nguyen, T.A.; Trinh, Q.H. Optimization of milling parameters for energy savings and surface quality. Arab J. Sci. Eng. 2020, 45, 9111–9125. [Google Scholar] [CrossRef]
- Han, F.; Li, L.; Cai, W.; Li, C.; Deng, X.; Sutherland, J.W. Parameters optimization considering the trade-off between cutting power and MRR based on Linear Decreasing Particle Swarm Algorithm in milling. J. Clean. Prod. 2020, 262, 121388. [Google Scholar] [CrossRef]
- Baykasoğlu, A.; Akpinar, Ş. Weighted Superposition Attraction (WSA): A swarm intelligence algorithm for optimization problems—Part 2: Constrained optimization. Appl. Soft Comput. 2015, 37, 396–415. [Google Scholar] [CrossRef]
- Kennedy, J.; Eberhart, R. Particle Swarm Optimization. In Proceedings of the ICNN’95—International Conference on Neural Networks, Perth, Australia, 27 November–1 December 1995; Volume 4, pp. 1942–1948. [Google Scholar] [CrossRef]
- Dorrepaal, J.M. An exact solution of the Navier-Stokes equation which describes non-orthogonal stagnation-point flow in two dimensions. J. Fluid Mech. 1986, 163, 141–147. [Google Scholar] [CrossRef]
- Faiz, J.M.; Shayfull, Z.; Nasir, S.M.; Fathullah, M.; Hazwan, M.H.M. Optimisation of process parameters on thin shell part using response surface methodology (RSM) and genetic algorithm (GA). AIP Conf. Proc. 2017, 1885, 020086. [Google Scholar] [CrossRef]
- Stuart, J.T. The Viscous Flow Near a Stagnation Point When the External Flow Has Uniform Vorticity. J. Aerosp. Sci. 1959, 26, 124–125. [Google Scholar] [CrossRef]
- Tamada, K. Two-Dimensional Stagnation-Point Flow Impinging Obliquely on a Plane Wall. J. Phys. Soc. Jpn. 1979, 46, 310–311. [Google Scholar] [CrossRef]
- Khashi’ie, N.S.; Md Arifin, N.; Pop, I. Mixed convective stagnation point flow towards a vertical over Riga surface in hybrid Cu-Al2O3/liquid solution nanofluid. Mathematics 2020, 8, 912. [Google Scholar] [CrossRef]
- Rafique, K.; Alotaibi, H.; Ibrar, N.; Khan, I. Stratified Flow of Micropolar Nanofluid over Riga Plate: Numerical Analysis. Energies 2022, 15, 316. [Google Scholar] [CrossRef]
- Ogungbemi, A.T.; Adun, H.; Adedeji, M.; Kavaz, D.; Dagbasi, M. Does Particle Size in Nanofluid Synthesis Affect Their Performance as Heat Transfer Fluid in Flat Plate Collectors?—An Energy and Exergy Analysis. Sustainability 2022, 14, 10429. [Google Scholar] [CrossRef]
- Mukhopadhyay, S. MHD boundary layer slip flow along a stretching cylinder. Ain Shams Eng. J. 2012, 4, 317–324. [Google Scholar] [CrossRef]
- Xu, L.; Lee, E.W.M. Variational Iteration Method for the Magnetohydrodynamic Flow over a Nonlinear Stretching Sheet. Abstr. Appl. Anal. 2013, 2013, 573782. [Google Scholar] [CrossRef]
- Khan, U.; Zaib, A.; Madhukesh, J.K.; Elattar, S.; Eldin, S.M.; Ishak, A.; Raizah, Z.; Waini, I. Features of Radiative Mixed Convective Heat Transfer on the Slip Flow of Nanofluid Past a Stretching Bended Sheet with Activation Energy and Binary Reaction. Energies 2022, 15, 7613. [Google Scholar] [CrossRef]
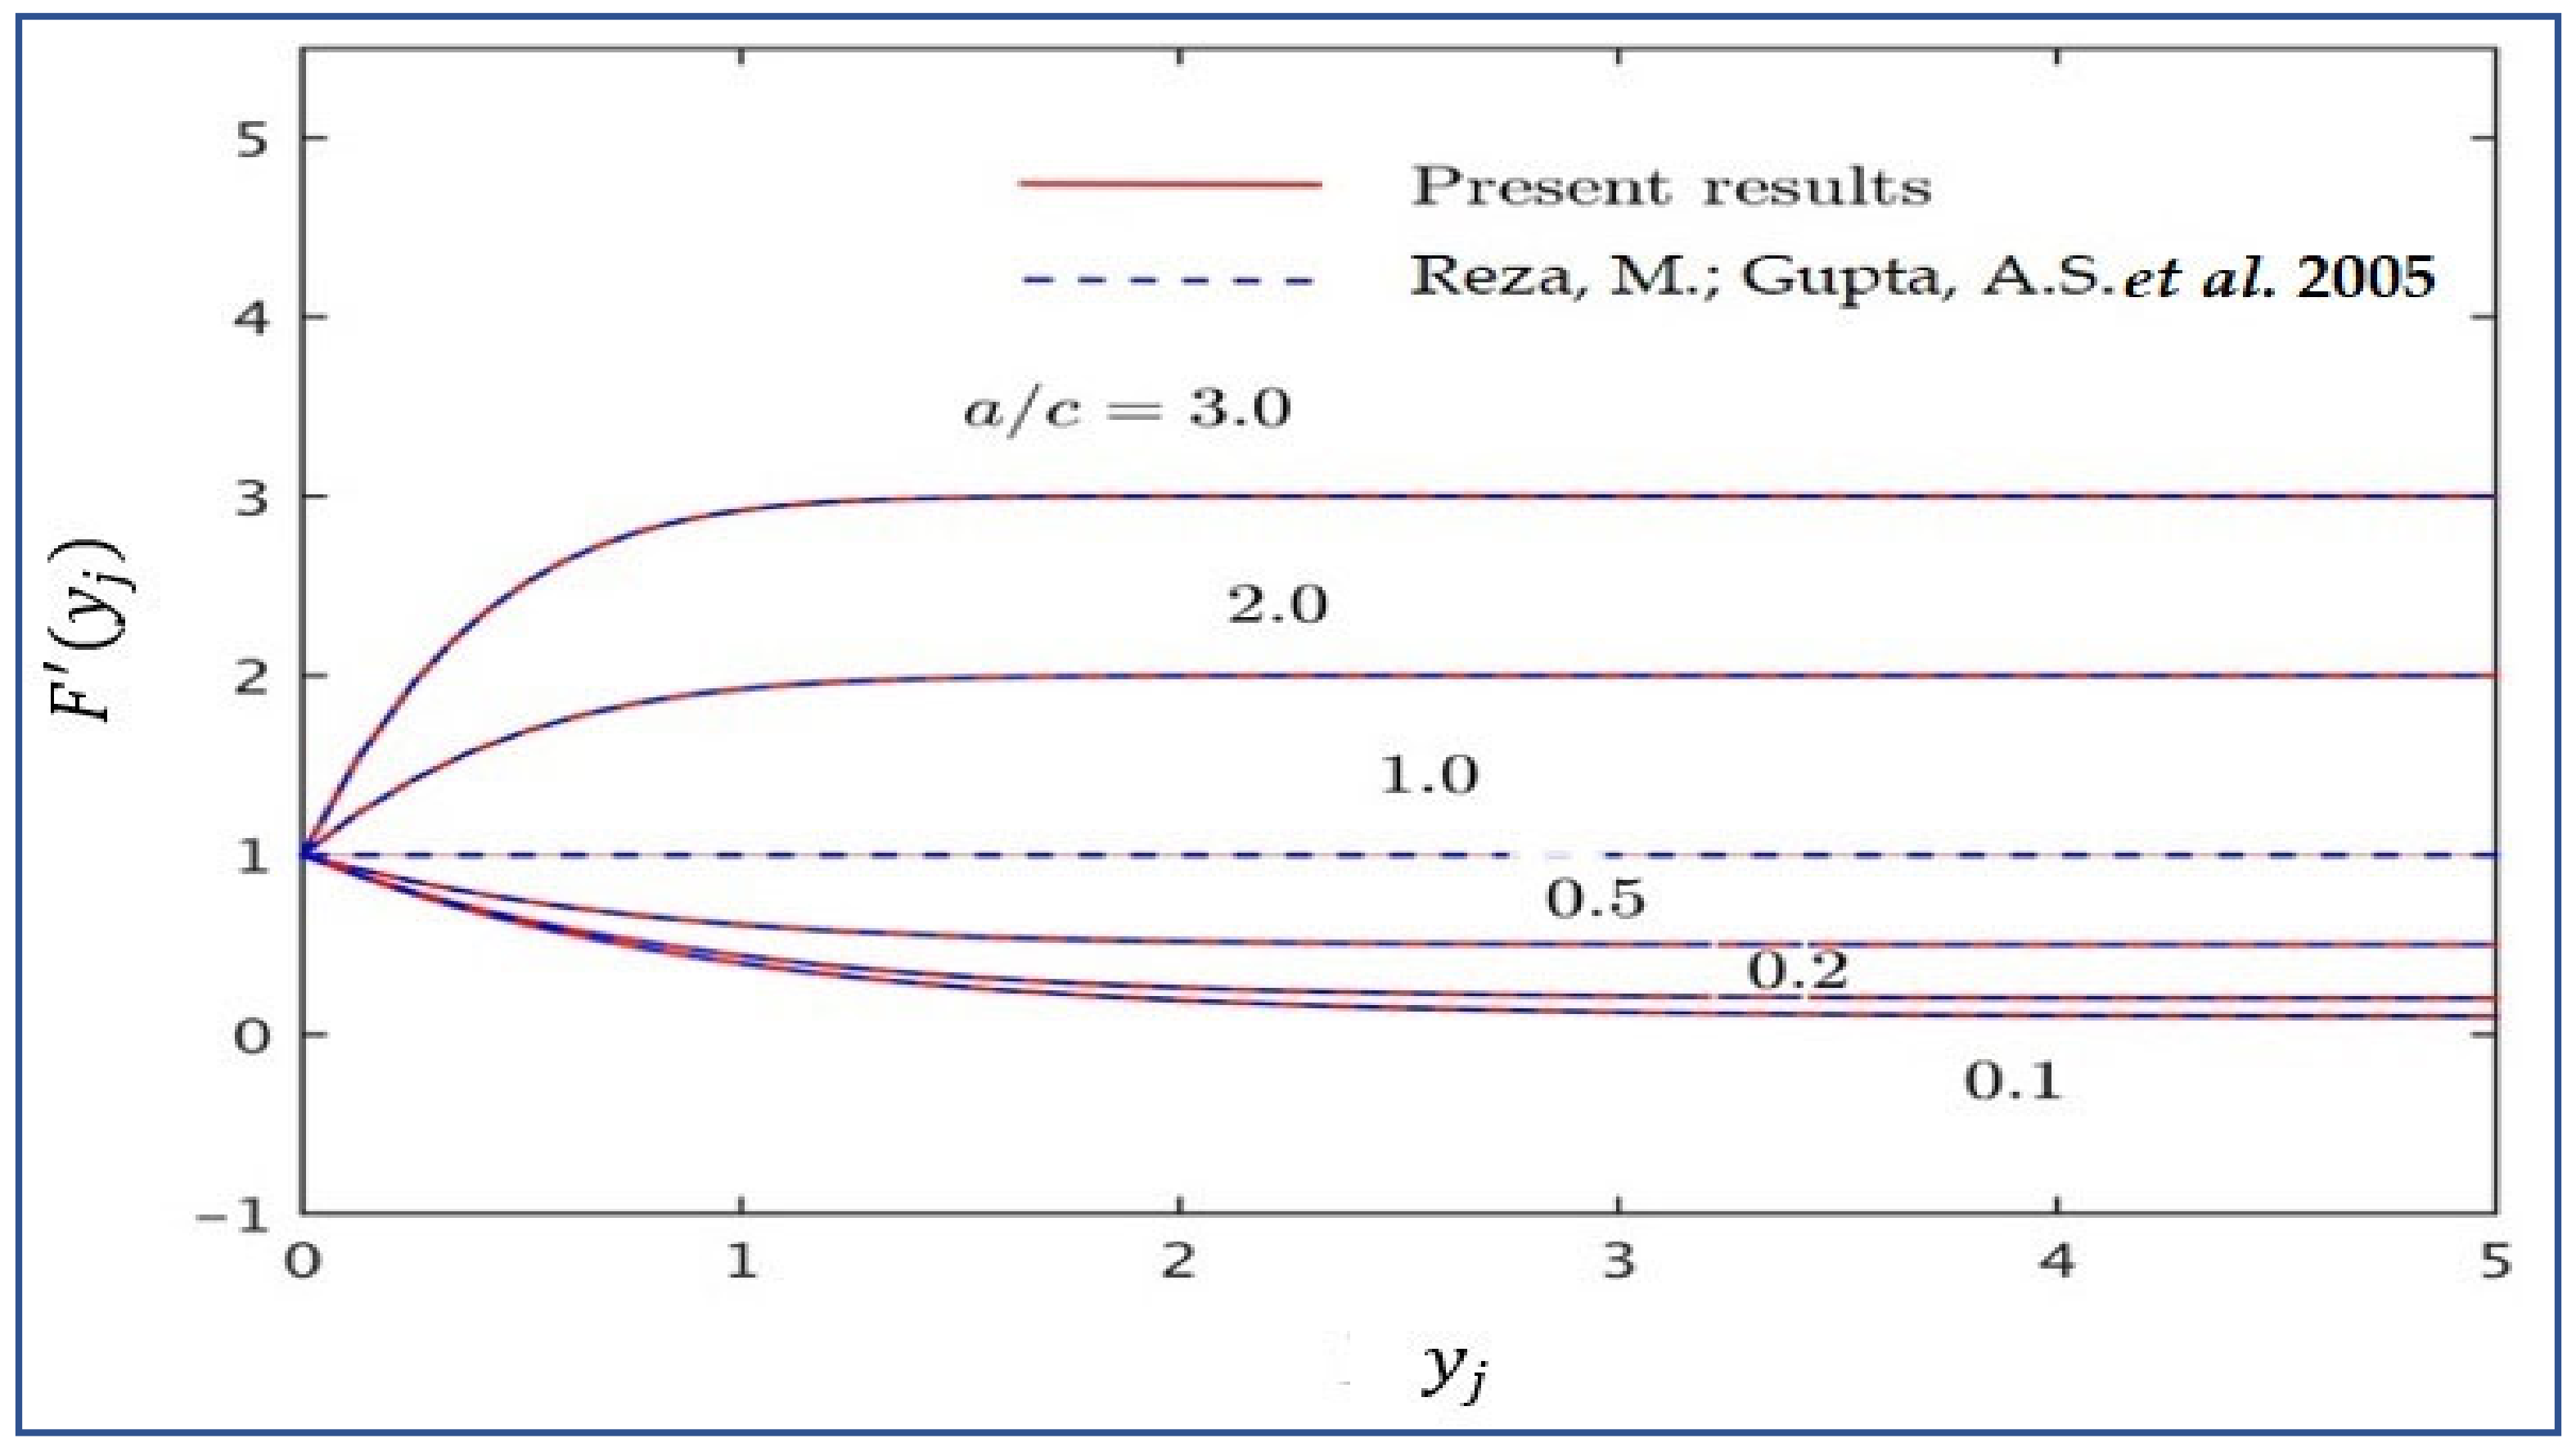
- Reza, M.; Gupta, A.S. Steady two-dimensional oblique stagnation-point flow towards a stretching surface. Fluid Dyn. Res. 2005, 37, 334–340. [Google Scholar] [CrossRef]
- Lok, Y.; Pop, I.; Ingham, D.; Amin, N. Mixed convection flow of a micropolar fluid near a non-orthogonal stagnation-point on a stretching vertical sheet. Int. J. Numer. Methods Heat Fluid Flow 2009, 19, 459–483. [Google Scholar] [CrossRef]
- Nadeem, S.; Khan, M.R.; Khan, A.U. MHD oblique stagnation point flow of nanofluid over an oscillatory stretching/shrinking sheet: Existence of dual solutions. Phys. Scr. 2019, 94, 075204. [Google Scholar] [CrossRef]
- Li, X.; Khan, A.U.; Khan, M.R.; Nadeem, S.; Khan, S.U. Oblique Stagnation Point Flow of Nanofluids over Stretching/Shrinking Sheet with Cattaneo–Christov Heat Flux Model: Existence of Dual Solution. Symmetry 2019, 11, 1070. [Google Scholar] [CrossRef]
- Ramachandran, N.; Chen, T.S.; Armaly, B.F. Mixed Convection in Stagnation Flows Adjacent to Vertical Surfaces. J. Heat Transf. 1988, 110, 373–377. [Google Scholar] [CrossRef]
- Haq, R.U.; Sajjad, T.; Usman, M.; Naseem, A. Oblique stagnation point flow of Micropolar nanofluid impinge along a vertical surface via modified Chebyshev Collocation Method. Phys. Fluids 2022, 34, 102001. [Google Scholar] [CrossRef]
- Ogorodnyk, O.; Martinsen, K. Monitoring and Control for Thermoplastics Injection Molding: A Review. Procedia CIRP 2018, 67, 380–385. [Google Scholar] [CrossRef]
- Geem, Z.W. Optimal cost design of water distribution networks using harmony search. Eng. Optim. 2006, 38, 259–277. [Google Scholar] [CrossRef]
- Hahladakis, J.N.; Iacovidou, E. Closing the loop on plastic packaging materials: What is quality and how does it affect their circularity? Sci. Total. Environ. 2018, 630, 1394–1400. [Google Scholar] [CrossRef]
- Souayeh, B.; Bhattacharyya, S.; Hdhiri, N.; Hammami, F.; Yasin, E.; Raju, S.S.K.; Alam, M.W.; Alsheddi, T.; Al Nuwairan, M. Effect of Magnetic Baffles and Magnetic Nanofluid on Thermo-Hydraulic Characteristics of Dimple Mini Channel for Thermal Energy Applications. Sustainability 2022, 14, 10419. [Google Scholar] [CrossRef]
- Zheng, Y.; Gu, F.; Ren, Y.; Hall, P.; Miles, N.J. Improving Mechanical Properties of Recycled Polypropylene-based Composites Using TAGuchi and ANOVA Techniques. Procedia CIRP 2017, 61, 287–292. [Google Scholar] [CrossRef]
- Gholizadeh, S.; Barzegar, A. Shape optimization of structures for frequency constraints by sequential harmony search algorithm. Eng. Optim. 2013, 45, 627–646. [Google Scholar] [CrossRef]
- Khan, U.; Zaib, A.; Ishak, A.; Alotaibi, A.M.; Elattar, S.; Pop, I.; Abed, A.M. Impact of an Induced Magnetic Field on the Stagnation-Point Flow of a Water-Based Graphene Oxide Nanoparticle over a Movable Surface with Homogeneous–Heterogeneous and Chemical Reactions. Magnetochemistry 2022, 8, 155. [Google Scholar] [CrossRef]
- Kalantari, K.R.; Ebrahimnejad, A.; Motameni, H. A fuzzy neural network for web service selection aimed at dynamic software rejuvenation. Turk. J. Electr. Eng. Comput. Sci. 2020, 28, 2718–2734. [Google Scholar] [CrossRef]
- Abed, A.M.; Elattar, S.; Gaafar, T.S.; Alrowais, F. The Neural Network Revamping the Process’s Reliability in Deep Lean via Internet of Things. Processes 2020, 8, 729. [Google Scholar] [CrossRef]
- Abed, A.M.; Seddek, L.F.; AlArjani, A. Enhancing Two-Phase Supply Chain Network Distribution via Three Meta-Heuristic Optimization Algorithms Subsidized by Mathematical Procedures. J. Adv. Manuf. Syst. 2022, 22, 1–32. [Google Scholar] [CrossRef]
- Raza, A.; Khan, U.; Raizah, Z.; Eldin, S.M.; Alotaibi, A.M.; Elattar, S.; Abed, A.M. Numerical and Computational Analysis of Magnetohydrodynamics over an Inclined Plate Induced by Nanofluid with Newtonian Heating via Fractional Approach. Symmetry 2022, 14, 2412. [Google Scholar] [CrossRef]
- Madhukesh, J.; Kumar, R.N.; Khan, U.; Gill, R.; Raizah, Z.; Elattar, S.; Eldin, S.; Shah, S.; Rajappa, B.; Abed, A. Analysis of buoyancy assisting and opposing flows of colloidal mixture of titanium oxide, silver, and aluminium oxide nanoparticles with water due to exponentially stretchable surface. Arab. J. Chem. 2023, 104550. [Google Scholar] [CrossRef]
- Hobiny, A.D.; Abbas, I.A. Theoretical analysis of thermal damages in skin tissue induced by intense moving heat source. Int. J. Heat Mass Transf. 2018, 124, 1011–1014. [Google Scholar] [CrossRef]
- Abbas, I.A.; El-Amin, M.; Salama, A. Effect of thermal dispersion on free convection in a fluid saturated porous medium. Int. J. Heat Fluid Flow 2009, 30, 229–236. [Google Scholar] [CrossRef]
- Raza, A.; Khan, U.; Eldin, S.M.; Alotaibi, A.M.; Elattar, S.; Prasannakumara, B.C.; Akkurt, N.; Abed, A.M. Significance of Free Convection Flow over an Oscillating Inclined Plate Induced by Nanofluid with Porous Medium: The Case of the Prabhakar Fractional Approach. Micromachines 2022, 13, 2019. [Google Scholar] [CrossRef]
- Ghadyanlou, F.; Azari, A.; Vatani, A. Experimental Investigation of Mass Transfer Intensification for CO2 Capture by Environment-Friendly Water Based Nanofluid Solvents in a Rotating Packed Bed. Sustainability 2022, 14, 6559. [Google Scholar] [CrossRef]
- Saeed, T. A Study on Thermoelastic Interaction in a Poroelastic Medium with and without Energy Dissipation. Mathematics 2020, 8, 1286. [Google Scholar] [CrossRef]
- Abed, A.M.; Seddek, L.F.; Elattar, S. Building a Digital Twin Simulator Checking the Effectiveness of TEG-ICE Integration in Reducing Fuel Consumption Using Spatiotemporal Thermal Filming Handled by Neural Network Technique. Processes 2022, 10, 2701. [Google Scholar] [CrossRef]


| Defects | Houseware | Engineering Helmet | Window Frames | The Front Bumper of the Car | Sub Total Defects | % Age | Acc. |
|---|---|---|---|---|---|---|---|
| Air bubbles | 36 | 341 | 271 | 263 | 911 | 35.52% | 0.35 |
| Number of of Shock absorp. | 2 | 145 | 125 | 267 | 539 | 20.96% | 0.56 |
| Flow marks | 0 | 102 | 98 | 21 | 221 | 8.59% | 0.65 |
| Burn marks | 16 | 23 | 97 | 0 | 136 | 5.29% | 0.70 |
| Scratches | 5 | 65 | 78 | 85 | 233 | 9.06% | 0.79 |
| Short die | 3 | 62 | 8 | 5 | 78 | 3.03% | 0.82 |
| oil/dirt | 13 | 49 | 35 | 9 | 106 | 4.12% | 0.86 |
| white marks | 0 | 0 | 5 | 1 | 6 | 0.23% | 0.87 |
| Shrinkage | 46 | 91 | 105 | 65 | 307 | 11.94% | 0.99 |
| Black dots (cavity) | 2 | 6 | 8 | 0 | 16 | 0.62% | 0.99 |
| others | 2 | 16 | 0 | 1 | 19 | 0.74% | 1.00 |
| Total | 125 | 900 | 830 | 717 | 2572 |
| Variables | Defination | |
|---|---|---|
| The maximum number of Iteration (stopping rule) | ||
| Iteration | The initial setting number for the iteration [10–100] | |
| Cloud history set | ||
| Number of artificial agents which represent the number of IFM parameters | ||
| Number of dimensions that represent the IFM sequancing, where N is the # of parameters | ||
| User defined parameter ; [0, 1] | ||
| The buoyancy of mixed convection factor | ||
| User defined parameter in a hidden layer | ||
| Upper level for each parameter in the left layer | ||
| Lower level for each parameter in the right layer | ||
| The step length of jumping move over the solutions mesh set by 0.0034 within the specific range [LL, UL] | ||
| Fitness of the current point of agent that achieved the desired output by setting the exact value for the parameter | ||
| Fitness of the target point (specific value) determined after using RSM classification | ||
| The position vector of the current agent | ||
| The position vector of the target point needs to reset continuously | ||
| Vector combines an agent to target point between [UL, LL] | ||
| The movement direction of the searching vector of an agent toward UL or LL | ||
| Signum function | ||
| A shear flow parameter | ||
| The respective strain rate of the uniform shear flow parallel to the wall into the incubator | ||
| Signifies the requisite velocity slip parameter | ||
| Characteristic lengths | ||
| The absolute viscosity of the MHD | ||
| The thermal conductivity of the base fluid | ||
| The density | ||
| The thermal expansion of coefficient | ||
| The specific heat capacitance of the nanofluid | ||
| The prediction of specific response (amount of nanoparticles releted to defective mixture) | ||
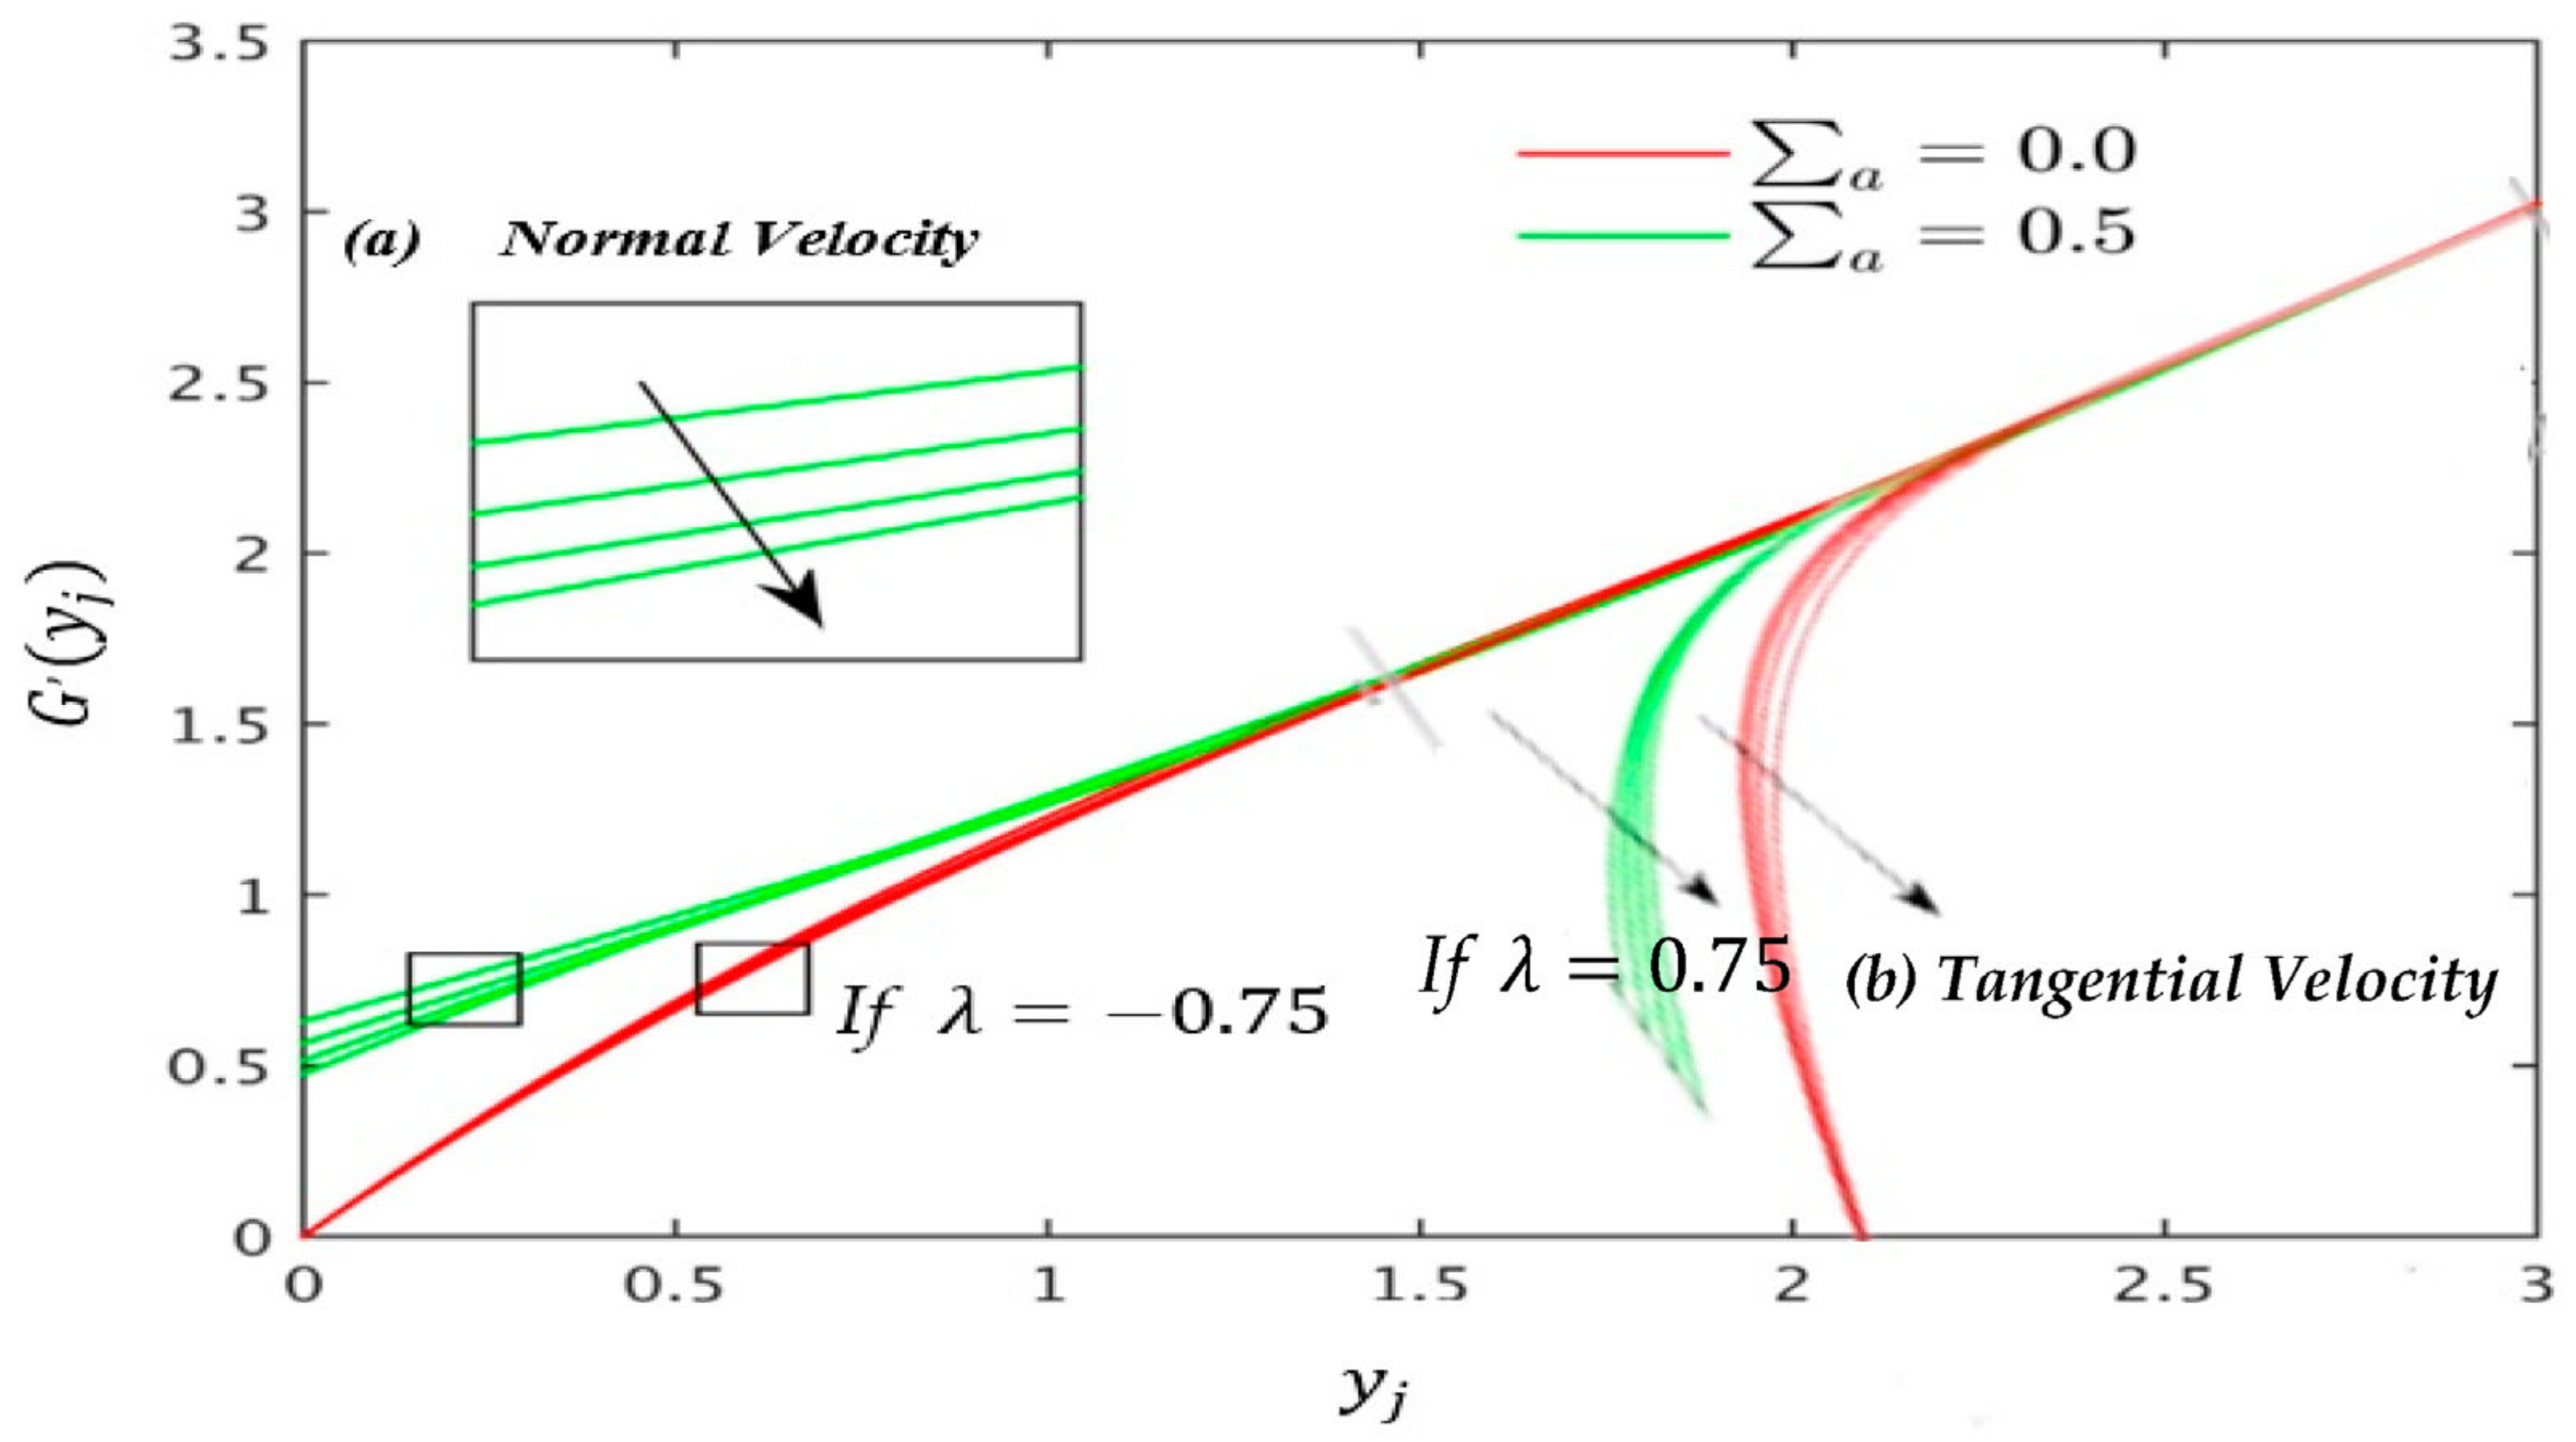
| Normal velocity pattern | ||
| ). | ||
| Properties | Nanofluid | |
|---|---|---|
| Viscosity | ||
| Thermal conductivity | ||
| Density | ||
| Thermal expansion coefficient | ||
| Specific heat capacity | ||
| Prandtl number | ||
| Buoyancy or mixed convection factor | = = | , designates to forced convection flow |
| , designates to buoyancy or mixed convection flow | ||
| , refers to the case of BAF or heated die | ||
| , refers to the buoyancy opposing flow or cooled die | ||
| Reynolds number | ||
| Grashof number | ||
| Properties | |||||
|---|---|---|---|---|---|
| Liquid solution | 0.62 | 4180 | 996.9 | 22 | 6.84 |
| 39 | 766 | 3969 | 26.01 | --- | |
| 29 | 570 | 2145 | 21 | --- |
| Parameters | Levels | ||
|---|---|---|---|
| Minimum | Medium | Maximum | |
| Up Melt Temperature | |||
| Injection Pressure | 80 bars | 90 bars | 100 bars |
| Injection speed | 20 m/s | 23 m/s | 26 m/s |
| Screw speed | 18 rev/min | 21 rev/min | 24 rev/min |
| Flow rate | 31.25 g/10 min | 35.5 g/10min | 39.25 g/10min |
| Viscosity | 1.8 Pa-s | Pa-s | Pa-s |
| Rota circulation meter | 3 rpm | 4 rpm | 6 rpm |
| Resistance aisles orifice | 1.1 g/10 min | 1.4 g/10 min | 1.9 g/10 min |
| Source | ||||||
| A | Thaw temperature (°C) | 5 | 0.0494 | 0.013724 | 5.28 | 0.02045 |
| B | Injection Pressure (Pa) | 5 | 0.0492 | 0.0142011 | 4.93 | 0.05156 |
| C | Injection speed (m/s) | 5 | 0.0023 | 0.02712 | 19.52 | 0.01389 |
| D | Screw speed (m/s) | 5 | 0.0126 | 0.01527 | 21.31 | 0.01130 |
| Errors | 5 | 0.0097 | 0.002408 | |||
| Sum | 30 | 0.5585 | ||||
| Eliminated | Evaluated | Cov. | MSE | ||
| −0.62 | −0.059 | 0.9545 | 0.7243 | 758.11 | |
| 0.84 | 0.12 | 0.9091 | 0.7238 | 664.67 | |
| −0.98 | −0.15 | 0.8866 | 0.7230 | 592.42 | |
| 1.73 | 0.28 | 0.7886 | 0.7207 | 537.70 | |
| −2.53 | −0.40 | 0.6953 | 0.7161 | 496.76 | |
| −6.87 | −0.87 | 0.4016 | 0.6965 | 486.88 | |
| −11.00 | −0.91 | 0.3822 | 0.6757 | 480.25 | |
| −8.92 | −8.97 | 0.3507 | 0.6523 | 478.09 | |
| 17.45 | 1.45 | 0.1683 | 0.5999 | 513.48 | |
| 9.10 | 1.48 | 0.1584 | 0.5411 | 552.12 | |
| 8.70 | 1.44 | 0.4816 | 0.4816 | 586.99 |
| Assisting Flow | |||||
| Shear stress | 0.75 | −1.6412 −1.6235 | −1.4288 −1.5362 | 1.3 | |
| Heat transfer | |||||
| Shear stress | 1.5 | −1.9517 −1.8735 | −1.6793 −1.6218 | 1.6 | |
| Heat transfer | |||||
| Shear stress | 3.0 | −2.6573 −2.4251 | −2.2488 −2.4187 | 2.1 | |
| Heat transfer | |||||
| Opposing Flow | |||||
| Shear stress | −0.75 | −1.4151 | −1.2466 −1.5362 | 1.3 | |
| Heat transfer | |||||
| Shear stress | −1.5 | −1.1051 | −0.9961 −1.6218 | 1.6 | |
| Heat transfer | |||||
| Shear stress | −3.0 | −0.3994 | −0.4266 −2.4187 | 2.1 | |
| Heat transfer | |||||
| Factors | Levels | |
|---|---|---|
| Minimum | Maximum | |
| Up Melt Temperature (°C) | ||
| Injection Pressure (bars) | 80 | 90 |
| Injection speed (m/s) | 35.3 | 39.25 |
| Screw speed (rev/min) | 24 | 32 |
| Comparing Functions and Methods | Range | D | f(S*) | Modal | Image Analysis Results | WSA | IFM | |||
|---|---|---|---|---|---|---|---|---|---|---|
| 1 | [−30:30] | (2572, 3, 3) | 10 | 0 | Multi. | best | 0.013 | 8.88 × 10⁻¹⁵ | 7.3 × 10⁻¹⁵ | |
| Mean | 0.054 | 8.88 × 10⁻¹⁵ | 7.3 × 10⁻¹⁵ | |||||||
| StdDev | 0.054 | 1.0029 × 10⁻³¹ | 0.041 | |||||||
| Avg time | 115 | 33 | 46 | |||||||
| 2 | [−1:1] | (2572, 9, 3) | 2,4 | 0.4 | Uni. | best | 0.399 | 0.4 | 0.4 | |
| Mean | 0.398 | 0.4 | 0.4 | |||||||
| StdDev | 7.050 × 10⁻⁴ | 1.693 × 10⁻¹⁶ | 1.693 × 10⁻¹⁶ | |||||||
| Avg time | 97 | 26 | 26 | |||||||
| 3 | [0: Pi] | (2572, 3, 3) | 5 | −9.66 | Multi. | best | −9.527 | −7.2085 | −7.2086 | |
| Mean | −9.146 | −6.741 | −6.739 | |||||||
| StdDev | 0.226 | 7.656 | 5.01 | |||||||
| Avg time | 399 | 54 | 54 | |||||||
| 4 | [−1:1] | (2572, 3153) | 10 | 1 | Uni. | best | 0.992 | 1 | 1.05 | |
| Mean | 0.985 | 1 | 1 | |||||||
| StdDev | 0.0045 | 0 | 0 | |||||||
| Avg time | 103 | 30 | 30 | |||||||
| 5 | [−600:600] | (2572, 0, 0) | 10 | 0 | Multi. | best | 0.325 | 0 | 0 | |
| Mean | 0.765 | 0 | 0 | |||||||
| StdDev | 0.266 | 0 | 0 | |||||||
| Avg time | 150 | 32 | 49 | |||||||
| 6 | [0:1] | (2572, 3, 3) | 6 | −3.322 | Multi. | best | −3.319 | −3.304 | −3.315 | |
| Mean | −3.253 | −3.1602 | −3.1603 | |||||||
| StdDev | 0.0476 | 0.082 | 0.082 | |||||||
| AvgTime | 168 | 40 | 40 | |||||||
| 7 | [0:10] | (2572, 3, 3) | 10 | −0.965 | Multi. | best | −1.77 × 10⁻⁵ | −0.95892 | −0.9589 | |
| Mean | −6.48 × 10⁻⁷ | −0.70597 | −0.70464 | |||||||
| StdDev | 3.234 × 10⁻⁶ | 0.14413 | 0.14407 | |||||||
| Avg time | 182 | 64 | 53 | |||||||
| 8 | [−D2:D2] | (2572, 3, 24) | 10 | −210 | Multi. | best | −209.910 | −174.025 | −174.01 | |
| Mean | −208.398 | −118.745 | −119.746 | |||||||
| StdDev | 1.96285 | 29.4082 | 56.85355 | |||||||
| Avg time | 117 | 23 | 67 | |||||||
| 9 | [−15:15] | (2572, 3, 3) | 10 | −1.144 | Multi. | best | −0.0049 | −0.1703 | −0.3357 | |
| Mean | −0.0022 | −0.1425 | −0.2828 | |||||||
| StdDev | 9.081 × 10⁻⁴ | 0.01729 | 9.081 × 10⁻⁵ | |||||||
| Avg time | 177 | 49 | 59 | |||||||
| 10 | [2:10] | (2572, 3, 3) | 10 | −45.78 | Uni. | best | −45.76 | −30.78 | −29.79 | |
| Mean | −45.74 | −27.38 | −26.39 | |||||||
| StdDev | 0.014 | 2.036 | 4.058 | |||||||
| Avg time | 196 | 55 | 78 | |||||||
| 11 | [−5.12:5.12] | (2572, 3, 0) | 10 | 0 | Multi. | best | 0.039 | 0 | 0 | |
| Mean | 0.159 | 0 | 0 | |||||||
| StdDev | 0.095 | 0 | 0 | |||||||
| Avg time | 141 | 32 | 18 | |||||||
| 12 | [−30:30] | (2572, 3,3) | 10 | 0 | Uni. | best | 0.92 | 8.917 | 0.664 | |
| Mean | 6.411 | 8.945 | 2.183 | |||||||
| StdDev | 1.818 | 0.016 | 0.013 | |||||||
| Avg time | 98 | 25 | 81 | |||||||
| 13 | [−100:100] | (2572, 3, 0) | 10 | 0 | Uni. | best | 0.09987 | 0 | 0 | |
| Mean | 0.20668 | 0 | 0 | |||||||
| StdDev | 0.0904 | 0 | 0 | |||||||
| Avg time | 69 | 20 | 14 | |||||||
| 14 | [0:10] | (2572, 379, 1331) | 5, 10 | −10.4 | Multi. | best | −10.4 | −10.06 | −9.72 | |
| Mean | −6.43 | −8.09 | −9.75 | |||||||
| StdDev | 3.62 | 1.124 | −1.372 | |||||||
| Avg time | 171 | 43 | 85 | |||||||
| 15 | [0:180] | (2572, 103, 230) | 10,20 | −3.5 | Multi. | best | −3.489 | −3.4913 | −3.9337 | |
| Mean | −3.4504 | −3.467 | −3.3570 | |||||||
| StdDev | 0.022 | 0.0137 | 0.0054 | |||||||
| Avg time | 193 | 34 | 112 |
| Run | 1 | 2 | 3 | Mean |
|---|---|---|---|---|
| 1 | 0.629 | 0.827 | 0.678 | 0.709 |
| 2 | 0.618 | 0.838 | 0.659 | 0.709 |
| 3 | 0.638 | 0.819 | 0.648 | 0.701 |
| Total Mean | 0.706 | |||
| Working Parameters | Piston (1) | Piston (2) | Piston (3) | |||
|---|---|---|---|---|---|---|
| Low | High | Low | High | Low | High | |
| Melt Temperature (°C) | 220 | 230 | 220 | 230 | 220 | 240 |
| Injection Pressure (bar) | 80 | 100 | 80 | 90 | 80 | 95 |
| Injection speed | 20 | 25 | 20 | 25 | 20 | 25 |
| Screw speed | 16 | 18 | 18 | 20 | 22 | 24 |
| Flow rate (g/s) | 2.912 | 3.125 | 2.745 | 3.224 | 2.957 | 3.139 |
| Viscosity (Pa-s) | 1.8 × | 2.3 × | 1.9 × | 2.02 × | 1.8 × | 2.48 × |
| Defect | Before | After | Improve (%) |
|---|---|---|---|
| Shrinkage | 539 | 52 | 90.4% |
| Flow marks | 221 | 46 | 79.2% |
| # of Shock absorption | 41 | 307 | 86.6% |
| Air bubbles | 911 | 39 | 95.7% |
| Scratches | 233 | 13 | 94.4% |
| Burn marks | 136 | 4 | 97.1% |
Disclaimer/Publisher’s Note: The statements, opinions and data contained in all publications are solely those of the individual author(s) and contributor(s) and not of MDPI and/or the editor(s). MDPI and/or the editor(s) disclaim responsibility for any injury to people or property resulting from any ideas, methods, instructions or products referred to in the content. |
© 2023 by the authors. Licensee MDPI, Basel, Switzerland. This article is an open access article distributed under the terms and conditions of the Creative Commons Attribution (CC BY) license (https://creativecommons.org/licenses/by/4.0/).
Share and Cite
Abed, A.M.; AlArjani, A.; Seddek, L.F.; ElAttar, S. Modify the Injection Machine Mechanism to Enhance the Recycling of Plastic Waste Mixed with MHD Nanoparticles. Sustainability 2023, 15, 2641. https://0-doi-org.brum.beds.ac.uk/10.3390/su15032641
Abed AM, AlArjani A, Seddek LF, ElAttar S. Modify the Injection Machine Mechanism to Enhance the Recycling of Plastic Waste Mixed with MHD Nanoparticles. Sustainability. 2023; 15(3):2641. https://0-doi-org.brum.beds.ac.uk/10.3390/su15032641
Chicago/Turabian StyleAbed, Ahmed M., Ali AlArjani, Laila F. Seddek, and Samia ElAttar. 2023. "Modify the Injection Machine Mechanism to Enhance the Recycling of Plastic Waste Mixed with MHD Nanoparticles" Sustainability 15, no. 3: 2641. https://0-doi-org.brum.beds.ac.uk/10.3390/su15032641