Article

Experimental Assessment of the Thermal Influence of a Continuous Living Wall in a Subtropical Climate in Brazil

by
Murilo Cruciol-Barbosa
1,
Maria Solange Gurgel de Castro Fontes
1,* and
Maximiliano dos Anjos Azambuja
2,*
1
School of Architecture, Arts, Communication and Design of Bauru, São Paulo State University (UNESP), Av. Engenheiro Luiz Edmundo Carrijo Coube 14-01, Bauru 17033-360, SP, Brazil
2
Departamento of Civil and Environmental Engineering, São Paulo State University (UNESP), Av. Engenheiro Luiz Edmundo Carrijo Coube 14-01, Bauru 17033-360, SP, Brazil
*
Authors to whom correspondence should be addressed.
Sustainability 2023, 15(4), 2985; https://0-doi-org.brum.beds.ac.uk/10.3390/su15042985
Submission received: 15 September 2022 / Revised: 8 October 2022 / Accepted: 20 October 2022 / Published: 7 February 2023
(This article belongs to the Special Issue Sustainable Energy Saving Building Envelopes)

Abstract

:
A continuous living wall is a vertical garden that allows the cultivation of a wide variety of species on vertical surfaces, consisting of a sequence of layers that shade and add thermal resistance to the external façades of buildings. Thus, the living wall can be an alternative to increase the thermal efficiency of the building and reduce the use of air conditioning for cooling the indoor environment. This work experimentally investigated the thermal influence of a continuous living wall on the surface temperatures of an east façade in a subtropical climate with hot summers (Cfa), during the summer period. The experiment included the implementation of a real living wall in a seasonally used building and the delimitation of two sample plots (i.e., protected and bare wall). Campaigns were carried out to measure the external and internal surface temperatures of the protected plot, the living wall, and the bare wall, as well as the cavity air temperature, from 08:00 to 17:45, at 15-min intervals. The results show the efficiency of the living wall in reducing the external (up to 10.6 °C) and internal (up to 2.9 °C) surface temperatures of the protected plot compared to the bare wall, along with a reduction in thermal variation (average reduction of 6.5 °C externally and 3.6 °C internally) and an increase in thermal delay (up to 6 h for external and 1 h for internal), in addition to a reduction in temperature and greater thermal stability of the cavity between the garden and the protected land in comparison to the external space.

1. Introduction

The impacts resulting from the urbanization process alter the thermal properties of the sites, reduce evapotranspiration, modify wind circulation and heat dissipation, contribute to anthropogenic residual heat retention, and modify the energy balance and emissivity of the urban environment [1,2,3]. These changes contribute to creating the heat island phenomenon [1] and increase the amount of energy required to maintain the thermal comfort of users in buildings [4].
In this scenario, different types of urban green infrastructure (e.g., urban afforestation, rain gardens, vertical gardens, etc.) function as alternatives that can contribute to mitigating high urban temperatures through shading and increased evapotranspiration.
Among the various types of urban green infrastructure, vertical gardens allow vegetation to grow and develop in large areas of vertical surfaces [3,5]. Thus, their implementation on walls and façades of buildings is a way to expand urban green areas [6,7] and improve the thermal and energy performance of buildings and, consequently, the thermal comfort of occupants [2,8,9].
A living wall can influence the thermal performance of a building due to microclimatic changes in the surroundings and the internal environment through the mechanisms of shading, thermal insulation, evapotranspiration, cooling, and wind barrier [3,9,10,11,12,13].
Research has emphasized that the most important mechanism of the living wall with respect to the thermal performance of the building is shading, and its effects are clearer in summer period. This occurs because the constructive structure and the vegetation in the garden shade the building and prevent the incidence of direct solar radiation, consequently contributing to reducing the surface temperatures of the protected wall.
In this sense, the continuous living wall is a vertical garden system that stands out, because its final structure consists of numerous layers (i.e., structure + vegetation + air cavity) that shade the façade, add thermal resistance to the building envelope [12], act as an external thermal insulator, and allow the cultivation of several species with the roots growing freely [14,15].
However, the thermal efficiency of the living wall depends not only on its structure, but also on the local climate and façade orientation. In this regard, Ref. [16] emphasize that the orientation of the building is a key factor for the implementation of the vertical garden and the improvement of the energy efficiency of the building.
Considering this, the influence of living walls on the surface temperature of buildings in the summer period has been investigated in various climates, including Mediterranean [17,18,19,20], tropical [3,21,22,23], subtropical [2], arid/semi-arid [24,25], and oceanic climates [26].
In tropical climates, Wong et al. (2010) [3], Chen et al. (2013) [22], Tan et al. (2014) [23], and Charoenkit and Yiemwattana (2017) [21] found that surface temperature reductions ranged from 0.1 °C [21] to 20.8 °C [22] and from 1.0 °C [21] to 7.7 °C [22] for external and internal surface temperatures, respectively.
The “tray” model living wall (i.e., modular metallic or polypropylene trays with fixed size, where the vegetation is planted, and which are connected laterally for continuity [15]) was investigated by all authors. Only Charoenkit and Yiemwattana (2017) [21] and Chen et al. (2013) [22] specified the orientation of the walls (west and south, respectively). Wong et al. (2010) [3] were the only authors who compared different types of vertical gardens but with a sample wall with both sides in contact with the external environment and without specifying the orientation.
In Mediterranean and oceanic climates, the authors Coma et al. (2017) [17], Djedjig et al. (2017) [26], Mazzali et al. (2013) [18] and Perini et al. (2017) [19] also recorded significant reductions in external surface temperatures, ranging from 15 °C [26] (Djedjig et al., 2017) to 21.5 °C [17], and in internal surface temperatures, ranging from 1.75 °C [20] to 10 °C [26]. Only Mazzali et al. (2013) [18], Perini et al. [19] and Razzaghmanesh and Razzaghmanesh (2017) [20] investigated continuous living walls sampled in real buildings, with southeast, west, and south orientations, respectively.
The only study carried out in a humid subtropical climate was that of Pan et al. (2018) [2], but with a modular living wall of vessels, which showed a maximum external surface temperature reduction of 6.4 °C for the west face at 15:30, while the other orientations had maximum reductions of 4.4 °C. No data were reported for internal surface temperature.
Considering the last 4 years, according to a literature review carried out using the Scopus database, only Ruiz-Valero et al. (2022) [27] investigated a continuous living wall using test cells under real conditions—in a tropical savanna climate, under winter and dry weather conditions, and with a southern orientation. It was also unclear whether the experimental live wall followed the guidelines for sealing the air cavity between it and the protected wall.
In the Brazilian climate scenario, only one study had been carried out with continuous living walls in the summer, but in a high-altitude tropical climate (Cwa) and with north and west orientations [28].
The cited experimental studies demonstrate that there is a gap in terms of climatic diversity, façade orientation, and living wall models in this research. The studies are concentrated in European and Asian countries with south and west orientations. In addition, there is no sampling pattern, ranging from independent walls (vulnerable to interference from external factors in the measured values) to real buildings and environments.
In this context, this work aims to evaluate the thermal influence of a “continuous” living wall on the surface temperatures of an east façade during the summer in a Brazilian city with a subtropical climate and hot summers (Cfa). In addition, it also seeks to (1) characterize the impact of vegetation on surface temperatures, (2) characterize the thermal gradient along the “garden-protected plot” system, and (3) characterize the thermal variation of the air temperature in the cavity between the garden and the protected wall.
The experimental approach considers a full-size garden, built in a seasonally used building, and respects the guidelines of Chen et al. (2013) [22] and Pérez et al. (2014) [10] with respect to side sealing and maximum air cavity size.

2. Materials and Methods

To identify the thermal influence of a continuous living wall on the surface temperatures of a building, our research was conducted in the state of São Paulo, in the city of Bauru (Lat. 22°18′54″ S, Long. 49°03′39″ W), within the campus of the Universidade Estadual Paulista (UNESP), in Brazil (Figure 1).
The city’s climate is the Cfa type (subtropical climate, with hot summers), according to the Köppen classification [31], and has summers characterized by increased solar radiation, with high temperatures (up to 31 °C) and air humidity that favors the occurrence of convective rains, mainly in the afternoon [32].

2.1. The Experimental Garden

The experiment, consisting of a living wall, was built on the east façade of a building at the Faculty of Architecture, Arts, Communication, and Design that receives solar radiation from 8:00 to 12:00 and is used as a space for students to socialize (Figure 2). The façade was divided into parts, and two sample plots were established (with and without the living wall) with equal areas of 2.80 m × 2.80 m and spaced 30 cm apart from one another to avoid the influence of the edge effect, as shown in Figure 3.
The living wall was built in a succession of layers: (1) wooden rafters fixed to the wall that create an air cavity 7 cm thick; (2) sealing gutters; (3–5) planting modules made with waterproof ecological boards derived from recycled Tetrapak® and layers of geotextile felt; and (6) irrigation (Figure 4). The choice for the continuous living wall took into account not only the lack of Brazilian studies, but also the shading characteristic provided by the entire structure of the vertical garden at the end of its installation, with 100% protected wall coverage, in addition to the ease of installation and garden maintenance. This living wall model is also the most common when used on an urban scale, as in the landscape interventions on Elevado João Goulart [33] and Avenida 23 de Maio, in the city of São Paulo [34].
The use of recycled Tetrapak® ecological boards is unprecedented in works of this type in Brazil and aims to increase the sustainability of the project, in addition to following the constructive characteristics of the vertical gardens built and disseminated in urban projects in the city of São Paulo [34]. This design gives the garden the functional characteristics of waterproofing and structure.
The positioning of the equipment in the space between the living wall and the protected wall was made possible through a door in the middle of the garden, designed with the objective of allowing access to this space (Figure 5), but which was locked, and the felt sealed the perimeter and prevented the entry of heat by convection.
The irrigation system, consisting of a timer (Orbit brand with 1 outlet) and drip hoses, allowed us to control the time and frequency of watering in each planting line of the living wall. Drip buds enabled dripping in each planting pocket (Figure 6).
The species used, planted in each pocket formed by the blanket, were chosen based on their characteristics of resistance to solar radiation: Asparagus densiflorus (Kunth) Jessop “Sprengeri”, Callisia repens (Jacq.) L., Rumohra adiantiformis (G. Forst).) Ching, Tradescantia pallida (Rose)DR Hunt, Epipremnum pinnatum (L.) Engl, Pelargonium peltatum (L.) L’Hér, Sphagneticola trilobata (L.) Pruski, Tradescantia zebrina Heynh.,and Syngonium angustatum Schott [35] (Figure 7).
Two types of seedlings were used, at a density of 1 gourd seedling per bag and 3 sachet seedlings per bag. They were not planted directly, but in felt wrappings that received the seedling with the new substrate and were later placed in the pocket of the living wall (Figure 8). A substrate suitable for gardens, enriched with fertilizer and vermiculite, was used to improve the retention of nutrients and water, in addition to foliar fertilization for maintenance every 15 days.

2.2. Data Monitoring

Microclimatic monitoring took place at the end of the summer period, on 18, 19, and 20 March 2019 (the 1st, 2nd, and 3rd days of monitoring, respectively)—a period whose minimum and maximum recorded temperatures were above the historical range, i.e., 20.6 °C and 32.6 °C, respectively. It is noteworthy that the minimum and maximum historical averages for the month of March in Bauru are 19 °C and 29 °C, respectively.
Two digital thermometers (model: Instrutherm TH-1000) connected to K-type sensors were used to monitor the following variables: external surface temperature of the control plot (EstBw), internal surface temperature of the control plot (IstBw), external surface temperature of the living wall (EstLw), internal surface temperature of the living wall (IstLw), external surface temperature of the protected plot (EstPp), and internal surface temperature of the protected plot (IstPp).
The equipment was calibrated and a monitoring test was performed to assess any problems or measurement errors. Measurements were taken every 15 min, from 8:00 to 17:45, and on the last day of monitoring the measurements had to be interrupted slightly earlier due to the summer rain in the late afternoon.
It is noteworthy that due to the instrumentation model and the location of the experiment, the monitoring had to be conducted in a limited period, with the objective of investigating the influence of the living wall only during the day, without the nocturnal continuity.
This decision considered safety issues and team size. It is noteworthy, however, that the monitoring days were representative of the summer weather conditions (within the historical values for the period). Table 1 describes the equipment used during monitoring, while Figure 9 illustrates how the equipment was distributed in each plot.
A Testo 175-H1 temperature and humidity data logger was kept 4 m away from the plots to monitor the external microclimatic conditions, and a HOBO datalogger was positioned in the air cavity between the living wall and the protected plot to monitor the air temperature (Ta). A net radiometer was also used with sensors parallel to the façade to measure the direct solar radiation that reached the surface of the protected and control plots.

2.3. Data Analysis

Data were analyzed by comparing the behavior of the external and internal surface temperatures of the sample plots in order to identify the thermal influence of the shading mechanism. The surface temperatures along the “garden-protected plot” system allowed the identification of a thermal gradient and the direction of entry or exit of heat, in addition to the influence of shading provided by vegetation on the external surface of the living wall. The microclimates of the air cavity and the local thermal exchanges were investigated based on the values of the surface temperatures of the garden and the protected wall and the temperature of the cavity air.
The data on the internal and external surface temperatures of the control plot × protected plot were also subjected to statistical tests to verify whether the differences between the means of the variables “external and internal surface temperature of the plot with and without garden” were significant. For this, we used the ANOVA-type analysis of variance and Tukey’s test with the aid of the SPSS Statistics software version 17.0.

3. Results and Discussion

The results are shown in three parts: the first shows the influence of shading on variations in surface temperatures in the protected plot; the second shows the temperature gradient formed along the “garden-protected plot” system, and the third shows the influence of shading on the air temperature of the cavity formed between the living wall and the protected plot.
On the monitoring days, the minimum air temperature was 20.6 °C (at 23:30) and the maximum was 32.6 °C (at 14:15), while the relative humidity ranged from 50% to 100%. Direct solar radiation reached a maximum value of 798 W/m² in the morning.

3.1. The Influence of Shading on Surface Temperature Variations of the Protected Plot

Figure 10 shows the graphs of surface temperatures for each monitored day. It can be seen that, in general, the external surface temperatures of the protected plot (EstPp) were lower than those of the control plot (EstBw)—especially on the first day, in 100% of measurements. Only at the beginning of the 2nd and 3rd days of monitoring, between 8:00 and 8:45, were the external surface temperatures of the protected plot (EstPp) approximately 0.4 °C to 1.3 °C higher than the control plot (EstBw). The internal surface temperatures of the protected plot (IstPp) were lower than those of the control plot (IstBw) in 80% of the measurements. Only in the first hours did the temperatures of the control plot register lower temperatures, but from 10:00 onwards they were higher (Figure 10).
The reduction in surface temperatures can be explained by the fact that the continuous living wall contributed to blocking solar radiation in the protected plot during the period of direct sunlight. This protection from the Sun was responsible for maximum differences of 10.6 °C (10:30 to 11:15) and 2.9 °C (13:45 to 15:45) for external and internal temperatures, respectively, as shown in Table 2.
These results are consistent with those of other studies carried out in “summer” conditions, demonstrating that the living wall has a significant thermal influence on the built environment, even in different climatic contexts. Table 3 compares these studies and considers data from different models of living walls, as studies using only the “continuous” model are scarce [3,18,19].
It should be noted that the influence of the living wall is more prominent on the external temperatures, and that the order of magnitude of the reductions found by the works with the “continuous” model is similar. Both [18] Mazzali et al. (2013) and [19] Perini et al. (2017) investigated this model in a Mediterranean climate and with different orientations, recording a similar maximum reduction value, which was higher than that found by this work.
Considering the same type of climate and orientation, but a different living wall model, the results found by this work (10.6 °C) were superior to those of Pan et al. (2018) [2] for all façade orientations (6.4 °C west, 4 °C south, 4.1 °C east, and 4.4 °C north), suggesting a possible thermal efficiency advantage of the continuous living wall over the modular one.
For the tropical climate, the results of the present work are close to the maximum reduction found by Wong et al. (2010) [3] for the “continuous” living wall (10.9 °C), but differ in the experimental design of the samples (here, a garden and building of actual size and use). In addition, in the present work, the internal surface temperatures were also monitored and analyzed, filling an information gap on this variable in this type of study (Table 3)—especially among those who use the continuous living wall.
The monitoring of the internal surface temperature (Figure 10) was important to identify the intensity of the influence of the continuous living wall on the heat input to the building from the reduction of the external surface temperature during the measurement period.
Thus, the living wall kept the internal surface temperatures of the protected plot lower than those of the bare wall only after 10:00. In the early morning, the behavior of this variable indicated that the inner surface of the protected plot remained warmer than the bare wall throughout the night. The maximum difference between plots was 1.3 °C at 8:00, suggesting that the action of the thermal insulation mechanism, by adding constructive layers to the façade, made it difficult to lose heat to the outside during the night.
In a Cfa climate (i.e., high incidence of radiation and temperature throughout the day), this thermal influence of the garden is auspicious, as it can lead to better energy efficiency of the building during the period of direct radiation. This occurs by creating a possible reduction in the use of air-conditioning systems as a result of the reduction in surface temperatures and heat input to the interior of the building. However, it is necessary to facilitate the loss of heat from the building during the night using another strategy, such as nighttime ventilation.
As for the maximum reductions in the internal surface temperature, the values found in this work were lower compared to those found in the literature. This can be explained by the experimental design developed, in which the sample plots were part of the same wall, while in the other studies the authors used separate walls. This characteristic can represent heat transfer via internal wall conduction between the bare wall and the protected plot, influencing the internal surface temperature values of the protected plot.
However, even with this characteristic, the results of maximum reductions and total differences in the internal surface temperatures between the samples were significant, as confirmed by Tukey’s test.
The data of the external and internal surface temperatures of both treatments were submitted to analysis of variance (ANOVA) and Tukey’s test. The ANOVA test resulted in a p-value = 0.000, which indicates a significant difference between the means, as shown in Table 4. Tukey’s test showed that, with a significance level of 5% (p = 0.05), there was a significant difference between the treatments (with and without the vertical garden) for the entire external surface temperature dataset. Meanwhile, the internal surface temperatures showed a significant difference from the values of the control plot on the 2nd monitoring day (higher IstBw sampled), along with the IstPp values of all three sampling days.
Thus, the living wall influenced the behavior of surface temperatures of the protected plot under summer conditions, and the differences found between the temperatures for the two treatments were significant.
The living wall also contributed to the reduction in surface temperature variations between plots (Table 5). The protected plot showed an average variation of 5.1 °C and 3.2 °C for external and internal surface temperatures, respectively, while the bare wall registered an average variation of 11.7 °C for external surface temperatures and 6.7 °C for internal surface temperatures. The average difference between the samples was 6.5 °C (external surface) and 3.6 °C (internal surface).
Thus, the continuous living wall influenced the protected plot in order to stabilize the external surface temperature at an average value of 26 °C and the internal surface temperature at around 25 °C, while the control plot recorded average values of 31.5 °C and 26.5 °C for the external and internal surface temperatures, respectively, during the monitoring period.
Caetano (2014) [28] and Tan et al. (2014) [23] also found reductions in daily thermal variations in surface temperatures provided by living walls, which were efficient in stabilizing both the internal and external surface temperatures in the range of 20 °C to 25 °C [28]—a range similar to that found in this work.
Table 5 shows the maximum and minimum values of surface temperatures, where it is possible to verify that the living wall always kept the maximum values of EstPp and IstPp lower than those of the control plot. However, this pattern was not observed in the minimum values of the Est, as the protected plot sometimes recorded lower values and other times higher values compared to the control plot.
The protected plot always presented Est peaks later than those of the control plot, in the early, mid, or late afternoon, and with a variation of 28.1 °C to 28.5 °C (Table 6). The Est peaks of the control plot occurred during the period of direct sunlight (11:30 to 12:00), and with variations of 34.7 °C to 36.7 °C. Thus, the continuous living wall influenced the protected plot in order to provide a delay in external surface temperature peaks of up to 6 h in relation to the control plot, and contributed to a reduction in these values of up to 8.6 °C.
The internal surface temperatures of both plots had their maximum values at the end of the monitoring periods (Table 5). The maximum values in the protected plot (26.4 °C to 27 °C) were always lower and occurred later than those in the control plot (28.7 °C to 29.7 °C). Thus, the living wall also contributed to the reduction in the amount of thermal energy transferred through the protected plot (maximum difference of 2.7 °C) and delayed the internal peak by up to 1 h compared to the control plot.
This behavior differs from that found by Coma et al. (2017) [17], because the difference values of the peaks and the thermal delays clearly demonstrate the impact of the continuous living wall on the thermal inertia of the building façade. Here, each layer of the constructive system (i.e., vegetation + structure+ cavity air) contributed to reducing the storage of thermal energy, which can decrease the demand for active cooling.

3.2. “Garden-Protected Plot” System

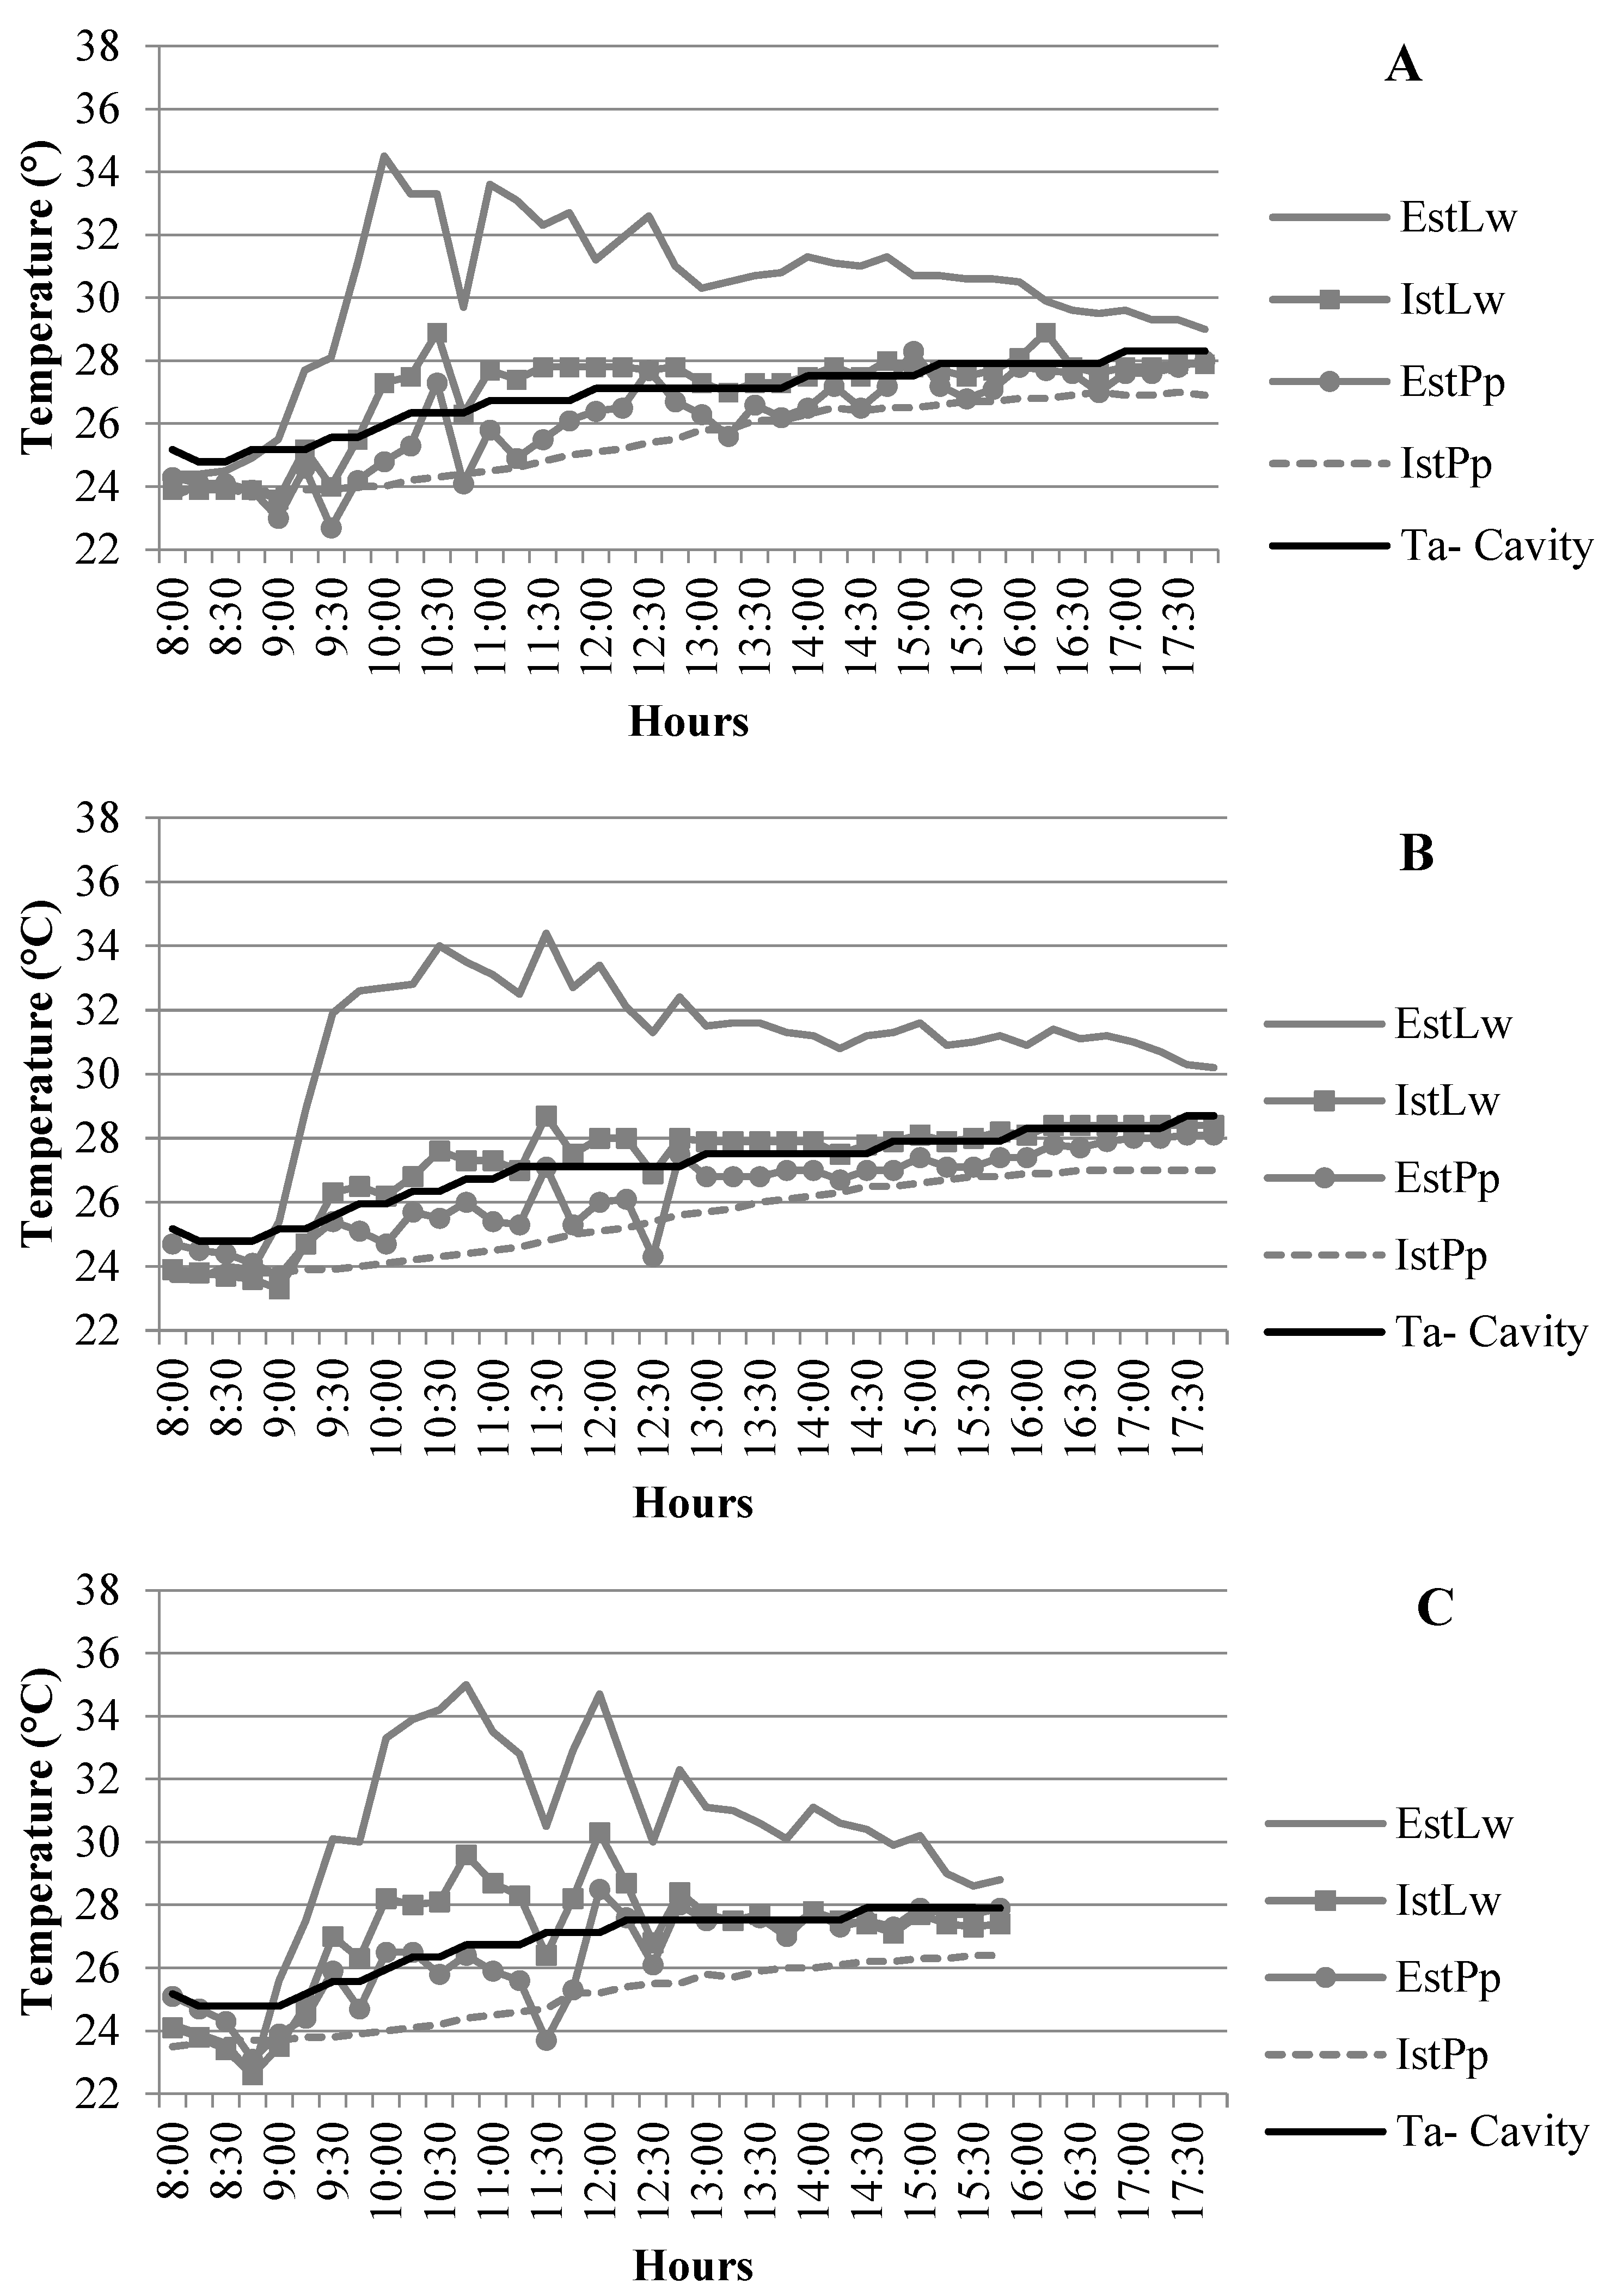
Figure 11 shows the behavior of the monitoring points along the structure of the living wall and the external and internal surfaces of the protected plot in relation to the control plot for the following variables: external surface temperature of the control plot (EstBw), internal surface temperature of the control plot (IstBw), external surface temperature of the living wall (EstLw), internal surface temperature of the living wall (IstLw), external surface temperature of the protected plot (EstPp), and internal surface temperature of the protected plot (IstPp).
The surface temperatures of the “garden-protected plot” system were lower than the EstBw on the 1st day of monitoring and higher on the other days until 8:30 (i.e., the beginning of direct sunlight). From that time on, IstLw, EstPp, and IstPp were lower than EstBw, while they were lower than IstBw from 12:15 until the end of the monitoring period.
With direct sunlight, there was a standardization of the gradient of the surface temperatures of the “garden-protected plot” system in the three days of monitoring. This gradient indicates the heat flow input direction towards the internal environment and is represented by the following sequence: EstLw, IstLw, EstPp, and IstPp.
Surface temperatures varied in pairs; that is, the EstLw varied along with the EstBw, IstLw varied together with EstPp and, finally, IstPp and IstBw varied together. This pattern of variation and thermal gradients demonstrates how the constructive layers of the living wall provide shade, increase the system’s thermal resistance, and prevent the direct influence of solar radiation on the inner surface of the garden and the external surface of the protected plot.
The thermal behavior of EstLw in relation to the bare wall can be explained by its direct exposure to solar radiation, meaning that the garden depends exclusively on the density and distribution of vegetation cover to shade and block the solar incidence on its external surface. Thus, the vegetation in this experiment contributed with maximum reductions of 2.8–3.5 °C in the external surface temperature of the garden in relation to the external surface temperature of the bare wall. On the other hand, the vegetation did not reduce the EstLw variation in the monitoring period; that is, the garden temperature was lower, higher, and at the same degree as the bare wall each day.
The investigation of vegetation cover on the EstLw is not widely discussed in the literature, and only two studies have identified the same thermal behavior of this variable. Wong et al. (2010) [3] found a reduction of up to 9 °C compared to a concrete control wall. The authors also noted that, in most of their measurements, the values of the garden approached and maintained a daily variation as high as those of the control wall, in the same way as the results registered in this work.
Victorero et al. (2015) [25] obtained a difference of up to 30 °C between the external surface of the vertical garden and a metallic bare wall. This large difference was related to the characteristics of the materials and the red color of the bare wall, as well as the types of vegetation used by the researchers.
The vegetation constitutes the first shading layer in the system, and contributed to the maximum values of EstLw occurring in the morning (10:00 to 11:30)—an average of 1 h before those of the bare wall. The maximum difference between the temperature peaks was 2.7 °C, and the average difference was 0.7 °C, with the garden surface registering lower temperatures. However, on the 3rd day, the EstLw reached a difference of 0.6 °C higher compared to the bare wall.
Thus, considering that the complete living wall system provided an average difference of 6.9 °C between the temperature peaks (Table 6) for the EstPp in relation to the EstBw, the shading of the vegetation contributed about 10% of this amount. The vegetation also contributed to anticipating the maximum values of EstLw in relation to the control plot. This behavior has not previously been discussed by any similar studies.
IstLw had generally higher values than EstPp, with a maximum difference of 3.2 °C. From 17:00 onwards, there was a trend towards an increase in EstPp due to the heat flow coming from the living wall system and the thermal exchanges occurring in the air cavity environment. This flow can be identified through the drops in the internal and external surface temperatures of the garden and the simultaneous increase in the external surface temperature of the protected plot.

3.3. Cavity Thermal Exchange System

Heat transfer occurs via conduction throughout the garden structure in the direction of the thermal gradient, and then via radiation (between the external surface of the protected plot and the internal surface of the garden) and via convection (between the garden’s and the protected plot’s surfaces and the cavity air) [22], contributing to changing temperatures in the air cavity.
To identify these changes, the temperatures of the surfaces were compared to the cavity air temperature in order to verify whether the temperature variations between the internal surface of the garden and the external surface of the protected plot reflected changes in the cavity air temperature (Figure 12).
It was observed that even with more intense temperature variation between the two surfaces, this variation was not reflected in the cavity air temperature, which continued to show little variation and long periods of stability. That is, at times, when surface temperatures decreased or increased abruptly, there was no consecutive increase or decrease of the same intensity in the air temperature that could occur through convective thermal exchanges between the air and the contact surfaces.
However, there was a relationship between the surface temperature curves, in which, based on variations in the values of the surface temperatures (external and internal) of the garden and the external surface temperature of the protected plot, there was a gradual increase in the internal surface temperature of the protected plot. Thus, it can be inferred that the thermal exchange processes through the “garden-protected plot” system occur more intensely through the conduction and radiation processes, and that radiation is the main thermal exchange process in the air cavity environment between the garden and the protected plot. It is noteworthy that the air cavity was sealed by the constructive structure in order to prevent convection with the external air, as described by Chen et al. (2013) [22].
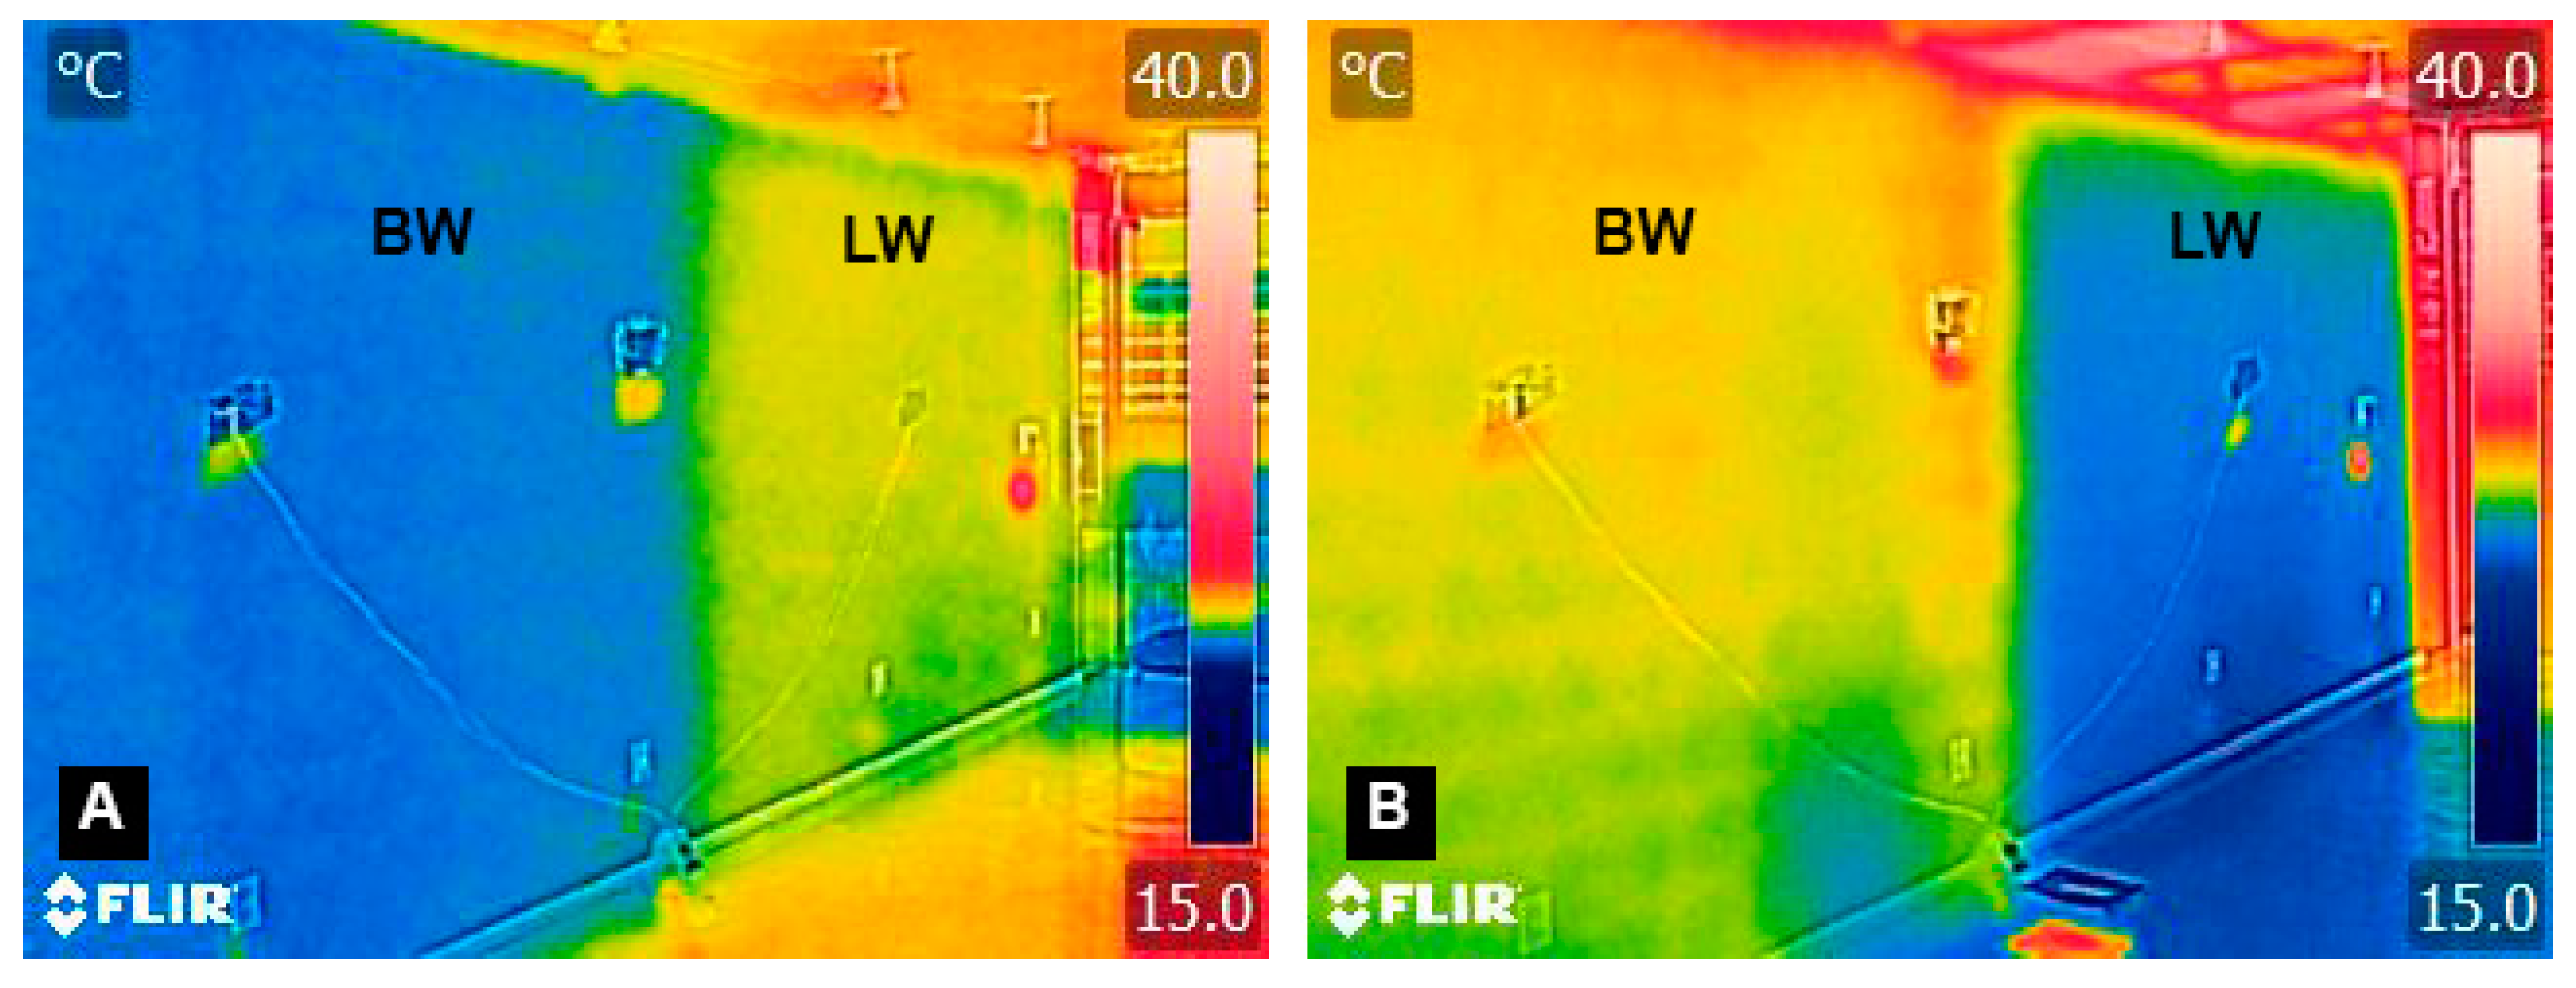
The dynamics of this heat flow and the insulation created by the living wall over the protected plot, preventing the entry of heat into the internal environment, can be visually identified as shown in Figure 13. At the beginning of the monitoring, the internal surface of the protected plot started with more heat; however, with the incidence of direct solar radiation, an inversion occurred, and the control plot started to present the most heated surface until the end of the measurement period.

4. Conclusions

Using an experimental approach, this study aimed to evaluate the thermal influence of a “continuous living wall” on the summer surface temperatures of an east façade of a building in a Brazilian city with a subtropical climate and hot summers (Cfa), as well as to characterize the behavior of the surface temperatures of the “garden-protected plot” system.
The objective of this study was to fill some gaps in the literature, such as (1) the small climatic and living wall model diversity, (2) the lack of studies carried out in the summer and with an east orientation, (3) the lack of monitoring of the behavior of the internal surface temperature, and (4) the contribution of the vegetation to the thermal behavior of the surface temperatures of the system.
The results demonstrate that during the monitoring period (i.e., the daytime period from 08:00 to 17:45), and considering the local climatic characteristics, the living wall positively influenced the portion of the building’s façade that was protected, as follows:
  • The living wall reduced the external (up to 10.6 °C) and internal (up to 2.9 °C) surface temperatures and contributed to keeping them lower in approximately 80% of the monitoring period;
  • The living wall influenced the reduction in thermal variation and the maximum values of surface temperatures of the protected plot (8.6 °C for external and 2.7 °C for internal), and created thermal delays of up to 6 h for external and up to 1 h for internal surface temperatures compared to the bare wall;
  • The data for internal surface temperature are unprecedented for this type of study with a continuous living wall (which always reduced the values for the protected plot from 10:00 a.m. onwards) and highlight that its behavior at the beginning of the monitoring period suggests that the protected plot is kept warmer than the bare wall at night, which may require nighttime ventilation for better internal thermal comfort.
The mechanisms of shading and thermal insulation contributed together to these results in the protection of the façade against direct solar radiation, and the layers of the constructive structure of the living wall added thermal resistance to the entry of heat. This resistance is visible through the thermal gradient created along the “protected garden plots” system, which illustrates the direction of entry of the heat flow, in which the external surfaces of the system recorded higher values compared to the internal surfaces.
Regarding the “garden-protected plot” system and the contribution of vegetation to reducing surface temperatures, the vegetation shaded the structure of the living wall and functioned as the first layer of protection. Thus, the vegetation reduced the external surface temperature of the garden (up to 3.5 °C) compared to the control plot and contributed about 10% of the average reduction in the external surface temperature peaks of the protected plot—a fact that until now has not been discussed in the reviewed literature.
Finally, the thermal behavior of the air temperature in the cavity, along with its relationship with the external surface temperatures of the protected portion and the internal surface temperatures of the vertical garden, demonstrates that radiative exchange is the main form of thermal exchange involved in this space, and that it contributes to increasing the resistance of the system for presenting greater stability in thermal variations.
Therefore, the findings of this work demonstrate that a“ continuous living wall” can significantly influence the surface temperatures of the façades of buildings and contribute to improving their thermal efficiency during the daytime period in subtropical climates. By reducing surface temperatures, the living wall also reduces energy gain through its façades and heat input to its internal environments.

Author Contributions

Conceptualization, M.C.-B. and M.S.G.d.C.F.; Formal analysis, M.C.-B., M.S.G.d.C.F. and M.d.A.A.; Investigation, M.C.-B., M.S.G.d.C.F. and M.d.A.A.; Methodology, M.C.-B., M.S.G.d.C.F. and M.d.A.A.; Project administration, M.C.-B. and M.S.G.d.C.F.; Supervision, M.C.-B., M.S.G.d.C.F. and M.d.A.A.; Visualization, M.C.-B. and M.S.G.d.C.F.; Writing—review &editing, M.C.-B., M.S.G.d.C.F. and M.d.A.A. All authors have read and agreed to the published version of the manuscript.

Funding

This research received no external funding.

Institutional Review Board Statement

Not applicable.

Informed Consent Statement

Not applicable.

Acknowledgments

The authors are very thankful to the PPGARQ/UNESP.

Conflicts of Interest

The authors declare no conflict of interest.

References

  1. Huang, S.; Taniguchi, M.; Yamano, M.; Wang, C.-H. Detecting urbanization effects on surface and subsurface thermal environment—A case study of Osaka. Sci. Total Environ. 2009, 407, 3142–3152. [Google Scholar] [CrossRef] [PubMed]
  2. Pan, L.; Wei, S.; Chu, L. Orientation effect on thermal and energy performance of vertical greenery systems. Energy Build. 2018, 175, 102–112. [Google Scholar] [CrossRef]
  3. Wong, N.H.; Tan, A.Y.K.; Chen, Y.; Sekar, K.; Tan, P.Y.; Chan, D.; Chiang, K.; Wong, N.C. Thermal evaluation of vertical greenery systems for building walls. Build. Environ. 2010, 45, 663–672. [Google Scholar] [CrossRef]
  4. Jesus, M.P.; Lourenço, J.M.; Arce, R.M.; Macias, M. Green façades and in situ measurements of outdoor building thermal behavior. Build. Environ. 2017, 119, 11–19. [Google Scholar] [CrossRef]
  5. Sharp, R.; Sable, J.; Bertram, F.; Mohan, E.; Peck, S. Introduction to Green Walls: Technology, Benefits & Design. Green Roofs for Healthy Cities, United States of America. 2008. Available online: http://www.greenroofs.net/components/com_lms/flash/Green%20Walls%20Intro%20908b.pdf (accessed on 25 March 2016).
  6. Besir, A.B.; Cuce, E. Green roofs and facades: A comprehensive review. Renew. Sustain. Energy Rev. 2018, 82, 915–939. [Google Scholar] [CrossRef]
  7. Perini, K.; Ottele, M.; Haas, E.M.; Raiteri, R. Vertical greening systems, a process tree for green façades and living walls. Urban Ecossystems 2013, 16, 265–277. [Google Scholar] [CrossRef]
  8. Kontoleon, K.; Eumorfopoulou, E. The effect of the orientation and proportion of a plant-covered wall layer on the thermal performance of a building zone. Build. Environ. 2010, 45, 1287–1303. [Google Scholar] [CrossRef]
  9. Wong, N.H.; Tan, A.Y.K.; Tan, P.Y.; Wong, N.C. Energy simulation of vertical greenery systems. Energy Build. 2009, 41, 1401–1408. [Google Scholar] [CrossRef]
  10. Pérez, G.; Coma, J.; Martorell, I.; Cabeza, L.F. Vertical Greenery Systems (VGS) for energy saving in buildings: A review. Renew. Sustain. Energy Rev. 2014, 39, 139–165. [Google Scholar] [CrossRef]
  11. Pérez, G.; Rincón, L.; Vila, A.; González, J.M.; Cabeza, L.F. Green vertical systems for buildings as passive systems for energy savings. Appl. Energy 2011, 88, 4854–4859. [Google Scholar] [CrossRef]
  12. Perini, K.; Ottelé, M.; Fraaij, A.; Haas, E.; Raiteri, R. Vertical greening systems and the effect on air flow and temperature on the building envelope. Build. Environ. 2011, 46, 2287–2294. [Google Scholar] [CrossRef]
  13. Scarpa, M.; Mazzali, U.; Peron, F. Modeling the energy performance of living walls: Validation against field measurements in temperate climate. Energy Build. 2014, 79, 155–163. [Google Scholar] [CrossRef]
  14. Cruciol-barbosa, M.; de Castro Fontes, M.S.G. Jardins verticais: Modelos e técnicas. PARC Pesqui. Arquitetura Construção 2016, 7, 114. [Google Scholar] [CrossRef]
  15. Manso, M.; Castro-Gomes, J. Green wall systems: A review of their characteristics. Renew. Sustain. Energy Rev. 2015, 41, 863–871. [Google Scholar] [CrossRef]
  16. Moghaddam, F.; Mir, J.F.; Yanguas, A.B.; Delgado, I.N.; Dominguez, E.R. Building Orientation in Green Facade Performance and Its Positive Effects on Urban Landscape Case Study: An Urban Block in Barcelona. Sustainability 2020, 12, 9273. [Google Scholar] [CrossRef]
  17. Coma, J.; Pérez, G.; de Gracia, A.; Burés, S.; Urrestarazu, M.; Cabeza, L.F. Vertical greenery systems for energy savings in buildings: A comparative study between green walls and green facades. Build. Environ. 2017, 111, 228–237. [Google Scholar] [CrossRef]
  18. Mazzali, U.; Peron, F.; Romagnoni, P.; Pulselli, R.M.; Bastianoni, S. Experimental investigation on the energy performance of Living Walls in a temperate climate. Build. Environ. 2013, 64, 57–66. [Google Scholar] [CrossRef]
  19. Perini, K.; Bazzocchi, F.; Croci, L.; Magliocco, A.; Cattaneo, E. The use of vertical greening systems to reduce the energy demand for air conditioning. Field monitoring in Mediterranean climate. Energy Build. 2017, 143, 35–42. [Google Scholar] [CrossRef]
  20. Razzaghmanesh, M.; Razzaghmanesh, M. Thermal performance investigation of a living wall in a dry climate of Australia. Build. Environ. 2017, 112, 45–62. [Google Scholar] [CrossRef]
  21. Charoenkit, S.; Yiemwattana, S. Role of specific plant characteristics on thermal and carbon sequestration properties of living walls in tropical climate. Build. Environ. 2017, 115, 67–79. [Google Scholar] [CrossRef]
  22. Chen, Q.; Li, B.; Liu, X. An experimental evaluation of the living wall system in hot and humid climate. Energy Build. 2013, 61, 298–307. [Google Scholar] [CrossRef]
  23. Tan, C.L.; Wong, N.H.; Jusuf, S.K. Effects of vertical greenery on mean radiant temperature in the tropical urban environment. Landsc. Urban Plan. 2014, 127, 52–64. [Google Scholar] [CrossRef]
  24. Haggag, M.; Hassan, A.; Elmasry, S. Experimental study on reduced heat gain through green façades in a high heat load climate. Energy Build. 2014, 82, 668–674. [Google Scholar] [CrossRef]
  25. Victorero, F.; Vera, S.; Bustamante, W.; Tori, F.; Bonilla, C.; Gironás, J.; Rojas, V. Experimental Study of the Thermal Performance of Living Walls Under Semiarid Climatic Conditions. Energy Procedia 2015, 78, 3416–3421. [Google Scholar] [CrossRef]
  26. Djedjig, R.; Belarbi, R.; Bozonnet, E. Experimental study of green walls impacts on buildings in summer and winter under an oceanic climate. Energy Build. 2017, 150, 403–411. [Google Scholar] [CrossRef]
  27. Ruiz-Valero, L.; Faxas-Guzmán, J.; Arranz, B.; Flores-Sasso, V.; Céspedes, L. Living wall system for improved thermal performance of facades located in tropical climate. Case study in Dominican Republic. Build. Environ. 2022, 222, 109419. [Google Scholar] [CrossRef]
  28. Caetano, F.D.N. Influência de Muros Vivos Sobre o Desempenho Térmico de Edifícios. Master’s Thesis, Universidade Estadual de Campinas, Campinas, Brazil, 2014. [Google Scholar]
  29. Júnior, M.E.d.O. Localização da Região de Governo de São José dos Campos no Estado de São Paulo no Brasil. 2011. Available online: https://commons.wikimedia.org/wiki/File:SaoPaulo_RG_SaoJosedosCampos.svg#/media/File:SaoPaulo_RG_SaoJosedosCampos.svg (accessed on 24 October 2022).
  30. Google Maps. Available online: https://www.google.com.br/maps/preview (accessed on 10 July 2021).
  31. Alvares, C.A.; Stape, J.L.; Sentelhas, P.C.; Gonçalves, J.L.M.; Sparovek, G. Köppen’s climate classification map for Brazil. Meteorol. Z. 2013, 22, 711–728. [Google Scholar] [CrossRef]
  32. Ipmet—Bauru Meteorology Center. Available online: https://www.ipmetradar.com.br/4estacoes/# (accessed on 17 August 2022).
  33. Reolom, M. Jardins Verticais e Telhados Verdes vão Server em SP Como Compensação Ambiental; O Estado de S.Paulo: São Paulo, Brazil, 2015; Available online: http://sao-paulo.estadao.com.br/noticias/geral,jardins-verticais-e-telhados-verdes-vao-servir-em-sp-como-compensacao-ambiental,1648993 (accessed on 10 October 2016).
  34. Cruciol-Barbosa, M.; de Castro Fontes, M.S.G. Jardins Verticais: A contribuição das paredes vivas na recuperação da biodiversidadeurbana nativa. In I Congresso de Biologia. Bauru. Livro de Resumos do I Congresso de Biologia; Faculdade de Ciências: Bauru, Brazil, 2018; pp. 34–36. [Google Scholar]
  35. Lorenzi, H.; Souza, H.M. Plantas Ornamentais no Brasil: Arbustivas, Herbáceas e Trepadeiras; Instituto Plantarum: Nova Odessa, Brazil, 2008; p. 1088. [Google Scholar]
Figure 1. (A) São Paulo, Brazil; (B) Bauru city; (C) Location map of the UNESP campus in the city of Bauru. Source: (A,B) adapted from Júnior (2011) [29] and (C) adapted from Google (2021) [30].
Sustainability 15 02985 g001
Figure 2. Location of the building on the university campus (A) and image of the east façade in front of the student lounge (B). Legend: E: east façade; N: north façade. Source: (A): adapted from Google (2021) [30]; (B): author’s file.
Sustainability 15 02985 g002
Figure 3. Façade with delimited sample plots (living and bare walls). Legend: Measurements in meters.
Sustainability 15 02985 g003
Figure 4. Continuous living wall constructive system. Legend: (1) Rafters, (2) seal and drainage gutters, (3) ecological board, (4 and 5) layers of geotextile, (6) irrigation with Orbit timer and drip hoses.
Sustainability 15 02985 g004
Figure 5. Continuous living wall with the central door being installed. Legend: (A,B) Installation of the central door that allowed access to the space between the living wall and the protected wall; (C) detail of the door-closing latches to prevent influence and heat entry by convection.
Sustainability 15 02985 g005
Figure 6. Irrigation system. Legend: Living wall irrigation system. (A) The orbit timer was positioned above the garden to avoid vandalism. (B) The hoses ran through all of the planting lines, and in each bag there was a drip button. (C) Timer and drip button details.
Sustainability 15 02985 g006
Figure 7. Continuous living wall planting diagram.
Sustainability 15 02985 g007
Figure 8. Planting the seedlings on the living wall.
Sustainability 15 02985 g008
Figure 9. Distribution of surface temperature equipment. Legend: PP: protected wall (protected plot); LW: living wall; BW: bare wall (control plot); IstPp: internal surface temperature of the protected wall; EstPp: external surface temperature of the protected wall; IstLw: internal surface temperature of the living wall; EstLw: external surface temperature of the living wall; IstBw: internal surface temperature of the bare wall; EstBw: external surface temperature of the bare wall; Ta: air temperature.
Sustainability 15 02985 g009
Figure 10. Surface temperatures of plots with and without garden. Legend: (A) 1st day; (B) 2nd day; (C) 3rd day.
Sustainability 15 02985 g010aSustainability 15 02985 g010b
Figure 11. Surface temperatures along the garden-façade system. Legend: (A) 1st day; (B) 2nd day; (C) 3rd day.
Sustainability 15 02985 g011
Figure 12. Relationship between surface temperatures along the garden-façade system and cavity air temperature on the 1st day. Legend: (A) 1st day; (B) 2nd day; (C) 3rd day. EstLW: external surface temperature of the living wall; IstLw: internal surface temperature of the living wall; EstPp: external surface temperature of the protected plot; IstPp: internal surface temperature of the protected plot; Ta-Cavity: cavity air temperature.
Sustainability 15 02985 g012
Figure 13. Thermal photos of the internal surface of plots. Legend: (A) at 8:45 a.m.; (B) at 12:45 p.m.; BW: control plot; LW: protected plot.
Sustainability 15 02985 g013
Table 1. List of equipment used in campaigns with vertical garden.
VariablesEquipment
Surface temperaturesInstrutherm TH-1000 digital thermometer with 5 measuring points; range: −40 °C to 199.9 °C; accuracy: ±0.5 °C. Type K sensor with 20 mm length ×5 mm diameter; accuracy: 0.5%
Local air temperature and relative humidityTesto 175-H1 data logger; accuracy: inner channel +2% HR (0…+100% HR), +0.5 °C (−20…+70 °C), external channel +0.2 °C (−25…+70 °C).
Thermal imagesFlir E6 Thermal Camera (temperature range: −20° to 250 °C, accuracy: ±2% or 2 °C, measurement modes: 3 modes—point (center); area (min/max); and isotherm (above/below)).
Cavity air temperatureHOBO H8 Pro Series data logger; temperature range: −40 °C to +100 °C; timing accuracy: approximately ±1 min per week (±100 ppm at +20 °C).
Direct and diffuse solar radiationKipp & Zonen CNR−1 net radiometer; accuracy: ±10% on sunny days. Campbell datalogger model CR1000; real-time accuracy: ±3 min/year.
Table 2. Reductions in external and internal surface temperatures between plots.
Days MonitoredMaximum ReductionsAverage Reductions
Est (°C)Ist (°C)Est (°C)Ist °C
1st day9.12.75.61.5
2nd day10.62.96.21.7
3rd day8.72.55.01.3
Legend: Est: external surface temperature; Ist: internal surface temperature.
Table 3. Studies that investigated the thermal influence of living walls in summer.
AuthorsLiving Wall TypeLocalClimateFaçade OrientationMaximum Temperature Reduction (°C)
EstIst
Chen et al. (2013) [22]Modular trayChina“Hot and humid”West20.87.7
Coma et al. (2017) [17]Modular traySpainMediterraneanEast/west/south21.5-S-
Djedjiget al. (2017) [26]Modular vesselsFranceOceanicWest1510
Haggag et al. (2014) [24]Modular trayUnited Arab EmiratesAridEast136
Mazzaliet al. (2013) [18]Tray and continuousItalyTemperate MediterraneanSoutheast20-
Pan et al. (2018) [2]Modular vesselsChinaHumid subtropicalNorth/south/east/west6.4-W-
Perini et al. (2017) [19]ContinuousItalyMediterraneanSouth20-
Razzaghmanesh and Razzaghmanesh (2017) [20]Modular vesselsAustraliaMediterraneanWest-1.75
Victoreroet al. (2015) [23]Modular trayChileSemi-aridNorth30-
Wong et al. (2010) [3]Modular and continuousSingaporeTropical-11.5 *-
Present workContinuous BrazilHumid subtropicalEast10.62.9
Legend: -: no data; *: reduction registered from modular living wall; S: registered in south orientation; W: registered in west orientation.
Table 4. ANOVA for external and internal surface temperatures.
Sum of SquaresDfMean SquareFSig.
External surface temperatureBetween groups1800.5825360.11659.2340.000
Within groups1325.3492186.080
Total3125.931223
Internal surface temperatureBetween groups151.689530.3388.1070.000
Within groups815.7602183.742
Total967.450223
Table 5. Descriptive analysis of the external and internal surface temperatures.
Average (°C)CV (%)Interval (°C)Daily Variation (°C)Minimum Value (°C)Maximum Value (°C)
Lower LimitUpper Limit
EstEstBw 131.79.318.120.410.524.535.0
EstBw 232.510.219.021.613.323.436.7
EstBw 331.410.519.622.011.223.534.7
EstPp 126.15.714.915.65.622.728.3
EstPp 226.34.914.715.54.423.728.1
EstPp 326.35.615.516.55.423.128.5
IstIstBw 127.08.914.416.16.522.929.4
IstBw 227.29.714.016.07.222.529.7
IstBw 326.39.015.517.56.522.228.7
IstPp 125.54.714.114.93.323.727.0
IstPp 225.54.813.414.53.323.727.0
IstPp 325.04.114.415.52.923.526.4
Legend: Est: external surface temperature; Ist: internal surface temperature.
Table 6. Influence of the garden on the peak surface temperatures of the protected plot.
Sample DaysEst (°C)Ist (°C)
BWPPDifference between PeaksBWPPDifference between Peaks
1st day34.6 (11:45)28.3 (15:00)6.329.4 (15:45)27 (16:00)2.4
2nd day36.7 (11:30)28.1 (17:30)8.629.7 (16:15)27 (16:30)2.7
3rd day34.4 (12:00)28.5 (12:00)5.928.7 (14:30)26.4 (15:30)2.3
AveragesAverage thermal delay of 3 hAverage difference of 6.9Average thermal delay of 45 minAverage difference of 2.5
Legend: Est: external surface temperature; Ist: internal surface temperature; BW: bare wall (control plot); PP: protected plot.
Disclaimer/Publisher’s Note: The statements, opinions and data contained in all publications are solely those of the individual author(s) and contributor(s) and not of MDPI and/or the editor(s). MDPI and/or the editor(s) disclaim responsibility for any injury to people or property resulting from any ideas, methods, instructions or products referred to in the content.

