
Does the Environmental Kuznets Curve Hold for Coal Consumption? Evidence from South and East Asian Countries

Graduate School of Humanities and Social Sciences, Saitama University, 255 Shimo-Okubo, Sakura-ku, Saitama 338-8570, Japan
*
Author to whom correspondence should be addressed.
Sustainability 2023, 15(6), 5532; https://0-doi-org.brum.beds.ac.uk/10.3390/su15065532
Submission received: 13 February 2023
/
Revised: 13 March 2023
/
Accepted: 17 March 2023
/
Published: 21 March 2023
(This article belongs to the Special Issue Global Energy Economics and Implications of Energy-Related Policies)
Abstract
:Coal consumption plays a key role in achieving sustainable growth, although it also leads to significant environmental degradation. This study examines the environmental Kuznets curve (EKC) for coal consumption in South and East Asian countries from 1990 to 2020. We applied the augmented mean group (AMG) and common correlated mean group (CCEMG) estimators, which have several advantages over conventional panel techniques because it considers the endogeneity, slope heterogeneity, and cross-sectional dependency (CD). The study findings provide a comprehensive insight into the complex relationship between coal consumption and environmental degradation. The results show that EKC holds for coal consumption and reducing coal consumption is not enough to achieve environmental sustainability. The results also show that foreign investment and population positively impact coal consumption, while renewable energy negatively impacts coal consumption. This highlights that reducing coal consumption alone is not enough to reduce environmental degradation but there also needs to be a diversion of foreign investment inflow to the sustainable, environmentally friendly project. Furthermore, the share of renewable energy in total output is lower in South and East Asian countries, and it needs to be increased further. Furthermore, to promote renewable energy, foreign investment and population control may be necessary to achieve a sustainable environment while maintaining economic growth.
1. Introduction
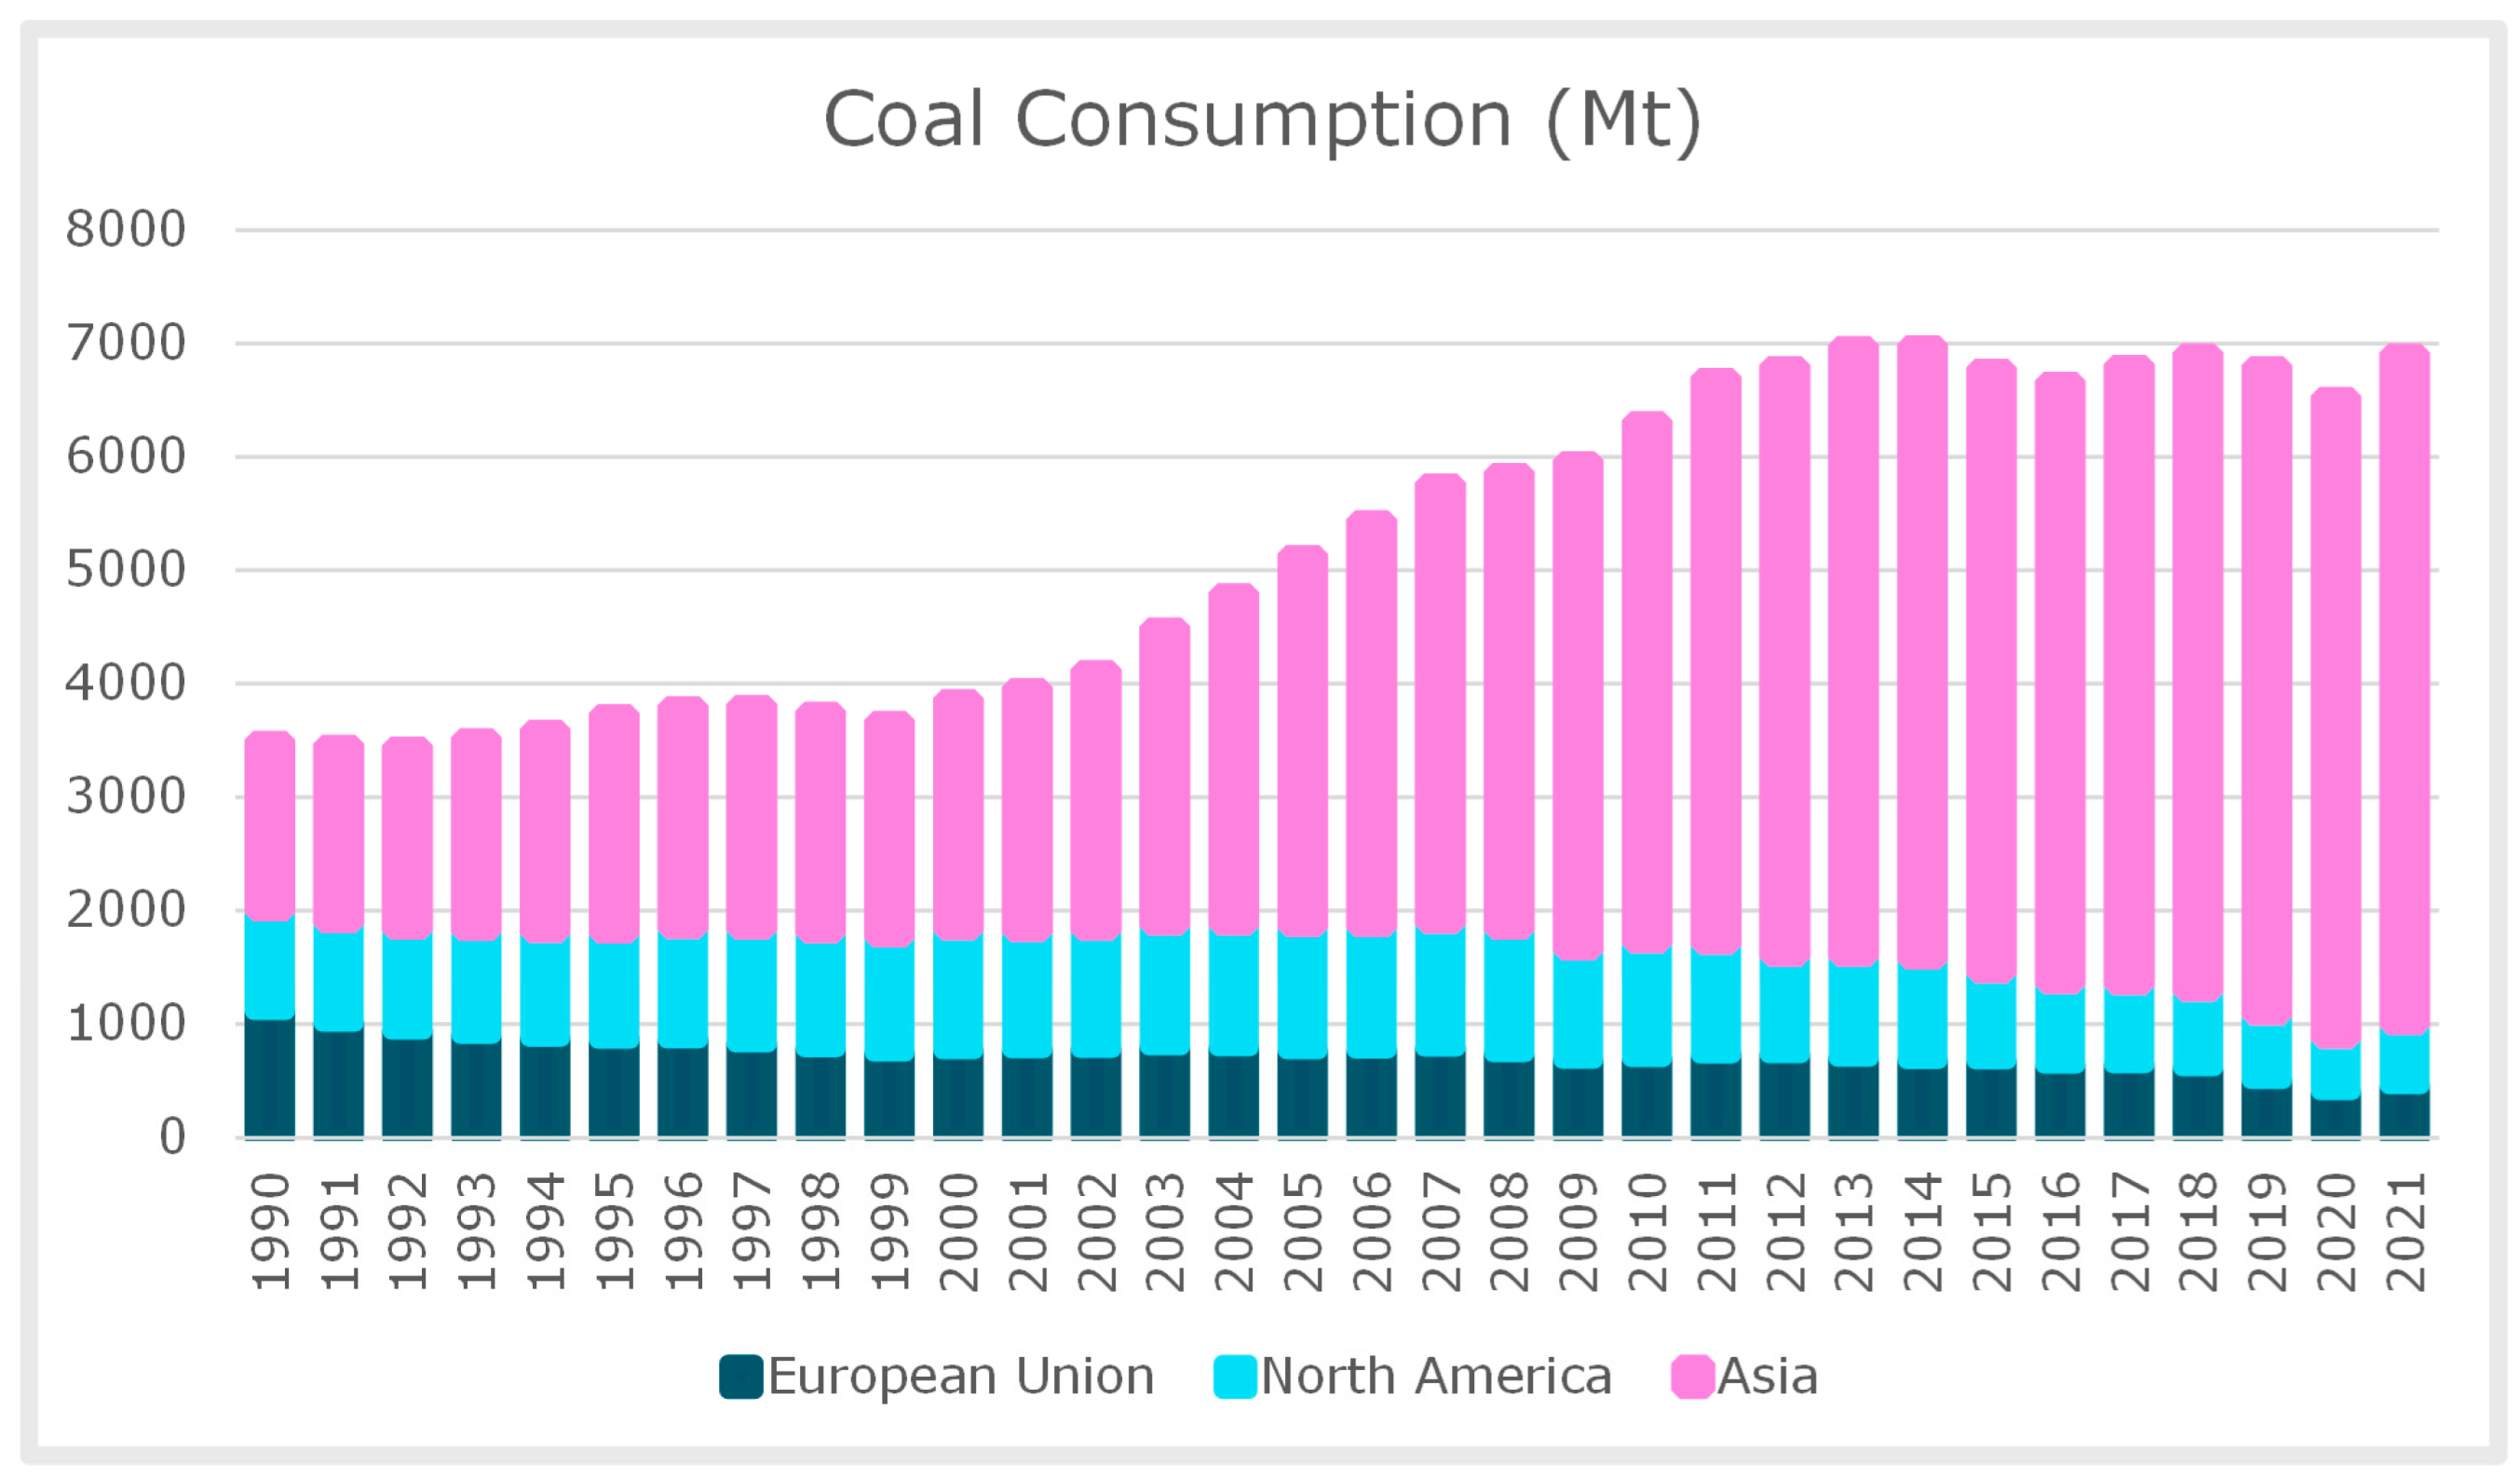
Environmental degradation has been a challenging issue worldwide in the past few decades due to its economic, social, and ecological consequences. According to World Bank [1], 57% of global CO2 emission come from Asian countries. In Asia and the Pacific, the CO2 emissions generated by coal power plant reach 30% of global CO2 emissions [2]. Over the last two decades, coal consumption increased by 150% [1], and the share of coal increased from 27% in 2010 to 43% in 2019 as a proportion of energy output [3]. Furthermore, International Energy Angency [4] indicates that Southeast Asian countries will become the world’s third largest coal-consuming region by 2025 and pose a serious environmental threat to the region. Figure 1 shows the increase in coal consumption in the past few years and the rise in the share of coal energy in the total energy output in Asian countries; meanwhile, coal consumption has decreased in America and European Union countries over time.
The development of any nation is strongly linked with the reserve of natural resources. These natural resources and achieving sustainable growth are the primary factors influencing the environment. Among these natural resources, coal is the cheapest fuel and dominant energy source for developed and developing nations due to its lower economic pricing [5]. Most developing countries continuously extract and import fossil fuels for energy generation [6], whereas South and East Asian economies overwhelmingly rely on fossil fuels, especially coal, by using a traditional technique to fulfill the aggregate energy demand [7]. Among fossil fuels, coal is the most carbon-intensive and cheapest energy source in developing nations. Whereas fossil fuels are the dominant factor in enhancing economic growth in most South and East Asian countries [8].
According to Mercator Research institute report on Climate Change [9], coal power plants significantly fulfill the energy demand to achieve sustainable growth, but their environmental cost is high. The high dependence on coal for electricity generation leads to a trade-off between economic growth and environmental welfare [10]. The increase in the energy price led to competition in the international market and shifted the economy toward the extraction and import of coal for cheap energy [11,12]; coal is considered the dirtiest source of energy among all fossil fuels [13]. As a result, environmental welfare has steadily deteriorated over time, transforming this region into a hub of varying environmental challenges [14,15]. Over the past few years, coal production in China, Vietnam, Indonesia, and India has increased, but coal production has declined in the European Union and the USA since 2019 [4]. According to an Intergovernmental Panel on Climate Change (IPCC) [16] report, coal, a dirty energy source, emits various pollutants, including CO2 and greenhouse gases (GHGs), which are the main cause of smog in Asian countries. Furthermore, the efficiency of coal is lower than other fossil fuels, and more coal is required for the same amount of heat produced from oil and gas.
Thus, South and East Asian countries should ensure environmental welfare by enhancing the share of renewable energy [17]. Most Asian countries are monotonically dependent on non-renewable energy [18], and the share of renewable energy of the total output is significantly low [19]. However, South and East Asian countries face substantial energy shortages [20]. Consequently, these nations import fossil fuels to mitigate the energy shortage [21]. Hence, instead of moving toward fossil fuels, it is ideal for increasing regional cooperation among the countries to develop renewable energy projects [22]. Along with renewable energy, it is important to strengthen the environmental regulation that is beneficial for growth policy [23,24]. Stringent environmental regulation enhances energy efficiency and productivity, which helps to reduce dependency on fossil fuels [25]. Flexible environmental regulations in developing nations attract carbon-intensive industry [26] and convert the host nation and surrounding nation into haven for pollution, called the pollution haven hypothesis [27].
Several studies have examined the environmental Kuznets curve (EKC) for CO2 emissions and the ecological footprint in Southeast Asian countries [28,29,30]. Most of the studies have focused on CO2 or the ecological footprint and ignore the main emission source: coal. Coal is the most carbon-intensive fossil fuel, and it is a widely available and cost-effective energy source, ranked second globally in terms of usage and accounting for nearly 30% of total energy consumption. Its primary use is in power generation, with over 40% utilized for electricity production [31]. However, the rising demand for coal leads to a rise in pollution, posing a threat to the environment and human health. Furthermore, environmental pollution is a universal issue, and the responsibility of mitigating its effects falls primarily on countries that are significant producers of carbon dioxide emissions [32]. Several studies have confirmed the strong positive causality between coal consumption and environmental degradation [33,34]. Thus, coal is considered the main cause of CO2 emissions and environmental deterioration. Therefore, coal could be considered the best proxy for environmental degradation [35]. Furthermore, the existing literature focuses on forecasting coal consumption [7,36,37] and studies cases for only South Asian [3,29] or Southeast Asian [6,10,15] countries. A scant literature exists that include both South and East Asian countries to investigate if this region as a whole has achieved the threshold point for coal consumption.
To shed light on these unanswered issues, this research investigates the EKC for coal consumption in 11 South and East Asian countries, which is the main contribution to the existing literature. From this study, we can determine whether the South and East Asian countries have achieved the threshold. The availability of the data restricted the analysis to 11 South and East Asian countries. Secondly, the current study has a methodology contribution by applying the second-generation econometric technique. Previous studies often apply traditional techniques such as FMOLS, GMM, and fixed and random effects techniques [38,39,40]. The selection of the more advanced second-generation techniques, MG-CCE and AM, has several advantages over traditional panel techniques. The main assumption of cross-sectional dependencies across countries and heterogeneity issues is taken into account [41]. In addition, it also handles the strong correlation issue irrespective of the stationary or cointegrated series [42]. Employing MG-CCE and AMG enables us to provide more appropriate and robust results against the violation of econometric assumptions. Lastly, this analysis would help the policymaker to make regional policies regarding coal consumption to mitigate environmental degradation.
The subsequent section is organized as follows. In the subsequent section, we provide a brief overview of the existing literature. In the third section, we give an overview of data and estimation techniques. Then, in the fourth section, we show the results and discussions. Finally, in the conclusion section, we provide a brief summary and policy implications.
1.1. Literature Review
Sustainable economic growth and environmental mitigation are highly interconnected [43]. Hence, higher economic growth is tentative without ensuring environmental welfare in tandem. Therefore, researchers and policymakers focus on the relationship between economic growth and environmental degradation. After achieving the threshold, pollution emissions decrease as the economic growth continues to grow, and the trade-off phases out. This increasing and declining relationship between growth and environmental degradation is referred to as the EKC [44,45,46].
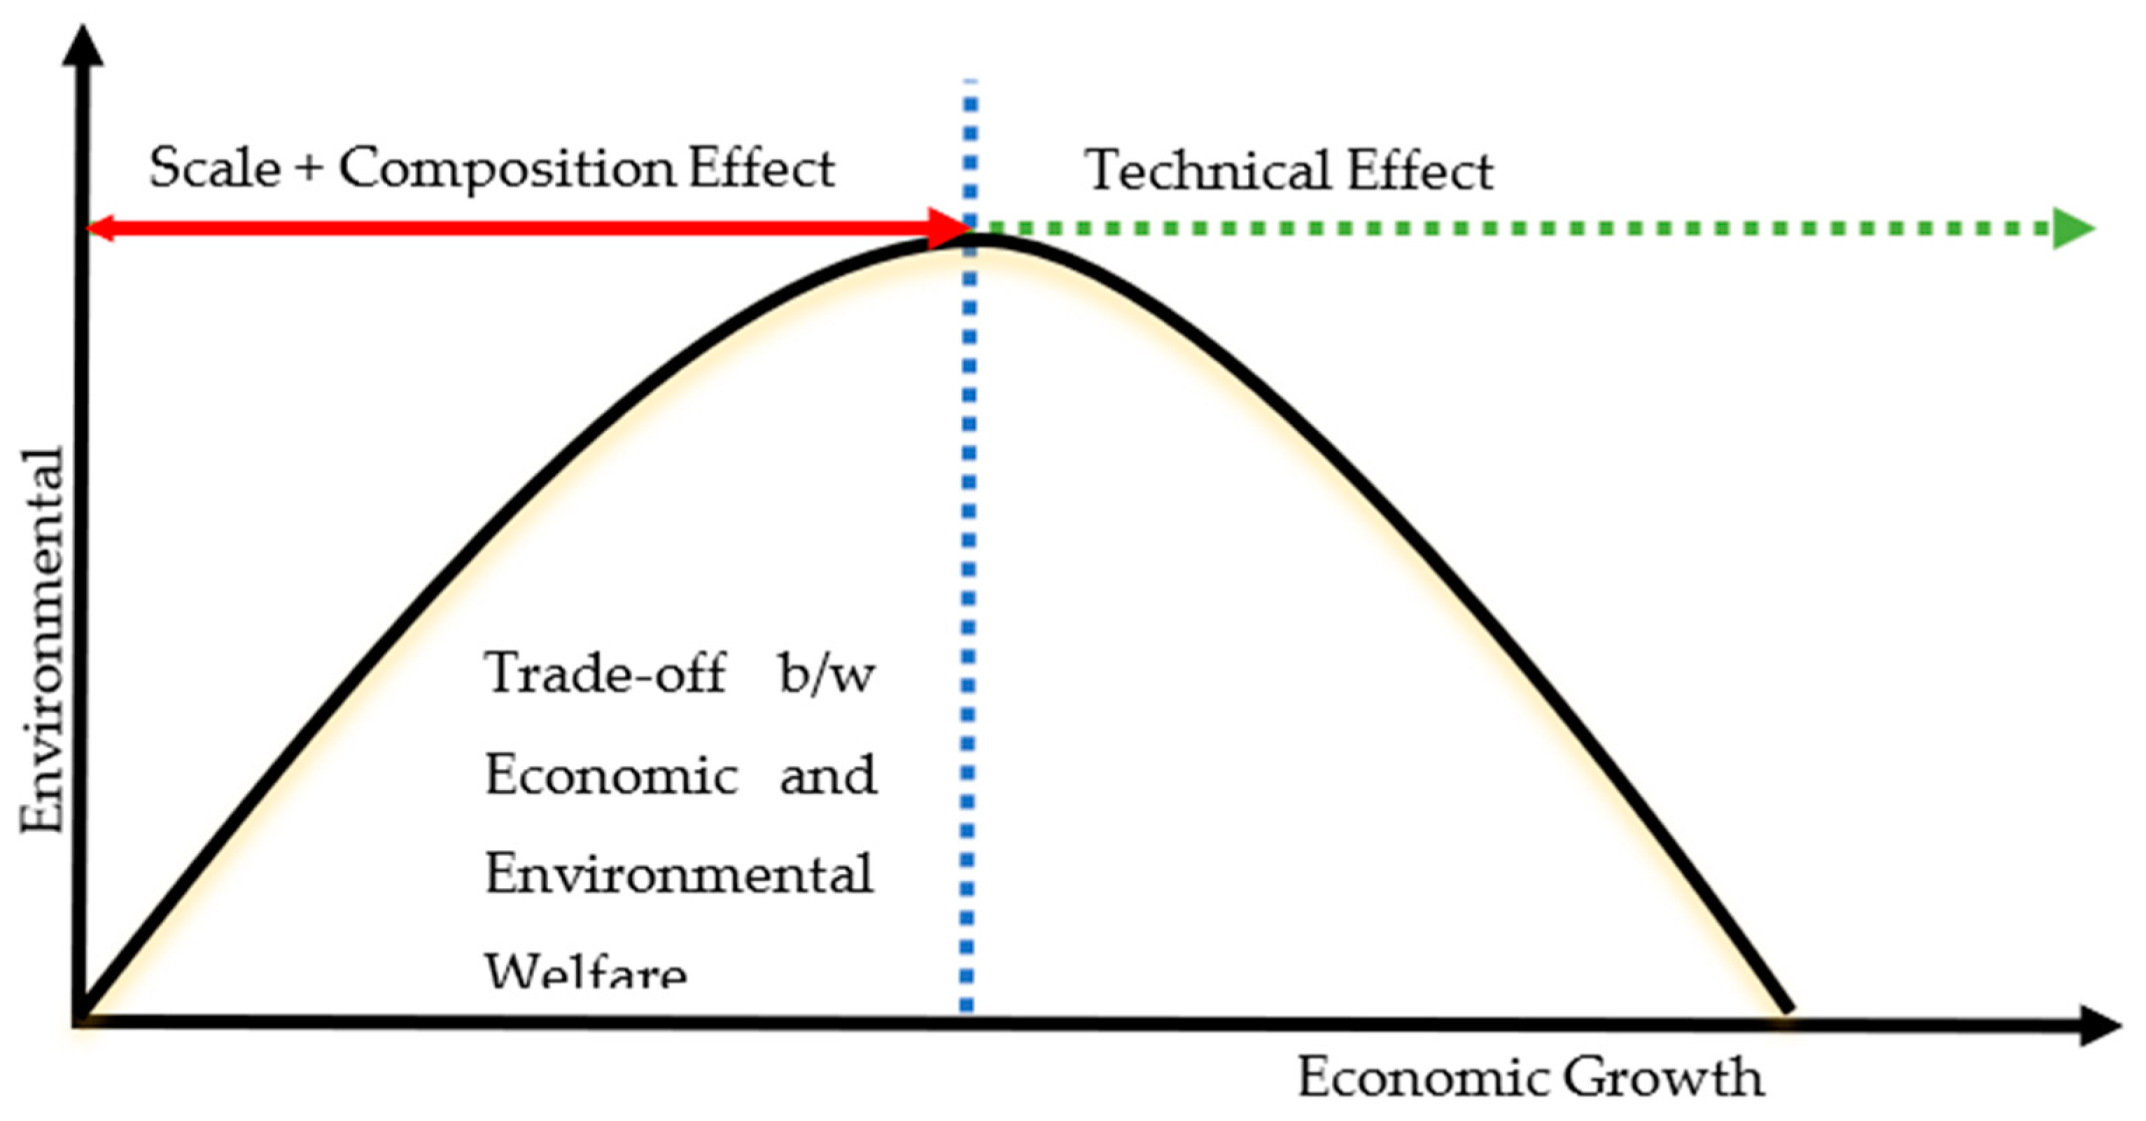
Figure 2 illustrates a conceptual graph of the EKC. Initially, the economy achieves sustainable economic growth at the cost of environmental degradation, and this phenomenon is called the trade-off [47]. This trade-off exists because the economy prioritizes economic growth at the cost of environmental degradation. As the economy starts to grow, the increase in anthropogenic activities leads to a rise in national income [43]. It leads to increased energy demand, which is met by cheap sources of fossil fuel, negatively affecting the environment [48]. The extraction and combustion of these fossil fuels adversely impact the environment [49]. This phase highlights the idea that as economies grow and energy demand increases, it is often met by environmentally unfriendly sources, exacerbating environmental degradation. This phenomenon is referred to as the scale effect. At that phase, economic welfare is the priority compared to environmental benefits, which leads to trade-offs. Then, the economy starts growing at the cost of the environment and continuous economic growth can further degrade the environment. This phase of economic growth is known as the composition effect.
After surpassing the threshold, the trade-off between sustainable economic growth and environmental degradation starts to phase out. This phenomenon is referred to as the technical effect [50]. Higher economic growth helps the economy afford advanced and green technology to maintain a sustainable environment [51]. As a result, the technical effect dominates the scale and composition effect because environmental degradation is reduced due to the use of environmentally friendly technology and an increase in energy efficiency. According to Gill et al. [52], the technical effect enables economies to ensure higher environmental quality and economic growth.
According to Xue et al. [8], several other factors, such as stringent environmental regulation and an increased share of renewable energy, would completely phase out the trade-off effect. The existing literature has extensively examined the EKC for CO2 emissions and ecological footprints. Among these, several studies have statistically confirmed the validity of the EKC hypothesis for CO2 emissions and ecological footprints, for example, by Khan et al. [40] for 184 nations, Baloch [53] for BRICS countries, Ulucak et al. [41] for low and middle-income nations, and Isik et al. [54] for OECD countries. As for country-specific results, Pata and Caglar [55] found that the EKC for CO2 emissions holds for Turkey. Initially, economic growth is the cause of the rise in CO2 emissions, but it later the CO2 emissions reduce due to achieving the threshold of growth and use of carbon-friendly technology. Meanwhile Isik et al. [56], for the US, and Mehmood and Tariq [57], for Asian countries, found ambiguous (mixed) results regarding the EKC. In contrast, the EKC for CO2 emissions is rejected for BCM-EC member countries [58] and for six Asian countries [38].
Furthermore, energy consumption is inextricably linked with growth and affects the environment depending on the sources [59]. According to Naqvi et al. [60], renewable energy positively impacts the ecological footprint in both high- and upper-middle-income countries. Renewable energy is considered the main factor in ensuring a sustainable environment in developed nations. Similarly, Sharma et al. [61] highlighted that renewable energy significantly improves the ecological footprint of Asian countries. On the other hand, Udemba and Agha [62] found that non-renewable energy consumption boosts the CO2 emission level in Nigeria. Khan et al. [11] reveal a positive impact of non-renewable energy on environmental degradation. Similarly, Ahmed et al. [63]; Altıntaş and Kassouri [64]; Baz et al. [65] reported an adverse impact of energy consumption on ecological footprint. Several empirical studies found that the inflow of FDI stimulates environmental degradation [66]. The positive impact of FDI on CO2 emissions is called the pollution haven hypothesis [67]. Muhammad et al. [68] found a statistically significant positive impact of FDI on the ecological footprint of BRICS countries. Similarly, Khan et al. [69] confirmed the PHH held in China, India, and Pakistan.
From the above literature, it is confirmed that most studies focus on the impact of economic growth on CO2 emissions or ecological footprint, known as EKC for CO2 emissions. Hao et al. [35] analyzed the EKC for coal consumption in China at the provincial level. Furthermore, Bloch et al. [33] investigated the relationship between CO2 emissions, national income, and coal consumption. Similarly, Govindaraju and Tang [34] examined the impact of economic growth and coal consumption on CO2 emissions in China. The research seems to be in harmony regarding the EKC for coal consumption. The current study will try to fill the gap by analyzing the linkage between economic growth and coal consumption, considered a dirty energy source among all fossil fuels. The main contribution of this study is in investigating the EKC for coal consumption in South and East Asian countries. Coal is the primary cause of the degradation of the environment and emits a large amount of CO2. This study contributes to both academics and policy making by determining whether and when coal consumption achieves the threshold point in South and East Asian countries.
1.2. Methodology
To apply the appropriate econometric technique, it is necessary and preliminary to check issues such as cross-sectional dependency, slope homogeneity, stationarity, etc. This will help in selecting the appropriate technique for analysis.
1.3. Method and Data
In line with the EKC, this study follows recent studies [23,24,41]. The linear log model has been employed to analyze the EKC for coal consumption, as follows:
In Equation (1), β0–β5 represent the intercept and parameter of variables, and ε represents the error term. We conducted a robustness check by testing several alternative dependent variables in addition to lncoal and sensitivity analysis by testing our model with different sample selections. We found that our results were consistent across the different samples, further supporting our findings’ robustness. The variable Coal represents the coal consumption (Exajoules), GDP denotes the GDP per capita (US-constant dollar 2015), FDI is the inflow of foreign direct investment (percentage of GDP), TP is the total pollution, and REN is the renewable energy sum of solar, wind, and hydro energy (terawatt-hours). In Equation (1), the dependent variable is coal consumption, which is used as a proxy for environmental degradation because coal is considered a dirty source of energy among fossil fuels and the main cause of CO2 emissions. The GDP per capita variable is used as the proxy for economic growth. Its square term is used to check the EKC hypothesis. The primary goal is to explore a linear or non-linear relationship between coal consumption and economic growth. Initially, we expect a positive relationship between the target variables because the selected nations have a high reserve of coal and high rates of coal importation. Furthermore, the increased pressure of energy demand leads to more usage of coal in power plants and elicits more CO2 emissions. Secondly, it determines whether or not the South and East Asian economies are moving toward renewable energy to protect the environment by reducing coal consumption.
1.4. Data and Sources
The data were obtained from two different sources, i.e., WDI and British Petroleum, from 1990 to 2020 and restricted the analysis to 11 South and East Asian countries due to data availability. The data on GDP per capita, total population, and inflow of foreign direct investment have been taken from WDI (2020), while the data on coal consumption and renewable energy are from the Statistical Review of World Energy, 2020 published by British Petroleum. The details of the data source are summarized in Table 1.
1.5. Cross-Sectional Dependency
The linear regression assumes that the error term is independently distributed across the data, but this is not true [24]. According to Murshed et al. [70], cross-sectional dependency occurs when one cross-sectional unit is highly dependent on another. South Asian countries assume to be cross-sectionally, economically, and geographically connected [48]. Secondly, South and East Asian countries are also linked in terms of energy (coal dependency) and the environment under the Paris Agreement [22]. Hence, ignoring the panel’s cross-sectional dependency would be spurious and biased in long-run results [71]. Therefore, it is important to check the CD issue in the context of South and East Asian countries because these nations are highly dependent and net coal importers. In addition, environmental degradation, especially CO2 emissions, can spread across the region quickly. Thus, following Nathaniel et al. [72], this study utilizes the Pesaran (2004) CD test to check the cross-sectional dependency. Furthermore, the Pesaran [73] CD test is more appropriate when the period is more than the cross-sectional unit. The general form of the CD test is given below.
In Equation (2), Pi,j represents the cross-sectional correlation of the error term, T represents the period, and N represents a cross-sectional unit. Apart from the cross-section, it is necessary to check the slope of heterogeneity across the cross-sectional unit. According to Murshed et al. [48], Southeast Asian countries are connected in terms of several macroeconomic aspects such as coal importation, energy consumption, environmental degradation, national income, etc. Thus, the heterogeneity issue’s slope should be considered after finishing the CD issue. Therefore, Pesaran and Yamagata [74] check the slope heterogeneity issue with both test statistics (Δ and Δadj) and the null hypothesis of the slope of homogeneity across the cross-sectional unit.
1.6. Unit Root Test
When CD and slope of heterogeneity issues are confirmed, it is pertinent to check the stationarity property before moving toward long-run analysis. Therefore, the second-generation Augmented Dickey–Fuller (CADF) and Cross-sectional Augmented lm-Pesaran-Shin (CIPS) are more appropriate unit tests because they tackle these two issues properly in panel data [75]. According to Naqvi et al. [60]; Murshed and Dao [76], the second-generation unit root is more effective and efficient than the first-generation unit root due to the limitation of the CD issue. In this study, both CADF and CIPS unit root tests are applied, and the general form of CADF is given below.
In the above Equation (3), the unobservable common factor is introduced to tackle the issue of CD [77]. In Equation (3), β is constant, where γ, λ, ϑ, and δ are parameters, and y and Δy denote the mean of the cross-sectional value at the level and first difference, respectively, at T time for each cross-sectional unit. Now, to estimate the CIPS t-statistic, we use Equation (3) as follows:
where CADFi = t-statistic estimate from Equation (4).
The null hypothesis of both second-generation unit root tests is non-stationarity, while the alternative hypothesis is stationarity at level or first difference. After confirming that all variables are stationary at the common order of integration, it would be desirable to check their long-run association.
1.7. Panel Cointegration Test
If all variables are stationary at the common order of integration, then it is necessary to check the cointegration among the variables. In the case of the CD issue, the first-generation cointegration test failed to provide unbiased long-run results. Therefore, Westerlund (2007) developed the Durbin–Hausman (DH) test to check the cointegration among the common order, and it is called the second-generation cointegration test. Hence, Usman et al. [78]; Murshed [79] applied the Westerlund test because it takes into account the CD issue by applying the bootstrapped approach with four test statistics (Gt, Gα, Pt, and Pγ). Among these four, the first two, the Gt and Gα test statistics, are applied with the flexible alternative hypothesis of cointegration in at least one of the cross-sectional units [72].
and
while the other two, the Pt and Pα statistics, test the stricter alternative hypothesis of cointegration in all cross-sectional units.
and
where γi bar and γi bar (1) are the semiparametric kernel estimator and SE is the standard deviation of γi bar.
1.8. Panel Regression Analysis
In the literature, several studies use Generalized Method of Movement (GMM) and fixed and random effects appropriate when N > T and address the issue of endogeneity. Furthermore, Feasible Generalized Least Square (FGLS) provides meaningless results due to small SE, while FMOLS and DOLS assume that the cross-sectional unit has a homogenous slope. Hence, following Nathaniel et al. [72]; Murshed et al. [80], we applied the AMG estimator due to the slope of heterogeneity and the CD issue. In addition, AMG has several advantages over conventional panel techniques because AMG considers the endogeneity issue and estimates individual countries’ elasticity [54]. Furthermore, it is more appropriate for results when the time is more than the cross-sectional unit. AMG is a two-step estimator.
Step 1
Step 2
where in Equations (9) and (10), δt, ϑt, ht, and γ bar-AMG are the coefficients of the country-specific estimator, time dummy, unobserved common factor, and AMG estimator.
1.9. Causality Test
The AMG, DK, and FMOLS techniques give the results of long-run elasticity but do not tell us anything about a causal relationship. Secondly, the traditional panel causality technique is more appropriate for slope homogeneity [70]. Therefore, Naqvi et al. [60]; Murshed et al. [70] have employed the Dumitrescu and Hurlin [81] test for causality relation among variables, which is necessary for proper policy direction. Furthermore, D-H’s (2012) causality test considers the slope of heterogeneity and the CD issue in at least one of the cross-sectional units. The equation from which D-H causality can be predicated is given below,
where γi and θi = (θi (1), θi(P)) and γiP and θi(P) are the autoregressive and regression parameter.
2. Results and Discussion
We applied the cross-sectional dependency test, and the results are reported in Table 2. The findings show that the p-value of Pesaran’s test is statistically significant at a 5% significance level, and the other two tests are significant at 1%. Therefore, the statistical significance of these test rejects the null hypothesis and accepts the alternative hypothesis of cross-sectional dependency. This shows that shock in one nation may spread around the surrounding nations. For example, increased consumption of coal would lead to increased environmental degradation in the whole region. Furthermore, we also check the cross-sectional dependency among the variables by applying the Pesaran CD test, and these results are reported in Table 2. The results imply that the prob-value of the CD test is highly statistically significant for all variables at a 1% significance level; therefore, we reject the null hypothesis of no cross-section and affirm the cross-sectional dependency among the countries. This finding shows that South and East Asian countries are highly dependent on fossil fuels for their energy demand and cause severe environmental degradation in the region and the world. In addition, many of the South and East Asian nations are net coal importers and depend on coal for their energy production among all fossil fuels [82].
Once the cross-sectional dependency is affirmed, it is pertinent to check whether the slope coefficient is homogonous or heterogenous across the panel data. Furthermore, it is essential to check the slope of homogeneity by using Zellner’s (1992) framework because it is more appropriate when the time period is greater than the cross-sectional unit. Secondly, it simultaneously deals with the cross-sectional correlational and dynamic issues. Therefore, we applied the Pesaran and Yamagata [74] test, and the findings are presented in Table 3. This shows that p-values are highly significant at a 1% significance level for both Δ and Δadj. The Δadj p-value rejects the null hypothesis of homogeneity and accepts the alternative hypothesis of slope heterogeneity. Therefore, both Swamy-shat and Δ accept the alternative hypothesis favoring slope heterogeneity, affirming that countries’ specific characteristics should be considered during further analysis.
Identifying the appropriate order of integration of the variables would help to employ the suitable technique in panel analysis. Secondly, the unit root should be checked before testing the long-run association among the variables based on cointegration [83]. Furthermore, the CADF and CIPS unit root tests are more appropriate for strongly balanced data having CD and slope heterogeneity issues [84]. The null hypothesis is non-stationary, while the alternative hypothesis is stationary at a level and first difference. The results from the CADF and CIPS unit root test are reported in Table 4. This shows that all variables, i.e., GDP, its square term, FDI, TP, and REN, are statistically stationary at first difference. Similarly, the CIPS unit root test also affirms that all variables are statistically stationary at first difference. To avoid spurious and biased results, it is essential to check the stationarity property of the variable. Hence, all the variables are stationary at the first order of integration, then cointegration among the variables should be checked.
We also applied the Pedroni and Westerlund cointegration test to check the long-run association between dependent and explanatory variables. The results of the Pedroni cointegration tests are reported in Table 5. Except for Phillips–Perron t in Pesaran, the cointegration tests are statistically significant at a 1% significance level. To affirm the Pedroni cointegration test results, we also applied the Westerlund cointegration test, and the results are reported in Table 5. The results show that the prob-values are significant at a 1% significance level. Therefore, we reject the null hypothesis of no cointegration and accept the alternative hypothesis of cointegration. The statistically significant Gt and Pt confirm the long-run relationship among the variables. Both tests affirm the long-run relationship among the variables in the context of South and East Asian countries. Confirming the long-run relationship permits us to investigate the long-run elasticity between coal consumption and the explanatory variable.
Table 6 reports the long-run elasticity for coal consumption estimates from AMG and CCEMG methods. The elasticity of GDP per capita is positive and statistically significant at the 10% significance level. Therefore, a one percent increase in the GDP would lead to an increase in coal consumption by 5.79% in South and East Asian countries. The positive relationship of GDP with coal consumption predicts that initially, economic growth is highly supported by coal for energy used in various sectors of the economy. Secondly, coal is considered a cheap and most dirty source of energy among other fossil fuels [35]. This finding implies that initially, every economy is in search of sustainable economic growth and utilizes all the available resources in the best possible way without considering environmental degradation.
According to Jin and Kim [85], economic growth is positively associated with coal consumption in non-OECD countries. Kongbuamai, Bui [86] found that initial economic growth is the main cause of environmental degradation in Southeast Asian countries. Identical results were also reported by Charfeddine and Mrabet [87] for the Middle East and North African countries. Furthermore, the elasticity of the square term is negative and statistically significant at 10%. A one percent increase in the square term of GDP would lead to a decrease in coal consumption by 0.27 percent. Hence, the EKC hypothesis is statistically verified for the panel of South and East Asian countries. Still, some South and East Asian countries are yet to surpass the threshold level of growth, and it is pertinent to attain a higher level of growth to completely phase out coal consumption, which can be considered a good step toward environmental protection. Several studies statistically confirmed the validity of the EKC hypothesis, such as Kongbuamai et al. [86] for Asian countries, Ali et al. [88] for Nigeria, and Ahmad et al. [89] for G7 countries. After the threshold of economic growth, environmental degradation is reduced through the reduction of coal consumption and moving toward green sustainable energy [8]. The results show that South and East Asian countries are near the threshold level but have a small share of square terms showing a minor contribution to protecting the environment. Hence, lower and higher economic growth is the cause and solution of environmental degradation. Higher economic growth forces economies to spend much of their GDP on protecting the environment. According to Murshed et al. [80], investment in environmentally friendly technology and stringent regulation play a major role in environmental welfare. Similarly, results were also reported by Ulucak et al. [41] that strict environmental regulation is more effective in reducing emission levels in BRICS countries.
As far as the inflow of FDI, it is the main factor of economic growth, but the inflow of FDI is a way to transfer polluted industry into developing nations where environmental rules and regulations are flexible [90]. The positive sign and statistical significance of FDI are homogenous across two alternative regression methods. A one percent increase in the inflow of FDI would lead to an increase in coal consumption by 0.005%. The share of the inflow of FDI in the GDP in Asian countries is increasing due to flexible rules and regulations, but it tends to boost environmental degradation [8]. Secondly, the developing nations provide a flexible way to attract a higher inflow of FDI in the form of technology which is mostly polluted because of highly strict environmental rules in the developed countries. Furthermore, foreign investors are searching for those nations by outsourcing polluted production. Therefore, developed nations take advantage of flexible rules by exporting products to their home countries. Hence, these developing nations are converted into pollution havens because of a high share of FDI in their GDP. Similarly, Khan et al. [69] confirmed the pollution haven hypothesis for China, India, and Pakistan. Furthermore, these nations have traditionally been predominantly fossil fuel-intensive, which can create an alarming situation for the world in the near future. It is also affirmed that environmental regulation in South and East Asian countries is not implemented appropriately and is ineffective for environmental welfare. Thus, it is primarily important to enhance the strictness of environmental regulation to improve the quality of the environment [24].
Moreover, increasing urbanization creates pressure for more energy demand. The economy would utilize all the fossil fuels, among which coal is dominantly used for power generation. The predicted elasticity shows that an increased population would pressure the economy to move toward coal consumption. Ahmed et al. [63] found that urbanization adversely affects the ecological footprint in G7 countries. Similarly, increasing the urban population negatively affects Turkey’s ecological footprint [91]. Many of the South and East Asian countries are highly populated and depend on coal for energy. Hence, these nations are continually extracting coal reserves and importing coal to run coal power plants. It is well-known that non-renewable energy has a higher CO2 emission level, while renewable energy has a zero-emission level. The elasticity estimate shows that higher consumption of renewable energy would boost the environmental quality, although the share of renewable energy in electricity output is low due to dependency on traditional technology and continuous use of fossil fuels for energy. Therefore, these nations should focus on more renewable energy projects to reduce their predominant reliance on coal consumption and curb the adverse effect on the environment more effectively. Thus, moving towards renewable energy is in favor of environmental welfare, which is highlighted by Hashmi and Alam [92]; Destek and Sinha [93] for OECD countries, Sharma et al. [61] for Asian countries, and Zaman et al. [94] for China. However, stringent environmental regulation is highly effective in developed nations.
Table 7 reports the results of D-H causality, and the finding confirmed that there is bidirectional causality running from both directions between coal, economic growth, and FDI. This shows that coal consumption drives economic growth in South and East Asian countries due to the high dependency on fossil fuels for energy production. Secondly, the inflow of FDI is the main factor in accelerating economic growth but also enhances the coal-related projects in high-coal-reserve countries like Indonesia, Pakistan, and India. Therefore, improvement in the environmental quality is possible to redirect foreign investment into environmentally friendly projects. The use of fossil fuels cannot be eliminated but can be limited to some extent to maintain a sustainable environment. Thus, both growth and environmental policies should be aligned together without turning a blind eye to environmental degradation. There is also unidirectional causality between total population and coal consumption because the increase in the population drives coal consumption. The increase in the urban population increases the energy demand, creating pressure on the cheapest fossil fuel source, coal. The findings show unidirectional causality between renewable energy and coal consumption. This unidirectional relationship can be justified from the perspective that enhancing renewable energy projects would help to phase out coal consumption to some extent and limit environmental degradation activities. Wang and Dong [95] found a unidirectional causality between renewable energy and ecological footprint for 14 sub-Saharan African countries.
3. Conclusions
The issue of environmental sustainability has become a pressing global concern. As a result, governments worldwide are working to develop strategies that balance economic growth with environmental protection. One key aspect is reducing reliance on coal as a primary energy source. This study aimed to examine the impact of various economic factors on the coal consumption of four South and East Asian countries heavily dependent on fossil fuels. Coal-intensive energy is a cheap energy source among all fossil fuels but is the main cause of environmental degradation. Prioritizing coal consumption is the main cause of CO2 emissions and deteriorating environmental quality. Therefore, coal could be considered the best proxy for environmental performance in South and East Asian countries. The research used MG-CCE and AMG econometric methods to analyze the data and found long-term relationships between coal consumption, economic growth, foreign direct investment, the use of renewable energy, and population.
The study also found that the elasticity estimates supported the authenticity of the EKC and the pollution haven hypothesis (PHH) in the context of the selected South and East Asian economies. The EKC suggests that as countries develop economically, their environmental performance will initially worsen but improve as they reach a certain income level. The findings reveal that economic growth, measured by gross domestic product (GDP), has a positive relationship with coal consumption. This suggests that as these economies grow, there is an increased demand for energy, often met through coal. The positive relationship between the square term of GDP and coal consumption confirmed the validity of EKC for coal consumption. The existence of an EKC for coal consumption suggests that as these countries experience economic growth and development, they may initially experience an increase in coal consumption and associated environmental degradation. However, as they become more economically advanced and develop the capacity to implement cleaner forms of energy, they may eventually experience a decrease in coal consumption and associated environmental degradation.
Similarly, FDI also has a positive relationship with coal consumption, indicating that foreign investment increases in these countries led to the increased use of coal. Developing countries in South and East Asia may have weaker environmental regulations than developed countries, making it more attractive for polluting industries such as coal-fired power plants and mining to establish operations in these countries. This can lead to an increase in coal consumption as these industries expand and demand for energy grows. On the other hand, the study found that an increase in the use of renewable energy leads to a reduction in coal consumption. This suggests that as more renewable energy sources are utilized, there is less need for coal. Furthermore, the study found that urbanization, which leads to an increase in energy demand, creates pressure on these economies to increase the use of coal to meet this demand.
Based on the results of the economic analysis, several policy recommendations can be made. Governments in South and East Asian countries should provide flexibility to foreign investors in developing renewable energy projects, such as solar and wind power. This will help to increase the share of renewable energy in the total energy output and reduce the reliance on coal. Along with renewable energy, governments should implement policies and regulations that make it more difficult for industries to use coal, such as carbon taxes or emission trading schemes. This will help reduce the demand for coal and encourage the use of cleaner energy. Furthermore, reliance on renewable energy is not enough, and policies and programs must also be implemented to promote energy efficiency and conservation, such as building codes and appliance standards. This will help reduce overall energy demand and the need for coal.
Overall, future research should aim to provide a more comprehensive understanding of the factors driving coal consumption in South and East Asian countries and how to reduce it sustainably and effectively. The link between FDI and coal consumption in South and East Asian countries has been noted, but more research is needed to understand the dynamics of this relationship. Future studies should investigate the industries and sectors driving the increase in FDI and how these industries contribute to coal consumption. While energy efficiency and conservation measures have been proposed to reduce overall energy demand and the need for coal, more research is needed to understand the potential for these measures in South and East Asian countries. Future studies should investigate the feasibility and cost-effectiveness of different energy efficiency and conservation strategies and assess their potential impact on reducing coal consumption.
Author Contributions
Conceptualization, Q.S.; methodology and software, Q.S.; validation and formal analysis, Q.S.; investigation and resources, Q.S.; data curation, Q.S.; writing—original draft preparation, Q.S.; writing—review and editing, K.A.; supervision, K.A. All authors have read and agreed to the published version of the manuscript.
Funding
For this research, we received no external funding.
Institutional Review Board Statement
Not applicable.
Informal Consent Statement
Not applicable.
Data Availability Statement
Not applicable.
Conflicts of Interest
The authors declare no conflict of interest.
References
- World Bank. Coal Phase Out in the EAP Region. 2021. Available online: https://www.unescap.org/sites/default/d8files/event-documents/Phase_Out_of_Coal_Transition_in_EAP_World%20Bank_0.pdf (accessed on 26 February 2021).
- International Energy Angency. Global Energy & CO2 Status Report. 2019. Available online: https://www.iea.org/reports/globalenergy-co2-status-report-2019 (accessed on 26 February 2021).
- Fuentes, U.; Chapman, A. Shifting Investment away from Fossil Fuels in Southeast Asia 2021. Available online: https://library.fes.de/pdf-files/bueros/vietnam/17871.pdf (accessed on 19 January 2022).
- International Energy Angency. Coal 2020 Analysis and Forecast to 2025. 2020. Available online: https://iea.blob.core.windows.net/assets/00abf3d2-4599-4353-977c-8f80e9085420/Coal_2020.pdf (accessed on 25 January 2021).
- Yu, X. Coal mining and environmental development in southwest China. Environ. Dev. 2017, 21, 77–86. [Google Scholar] [CrossRef]
- Shukla, A.K.; Sudhakar, K.; Baredar, P. Renewable energy resources in South Asian countries: Challenges, policy and recommendations. Resour. Effic. Technol. 2017, 3, 342–346. [Google Scholar] [CrossRef]
- Clark, R.; Zucker, N.; Urpelainen, J. The future of coal-fired power generation in Southeast Asia. Renew. Sustain. Energy Rev. 2020, 121, 109650. [Google Scholar] [CrossRef]
- Xue, L.; Haseeb, M.; Mahmood, H.; Alkhateeb TT, Y.; Murshed, M. Renewable energy use and ecological footprints mitigation: Evidence from selected South Asian economies. Sustainability 2021, 13, 1613. [Google Scholar] [CrossRef]
- MCC. Closing the Deal on the End of Coal. 2018. Available online: https://www.mcc-berlin.net/fileadmin/data/C18_MCC_Publications/MCC_Policy_Brief_Coal_EN.pdf (accessed on 26 August 2018).
- Murshed, M. LPG consumption and environmental Kuznets curve hypothesis in South Asia: A time-series ARDL analysis with multiple structural breaks. Environ. Sci. Pollut. Res. 2021, 28, 8337–8372. [Google Scholar] [CrossRef] [PubMed]
- Khan, M.K.; Khan, M.I.; Rehan, M. The relationship between energy consumption, economic growth and carbon dioxide emissions in Pakistan. Financ. Innov. 2020, 6, 1. [Google Scholar] [CrossRef] [Green Version]
- Murshed, M.; Alam, M.S. Estimating the macroeconomic determinants of total, renewable, and non-renewable energy demands in Bangladesh: The role of technological innovations. Environ. Sci. Pollut. Res. 2021, 28, 30176–30196. [Google Scholar] [CrossRef]
- Murshed, M. Modeling primary energy and electricity demands in Bangladesh: An autoregressive distributed lag approach. Sustain. Prod. Consum. 2021, 27, 698–712. [Google Scholar] [CrossRef]
- Network, G.F. Global Footprint Network. 2020. Available online: https://www.footprintnetwork.org/?_ga=2.175409377.254015993.1605975840-1925359116.1605807658#/exploreData (accessed on 26 January 2020).
- Sun, H.; Mohsin, M.; Alharthi, M.; Abbas, Q. Measuring environmental sustainability performance of South Asia. J. Clean. Prod. 2020, 251, 119519. [Google Scholar] [CrossRef]
- IPCC. Global and Regional Coal Phase-Out Requirements of the Paris Agreement: Insights from the IPCC Special Report on 1.5 °C. 2019. Available online: https://climateanalytics.org/media/report_coal_phase_out_2019.pdf (accessed on 26 September 2019).
- Murshed, M. Can regional trade integration facilitate renewable energy transition to ensure energy sustainability in South Asia? Energy Rep. 2021, 7, 808–821. [Google Scholar] [CrossRef]
- Murshed, M. Does improvement in trade openness facilitate renewable energy transition? Evidence from selected South Asian economies. South Asia Econ. J. 2018, 19, 151–170. [Google Scholar] [CrossRef]
- World Bank. World Development Indicators. Retrieved from World Bank (2020). 2020. Available online: https://datatopics.worldbank.org/world-development-indicators/ (accessed on 26 February 2020).
- Iram, R.; Anser, M.K.; Awan, R.U.; Ali, A.; Abbas, Q.; Chaudhry, I.S. Prioritization of renewable solar energy to prevent energy insecurity: An integrated role. Singap. Econ. Rev. 2021, 66, 391–412. [Google Scholar] [CrossRef]
- Moey, L.K.; Goh, K.; Tong, D.L.; Chong, P.L.; Adam, N.M.; Ahmad, K.A. A review on current energy usage and potential of sustainable energy in Southeast Asia countries. J. Sustain. Sci. Manag. 2020, 15, 89–107. [Google Scholar]
- Singh, A.; Jamasb, T.; Nepal, R.; Toman, M. Electricity cooperation in South Asia: Barriers to cross-border trade. Energy Policy 2018, 120, 741–748. [Google Scholar] [CrossRef] [Green Version]
- Omojolaibi, J.A.; Nathaniel, S.P. Assessing the potency of environmental regulation in maintaining environmental sustainability in MENA countries: An advanced panel data estimation. J. Public Aff. 2022, 22, e2526. [Google Scholar] [CrossRef]
- Nathaniel, S.; Murshed, M.; Bassim, M. The nexus between economic growth, energy use, international trade and ecological footprints: The role of environmental regulations in N11 countries. Energy Ecol. Environ. 2021, 6, 496–512. [Google Scholar] [CrossRef]
- Shahzad, U. Environmental taxes, energy consumption, and environmental quality: Theoretical survey with policy implications. Environ. Sci. Pollut. Res. 2020, 27, 24848–24862. [Google Scholar] [CrossRef]
- Zhao, J.; Jiang, Q.; Dong, X.; Dong, K. Would environmental regulation improve the greenhouse gas benefits of natural gas use? A Chinese case study. Energy Econ. 2020, 87, 104712. [Google Scholar] [CrossRef]
- Yang, J.; Guo, H.; Liu, B.; Shi, R.; Zhang, B.; Ye, W. Environmental regulation and the pollution haven hypothesis: Do environmental regulation measures matter? J. Clean. Prod. 2018, 202, 993–1000. [Google Scholar] [CrossRef]
- Ansari, M.A.; Haider, S.; Khan, N. Environmental Kuznets curve revisited: An analysis using ecological and material footprint. Ecol. Indic. 2020, 115, 106416. [Google Scholar] [CrossRef]
- Fong, L.S.; Salvo, A.; Taylor, D. Evidence of the environmental Kuznets curve for atmospheric pollutant emissions in Southeast Asia and implications for sustainable development: A spatial econometric approach. Sustain. Dev. 2020, 28, 1441–1456. [Google Scholar] [CrossRef]
- Zulfa, E.; Resha, M. Economic determinants of carbon dioxide emissions: A proof of the environmental Kuznet curve hypothesis in Asia. TEST Eng. Manag. 2020, 82, 6877–6885. [Google Scholar]
- Adebayo, T.; Akinsola, G.; Odugbesan, J.; Olanrewaju, V. Determinants of environmental degradation in Thailand: Empirical evidence from ARDL and wavelet coherence approaches. Pollution 2021, 7, 181–196. [Google Scholar]
- Adebayo, T.S. Revisiting the EKC hypothesis in an emerging market: An application of ARDL-based bounds and wavelet coherence approaches. SN Appl. Sci. 2020, 2, 1945. [Google Scholar] [CrossRef]
- Bloch, H.; Rafiq, S.; Salim, R. Coal consumption, CO2 emission and economic growth in China: Empirical evidence and policy responses. Energy Econ. 2012, 34, 518–528. [Google Scholar] [CrossRef]
- Govindaraju, V.C.; Tang, C.F. The dynamic links between CO2 emissions, economic growth and coal consumption in China and India. Appl. Energy 2013, 104, 310–318. [Google Scholar] [CrossRef]
- Hao, Y.; Liu, Y.; Weng, J.-H.; Gao, Y. Does the Environmental Kuznets Curve for coal consumption in China exist? New evidence from spatial econometric analysis. Energy 2016, 114, 1214–1223. [Google Scholar] [CrossRef]
- Duan, H.; Luo, X. A novel multivariable grey prediction model and its application in forecasting coal consumption. ISA Trans. 2022, 120, 110–127. [Google Scholar] [CrossRef]
- Rosyid, F.A.; Adachi, T. Coal mining in Indonesia: Forecasting by the growth curve method. Miner. Econ. 2016, 29, 71–85. [Google Scholar] [CrossRef]
- Ahmed, Z.; Le, H.P. Linking Information Communication Technology, trade globalization index, and CO2 emissions: Evidence from advanced panel techniques. Environ. Sci. Pollut. Res. 2021, 28, 8770–8781. [Google Scholar] [CrossRef]
- Adebayo, T.S.; Kirikkaleli, D.; Adeshola, I.; Oluwajana, D.; Akinsola, G.D.; Osemeahon, O.S. Coal consumption and environmental sustainability in South Africa: The role of financial development and globalization. Int. J. Renew. Energy Dev. 2021, 10, 527–536. [Google Scholar] [CrossRef]
- Khan, S.; Khan, M.K.; Muhammad, B. Impact of financial development and energy consumption on environmental degradation in 184 countries using a dynamic panel model. Environ. Sci. Pollut. Res. 2021, 28, 9542–9557. [Google Scholar] [CrossRef] [PubMed]
- Ulucak, R.; Khan SU, D.; Baloch, M.A.; Li, N. Mitigation pathways toward sustainable development: Is there any trade-off between environmental regulation and carbon emissions reduction? Sustain. Dev. 2020, 28, 813–822. [Google Scholar]
- Ahmad, M.; Zhao, Z.-Y. Empirics on linkages among industrialization, urbanization, energy consumption, CO2 emissions and economic growth: A heterogeneous panel study of China. Environ. Sci. Pollut. Res. 2018, 25, 30617–30632. [Google Scholar] [CrossRef] [PubMed]
- Iheonu, C.O.; Anyanwu, O.C.; Odo, O.K.; Nathaniel, S.P. Does economic growth, international trade, and urbanization uphold environmental sustainability in sub-Saharan Africa? Insights from quantile and causality procedures. Environ. Sci. Pollut. Res. 2021, 28, 28222–28233. [Google Scholar] [CrossRef]
- Grossman, G.M.; Krueger, A.B. The inverted-U: What does it mean? Environ. Dev. Econ. 1996, 1, 119–122. [Google Scholar] [CrossRef]
- Panayotou, T. Empirical Tests and Policy Analysis of Environmental Degradation at Different Stages of Economic Development; International Labour Office: Geneva, Switzerland, 1993. [Google Scholar]
- Shafik, N.; Bandyopadhyay, S. Economic Growth and Environmental Quality: Time-Series and Cross-Country Evidence; World Bank Publications: Washington, DC, USA, 1992; Volume 904. [Google Scholar]
- Suki, N.M.; Sharif, A.; Afshan, S.; Suki, N.M. Revisiting the environmental Kuznets curve in Malaysia: The role of globalization in sustainable environment. J. Clean. Prod. 2020, 264, 121669. [Google Scholar] [CrossRef]
- Murshed, M.; Ali, S.R.; Banerjee, S. Consumption of liquefied petroleum gas and the EKC hypothesis in South Asia: Evidence from cross-sectionally dependent heterogeneous panel data with structural breaks. Energy Ecol. Environ. 2021, 6, 353–377. [Google Scholar] [CrossRef]
- Udemba, E.N. A sustainable study of economic growth and development amidst ecological footprint: New insight from Nigerian Perspective. Sci. Total Environ. 2020, 732, 139270. [Google Scholar] [CrossRef]
- Muhammad, S.; Long, X. Rule of law and CO2 emissions: A comparative analysis across 65 belt and road initiative (BRI) countries. J. Clean. Prod. 2021, 279, 123539. [Google Scholar] [CrossRef]
- Saqib, M.; Benhmad, F. Does ecological footprint matter for the shape of the environmental Kuznets curve? Evidence from European countries. Environ. Sci. Pollut. Res. 2021, 28, 13634–13648. [Google Scholar] [CrossRef] [PubMed]
- Gill, A.R.; Viswanathan, K.K.; Hassan, S. The Environmental Kuznets Curve (EKC) and the environmental problem of the day. Renew. Sustain. Energy Rev. 2018, 81, 1636–1642. [Google Scholar] [CrossRef]
- Baloch, M.A. CO2 emissions in BRICS countries: What role can environmental regulation and financial development play? Clim. Change 2022, 172, 9. [Google Scholar] [CrossRef]
- Isik, C.; Ongan, S.; Ozdemir, D.; Ahmad, M.; Irfan, M.; Alvarado, R.; Ongan, A. The increases and decreases of the environment Kuznets curve (EKC) for 8 OECD countries. Environ. Sci. Pollut. Res. 2021, 28, 28535–28543. [Google Scholar] [CrossRef] [PubMed]
- Pata, U.K.; Caglar, A.E. Investigating the EKC hypothesis with renewable energy consumption, human capital, globalization and trade openness for China: Evidence from augmented ARDL approach with a structural break. Energy 2021, 216, 119220. [Google Scholar] [CrossRef]
- Işık, C.; Ongan, S.; Bulut, U.; Karakaya, S.; Irfan, M.; Alvarado, R.; Ahmad, M.; Rehman, A. Reinvestigating the Environmental Kuznets Curve (EKC) hypothesis by a composite model constructed on the Armey curve hypothesis with government spending for the US States. Environ. Sci. Pollut. Res. 2021, 29, 16472–16483. [Google Scholar] [CrossRef] [PubMed]
- Mehmood, U.; Tariq, S. Globalization and CO2 emissions nexus: Evidence from the EKC hypothesis in South Asian countries. Environ. Sci. Pollut. Res. 2020, 27, 37044–37056. [Google Scholar] [CrossRef]
- Rahman, A.; Murad, S.W.; Ahmad, F.; Wang, X. Evaluating the EKC hypothesis for the BCIM-EC member countries under the belt and road initiative. Sustainability 2020, 12, 1478. [Google Scholar] [CrossRef] [Green Version]
- Destek, M.A.; Sarkodie, S.A. Investigation of environmental Kuznets curve for ecological footprint: The role of energy and financial development. Sci. Total Environ. 2019, 650, 2483–2489. [Google Scholar] [CrossRef]
- Naqvi, S.A.A.; Shah, S.A.R.; Mehdi, M.A. Revealing empirical association among ecological footprints, renewable energy consumption, real income, and financial development: A global perspective. Environ. Sci. Pollut. Res. 2020, 27, 42830–42849. [Google Scholar] [CrossRef]
- Sharma, R.; Sinha, A.; Kautish, P. Does renewable energy consumption reduce ecological footprint? Evidence from eight developing countries of Asia. J. Clean. Prod. 2021, 285, 124867. [Google Scholar] [CrossRef]
- Udemba, E.N.; Agha, C.O. Abatement of pollutant emissions in Nigeria: A task before multinational corporations. Environ. Sci. Pollut. Res. 2020, 27, 26714–26724. [Google Scholar] [CrossRef]
- Ahmed, Z.; Zafar, M.W.; Ali, S. Linking urbanization, human capital, and the ecological footprint in G7 countries: An empirical analysis. Sustain. Cities Soc. 2020, 55, 102064. [Google Scholar] [CrossRef]
- Altıntaş, H.; Kassouri, Y. Is the environmental Kuznets Curve in Europe related to the per-capita ecological footprint or CO2 emissions? Ecol. Indic. 2020, 113, 106187. [Google Scholar] [CrossRef]
- Baz, K.; Xu, D.; Ali, H.; Ali, I.; Khan, I.; Khan, M.M.; Cheng, J. Asymmetric impact of energy consumption and economic growth on ecological footprint: Using asymmetric and non-linear approach. Sci. Total Environ. 2020, 718, 137364. [Google Scholar] [CrossRef]
- Solarin, S.A.; Al-Mulali, U.; Musah, I.; Ozturk, I. Investigating the pollution haven hypothesis in Ghana: An empirical investigation. Energy 2017, 124, 706–719. [Google Scholar] [CrossRef]
- Zafar, M.W.; Zaidi SA, H.; Khan, N.R.; Mirza, F.M.; Hou, F.; Kirmani, S.A.A. The impact of natural resources, human capital, and foreign direct Invest. on the ecological footprint: The case of the United States. Resour. Policy 2019, 63, 101428. [Google Scholar] [CrossRef]
- Muhammad Khan, M.K.; Khan, M.I.; Khan, S. Impact of foreign direct investment, natural resources, renewable energy consumption, and economic growth on environmental degradation: Evidence from BRICS, developing, developed and global countries. Environ. Sci. Pollut. Res. 2021, 28, 21789–21798. [Google Scholar] [CrossRef]
- Khan, A.; Chenggang, Y.; Xue Yi, W.; Hussain, J.; Sicen, L.; Bano, S. Examining the pollution haven, and environmental kuznets hypothesis for ecological footprints: An econometric analysis of China, India, and Pakistan. J. Asia Pac. Econ. 2021, 26, 462–482. [Google Scholar] [CrossRef]
- Murshed, M.; Mahmood, H.; Alkhateeb, T.T.Y.; Banerjee, S. Calibrating the impacts of regional trade integration and renewable energy transition on the sustainability of international inbound tourism demand in South Asia. Sustainability 2020, 12, 8341. [Google Scholar] [CrossRef]
- Erdogan, S.; Okumus, I.; Guzel, A.E. Revisiting the Environmental Kuznets Curve hypothesis in OECD countries: The role of renewable, non-renewable energy, and oil prices. Environ. Sci. Pollut. Res. 2020, 27, 23655–23663. [Google Scholar] [CrossRef] [PubMed]
- Nathaniel, S.; Anyanwu, O.; Shah, M. Renewable energy, urbanization, and ecological footprint in the Middle East and North Africa region. Environ. Sci. Pollut. Res. 2020, 27, 14601–14613. [Google Scholar] [CrossRef] [PubMed]
- Pesaran, M.H. General diagnostic tests for cross section dependence in panels. Empir. Econ. 2021, 60, 13–50. [Google Scholar] [CrossRef]
- Pesaran, M.H.; Yamagata, T. Testing slope homogeneity in large panels. J. Econom. 2008, 142, 50–93. [Google Scholar] [CrossRef] [Green Version]
- Wang Bui, Q.; Zhang, B. The relationship between biomass energy consumption and human development: Empirical evidence from BRICS countries. Energy 2020, 194, 116906. [Google Scholar] [CrossRef]
- Murshed, M.; Dao, N.T.T. Revisiting the CO2 emission-induced EKC hypothesis in South Asia: The role of Export Quality Improvement. GeoJournal 2022, 87, 535–563. [Google Scholar] [CrossRef]
- Pesaran, M.H. A simple panel unit root test in the presence of cross-section dependence. J. Appl. Econom. 2007, 22, 265–312. [Google Scholar] [CrossRef] [Green Version]
- Usman, M.; Makhdum, M.S.A.; Kousar, R. Does financial inclusion, renewable and non-renewable energy utilization accelerate ecological footprints and economic growth? Fresh evidence from 15 highest emitting countries. Sustain. Cities Soc. 2021, 65, 102590. [Google Scholar] [CrossRef]
- Murshed, M. An empirical analysis of the non-linear impacts of ICT-trade openness on renewable energy transition, energy efficiency, clean cooking fuel access and environmental sustainability in South Asia. Environ. Sci. Pollut. Res. 2020, 27, 36254–36281. [Google Scholar] [CrossRef]
- Murshed Md, A.; Alam, M.S.; Ahmad, P.; Dagar, V. The nexus between environmental regulations, economic growth, and environmental sustainability: Linking environmental patents to ecological footprint reduction in South Asia. Environ. Sci. Pollut. Res. 2021, 28, 49967–49988. [Google Scholar] [CrossRef]
- Dumitrescu, E.-I.; Hurlin, C. Testing for Granger non-causality in heterogeneous panels. Econ. Model. 2012, 29, 1450–1460. [Google Scholar] [CrossRef] [Green Version]
- World Bank. World Development Indicators. Retrieved from World Bank (2021). 2020. Available online: https://datatopics.worldbank.org/world-development-indicators/ (accessed on 26 January 2022).
- Khalid, K.; Usman, M.; Mehdi, M.A. The determinants of environmental quality in the SAARC region: A spatial heterogeneous panel data approach. Environ. Sci. Pollut. Res. 2021, 28, 6422–6436. [Google Scholar] [CrossRef] [PubMed]
- Baltagi, B.H.; Pesaran, M.H. Heterogeneity and cross section dependence in panel data models: Theory and applications introduction. J. Appl. Econom. 2007, 22, 229–232. [Google Scholar] [CrossRef]
- Jin, T.; Kim, J. Coal consumption and economic growth: Panel cointegration and causality evidence from OECD and non-OECD countries. Sustainability 2018, 10, 660. [Google Scholar] [CrossRef] [Green Version]
- Kongbuamai, N.; Bui, Q.; Yousaf HM, A.U.; Liu, Y. The impact of tourism and natural resources on the ecological footprint: A case study of ASEAN countries. Environ. Sci. Pollut. Res. 2020, 27, 19251–19264. [Google Scholar] [CrossRef] [PubMed]
- Charfeddine, L.; Mrabet, Z. The impact of economic development and social-political factors on ecological footprint: A panel data analysis for 15 MENA countries. Renew. Sustain. Energy Rev. 2017, 76, 138–154. [Google Scholar] [CrossRef]
- Ali, H.S.; Nathaniel, S.P.; Uzuner, G.; Bekun, F.V.; Sarkodie, S.A. Trivariate modelling of the nexus between electricity consumption, urbanization and economic growth in Nigeria: Fresh insights from Maki Cointegration and causality tests. Heliyon 2020, 6, e03400. [Google Scholar] [CrossRef]
- Ahmad Jiang, P.; Murshed, M.; Shehzad, K.; Akram, R.; Cui, L.; Khan, Z. Modelling the dynamic linkages between eco-innovation, urbanization, economic growth and ecological footprints for G7 countries: Does financial globalization matter? Sustain. Cities Soc. 2021, 70, 102881. [Google Scholar] [CrossRef]
- Sabir, S.; Qayyum, U.; Majeed, T. FDI and environmental degradation: The role of political institutions in South Asian countries. Environ. Sci. Pollut. Res. 2020, 27, 32544–32553. [Google Scholar] [CrossRef]
- Pata, U.K. Renewable energy consumption, urbanization, financial development, income and CO2 emissions in Turkey: Testing EKC hypothesis with structural breaks. J. Clean. Prod. 2018, 187, 770–779. [Google Scholar] [CrossRef]
- Hashmi, R.; Alam, K. Dynamic relationship among environmental regulation, innovation, CO2 emissions, population, and economic growth in OECD countries: A panel investigation. J. Clean. Prod. 2019, 231, 1100–1109. [Google Scholar] [CrossRef]
- Destek, M.A.; Sinha, A. Renewable, non-renewable energy consumption, economic growth, trade openness and ecological footprint: Evidence from organization for economic Cooperation and development countries. J. Clean. Prod. 2020, 242, 118537. [Google Scholar] [CrossRef]
- Zaman, Q.; Wang, Z.; Zaman, S.; Rasool, S.F. Investigating the nexus between education expenditure, female employers, renewable energy consumption and CO2 emission: Evidence from China. J. Clean. Prod. 2021, 312, 127824. [Google Scholar] [CrossRef]
- Wang, J.; Dong, K. What drives environmental degradation? Evidence from 14 Sub-Saharan African countries. Sci. Total Environ. 2019, 656, 165–173. [Google Scholar] [CrossRef]
Figure 1.
Coal consumption (Source: International Energy Agency).

Figure 2.
Environmental Kuznets curve hypothesis.


Table 1.
Variable description and country lists.
| Variable | Definition | Measures | Source |
|---|---|---|---|
| GDP | Economic Growth | US-constant dollar | WDI (2020) |
| Coal Consumption | It excludes only coal converted into liquid or gaseous fuels, but includes coal consumed in transformation processes. | Exajoules | Statistical Review of World Energy |
| FDI | The inflow of foreign direct investment | % of GDP | WDI (2020) |
| TP | Total Population | People | WDI (2020) |
| REN | REN includes wind, solar, and hydro energy | Terawatt-hours | Statistical Review of World Energy |
Note: The countries included in our sample data are Vietnam, Thailand, Sri Lanka, Indonesia, Bangladesh, China, Japan, Pakistan, India, Malaysia, and the Philippines.
Table 2.
Cross-sectional dependency test results.
| Test | Test. Stat | Prob_Value | Decision |
|---|---|---|---|
| Pesaran’s test | 2.107 | 0.035 | CD exists |
| Frees’ test | 0.426 | 0.000 | CD exists |
| Friedman’s test | 57.519 | 0.000 | CD exists |
| CD Test Results (Pesaran 2004) | |||
| Coal | 2.802 | 0.005 | CD exists |
| GDP | 37.715 | 0.000 | CD exists |
| FDI | 2.608 | 0.009 | CD exists |
| TP | 39.127 | 0.000 | CD exists |
| REN | 22.753 | 0.000 | CD exists |
*** = p-value < 0.01, ** = p-value < 0.05, * = p-value < 0.10.
Table 3.
Homogeneity test results.
| Test Stat. | Value | p-Value |
|---|---|---|
| Δ | 8.983 | 0.000 |
| Δadj | 10.163 | 0.000 |
*** = p-value < 0.01, ** = p-value < 0.05, * = p-value < 0.10.
Table 4.
Unit root test results.
| Variables | Level | 1st Difference | Decision | ||
|---|---|---|---|---|---|
| Intercept | Intercept and Trend | Intercept | Intercept and Trend | ||
| Pesaran CADF Test | |||||
| Coal | −1.597 | −2.480 | −2.611 *** | −2.667 * | I(1) |
| GDP | −1.186 | −2.214 | −2.506 *** | −2.885 ** | I(1) |
| GDP2 | −1.027 | −2.241 | −2.487 *** | −2.748 ** | I(1) |
| FDI | −1.319 | −1.412 | −2.410 ** | −2.559 | I(1) |
| TP | −0.877 | −2.224 | −2.141 * | −1.716 | I(1) |
| REN | −1.797 | −1.529 | −3.666 ** | −1.791 | I(1) |
| Pesaran CIPS Test | |||||
| Coal | −2.841 | −3.112 | −5.571 *** | −5.568 *** | I(1) |
| GDP | −2.220 | −2.564 | −4.290 *** | −4.740 *** | I(1) |
| GDP2 | −2.106 | −2.637 | −4.310 *** | −4.636 *** | I(1) |
| FDI | −2.566 | −3.180 | −5.501 *** | −5.590 *** | I(1) |
| TP | −1.774 | −2.838 | −3.118 *** | −2.304 | I(1) |
| REN | −1.848 | −1.583 | −4.876 *** | −5.138 *** | I(1) |
*** = p-value < 0.01, ** = p-value < 0.05, * = p-value < 0.10.
Table 5.
Cointegration test results.
| Pedroni Cointegration Test | Westerlund Cointegration Test | |||||
|---|---|---|---|---|---|---|
| Stat | p-Value | Stat | Value | Z-Value | Robust p-Value | |
| Modified Phillips–Perron t | 1.128 | 0.129 | Gt | −2.305 *** | −0.346 | 0.010 |
| Phillips–Perron t | −3.998 *** | 0.000 | Gα | −0.491 | 4.852 | 0.995 |
| Augmented Dickey–Fuller t | −3.496 *** | 0.000 | Pt | −5.391 *** | 0.695 | 0.045 |
| Pα | −0.916 | 2.968 | 0.530 | |||
*** = p-value < 0.01, ** = p-value < 0.05, * = p-value < 0.10.
Table 6.
Long-run elasticity test results.
| Variable | AMG | CCEMG |
|---|---|---|
| Coefficient | Coefficient | |
| GDP | 3.281 * (1.233) | 5.793 ** (2.729) |
| GDP2 | −0.132 * (0.610) | −0.278 * (0.164) |
| FDI | 0.064 ** (0.029) | 0.005 ** (0.002) |
| TP | 2.578 ** (1.292) | 9.181 ** (4.334) |
| REN | −0.009 *** (0.002) | −0.071 ** (0.030) |
*** = p-value < 0.01, ** = p-value < 0.05, * = p-value < 0.10.
Table 7.
Causality Test Results.
| Null Hypothesis | Z-Bar Stat. | p-Value | Direction |
|---|---|---|---|
| GDP → coal | 5.875 *** | 0.000 | Bidirectional causality b/w coal consumption and GDP for at least one panel |
| coal → GDP | 9.146 *** | 0.000 | |
| FDI → coal | 6.903 *** | 0.000 | Bidirectional causality b/w coal consumption and FDI for at least one panel |
| coal → FDI | 5.343 *** | 0.000 | |
| TP → coal | 7.664 *** | 0.000 | Unidirectional causality b/w coal consumption and TP for at least one panel |
| coal → TP | 13.273 | 0.600 | |
| REN → coal | 8.653 *** | 0.000 | Unidirectional causality b/w coal consumption and REN for at least one panel |
| coal → REN | 8.651 | 0.500 |
*** = p-value < 0.01.
Disclaimer/Publisher’s Note: The statements, opinions and data contained in all publications are solely those of the individual author(s) and contributor(s) and not of MDPI and/or the editor(s). MDPI and/or the editor(s) disclaim responsibility for any injury to people or property resulting from any ideas, methods, instructions or products referred to in the content. |
© 2023 by the authors. Licensee MDPI, Basel, Switzerland. This article is an open access article distributed under the terms and conditions of the Creative Commons Attribution (CC BY) license (https://creativecommons.org/licenses/by/4.0/).
Share and Cite
MDPI and ACS Style
Shahzad, Q.; Aruga, K. Does the Environmental Kuznets Curve Hold for Coal Consumption? Evidence from South and East Asian Countries. Sustainability 2023, 15, 5532. https://0-doi-org.brum.beds.ac.uk/10.3390/su15065532
AMA Style
Shahzad Q, Aruga K. Does the Environmental Kuznets Curve Hold for Coal Consumption? Evidence from South and East Asian Countries. Sustainability. 2023; 15(6):5532. https://0-doi-org.brum.beds.ac.uk/10.3390/su15065532
Chicago/Turabian StyleShahzad, Qaisar, and Kentaka Aruga. 2023. "Does the Environmental Kuznets Curve Hold for Coal Consumption? Evidence from South and East Asian Countries" Sustainability 15, no. 6: 5532. https://0-doi-org.brum.beds.ac.uk/10.3390/su15065532
Note that from the first issue of 2016, this journal uses article numbers instead of page numbers. See further details here.