Article

Capabilities Analysis of Electricity Energy Conservation and Carbon Emissions Reduction in Multi-Level Battery Electric Passenger Vehicle in China

1
Logistics School, Beijing Wuzi University, 321 Fuhe Street, Tongzhou District, Beijing 101126, China
2
Institute for Carbon Peak and Neutrality, Beijing Wuzi University, 321 Fuhe Street, Tongzhou District, Beijing 101126, China
3
Logistics Research Center, Shanghai Maritime University, 1550 Haigang Avenue, Pudong, Shanghai 201306, China
4
E-Business School, Beijing Technology and Business University, No.11 Fucheng Road, Haidian District, Beijing 100048, China
*
Author to whom correspondence should be addressed.
Sustainability 2023, 15(7), 5701; https://0-doi-org.brum.beds.ac.uk/10.3390/su15075701
Submission received: 4 January 2023 / Revised: 20 March 2023 / Accepted: 21 March 2023 / Published: 24 March 2023
(This article belongs to the Special Issue New Trends in Sustainable Supply Chain and Logistics Management)

Abstract

:
The battery electric passenger vehicle (BEPV) has the potential to conserve electric energy and reduce carbon emissions, making it an effective tool for achieving low-carbon development in the road transport industry by replacing the internal combustion engine vehicle (ICEV). Several factors, such as comprehensive electricity power generation efficiency, proportion of thermal power, vehicle technical performance, regional mileage credibility and low temperature, affect the BEPV’s electricity energy consumption and carbon emissions. In this study, an electricity conservation index model and a carbon emission reduction index model for multilevel BEPVs are established to evaluate their capabilities of electricity energy conservation and carbon emissions reduction, considering the electricity supply chain, including the generation and transmission of electricity. The research shows that the electricity energy conservation ability of BEPVs is not outstanding, but their carbon emissions reduction ability is strong. When the composition of energy for electricity generation is transformed from 2025 to 2035, with a 10% increase in comprehensive electricity generation efficiency, all levels of BEPVs show fruitful electricity energy conservation ability. When the proportion of thermal power decreases to 10%, the carbon emissions reduction is exponentially reduced to 1/25 to 1/30 of ICEV’s total carbon emissions. However, the regional mileage credibility weakens the BEPVs’ ability to save energy and reduce emissions in most Chinese provinces except for the southwest and the south regional provinces, where the regional mileage credibility parameter can increase the energy conservation and carbon emission reduction performance of A00+A0 level BEPV. Low temperatures make BEPV models lose their electricity energy conservation advantage, but most models still have the characteristic of carbon emissions reduction. On this basis, the electricity energy consumption and carbon emissions of all BEPV models are higher than those of ICEVs when the low temperature endurance mileage accuracy is added.

1. Introduction

The use of ICEV powered by non-renewable energy sources has led to a dependence on foreign crude oil, which accounts for 70% of China’s total crude oil. The development of new energy vehicles powered by electricity, hydrogen and other renewable energy sources can alleviate the increasingly tense energy crisis [1]. The carbon emissions generated by ICEV contribute to serious environmental issues [2], with ICEVs’ carbon emissions accounting for 7.5% of China’s total carbon emissions [3]. The carbon emissions from ICEVs’ consumption in the use stage account for more than 90% of their total carbon emissions. By contrast, new energy vehicles are characterised by low energy consumption and low carbon emissions throughout their life cycle [4]. Electric vehicles have become a popular alternative in today’s transportation system as they have zero emissions, save energy and reduce pollution [5]. The deployment of electric vehicles is critical importance for promoting the development of energy conservation and emission reduction in the automobile industry.
New energy vehicles are one of the strategic emerging industries in China, which can effectively reduce carbon dioxide and various harmful pollutant emissions and solve the increasingly prominent environmental pollution problems. In accordance with the energy-saving and new energy vehicle technology roadmap 2.0, China’s automobile industry’s carbon emissions to 2035 will be reduced by more than 20% compared with peak emissions. On the basis of the evaluation results of energy saving and emission reduction in new energy vehicles on the national regulatory platform, China’s new energy automobile industry should strengthen the top-level design, promote and apply skills and emission reduction technologies in various dimensions, such as upstream energy links and automobile production links, and improve the overall energy saving and emission reduction in the automobile industry. The specific measures include accelerating the cleanness of vehicle energy structure, enhancing the layout of green products and promoting the lightweight and miniaturisation of vehicles.
The new energy vehicles’ power types in China mainly include the battery electric vehicle, plug-in hybrid vehicle and hydrogen fuel cell vehicle, with battery electric vehicle still dominating the new energy vehicle market [3]. In 2020, the total sales volume of BEPV accounted for 73.1% of the new energy vehicle market, with the top 10 best-selling models selling 544,900 units, accounting for 39.86%. On this basis, BEPV is chosen as the main research object to specifically analyse the electricity energy conservation and carbon emission reduction capabilities of multilevel BEPVs under different scenarios. From another point of view, the comparison between ICEV and BEPV might be expanded, mentioning the scenario of car sharing possibilities [6]. Therefore, the factors that affect BEPVs’ capabilities are explored from the perspective of the energy composition for electricity generation in the upstream and vehicle technical performance in the downstream usage stage.
The major contribution of this study is to analyse the electricity energy conservation and carbon emissions reduction in multilevel BEPVs. The rest of this paper is structured as follows. Section 2 reviews the related literature. Section 3 establishes an electricity conservation index model (ECIM) of BEPV and a carbon emissions reduction index model (CERIM) of BEPV. Section 4 presents the data of our analysis. Section 5 discusses our analytical results, and Section 6 provides the conclusions and some directions for further study.

2. Literature Review

Regarding the research methods of energy consumption and greenhouse gas emissions of new energy vehicles, many scholars have explored the greenhouse gas emissions of pure electric vehicles, plug-in hybrid vehicles and traditional fuel vehicles [7,8]. Research on the influencing factors of energy consumption and greenhouse gas emissions of new energy vehicles reveals that the energy structure of power generation plays a decisive role in carbon emission reduction during the life cycle of electric vehicles [9]. This research aims to optimize the greenhouse gas emissions of new energy vehicles based on the power generation energy structure of different countries and analyse how to improve the market penetration rate and environmental impact of new energy electric vehicles by improving the power generation energy structure [10]. Climate change can cause remarkable fluctuations in the battery capacity of electric vehicles, which can directly affect their maximum mileage and carbon emissions [11]. In China, the marginal cost of long-term carbon emission reduction and concluded that the transition from traditional fuel vehicles to new energy vehicles can achieve carbon emission reduction at a negative cost (net benefit) in China are calculated [12].
Many well-to-wheel (WTW) methods have been employed in the previous literature to investigate the real sustainability effects of electric vehicles and compare them with those of ICEVs [13,14]. Researchers have also utilised the WTW method to evaluate the carbon emission reduction effect brought by deploying battery electric vehicles [15]. On the basis of the WTW method, an indicator is proposed to quantify the actual environmental impact of electric vehicles and capture the carbon dioxide emissions of electricity from production to consumption [16]. The emission reduction effect of SO2 and NOx when using electric vehicles rather than traditional fuel vehicles is revealed by using the WTW model [17]. The WTW method is used to evaluate the carbon emission reduction effect after the promotion of battery electric vehicles in China [18]. It is also used to analyse the influence of a country’s electricity imported from countries with low power carbon intensity and countries with high power carbon intensity on the emission reduction in battery electric vehicles [19]. Compared with ICEVs, factors such as vehicle specific fuel consumption [20] composition of energy for electricity generation [21] and temperature significantly affect the greenhouse gas emissions of battery electric vehicles. The comprehensive impact of these factors will determine whether the transportation industry can successfully decarbonise.
The overall energy conservation and emission reduction performance of battery electric vehicle largely depends on the combination of electric energy consumed in the use stage [22,23]. The proportion of clean energy in the composition of energy for electricity generation has a profound impact on the life-cycle greenhouse gas emissions of battery electric vehicle [24]. The emission reduction capacity of battery electric vehicle are analysed under four charging scenarios and five grid configurations [25]. The result shows that the carbon emissions are highly dependent on the percentage of fossil fuel power generation in the composition of energy for electricity generation. Although the share of renewable energy in Italy and Germany are similar, they do not produce the same carbon emission reduction effect by deploying battery electric vehicle [26].
The number and technology of electric vehicles that need to be promoted should be clarified in order to meet future 2030–2050 greenhouse emission targets [27]. Specific fuel consumption is considered to be the key factor in achieving carbon emission reduction for battery electric vehicles based on market data in 2018 and scenario forecasts in 2030 [28]. The relationship between endurance mileage, air conditioning system energy consumption and total electricity consumption is explored to understand the law of battery electric vehicle’s energy conservation and emission reduction [29]. Dynamic wireless power transmission (DWPT) technology promotes the popularization of battery electric vehicles and helps reduce air pollution [30]. The impact of energy management strategies of charging technology on energy conservation and emission reduction in battery electric vehicle is studied. Whether the transportation industry can successfully decarbonise through the deployment of battery electric vehicle depends on the comprehensive influence of power grid combination, vehicle specific fuel consumption, vehicle technical performance and other factors [31].
The above literature suggests that BEPVs do not emit carbon during driving and are considered to have remarkable potential for energy conservation and emission reduction. However, the electricity generation and transmission in the electricity supply chain are important sources of carbon emissions. From the perspective of the fuel whole life cycle, the electricity consumption per 100 km and carbon emissions per 10,000 km of all levels of BEPVs are analysed. Then, the electricity energy conservation and carbon emissions reduction capabilities of BEPVs are compared with the same level ICEVs. The forecast for BEPVs’ electricity energy conservation and carbon emissions reduction in 2025, 2030 and 2035 is based on the improvement of Chinese composition of energy for electricity generation and BEV’s technology. BEPVs face problems, such as a remarkable reduction in the endurance mileage and the mileage accuracy, due to the negative impact of vehicle technical performance barriers. The influence rule of mileage credibility on BEPVs’ electricity energy consumption and carbon emissions in seven regional provinces of China is investigated. The low temperature endurance mileage accuracy parameters of mainstream BEPV models in the market are the input variables used to quantitatively analyse BEPVs’ electricity energy consumption and carbon emissions.

3. Model

3.1. Basic Model

Figure 1 show the methodological framework for the BEPVs WTW analysis. The main research objective is to study the energy consumption and greenhouse gas emissions throughout the whole fuel cycle of BEPVs. The fuel cycle includes two stages: well to pump (WTP) and pump to wheels (PTW), which together make up WTW. For ICEVs, WTP includes crude oil extraction, refining and transportation processes. For BEPV, the WTP stage includes the production and transmission of electricity (thermal power, hydropower, wind power, photovoltaic power generation and nuclear power, etc.).
The electricity energy conservation effect of BEPVs compared with ICEVs is calculated by comprehensively considering the electricity energy consumption per 100 km of BEPVs during the operation stage and electricity production loss caused by electricity production and transmission in the upstream electricity energy link. Although BEPVs do not produce carbon emissions during the vehicle operation stage, the upstream energy link is also an important part of its life cycle carbon emissions. The upstream electricity energy carbon emissions of BEPVs are calculated to analyse the BEPVs’ carbon emissions reduction effect compared with ICEVs of the same level.

3.1.1. Electricity Conservation Index Model (ECIM) of BEPV

The ECIM of BEPVs is established by using the WTW method to evaluate the electricity energy consumption of BEPVs with different levels, denoted by η y , i . When the η y , i value is 100%, the electricity energy consumption of BEPV is equal to that of ICEV which has the same level as BEPV. The larger the η y , i value, the better the energy saving effect. The ECIM calculation formula is as follows.
η y , i = β c f v , y WTW β b e v , y , i WTW × 100 %
BEPV directly consumes electricity during driving, in addition, there will be some losses at the electricity generation and transmission in electricity supply chain. The concept of BEPVs’ electricity energy consumption per 100 km from the perspective of fuel whole life cycle is introduced to account for the total energy consumption of BEPVs, including direct and indirect energy consumption. This concept considers the energy losses during fuel extraction, generation and transmission, and is expressed as β b e v , y , i WTW (unit: kW · h / 100   km ). Similarly, the electricity consumption per 100 km of level y ICEV when the whole fuel life cycle is considered is represented as β c f v , y WTW (unit: kW · h / 100   km ).

3.1.2. From Perspective of the Fuel Whole Life Cycle, BEPVs’ Electricity Energy Consumption per 100 km

From perspective of the fuel whole life cycle, BEPVs’ electricity energy consumption per 100 km is modeled. β b e v , y , i , 0 refers to the official electricity energy consumption per 100 km of type i level y BEPV (unit: kW · h / 100   km ). γ b e v , WT indicates the utilization efficiency of electricity from generation to usage. b c y , i , 0 represents the official battery energy capacity of type i level y BEPV (unit: kW · h ). m y , i , 0 is the standard mileage of type i level y BEPV (unit: km ). γ total is the comprehensive electricity generation efficiency. γ transfer is the electricity transmission efficiency. t k is the total electricity generation efficiency of type k energy. z k is the proportion of electricity generated by type k energy.
β b e v , y , i WTW = β b e v , y , i , 0 γ b e v , WT
β b e v , y , i , 0 = b c y , i , 0 m y , i , 0 × 100
γ b e v , WT = γ total × γ transfer
γ total = k t k z k

3.1.3. From Perspective of the Fuel Whole Life Cycle, ICEVs Energy Consumption per 100 km

From perspective of the fuel whole life cycle, ICEVs energy consumption per 100 km is calculated. β c f v , y , 0 denotes the electricity consumption per 100 km of level y ICEV (unit: kW · h / 100   km ). β c f v , y denotes the official gasoline consumption per 100 km of level y ICEV (unit: L / 100   km ). ρ f represents the gasoline density, which is 0.75 kg / L . q f and q e represent the thermal power generation efficiency of gasoline and electricity, respectively, which are 4.6 × 10 7   J / kg and 3.6 × 10 7   J / kg . γ c f v , WT indicates the fuel utilization efficiency from the oil well to the car fuel tank, γ g p from crude oil exploitation to gasoline refining; the value is 21.5%. γ g t is the efficiency of gasoline transportation, which is 97%.
β c f v , y WTW = β c f v , y , 0 γ c f v , WT
β c f v , y , 0 = β c f v , y × ρ f × q f q e
γ c f v , WT = γ g p × γ g t

3.1.4. Carbon Emissions Reduction Index Model (CERIM) of BEPV

The CERIM is measured BEPVs’ carbon emissions reduction potential. The CERIM for all type i level y BEPV is expressed in c y , i , and the calculation formulation is as follows. c b e v , y , i is the concept of type i level y BEPVs carbon emissions per 10,000 km. c c v , y represents the carbon emissions per 10,000 km of level y ICEV.
c y , i = c c v , y c b e v , y , i × 100 %

3.1.5. Carbon Emissions Model per 10,000 km of BEPV

From the perspective of the fuel whole life cycle, BEPVs do not directly emit carbon during the driving process, but the generation and transmission of electricity to power them release carbon. Therefore, the carbon emissions of BEPVs are explored. In this regard, hydrogen electric generation, wind electric generation and other renewable electric generation modes are ignored because they do not produce carbon emissions. Thermal power electric generation is identified as the principal source of carbon emissions from BEPVs during driving. The calculation formula for BEPVs’ carbon emissions per 10,000 km is as follows.
c b e v , y , i = b c y , i , 0 × 10,000 × z th m y , i , 0 × γ t r a n f e r × k = 1 2 q k × f k × c k 1 + c k 2 γ k , e × γ k , t
where z th represents the proportion of thermal power, 70.4%, 69.8% and 69.4% in 2018, 2019 and 2020, respectively. q k indicates the proportion of coal and natural gas electric generation in thermal power, which is 94.5% and 5.5% in 2018, respectively, 94.1% and 5.9% in 2019, respectively, and 93.8% and 6.2% in 2020, respectively. f k refers to the amount of coal and natural gas required to produce per kilowatt-hour electricity, coal is 0.326   kg / ( kW · h ) and natural gas is 0.312   kg / ( kW · h ) . c k 1 and c k 2 indicate carbon emissions per unit fuel combustion and production, respectively: coal is 3.06 and 0.012, natural gas is 1.87 and 0.002. γ k , e and γ k , t are the efficiency of exploitation and transportation, which is 97% and 99% for coal, and 94.5% and 89% for natural gas, respectively.

3.1.6. Carbon Emissions Model per 10,000 km of ICEV

The calculation formulation of carbon emissions per 10,000 km of level y ICEV is as follows.
C c v , y = 100 × β c v , y × c f 1 + c f 2 / γ g t
c f 1 and c f 2 are the carbon emissions of combusting and producing 1 L gasoline, which are 2.49 kg/L and 0.15 kg/L, respectively.

3.2. Influence Factor

3.2.1. Mileage Credibility of BEPV

The mileage credibility refers to the consistency between the official endurance mileage and the actual endurance mileage. The closer the mileage credibility is to 1, the higher the credibility of the BEPVs’ actual endurance mileage. The significance of introducing mileage credibility is to comprehensively measure the endurance mileage performance of different vehicle types in different regions. The actual electricity energy consumption and carbon emissions reduction capabilities of BEPVs in a real driving environment are determined on the basis of mileage credibility.
φ y , i = m y , i m y , i , 0
β b e v , y , i , 1 = b c y , i , 0 m y , i × 100
β b e v , y , i WTW , 1 = β b e v , y , i , 1 γ b e v , WT = b c y , i , 0 × 100 m y , i , 0 × φ y , i × γ b e v , WT
η 1 = β c f v , y WTW β b e v , y , i WTW , 1 × 100 %
c b e v , y , i , 1 = b c y , i , 0 × 10,000 × z t h m y , i , 0 × φ y , i × γ t r a n f e r × k = 1 2 q k × f k × ( c k 1 + c k 2 ) γ k , e × γ k , t
c y , i , 1 = c c v , y c b e v , y , i , 1 × 100 %
φ y , i indicates the mileage credibility parameter of level y type i BEPV. m y , i is the actual endurance mileage of level y type i BEPV. β b e v , y , i , 1 is the actual electricity energy consumption per 100 km of level y type i BEPV considering mileage credibility. β b e v , y , i WTW , 1 is level y type i BEPV’s electricity energy consumption per 100 km from the perspective of the fuel whole life cycle considering mileage credibility. c b e v , y , i , 1 is the carbon emissions of level y type i BEPV considering mileage credibility. η 1 is the ECIM value considering mileage credibility. c y , i , 1 is the CERIM value of level y type i BEPV considering mileage credibility.

3.2.2. Regional Mileage Credibility

Regional mileage credibility is introduced to measure the actual electricity consumption and carbon emissions of all levels BEPVs in China’s seven regional provinces.
φ y , i , z = m y , i , z m y , i , 0
β b e v , y , i , 2 = b c y , i , 0 m y , i , z × 100
β b e v , y , i WTW , 2 = β b e v , y , i , 2 γ b e v , WT = b c y , i , 0 × 100 m y , i , 0 × φ y , i , z × γ b e v , WT
η 2 = β c f v , y WTW β b e v , y , i WTW , 2 × 100 %
c b e v , y , i , 2 = b c y , i , 0 × 10,000 × z t h m y , i , 0 × φ y , i , z × γ t r a n f e r × k = 1 2 q k × f k × ( c k 1 + c k 2 ) γ k , e × γ k , t
c y , i , 2 = c c v , y c b e v , y , i , 2 × 100 %
φ y , i , z refers to the mileage credibility parameter of level y type i BEPV in China z region. m y , i , z is the actual endurance mileage of level y type i BEPV in China z region. β b e v , y , i , 2 is actual electricity energy consumption per 100 km of level y type i BPEV considering regional mileage credibility. β b e v , y , i WTW , 2 is level y type i BPEVs electricity energy consumption per 100 km from the perspective of fuel whole life cycle considering regional mileage credibility. c b e v , y , i , 2 is carbon emissions of of level y type i BEPV considering regional mileage credibility. η 2 is the ECIM value of level y type i BEPV considering regional mileage credibility. c y , i , 2 is CERIM value of level y type i BEPV considering regional mileage credibility.

3.2.3. Low Temperature

Affected by the low temperature weather in winter, the BEPVs’ endurance mileage is sharply shortened, and the accuracy of endurance mileage estimation is reduced, making the BEPVs’ electricity consumption and carbon emissions uncertain. In this section, the low temperature endurance mileage influence parameter is introduced to explore the influence rule of low temperature environment on electricity energy conservation and carbon emissions reduction in level y type i BEPV.
m y , i , t = m y , i , 0 × τ y , i , t
β b e v , y , i , 3 = b c y , i , 0 m y , i , t × 100
β b e v , y , i WTW , 3 = β b e v , y , i , 3 γ b e v , WT = b c y , i , 0 × 100 m y , i , 0 × τ y , i , t × γ b e v , WT
η 3 = β c f v , y WTW β b e v , y , i WTW , 3 × 100 %
c b e v , y , i , 3 = b c y , i , 0 × 10,000 × z t h m y , i , 0 × τ y , i , t × γ t r a n f e r × k = 1 2 q k × f k × ( c k 1 + c k 2 ) γ k , e × γ k , t
c y , i , 3 = c c v , y c b e v , y , i , 3 × 100 %
m y , i , t refers to the endurance mileage displayed on the instrument of level y type i BEPVs at t °C. τ y , i , t is low temperature endurance mileage influence coefficient of level y type i BEPV at t °C. β b e v , y , i , 3 is actual electric energy consumption per 100 km of level y type i BPEV at t °C. β b e v , y , i WTW , 3 is level y type i BPEVs’ electricity energy consumption per 100 km at t °C from the perspective of fuel whole life cycle. c b e v , y , i , 3 is carbon emissions of level y type i BEPV in low temperature. η 3 is the ECIM of BEPV value in low temperature. c y , i , 3 is the CERIM value of level y type i BEPV in low temperature.

3.2.4. Low Temperature Endurance Mileage Accuracy

The low temperature environment will produce negative effects such as the deviation between the endurance mileage displayed on the instrument and the actual endurance mileage. Therefore, the low temperature endurance mileage accuracy parameter is introduced to reflect the deviation degree between the endurance mileage displayed on the instrument and the actual endurance mileage. The closer the evaluation result is to 1, the higher the estimation accuracy of endurance mileage.
m y , i , t , 1 = m y , i , 0 × τ y , i , t × ϖ y , i , t
β b e v , y , i , 4 = b c y , i , 0 m y , i , t , 1 × 100
β b e v , y , i WTW , 4 = β b e v , y , i , 4 γ b e v , WT = b c y , i , 0 × 100 m y , i , 0 × τ y , i , t × ϖ y , i , t × γ b e v , WT
η 4 = β c f v , y WTW β b e v , y , i WTW , 4 × 100 %
c b e v , y , i , 4 = b c y , i , 0 × 10,000 × z t h m y , i , 0 × τ y , i , t × ϖ y , i , t × γ t r a n f e r × k = 1 2 q k × f k × ( c k 1 + c k 2 ) γ k , e × γ k , t
c y , i , 4 = c c v , y c b e v , y , i , 4 × 100 %
m y , i , t , 1 refers to the endurance mileage displayed on the instrument of level y type i BEPV at t °C when the low temperature endurance mileage accuracy is considered. ϖ y , i , t is the low temperature endurance mileage accuracy parameter of level y type i BEPV at t °C. β b e v , y , i , 4 is actual electricity energy consumption per 100 km of level y type i BPEV. β b e v , y , i WTW , 4 is level y type i BPEVs electricity energy consumption per 100 km at t °C from the perspective of the fuel whole life cycle when the low temperature endurance mileage accuracy is considered. c b e v , y , i , 4 is carbon emissions of level y type i BEPV when the low temperature endurance mileage accuracy is considered. η 4 is the level y type i BEPVs ECIM of value when the low temperature endurance mileage accuracy is considered. c y , i , 4 is the CERIM value of level y type i BEPV when the low temperature endurance mileage accuracy is considered.

4. Data

The actual electricity energy consumption per 100 km of BEPV is declining year by year. The average electricity energy consumption per 100 km of A00+A0 entry-level BEPV, A level universal BEPV and B level high-end BEPV from 2018 to 2020, and the average electricity energy consumption per 100 km of all level BEPVs in 2025, 2030 and 2035 specified in the Technical Roadmap of Energy Saving and New Energy Vehicles 2.0 are shown in Table 1 [32]. The electricity energy conservation and carbon emissions reduction effect of BEPV is not only related to vehicle performance, but also related to generation and transmission efficiency of electricity. In the composition of energy for electricity generation, the numerical values of comprehensive electricity generation and transmission efficiency from 2018 to 2020 are shown in Table 2 [32].
Table 3 [32] shows the average gasoline consumption per 100 km of ICEV in 2018, 2019 and 2020. In view of the energy conservation technology promotion of ICEV, the average gasoline consumption per 100 km of ICEV will reach 5.6 L / 100   km in 2025, 4.8 L / 100   km in 2030 and 4 L / 100   km in 2035. The endurance mileage credibility data of BEPV with good performance are shown in Table 4 [32]. Meanwhile, the numerical values of BEPVs’ endurance mileage credibility in Chinese seven regions are shown in Table 5 [32].
The standard endurance mileage of BEPV is taken as the reference object to explore the influence rule of low temperature environment on the BEPVs capability of energy conservation and carbon emissions reduction. The actual endurance mileage of BEPV in low temperature environment decreased significantly compared with the standard endurance mileage, with the average decline rate of 41.21%, the lowest rate of 25.82% and the highest rate of 62.17%. The low temperature endurance mileage decline rate data and relevant data of A00+A0 level BEPV are shown in Table 6 [33], and the corresponding data of A level and B level BEPV are shown in Table 7 [33].
In view of the fact that the endurance mileage of A00+A0 level BEPV has been seriously affected when only the low temperature factor is listed as major considerations, six types of A level and two types of B level BEPV with outstanding performance characteristics are selected to discover the impact of low temperature endurance mileage accuracy on the BEPVs’ electricity energy conservation and carbon emissions reduction. The average low temperature endurance mileage accuracy values of the BEPV is 0.45, which leads to significant decreases in its actual endurance mileage data. The low temperature endurance mileage accuracy data of BEPV and other relevant data are shown in Table 8 [33].

5. Case Analysis

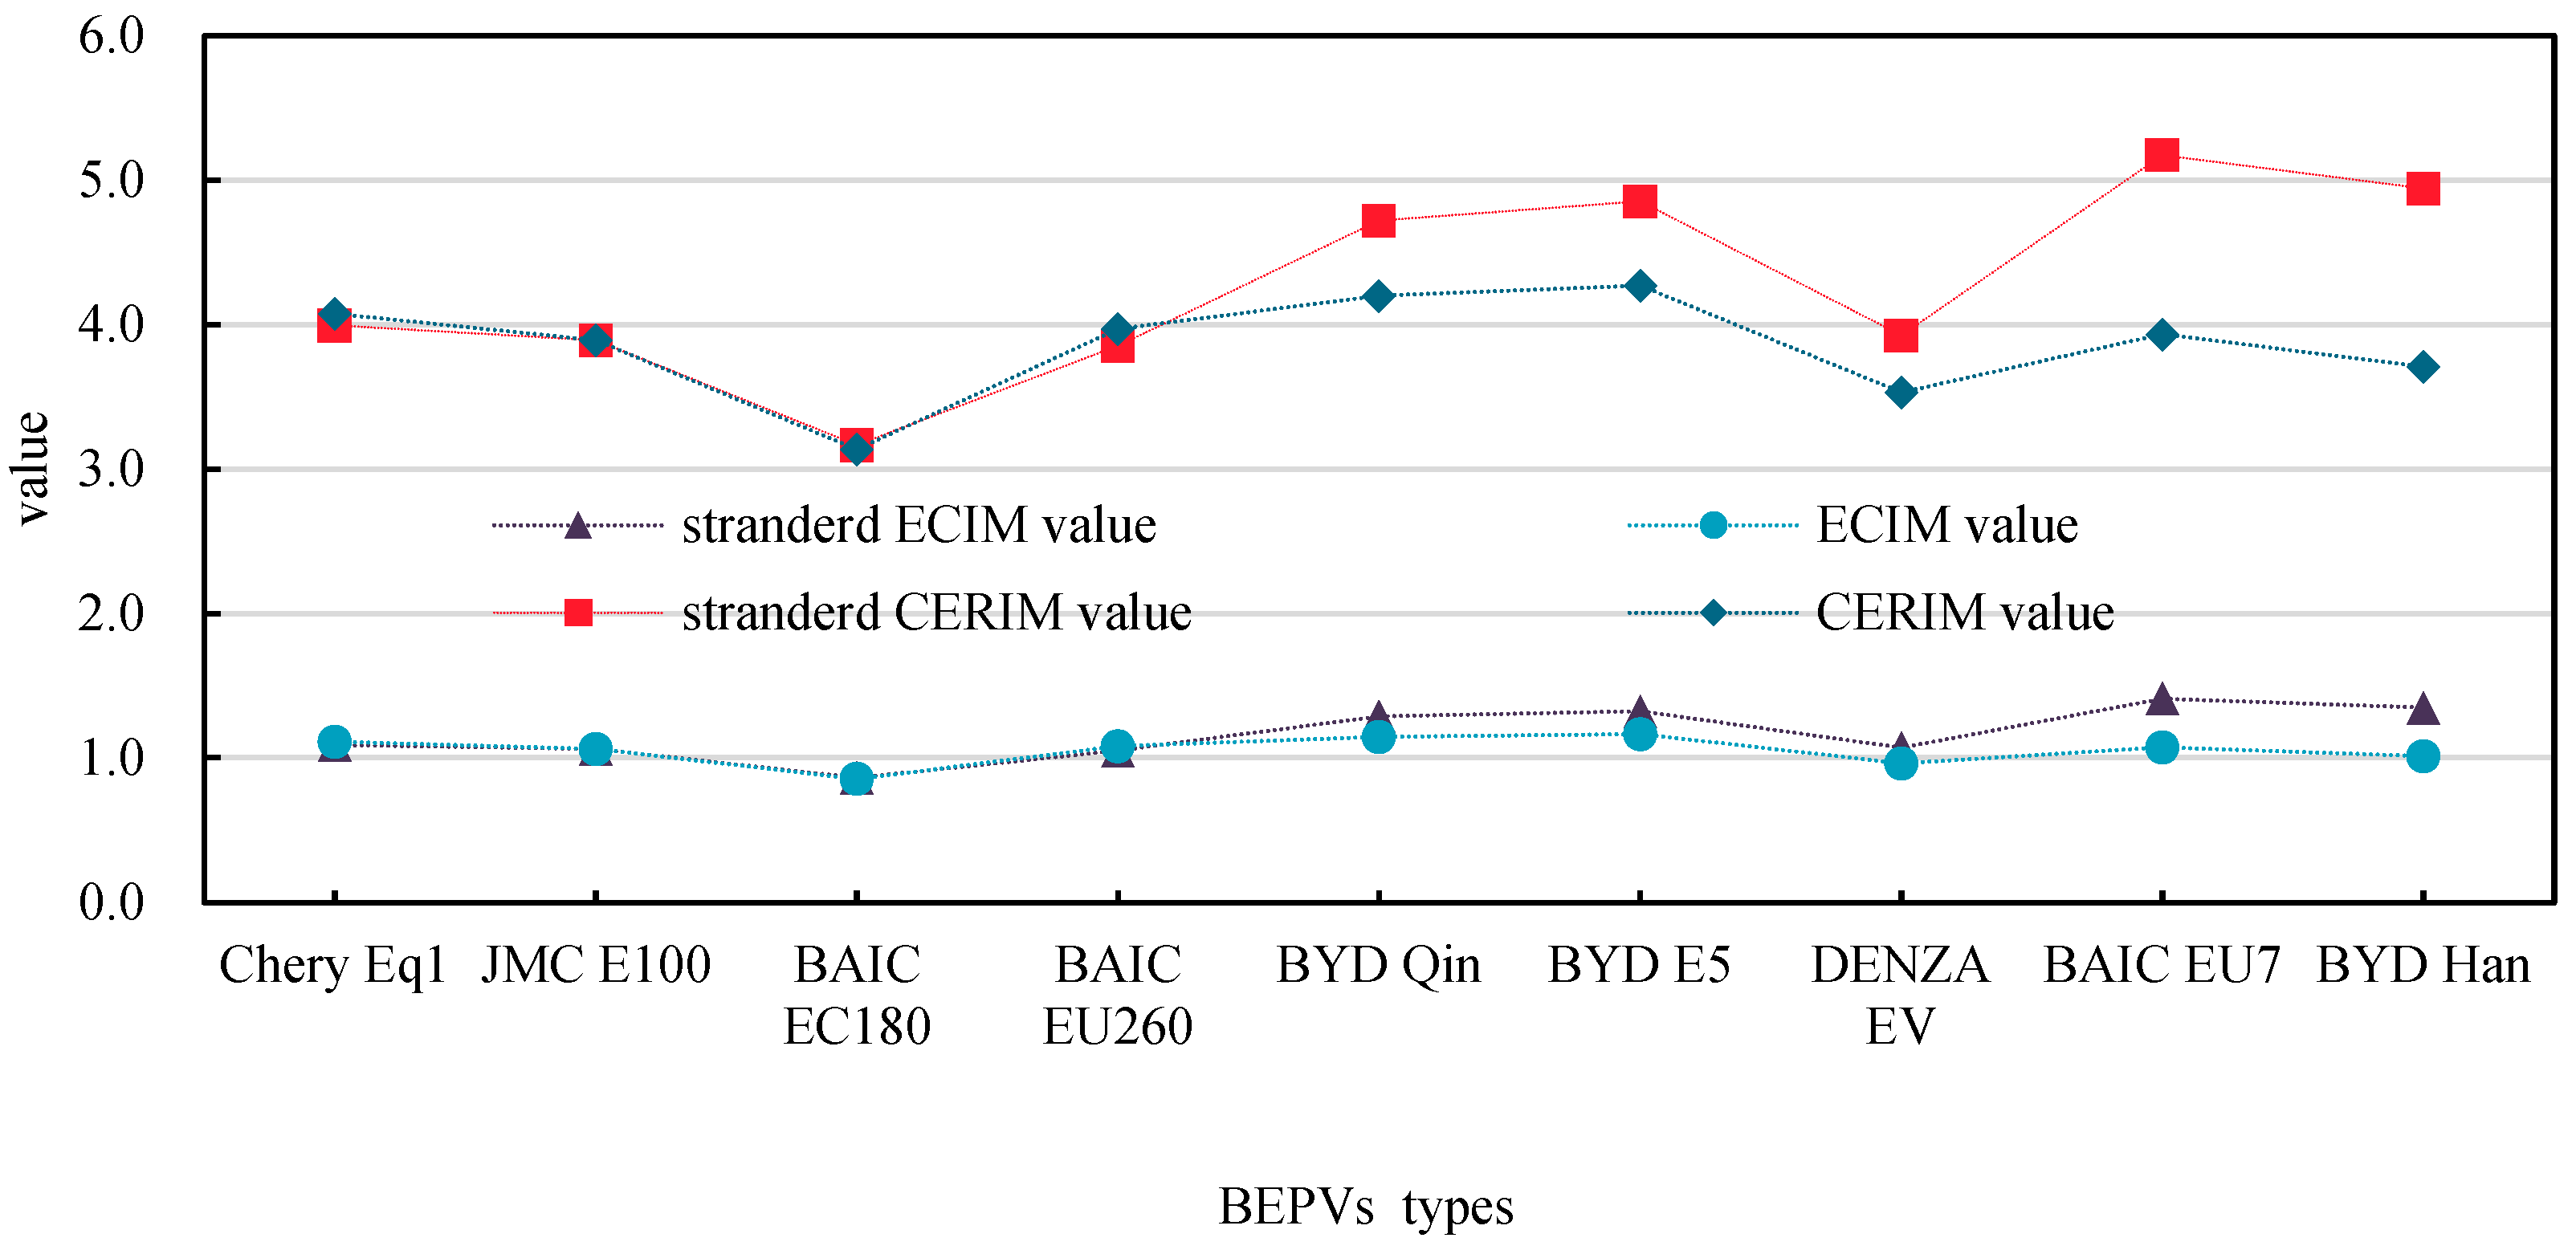
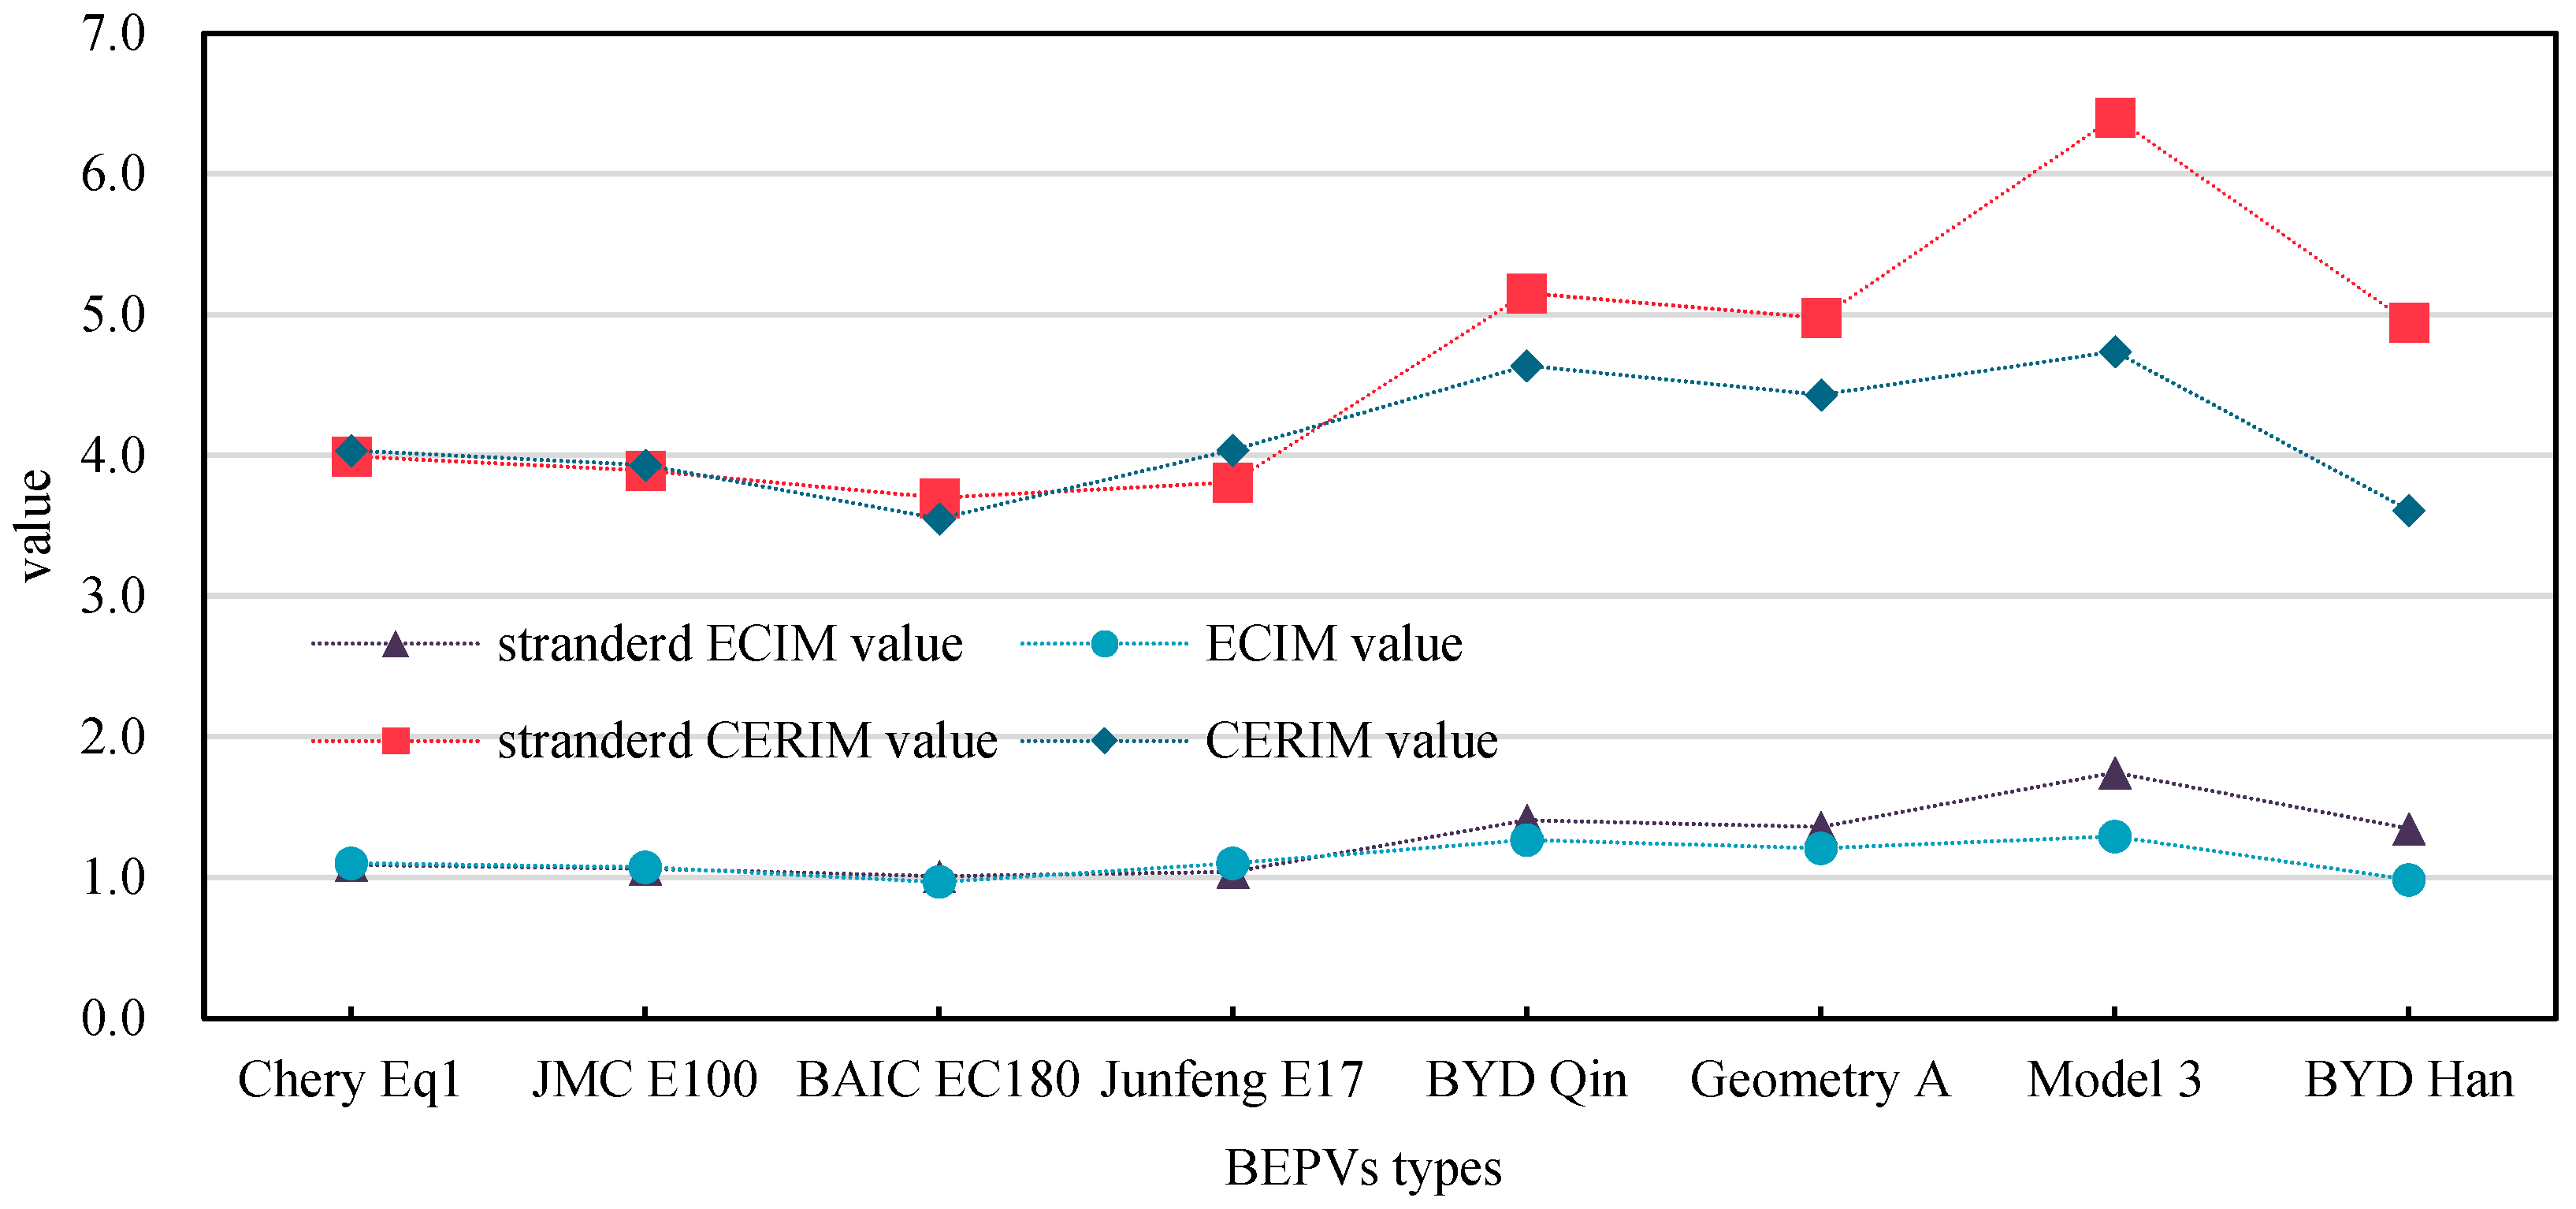
5.1. Analysis of All Levels BEPVs’ ECIM and CERIM Values

Figure 2 shows the BEPVs’ average electricity energy conservation per 100 km of all levels of BEPVs. The average ECIM values of B level high-end BEPV in 2018 and 2019 are lower than one, indicating that their electricity energy consumption is higher than that of ICEV. With the continuous improvement of energy-saving technology performance, the electricity energy consumption of B level high-end BEPV is significantly lower than that of ICEV in 2020. However, the average ECIM values of A00+A0 entry-level and A level universal BEPVs fluctuated to a certain extent from 2018 to 2020, with values greater than or equal to one, showing an obvious electricity energy saving effect. Figure 3 shows that the average carbon emissions per 10,000 km of all levels of BEPVs from 2018 to 2020 are smaller than those of ICEVs from the perspective of the fuel whole life cycle, indicating the excellent carbon emissions reduction ability of BEPVs (Appendix A).

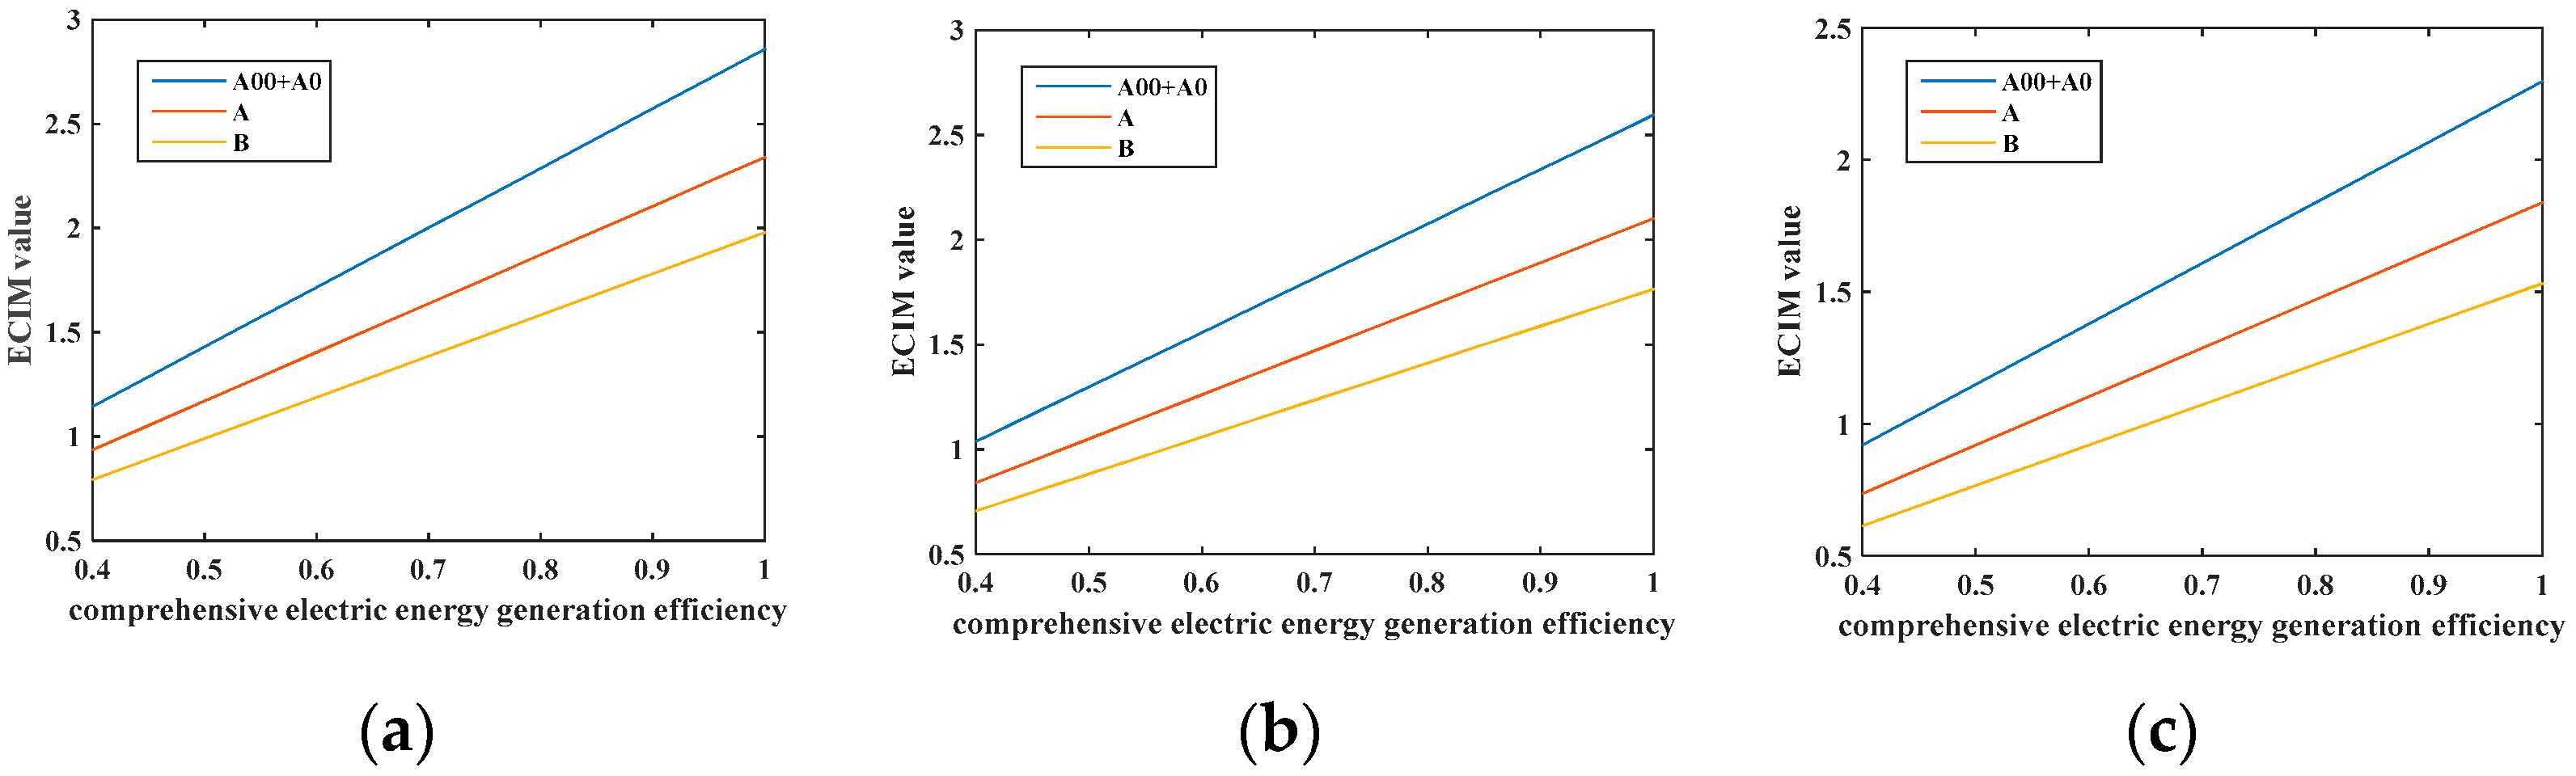
5.2. Forecast All Levels BEPVs’ Average Electricity Energy Conservation and Carbon Emissions Reduction Capability in 2025, 2030 and 2035

Figure 4 shows that in accordance with the analysis of the capability of all levels of BEPVs in 2025, the comprehensive electricity energy generation efficiency is increased by 10% on the original basis from the perspective of the fuel whole life cycle, and all levels of BEPVs have energy conservation characteristics compared with ICEVs. In 2030, considering the enhancement of ICEVs’ energy conservation technology, the comprehensive electricity generation efficiency will need to be increased by 20–25% on the original basis to make the ECIM values of A level and B level BEPVs greater than one. When renewable energy sources with high comprehensive electricity generation efficiency dominate the composition of energy for electricity generation, the electricity energy consumption of BEPVs will be reduced to one-third to one-half of that of ICEVs. Therefore, vigorously developing renewable energy generation to reduce the energy consumption of non-renewable fossil fuels is one of the reliable ways to highlight the BEPVs’ electricity energy conservation.
In Figure 5, on the basis of the current proportion of thermal power generation, the carbon emissions reduction capability of BEVPs in 2025, 2030 and 2035 is superior to those of ICEVs with weak advantages. When the proportion of thermal power drops to less than 40% in composition of energy for electricity generation, all levels of BEPVs emissions reduction capacity highlight will emerge. When the proportion of thermal power droops to less than 15%, all levels of BEPVs CERIM values begin to show exponential growth. The carbon emission reduction capacity of all levels of BEPVs has an order of magnitude breakthrough. Substituting BEPV for ICEV will bring approximately 30 times the emission reduction benefits. Therefore, BEPVs can be deployed in Yunnan, Guizhou, Sichuan and other southwest provinces where clean electricity energy proportion accounts for more than 80% to achieve a strong emission reduction effect, promoting green development of the road transportation industry.

5.3. The Impact of Mileage Credibility on BEPVs’ Electricity Energy Conservation and Carbon Emission Reduction Capability

In this section, three types with high sales volume at each level are selected to conduct mileage credibility research on the electricity energy conservation and carbon emissions reduction capability of BEPVs. In Figure 6, the higher the BEPVs’ level, the more remarkable the negative impact of mileage credibility on their energy conservation performance. For A00+A0 level BEPVs, mileage credibility has a small impact on them. For A level BEPVs, perhaps the mileage credibility may reduce their ECIM values, but their electricity energy consumption is still lower than those of ICEVs. Although mileage credibility sharply reduces the ECIM values of B level BEPVs, the electricity energy consumption of all B level BEPVs types is less than or similar to that of ICEVs. In particular, for some A00+A0 level and A level BEPVs types, mileage credibility will make their energy conservation performance become more excellent. In Figure 6, when mileage credibility is taken as a key measurement factor, although the CERIM value decreases, the carbon emissions per 10,000 km of all levels of BEPVs types are still fall far below those of ICEVs due to their obvious emission reduction property.

5.4. The Impact of Regional Mileage Credibility on BEPVs’ Electricity Energy Conservation and Carbon Emissions Reduction Capability

In Figure 7, Figure 8, Figure 9, Figure 10, Figure 11, Figure 12 and Figure 13, the impact of regional mileage credibility on the electricity energy conservation and carbon emission reduction capability of BEPVs in seven regions of China is investigated. In Figure 7, the electricity energy conservation capability of A00+A0 level and A level BEPVs in northern Chinese region provinces is less affected by the regional mileage credibility, whereas for some B-level BEPVs, such as Denza EV, their electricity energy consumption per 100 km is higher than that of ICEVs, and their capability is strongly affected by regional mileage credibility from the perspective of fuel whole life cycle. However, the carbon emissions reduction capability of all levels of BEPVs is not remarkably impacted by regional mileage credibility.
In Figure 8, the electricity energy conservation and carbon emissions reduction capabilities of A00+A0 level BEPVs in eastern Chinese regions are weakly affected by regional mileage credibility, whereas the capabilities of A level BEPVs are greatly affected by regional mileage credibility, making BAIC EU5′s electricity energy consumption higher than that of ICEV with the same level. For B level BEPVs, the regional mileage credibility leads to their electricity energy consumption becoming close to or greater than that of ICEVs although they have strong energy-saving advantages.
In Figure 9, the influence of regional mileage credibility on all levels of BEPVs in southern Chinese region provinces follows similar patterns, where higher level BEPVs are more negatively impacted by regional mileage credibility. Specifically, the negatively influential degree is weaker than that of the above two regions provinces. Compared with other regions, the capabilities of A00+A0 level BEPVs are enhanced when the regional mileage credibility factor is taken into account, whereas A-level BEPVs are less affected. The carbon emissions reduction ability of B-level BEPVs is less affected by regional mileage credibility, but their electricity energy conservation ability is greatly reduced. For instance, the electricity energy consumption of Denza EV becomes higher than that of ICEV.
In Figure 10, the positive impact of regional mileage credibility on BEPVs’ electricity energy conservation and carbon emission reduction in central Chinese regional provinces has been extended to some A-level BEPVs. The electricity energy conservation performance of Junfeng E17 is enhanced, making it more prominent than that of ICEV. Similarly, the electricity energy conservation and carbon emission reduction capabilities of B Level BEPVs are negatively affected by the regional mileage credibility, which reduces the efficiency of BYD HanEV‘s electricity energy conservation efficiency from the original approximately 40% higher than that of ICEVs to being equal, causing BEPVs’ energy consumption to increase remarkably.
As shown in Figure 11, the regional mileage credibility can increase the electricity energy conservation and carbon emissions reduction capability of A00+A0 level and A level BEPVs with better performance in southwest China. For some types of A level BEPVs, the regional mileage credibility reduces the ECIM and CERIM values, but the decline is small which their capability is still more obvious than those of ICEV. The regional mileage credibility has a small negative impact on B-level BEPVs because they have not been widely promoted.
As shown in Figure 12, for A00+A0 level BEPV in northwest Chinese region provinces, their electricity energy conservation effectiveness is the same as that of ICEVs when the regional mileage credibility is considered. However, the electricity energy consumption for some A-level BEPVs is higher than those of ICEVs at the same level. In Figure 13, under standard conditions, the electricity energy conservation effectiveness of A level BEPV in northeast Chinese region provinces is about 1.3 times that of ICEVs under standard conditions. When the regional mileage credibility is taken as the main consideration factor, the electricity energy conservation capability of the latter two types is the same as those of ICEVs.

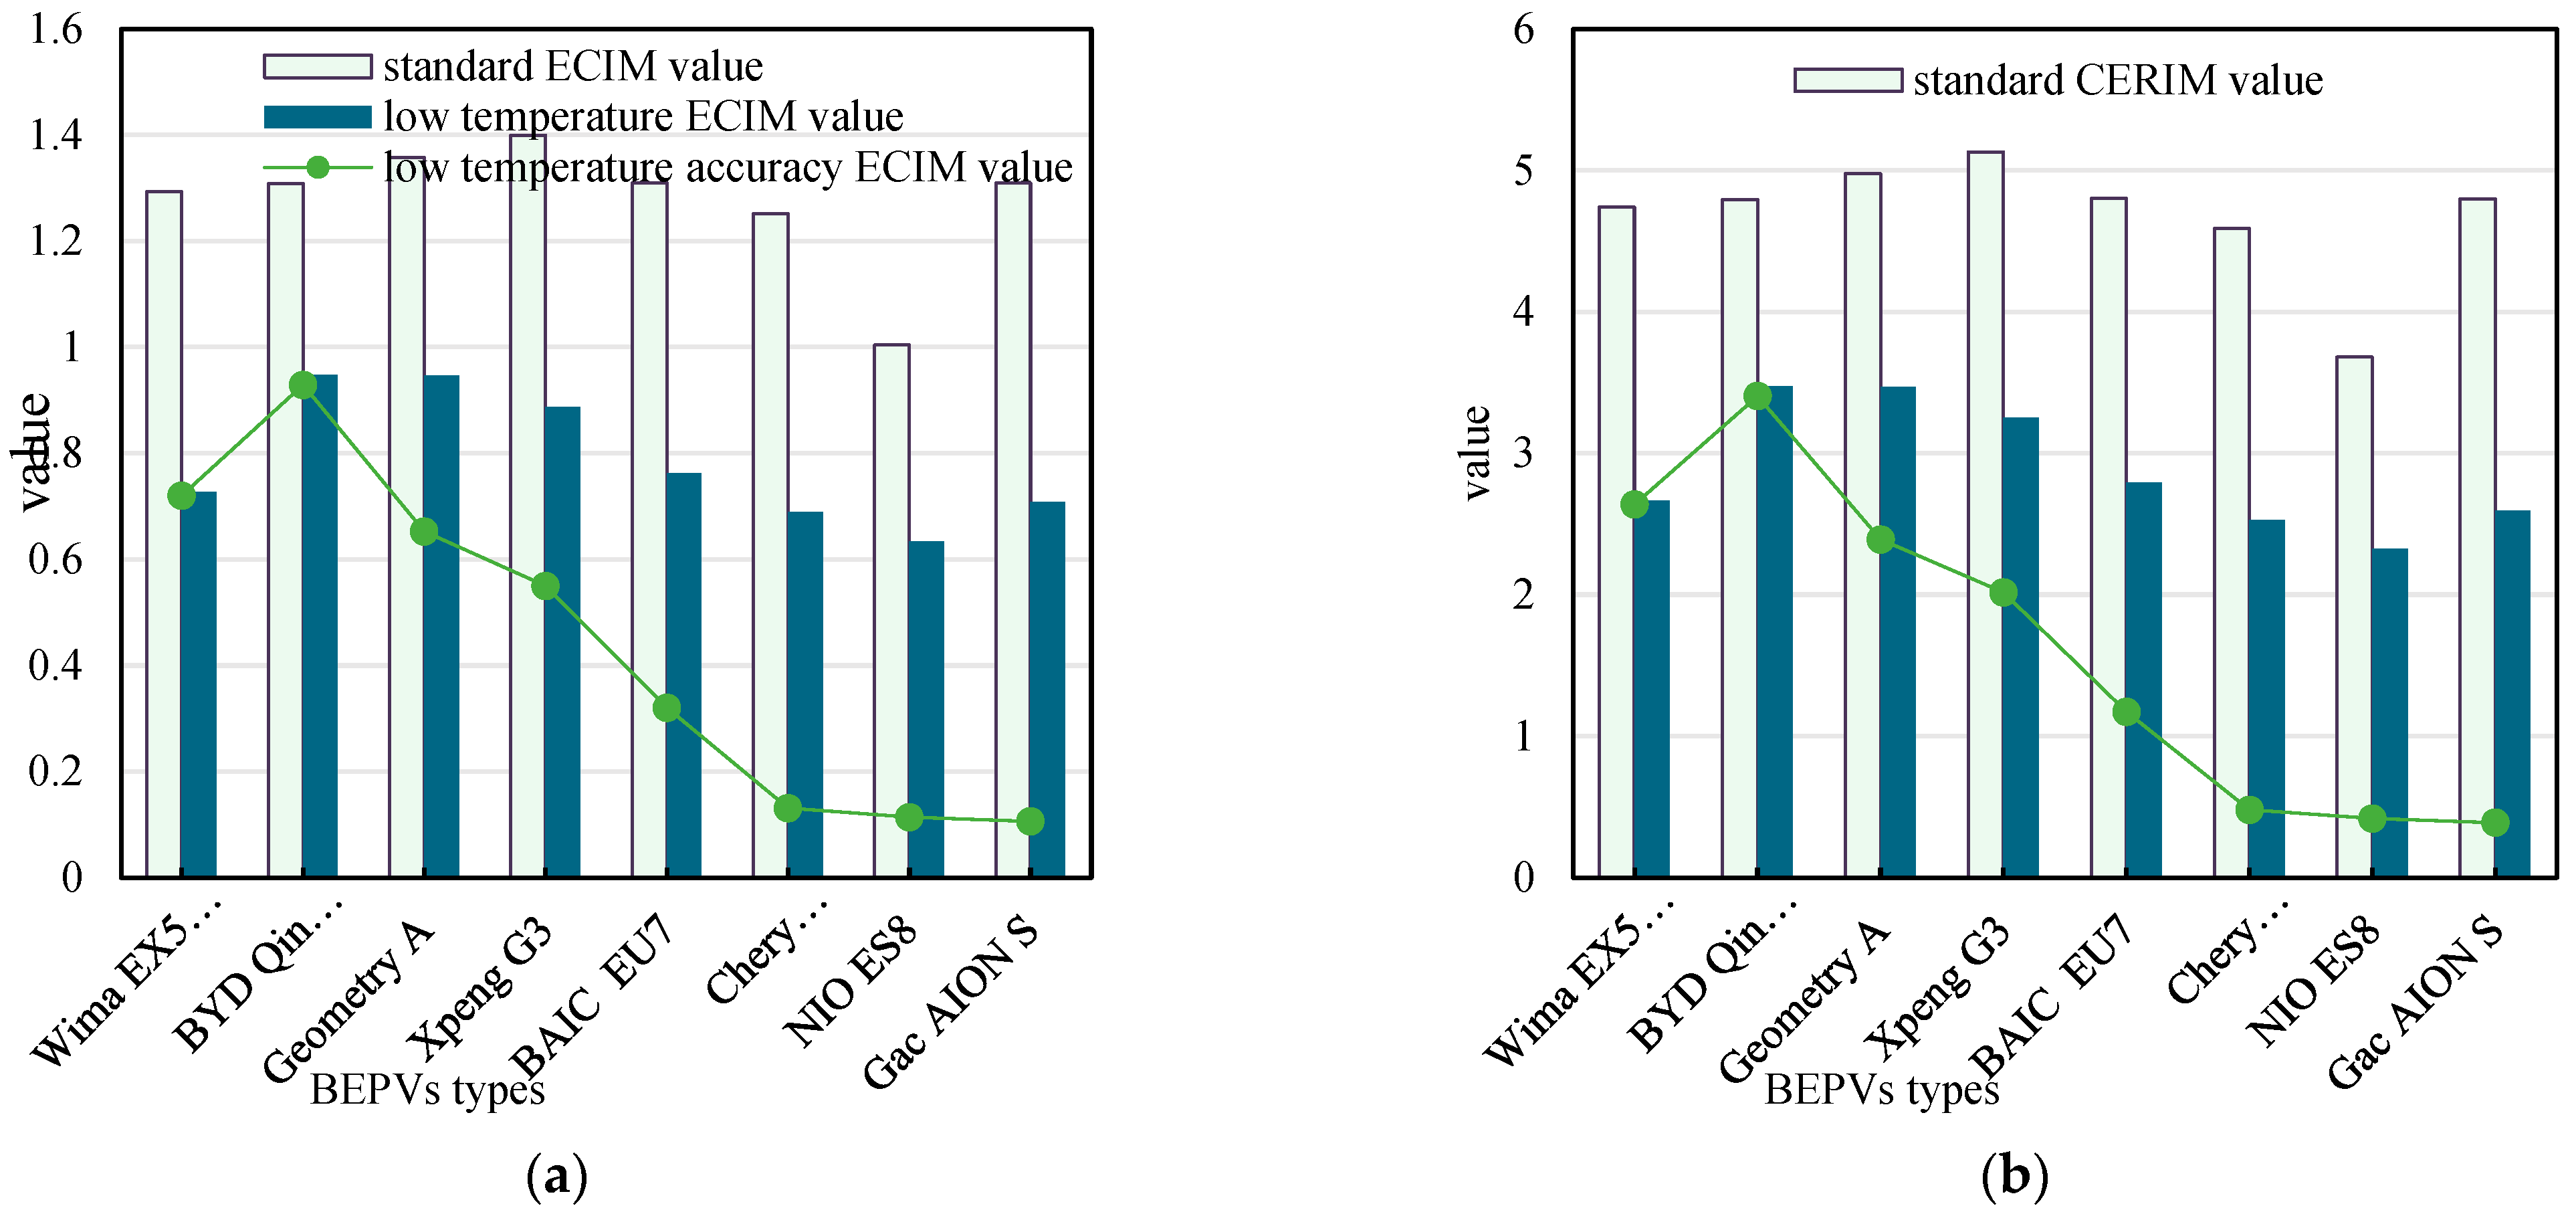
5.5. Sensitivity Analysis of Low Temperature on BEPVs’ Electricity Energy Conservation and Carbon Emission Reduction

Figure 14 and Figure 15 demonstrate that the all levels of BEPVs’ electricity energy consumption have decreases to varying degrees in low temperature condition. Compared with A00+A0 level and B level BEPV, some A level BEPVs types still exhibit electricity energy conservation characteristics in low temperature environment. The actual electricity energy consumption per 100 km of BEPVs is higher than that of ICEVs due to reduced endurance mileage in low temperatures. Therefore, the energy conservation potential of BEPVs in low temperature environments remains unclear. From the perspective of energy conservation, provinces with average winter temperatures below −7 °C, such as northeast Chinese regional provinces, northwest Chinese regional provinces, Xizang and other provinces, are unsuitable for promoting A00+A0 level and B level BEPVs. The carbon emissions reduction effectiveness of A00+A0, A and B level BEPV at −7 °C is seriously affected. The decrease in the endurance mileage of A00+A0, A and B level BEPVs in low temperature leads to an increase in their carbon emissions per 10,000 km, but they are still lower than those of ICEVs. At the same time, it has also been verified that the deployment of all levels and types of BEPVs should not be blindly encouraged, on account of the fact that it is difficult to have both electricity energy conservation and carbon emissions reduction properties for BEPVs at low temperatures in the provinces of North China, Northeast China and Northwest China.

5.6. Sensitivity Analysis of Low Temperature Endurance Mileage Accuracy on Electricity Energy Conservation and Carbon Emission Reduction Capability of BEPV

According to Figure 16a, only two A-level BEPV types show less sensitivity to the low temperature endurance mileage accuracy, whereas most BEPV types show increased electricity energy consumption per 100 km. The B level BEPVs’ ECIM values are seriously affected by the low temperature endurance mileage accuracy, losing their energy conservation function, with electricity energy consumption three to five times that of ICEVs. In particular, for BYD Qin ProEV, Geely Geometry A and Xpeng G3, ECIM values have similarity only when considering the influence of low temperature factor on the endurance mileage. However, their ECIM values decrease, whereas their electricity energy consumption increases successively when the low temperature endurance mileage accuracy parameter is added. Therefore, the electricity energy conservation capability of BEPVs should be evaluated from various perspectives.
As shown in Figure 16b, it can be intuitively concluded that the low temperature endurance mileage accuracy factor slightly reduces the carbon emission reduction ability per 10,000 km of some A level BEPVs types. Their carbon emissions are still lower than those of ICEVs, and their carbon emission reduction ability is relatively excellent. The emission reduction capability per 10,000 km of the three BEPV types under standard temperature scenarios is 2 to 2.5 times that of ICEVs. However, their carbon emission reduction advantage is weakened but still apparent when the endurance mileage is reduced because of low temperature. Their carbon emissions per 10,000 km are higher than those of ICEVs after adding the low temperature endurance mileage accuracy factor, and the advantage disappears. Therefore, only some A level BEPVs types are suitable for promotion in the northeast and northwest regions to achieve the goal of carbon emissions reduction in the road transportation industry nationwide from the perspective of carbon peaking and carbon neutralisation, and with the existing vehicle technology level.

6. Conclusions

In this study, an ECIM is established to assess the electricity energy conservation and carbon emission reduction characteristics of existing multilevel BEPVs in the Chinese market. This model considers the electricity energy consumption per 100 km of BEPVs from the perspective of the fuel whole life cycle, using the energy consumption of ICEVs with the same level as the reference object. A CERIM is established to measure the carbon emissions reduction ability of best-selling BEPV types at all levels in China from 2018 to 2020. The results show that the carbon emission reduction capability of BEPVs is relatively excellent although their electricity energy conservation capability is largely unsuccessful. Specifically, the average ECIM values of A00+A0 entry-level and A level universal BEPVs values are still greater than or equal to one, indicating that they have an obvious electricity energy saving capacity. The carbon emission reduction abilities of all levels of BEPVs are excellent.
From the perspective of the fuel whole life cycle, the influence law of comprehensive electricity generation efficiency on the electricity energy consumption per 100 km of all levels of BEPVs is predicted to explore in 2025, 2030 and 2035. The interaction relationship between BEPVs’ carbon emissions per 10,000 km and the proportion of thermal power is examined in 2025, 2030 and 2035. Increasing the proportion of renewable energy generation is one of the reliable means to improve the electricity energy conservation of BEPVs.
The mileage credibility, regional mileage credibility, low temperature and low temperature endurance mileage accuracy parameters are further explored to verify the electricity energy conservation and carbon emissions reduction potential of BEPV in the actual driving environment. The higher the level of BEPVs, the more remarkable the negative impact of mileage credibility on their energy conservation performance. It is noteworthy that for some provinces in south China and southwest China, regional mileage credibility can enhance the electricity energy conservation and carbon emissions reduction effect of some A00+A0 and A level BEPVs types. For B level BEPVs, the electricity energy consumption per 100 km will be higher than that of ICEVs when the regional mileage credibility is considered.
In low temperature environment, the electricity energy conservation abilities of all levels of BEPVs are weakened, but they still have the ability to reduce carbon emissions. When the factor of low temperature endurance mileage accuracy is further analysed, the carbons emissions per 10,000 km of most BEPVs are higher than those of ICEVs. Therefore, the promotion of BEPVs in provinces and regions with winter temperatures below −7 °C may lead to energy waste and increased carbon emissions.

Author Contributions

Conceptualization, J.L. and M.H.; Methodology, J.L. and B.Y.; Software, J.L.; Validation, J.L.; Formal analysis, J.L. and M.H.; Investigation, J.L.; Resources, J.L.; Data curation, J.L.; Writing—original draft, J.L.; Writing—review & editing, J.L. and B.Y.; Visualization, J.L. and M.H.; Supervision, J.L., B.Y. and M.H.; Project administration, J.L.; Funding acquisition, J.L. All authors have read and agreed to the published version of the manuscript.

Funding

This work is sponsored by The National Social Science Fund of China Key Project (20AJY016), Beijing Wuzi University School-Level Youth Research Fund Project (2022XJQN12), Beijing Wuzi University School-Level Research Fund Project (2023XJKY08). We also thank anonymous referees and the editor-in-chief.

Data Availability Statement

The data supporting reported results can be found in Annual Report on New Energy Vehicle Industry in China (2021), Technology Roadmap 2.0 for Energy-Saving and New Energy Vehicle, Annual Report on the Big Data of New Energy Vehicle in China.

Conflicts of Interest

The authors declare no conflict of interest.

Abbreviations

ICEVinternal combustion engine vehicle
ECIMelectricity conservation index model
CERIMcarbon emissions reduction index model
WTWwell-to-wheel
WTPwell to pump
PTWpump to wheels
kmKilometer

Appendix A

Figure A1 shows the average electricity energy consumption per 100 km of A00+A0, A and B level BEPV from 2018 to 2020 from the perspective of the fuel whole life cycle. When the comprehensive electricity generation and transmission efficiency are identified as crucial factors, the electricity energy consumption per 100 km of all levels BEPVs has exceeded 25 kW · h / 100   km . The 2018 B-level has the highest electricity consumption among all levels of BEPVs, with an average value of 47.02 kW · h / 100   km . Along with the improvement of vehicle technology year by year, the electricity consumption per 100 km of all levels BEPVs have shown a downward trend, with the B level high-end BEPV exhibiting the largest drop in electricity consumption.
Figure A1. BEPVs’ electricity energy consumption.
Sustainability 15 05701 g0a1
Figure A2 shows the average carbon emissions per 10,000 km of all levels of BEPVs from 2018 to 2020. In 2018, B-class high-end BEPV has the highest average carbon emissions per 10,000 km of about 1570 kg. In 2020, the A00+A0 level entry BEPVs have the minimum average carbon emissions per 10,000 km of 931 kg.
Figure A2. BEPVs’ carbon emission.
Sustainability 15 05701 g0a2

References

  1. Xu, X.; Aziz, H.; Guensler, R. A modal-based approach for estimating electric vehicle energy consumption in transportation networks. Transp. Res. Part D Transp. Environ. 2019, 75, 249–264. [Google Scholar] [CrossRef]
  2. Li, F.; Ou, R.; Xiao, X.; Zhou, K.; Xie, W.; Ma, D.; Liu, K.; Song, Z. Regional comparison of electric vehicle adoption and emission reduction effects in China. Resour. Conserv. Recycl. 2019, 149, 714–726. [Google Scholar] [CrossRef]
  3. China Society of Automotive Engineering. Technology Roadmap 2.0 for Energy-Saving and New Energy Vehicle; Mechanical Industry Press: Beijing, China, 2021. [Google Scholar]
  4. Elshurafa, A.M.; Peerbocus, N. Electric vehicle deployment and carbon emissions in Saudi Arabia: A power system perspective. Electr. J. 2020, 33, 106774. [Google Scholar] [CrossRef]
  5. Suanpang, P.; Jamjuntr, P.; Kaewyong, P.; Niamsorn, C.; Jermsittiparsert, K. An Intelligent Recommendation for Intelligently Accessible Charging Stations: Electronic Vehicle Charging to Support a Sustainable Smart Tourism City. Sustainability 2023, 15, 455. [Google Scholar] [CrossRef]
  6. Mundaca, L.; Roman-Collado, R.; Cansino Muñoz-Repiso, J.M. Assessing the impacts of social norms on low-carbon mobility options. Energy Policy 2022, 162, 112814. [Google Scholar] [CrossRef]
  7. Axsen, J.; Kurani, K.S.; McCarthy, R. Plug-in hybrid vehicle GHG impacts in California: Integrating consumer-informed recharge profiles with an electricity-dispatch model. Energy Policy 2011, 39, 1617–1629. [Google Scholar] [CrossRef]
  8. Garcia, R.; Gregory, J.; Freire, F. Dynamic fleet-based life-cycle greenhouse gas assessment of the introduction of electric vehicles in the Portuguese light-duty fleet. Int. J. Life Cycle Assess 2015, 20, 1287–1299. [Google Scholar] [CrossRef] [Green Version]
  9. Kotchen, M.J.; Mansur, T.; Joshua, S. Spatial and temporal heterogeneity of marginal emissions: Implications for electric cars and other electricity-shifting policies. J. Econ. Behav. Organ. 2014, 107, 248–268. [Google Scholar]
  10. Dubarry, M.; Truchot, C.; Liaw, B.Y.; Gering, K.; Sazhin, S.; Jamison, D.; Michelbacher, C. Evaluation of commercial lithium-ion cells based on composite positive electrode for plug-in hybrid electric vehicle applications III: Effect of thermal excursions without prolonged thermal aging. J. Electrochem. Soc. 2013, 160, A191–A199. [Google Scholar] [CrossRef]
  11. Li, J.; Yuan, C.F.; Guo, Z.H.; Zhang, Z.A.; Lai, Y.Q.; Liu, J. Limiting factors for low-temperature performance of electrolytes in LiFePO4 /Li and graphite /Li half cells. Electrochim. Acta 2012, 59, 69–74. [Google Scholar] [CrossRef]
  12. Yu, A.; Wei, Y.; Chen, W.; Peng, N.; Peng, L. Life cycle environmental impacts and carbon emissions: A case study of electric and gasoline vehicles in China. Transp. Res. Part D Transp. Environ. 2018, 65, 409–420. [Google Scholar] [CrossRef]
  13. Gan, Y.; Wang, M.; Lu, Z.; Kelly, J. Taking into account greenhouse gas emissions of electric vehicles for transportation de-carbonization. Energy Policy 2021, 155, 112353. [Google Scholar] [CrossRef]
  14. Kamiya, G.Y. Modelling the greenhouse gas emissions intensity of plug-in electric vehicles in Canada using short-term and long-term perspectives. Transp. Res. Part D Transp. Environ. 2015, 69, 209–223. [Google Scholar] [CrossRef]
  15. Bastida-Molina, P.; Hurtado-Pérez, E.; Peñalvo-López, E.; Moros-Gómez, M.C. Assessing transport emissions reduction while increasing electric vehicles and renewable generation levels. Transp. Res. Part D Transp. Environ. 2020, 88, 102560. [Google Scholar] [CrossRef]
  16. Manjunath, A.; Gross, G. Towards a meaningful metric for the quantification of GHG emissions of electric vehicles (EVs). Energy Policy 2017, 102, 423–429. [Google Scholar] [CrossRef]
  17. Li, Z.; Khajepour, A.; Song, J. A comprehensive review of the key technologies for pure electric vehicles. Energy 2019, 182, 824–839. [Google Scholar] [CrossRef]
  18. Liu, D.; Xu, L.; Sadia, U.H.; Wang, H. Evaluating the CO2 emission reduction effect of China’s battery electric vehicle promotion efforts. Atmos. Pollut. Res. 2021, 12, 101115. [Google Scholar] [CrossRef]
  19. Moro, A.; Lonza, L. Electricity carbon intensity in European Member States: Impacts on GHG emissions of electric vehicles. Transp. Res. Part D Transp. Environ. 2017, 64, 5–14. [Google Scholar] [CrossRef]
  20. Li, J.; Yang, B. Analysis of greenhouse gas emissions from electric vehicle considering electric energy structure, climate and power economy of ev: A China case. Atmos. Pollut. Res. 2020, 11, 1–11. [Google Scholar] [CrossRef]
  21. Shafique, M.; Luo, X. Environmental life cycle assessment of battery electric vehicles from the current and future energy mix perspective. J. Environ. Manag. 2021, 303, 114050. [Google Scholar] [CrossRef]
  22. Choi, H.; Shin, J.; Woo, J. Effect of electricity generation mix on battery electric vehicle adoption and its environmental impact. Energy Policy 2018, 121, 13–24. [Google Scholar] [CrossRef]
  23. Plötz, P.; Gnann, T.; Jochem, P.; Yilmaz, H.Ü.; Kaschub, T. Impact of electric trucks powered by overhead lines on the European electricity system and CO2 emissions. Energy Policy 2019, 130, 32–40. [Google Scholar] [CrossRef]
  24. Zhao, Y.; Onat, N.C.; Kucukvar, M.; Tatari, O. Carbon and energy footprints of electric delivery trucks: A hybrid multi-regional input-output life cycle assessment. Transp. Res. Part D Transp. Environ. 2016, 47, 195–207. [Google Scholar] [CrossRef]
  25. McLaren, J.; Miller, J.; O’Shaughnessy, E.; Wood, E.; Shapiro, E. CO2 emissions associated with electric vehicle charging: The impact of electricity generation mix, charging infrastructure availability and vehicle type. Electr. J. 2016, 29, 72–88. [Google Scholar] [CrossRef] [Green Version]
  26. Bellocchi, S.; Klöckner, K.; Manno, M.; Noussan, M.; Vellini, M. On the role of electric vehicles towards low-carbon energy systems: Italy and Germany in comparison. Appl. Energy 2019, 255, 113848. [Google Scholar] [CrossRef]
  27. Sykes, M.; Axsen, J. No free ride to zero-emissions: Simulating a region’s need to implement its own zero-emissions vehicle (ZEV) mandate to achieve 2050 GHG targets. Energy Policy 2017, 110, 447–460. [Google Scholar] [CrossRef]
  28. Xiong, S.; Wang, Y.; Bai, B.; Ma, X. A hybrid life cycle assessment of the large-scale application of electric vehicles. Energy 2021, 216, 119314. [Google Scholar] [CrossRef]
  29. Pan, L.; Liu, C.; Zhang, Z.; Wang, T.; Shi, J.; Chen, J. Energy-saving Effect of Utilizing Recirculated Air in Electric Vehicle Air Conditioning System. Int. J. Refrig. 2019, 102, 122–129. [Google Scholar] [CrossRef]
  30. Lazzeroni, P.; Cirimele, V.; Canova, A. Economic and environmental sustainability of Dynamic Wireless Power Transfer for electric vehicles supporting reduction of local air pollutant emissions. Renew. Sustain. Energy Rev. 2020, 138, 110537. [Google Scholar] [CrossRef]
  31. Challa, R.; Kamath, D.; Anctil, A. Well-to-wheel greenhouse gas emissions of electric versus combustion vehicles from 2018 to 2030 in the US. J. Environ. Manag. 2022, 308, 114592. [Google Scholar] [CrossRef]
  32. Wang, Z.P.; Liang, Z.W. Annual Report on the Big Data of New Energy Vehicle in China; China Machine Press: Beijing, China, 2021. [Google Scholar]
  33. China Automotive Technology & Research Center (CATARC). Annual Report on New Energy Vehicle Industry in China (2021); CATARC: Tianjin, China, 2021. [Google Scholar]
Figure 1. Methodological framework for the BEPVs WTW analysis.
Sustainability 15 05701 g001
Figure 2. BEPVs’ ECIM values.
Sustainability 15 05701 g002
Figure 3. BEPVs’ CERIM value.
Sustainability 15 05701 g003
Figure 4. The influence rule of comprehensive electricity energy generation efficiency on BEPVs’ ECIM value in 2025 (a), 2030 (b) and 2035 (c).
Sustainability 15 05701 g004
Figure 5. The influence rule of thermal power proportion on BEPVs’ CERIM values in 2025 (a), 2030 (b) and 2035 (c).
Sustainability 15 05701 g005
Figure 6. BEPVs’ ECIM values and CERIM values.
Sustainability 15 05701 g006
Figure 7. BEPVs’ ECIM values and CERIM values in northern Chinese region provinces.
Sustainability 15 05701 g007
Figure 8. BEPVs’ ECIM values and CERIM values in eastern Chinese region provinces.
Sustainability 15 05701 g008
Figure 9. BEPVs’ ECIM values and CERIM values in southern Chinese region provinces.
Sustainability 15 05701 g009
Figure 10. BEPVs’ ECIM values and CERIM values in central Chinese region provinces.
Sustainability 15 05701 g010
Figure 11. BEPVs’ ECIM values and CERIM values in southwest Chinese region provinces.
Sustainability 15 05701 g011
Figure 12. BEPVs’ ECIM values and CERIM values in northwest Chinese region provinces.
Sustainability 15 05701 g012
Figure 13. BEPVs’ ECIM values and CERIM values in northeast Chinese region provinces.
Sustainability 15 05701 g013
Figure 14. A00+A0 level BEPVs’ ECIM values and CERIM values in low temperature.
Sustainability 15 05701 g014
Figure 15. A level and B level BEPVs’ ECIM values and CERIM values in low temperature.
Sustainability 15 05701 g015
Figure 16. BEPVs’ ECIM values (a) and CERIM values (b) considering low temperature endurance mileage accuracy.
Sustainability 15 05701 g016
Table 1. The average electricity energy consumption per 100 km of BEPV.
Level2018201920202025E2030E2035E
A00+A0 entry-level13.112.812.498.58
A universal level15.314.414.11110.510
B high-end level 20.519.616.91312.512
Table 2. Electricity data.
CategoryHydro PowerThermal PowerNuclear PowerWind PowerSolar PowerComprehensive
Generation Efficiency
Power Transmission Efficiency
2018Proportion of power generation17.6%70.4%4.2%5.2%2.5%46.37%94.1%
power generation efficiency 87.5%38.1%41.5%36.5%18.8%
2019Proportion of power generation16.8%69.8%4.5%5.7%3.2%46.37%94.2%
power generation efficiency 88.8%38.3%42.6%38.3%19.4%
2020Proportion of power generation16.15%69.26%4.74%6.10%3.76%46.1%94.3%
power generation efficiency 89.2%38.4%42.6%38.5%19.5%
Table 3. The average gasoline consumption of ICE. (unit: L / 100   km ).
201820192020
A00+A06.96.66.2
A8.78.47.9
B10.19.79.1
Table 4. Endurance mileage credibility and relevant data of BPEV in 2020.
LevelA00+A0AB
ModelChery Eq1JMC E100BAIC EC180BAIC EU260BYD QinBYD E5DENZA EVBAIC EU7BYD Han
Mileage credibility1.021.000.991.030.890.880.900.760.75
Standard mileage151.00152.00200.00260.00400.00405.00352.00451.00550.00
Actual mileage154.02152.00198.00267.80356.00356.40316.80342.76412.50
Standard battery capacity18.2018.8030.4041.4052.0051.2062.0060.2376.90
Electric consumption per 100 km11.8212.3715.3515.4614.6114.3719.5717.5718.64
Table 5. Regional mileage credibility and related data of BEPV in 7 regions of China.
RegionLevelA00+A0AB
North ChinaTypeChery Eq1JMC E100BAIC EV200BAIC EU260EmgrandEVBYD E5DENZA EV
Mileage credibility1.000.990.950.990.910.870.91
Standard mileage151.00152.00200.00260.00400.00405.00352.00
Actual mileage151.00150.48190.00257.40364.00352.35320.32
Standard battery capacity18.2018.8030.4041.4052.0051.2062.00
Electric consumption per 100 km12.0512.4916.0016.0814.2914.5319.36
East ChinaTypeChery Eq1JMC E100BAIC EV200BYD E5BYD QinBAIC EU 5DENZA EVBAIC EU7BYD Han
Mileage credibility1.020.990.980.910.890.860.870.780.78
Standard mileage151.00152.00200.00405.00450.00260.00352.00451.00550.00
Actual mileage154.02150.48196.00368.55400.50223.60306.24351.78429.00
Standard battery capacity18.2018.8030.4051.2053.5641.4062.0060.2376.90
Electric consumption per 100 km11.8212.4915.5113.8913.3718.5220.2517.1217.93
South ChinaTypeBAIC EV200BAIC EC180Chery Eq1BYD E2BYD E5Geometry ADENZA EVBYD HanBAIC EU7
Mileage credibility1.081.071.060.930.920.90.870.870.82
Standard mileage200.00156.00151.00401.00405.00430.00352.00550.00451.00
Actual mileage216.00166.92160.06372.93372.60387.00306.24478.50369.82
Standard battery capacity30.4020.3018.2043.2051.2053.0062.0076.9060.23
Electric consumption per 100 km14.0712.1611.3711.5813.7413.7020.2516.0716.29
Central ChinaTypeChery Eq1JMC E100BAIC EC180Junfeng E17BYD QinGeometry AModel 3BYD Han
Mileage credibility1.011.010.961.060.900.890.740.73
Standard mileage151.00152.00156.00310.00450.00430.00556.00550.00
Actual mileage152.51153.52149.76328.60405.00382.70411.44401.50
Standard battery capacity18.2018.8020.3049.9353.5653.0060.0076.90
Electric consumption per 100 km11.9312.2513.5615.1913.2213.8514.5819.15
North-west ChinaTypeBAIC EC180Chery Eq1JMC E200BAIC EU260BAICEU5Emgrand
EV
Mileage credibility1.011.010.960.910.840.83
Standard mileage156.00151.00152.00260.00260.00400.00
Actual mileage157.56152.51145.92236.60218.40332.00
Standard battery capacity20.3018.2017.3041.4041.4052.00
Electric consumption per 100 km12.8811.9311.8617.5018.9615.66
South-west
China
TypeChery Eq1JMC E100JMC E200BAIC EU260BYD QinGeometry ADENZA EV
Mileage credibility1.061.050.931.030.910.880.91
Standard mileage151.00152.00152.00260.00450.00430.00352.00
Actual mileage160.06159.60141.36267.80409.50378.40320.32
Standard battery capacity18.2018.8017.3041.4053.5653.0062.00
Electric consumption per 100 km11.3711.7812.2415.4613.0814.0119.36
North-east
China
Type Roewe
Ei5
Maruti E70
Mileage credibility 0.760.74
Standard mileage 501.00401.00
Actual mileage 380.76296.74
Standard battery capacity 61.1050.30
Electric consumption per 100 km 16.0516.95
Table 6. Low temperature endurance mileage and relevant data of A00+A0 level BEPV.
Changan Benben
EV260
JAC IEV6EYujie E-LineBAIC EC180Saic GM Wuling Baojun E100JMC E200SChery Eq1Zhongtai E200
The percentage of the standard mileage71.4968.5167.4358.2958.2457.0346.696.92
Standard battery capacity31.0034.9022.0020.3028.0017.3032.231.90
Standard mileage251310153156305144251301
the endurance mileage after descent179.44212.38103.1790.93177.6382.12117.1920.83
Electric consumption per 100 km after descent17.2816.4321.3222.3215.7621.0727.48153.15
Table 7. Low temperature endurance mileage and relevant data of A level and B level BEPV.
BYD Qin Pro EVBYD Qin EVDENZA EVGeometry ABYD Song EVDongfeng Fengshen E70Xpeng G3Gac Trumpchi GE3NIO ES8
The percentage of the standard mileage74.18%72.46%72.25%69.65%68.36%65.3%63.39%63.23%63.14%
Standard battery capacity51.353.56625316.943.25548.3975
Standard mileage40145035243080330460410450
the endurance mileage after descent297.46326.07254.32299.5054.69215.49291.59259.24284.13
Electric consumption per 100 km after descent17.2516.4324.3817.7030.9020.0518.8618.6726.40
Soueast Motor DX3 EV400BAIC EU7Roewe
Ei5
Wima EX5 Chi Xing 2.0Chery Tiger 3XeGac AION SBAIC EU5Yudo π1
The percentage of the standard mileage62.7158.1756.8456.2555.0154.0651.737.83
Standard battery capacity50.1260.761.159.5353.658.850.849.8
Standard mileage351475501460401460416430
the endurance mileage after descent220.11276.31284.77258.75220.59248.68215.07162.67
Electric consumption per 100 km after descent22.7721.9721.4623.0124.3023.6523.6230.61
Table 8. Low temperature endurance mileage accuracy and related data of A level and B level BEPV.
Wima EX5 Chi Xing 2.0BYD Qin Pro EVGeometry AXpeng G3BAIC EU7Chery Tiger 3XeNIO ES8Gac AION S
Accuracy 0.990.980.690.620.420.190.180.15
The percentage of the standard mileage56.2572.4669.6563.3958.1755.0163.1499.85
Standard battery capacity59.5351.3535560.753.67558.8
Standard mileage460401430460475401450460
the endurance mileage after descent256.16284.75206.65180.79116.0541.9151.1468.90
Electric consumption per 100 km after descent23.2418.0225.6530.4252.31127.89146.6585.35
Disclaimer/Publisher’s Note: The statements, opinions and data contained in all publications are solely those of the individual author(s) and contributor(s) and not of MDPI and/or the editor(s). MDPI and/or the editor(s) disclaim responsibility for any injury to people or property resulting from any ideas, methods, instructions or products referred to in the content.

