Article

Evidence for Urbanization Effects on Eco-Environmental Quality: A Case Study of Guyuan City, China

1
State Key Laboratory of Eco-Hydraulics in Northwest Arid Region of China, Xi’an University of Technology, Xi’an 710048, China
2
Key Laboratory National Forestry Administration on Ecological Hydrology and Disaster Prevention in Arid Regions, Xi’an University of Technology, Xi’an 710048, China
3
Northwest Surveying and Planning Institute of National Forestry and Grassland Administration, Xi’an 710048, China
4
Ningxia Soil and Water Conservation Monitoring Station, Ningxia Water Conservancy, Yinchuan 750002, China
*
Author to whom correspondence should be addressed.
Sustainability 2023, 15(11), 8629; https://0-doi-org.brum.beds.ac.uk/10.3390/su15118629
Submission received: 1 March 2023 / Revised: 5 May 2023 / Accepted: 22 May 2023 / Published: 25 May 2023
(This article belongs to the Special Issue Soil Erosion and Water and Soil Conservation)

Abstract

:
Achieving sustainable development and a good quality of life depends largely on the state of the ecological environment. This research is centered on Guyuan City and examines the changes in the ecological environment quality across space and time, based on Landsat imagery and the remote sensing ecological environment index (RSEI) between 2000 and 2019. Correlation analysis and partial least squares structural equation modeling was used to investigate the environmental and human factors that affect the quality of the ecological environment. The results indicate a significant reduction in areas with a very-poor-quality ecological environment and a significant increase in excellent ecological environment management from 2000 to 2019, especially in eastern Guyuan City. The low-value area of the RSEI index gradually shifted from eastern counties to western areas relative to Guyuan City, exhibiting a significant change from a high-cluster distribution to a significantly discrete distribution. Elevation, precipitation, and total organic carbon showed significantly positive correlations with the RSEI, while temperature, land use, and pH showed significantly negative correlations. This study also reveals that topography and climate change have a positive impact on ecological changes, and urbanization is becoming less limiting for ecological improvement. In future ecological construction processes, emphasis should be placed on the terrain and climatic conditions to maximize the restoration of the ecological environment affected by urban construction. This work provides regional guidance for future sustainable development and high-quality development in the Yellow River Basin.

1. Introduction

Ecological environment quality directly affects human lifestyles and sustainable socioeconomic development [1,2,3]. In the past decades, rapid urbanization and socioeconomic development has changed ecosystem processes [4], causing a series of environmental issues such as forest degradation, soil erosion, and desertification [5,6,7]. Ecosystem restoration improves sustainable development and the environment. A systematic analysis identifying key factors affecting ecological environment quality is necessary for effective restoration and high-quality socioeconomic development.
Effective ecological assessment poses a significant challenge that requires a multidimensional approach. In southern China, Ding et al. devised an evaluation index system based on hierarchical analysis (AHP) to assess ecological environment quality, but the study uncovered subjectivity in the factor-weighting analysis used in the AHP [8]. Another approach used by Wu et al. relied on the “pressure-state-response” framework, which produced an index system for an ecological risk assessment [9,10,11], but its reliance on constructing an evaluation index system meant that results may have been affected by the selection of indices. The development of remote sensing technology has allowed researchers to take advantage of large-scale monitoring [9]. Remote sensing images measure the reflected radiation on the Earth’s surface to detect ecological indices at different scales [12]. From these images, environmental indices can be constructed (e.g., vegetation cover [13,14], water network density [15], and biological abundance [16,17]). However, indices constructed from remote sensing are based on a single factor and cannot combine multiple factors [18].
To address this challenge, XU et al. established the Remote Sensing Ecological Index (RSEI). This index combines four ecological indicators: normalized vegetation index (NDVI), moisture index (WET), surface temperature index (LST), and building–bare soil index (NDBSI) [19]. They applied RSEI in Fuzhou City, China, and proved its reliability as a means of assessing the local ecological environment quality [19,20]. RSEI can reflect the ecological environment in terms of vegetation, soil, water resources, and urban construction in an integrated manner and offers a convenient method of research and easy access to data. An et al. further tested the RSEI in assessing the ecological environment quality of the Three Gorges Ecological and Economic Corridor in China. The study revealed significant advantages of the RSEI over single-factor assessments [2]. Yuan et al. effectively used the RSEI index to analyze the spatial and temporal variation characteristics of ecological quality in the Dongting Lake watershed and to identify its influencing factors [21]. These studies validate the reliability and confidence of the RSEI in comprehensively reflecting the ecological environment quality in time and space [2,22,23]. Here, we leverage the RSEI to express the ecological environment quality of Guyuan City (see Table 1).
The construction of the ecological environment is driven by both human activities and natural conditions [24,25]. Topographic features, climate, soil characteristics, and urbanization all affect the ecological environment in different ways [5,26]. Various statistical methods have been used to investigate the total effect of drivers, such as: multiple linear regression [27], geographically weighted regression [28,29], random forest regression [30,31], and gray correlation analyses. However, these methods only address the relationship between independent and dependent variables in a single-factor state. While the geographic detector model enables an analysis of factor interaction, it only reflects a degree of explanation for the dependent variable when two factors interact [2,32]. In contrast, structural equation modeling (SEM) can not only reflect the direct influence of impact factors on the target; it can also clearly analyze the contribution of the interaction between different impact factors on the ecological target [33,34]. Two types of SEM models exist, namely, covariance-based structural equation modeling (CB-SEM) and partial least squares structural equation modeling (PLS-SEM). While both models have their own advantages, the PLS-SEM model is preferred for this research as it requires fewer sample analyses, can explore the direct and indirect paths of multiple factors interacting on ecological elements, and also investigates the contribution of human impact factors on changes in ecological quality [35].
In this study, the RSEI index and PLS-SEM were used to analyze the impact of urban construction on the ecological environment in the loess hilly areas. It is expected to provide some guidance to the urban development of similar areas and high-quality development of the Yellow River Basin. The main structure of this study is set up as follows: Section 1 presents relevant studies by scholars on ecology; Section 2 describes the data sources and research methods used in this study; Section 3 presents the main research content and findings; the results of the study are discussed in Section 4; finally, conclusions are presented in Section 5.

2. Materials and Methods

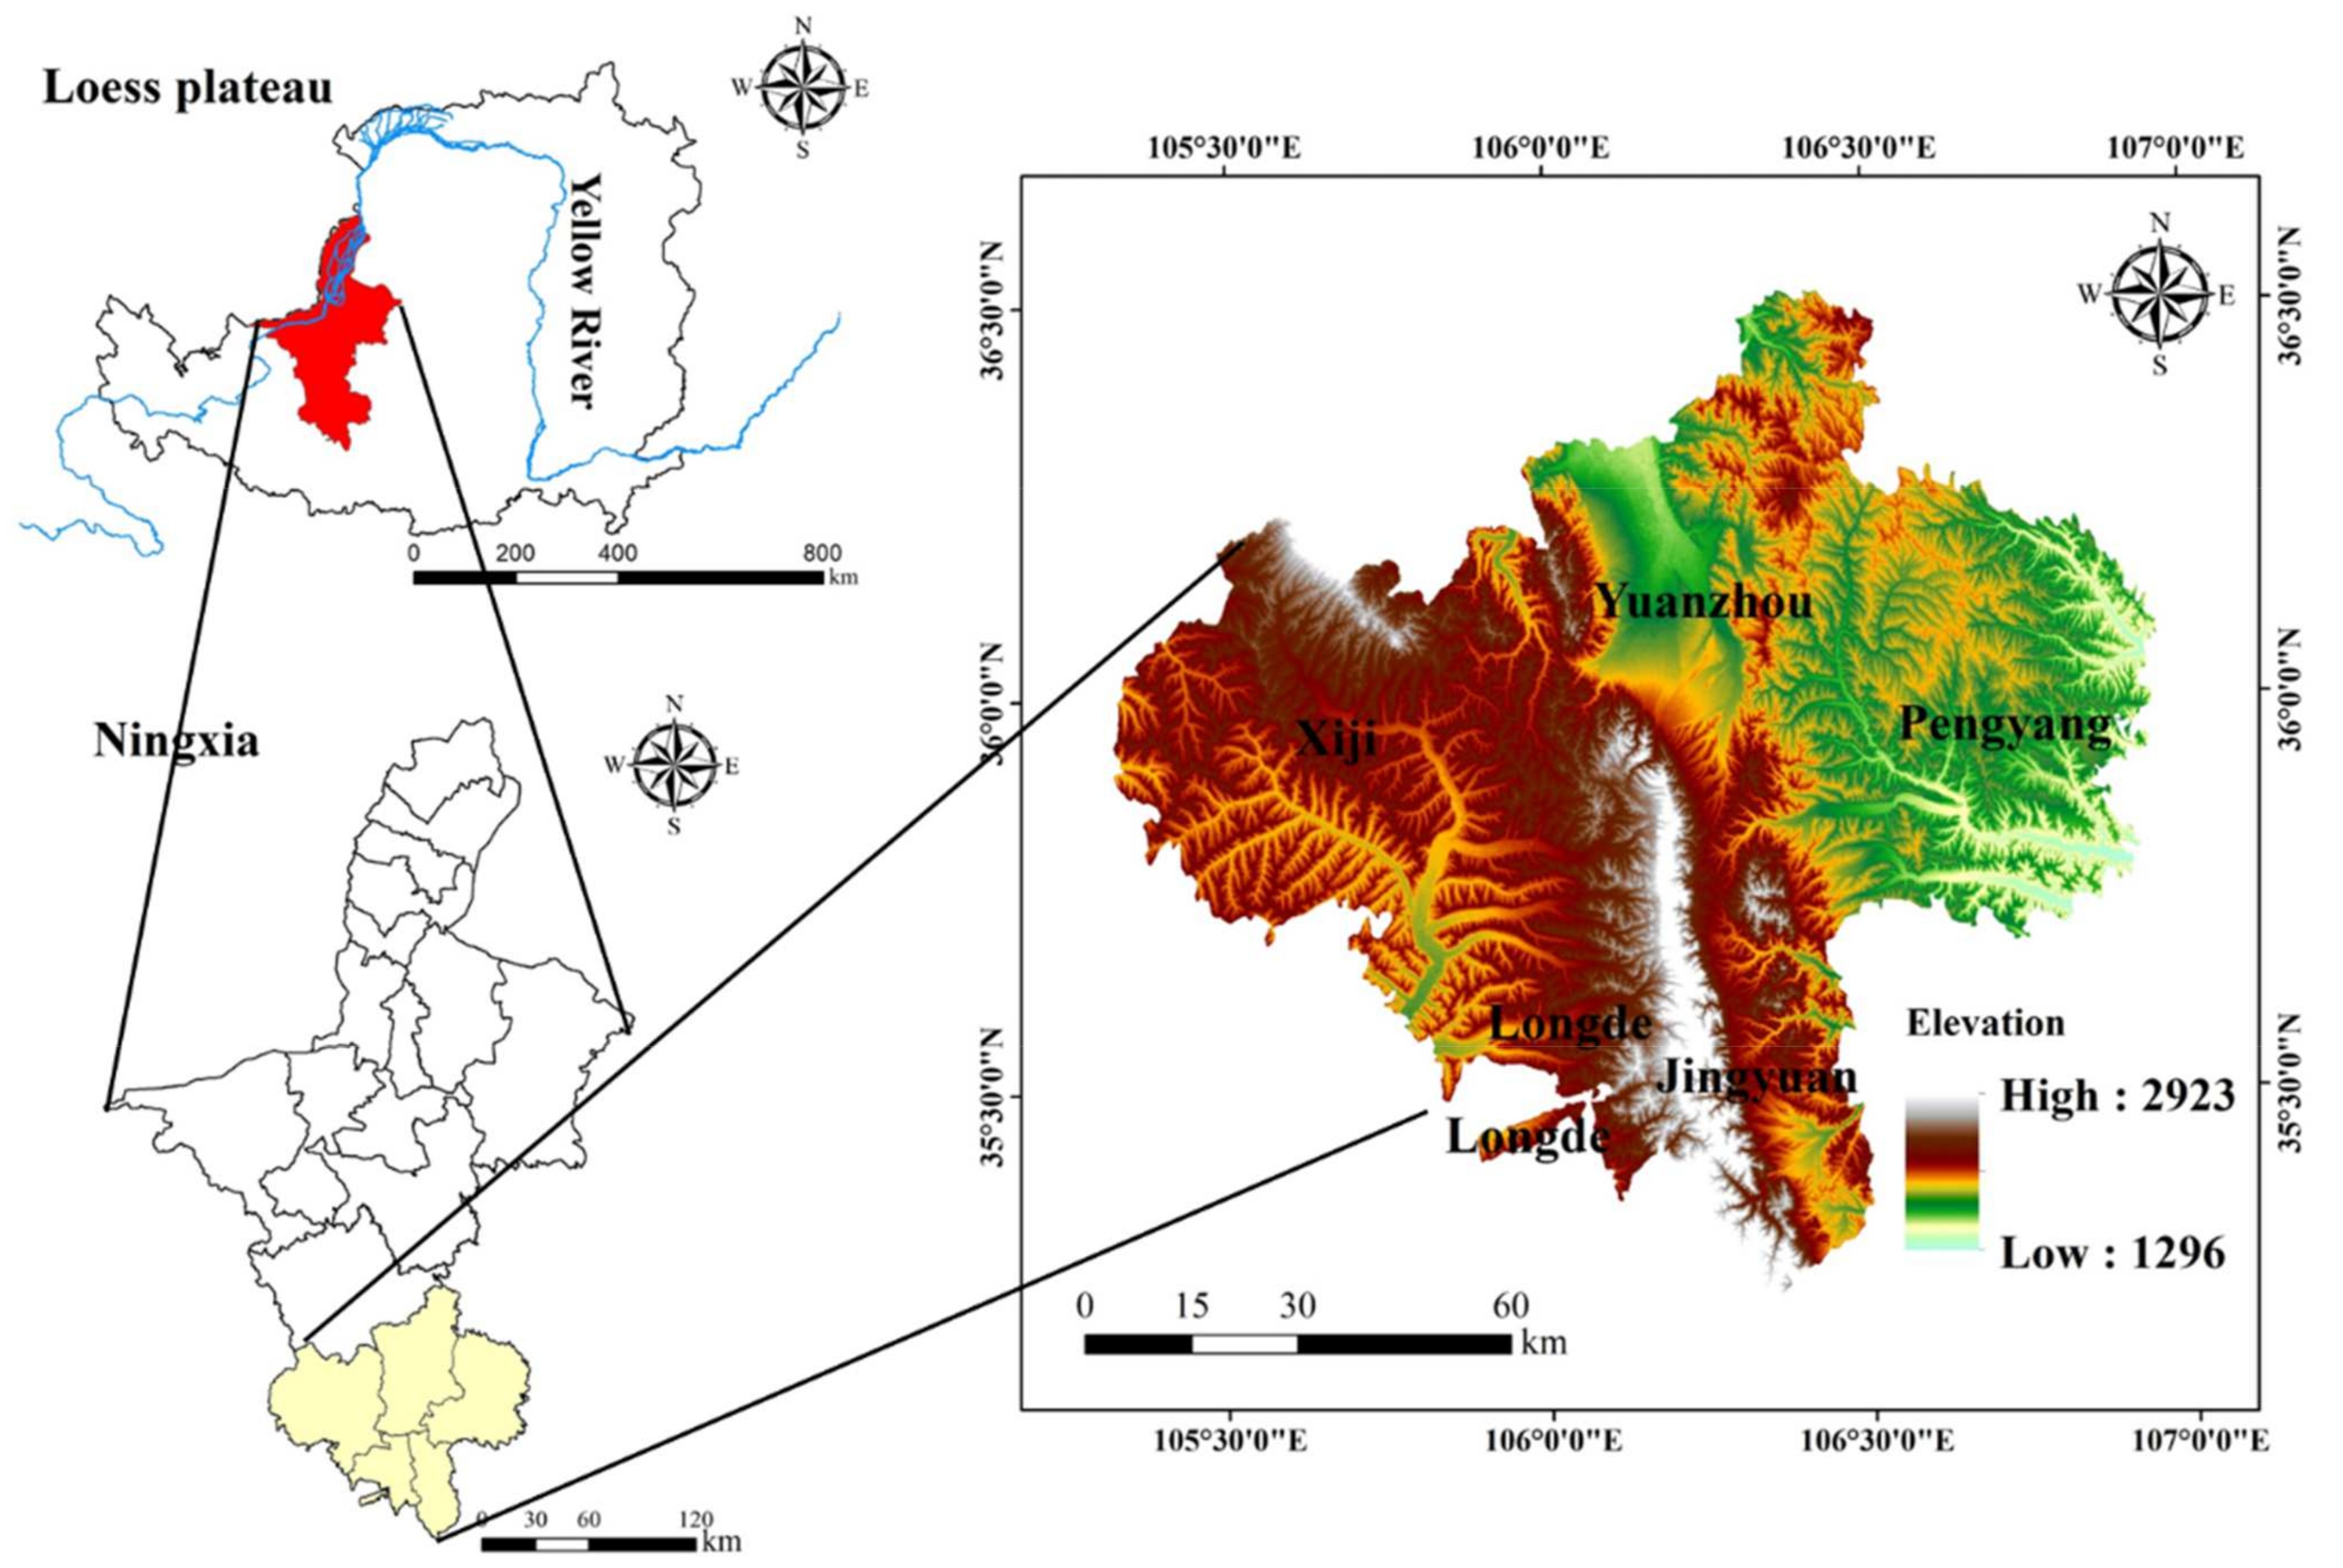
2.1. Overview of the Study Area

Guyuan City is in the Loess Plateau at the northern foot of the Liupan Mountains, within the southern part of the Ningxia Hui Autonomous Region. The geographical coordinates are between 105°19′–106°57′ E and 35°14′–36°31′ N, with a total area of 10,541 km2 and an altitude between 1320 and 2928 m. This is a typical continental climate, with most precipitation occurring in the summer and the least in the winter, and an average rainfall of 492.2 mm, with an average evaporation of 1753.2 mm. High winds and sandy weather occur frequently in the spring. Drought, low-temperature frost, and other climatic events occur sequentially. Local hail and other strong convective weather are more frequent in the summer, and dry and warm phenomena are common in the winter (see Figure 1).

2.2. Data Sources

Landsat image data from 2000, 2008, 2015, and 2019 and Digital Elevation Model data with a 30 m spatial resolution from the Chinese Academy of Sciences geospatial data platform (http://www.gscloud.cn/, (accessed on 4 April 2022)) (http://www.gscloud.cn/#page1/3, (accessed on 4 April 2022)) were leveraged for this study. Land use data were from the Zenodo data website (https://zenodo.org/record/4417810#.YShGWugzbBU, (accessed on 4 April 2022)). Data were processed by Wuhan University according to the Google Earth Engine (GEE) platform. Soil data with a spatial resolution of 1000 m were from the World Soil Database (HWSD). Population density data were obtained from the World Population Database (https://hub.worldpop.org/project/categories?id=18, (accessed on 4 April 2022)). Rainfall, temperature, and night light data were acquired from the Resources and Environment Data Center of the Chinese Academy of Sciences (https://www.resdc.cn/, (accessed on 4 April 2022)) (see Table 2).

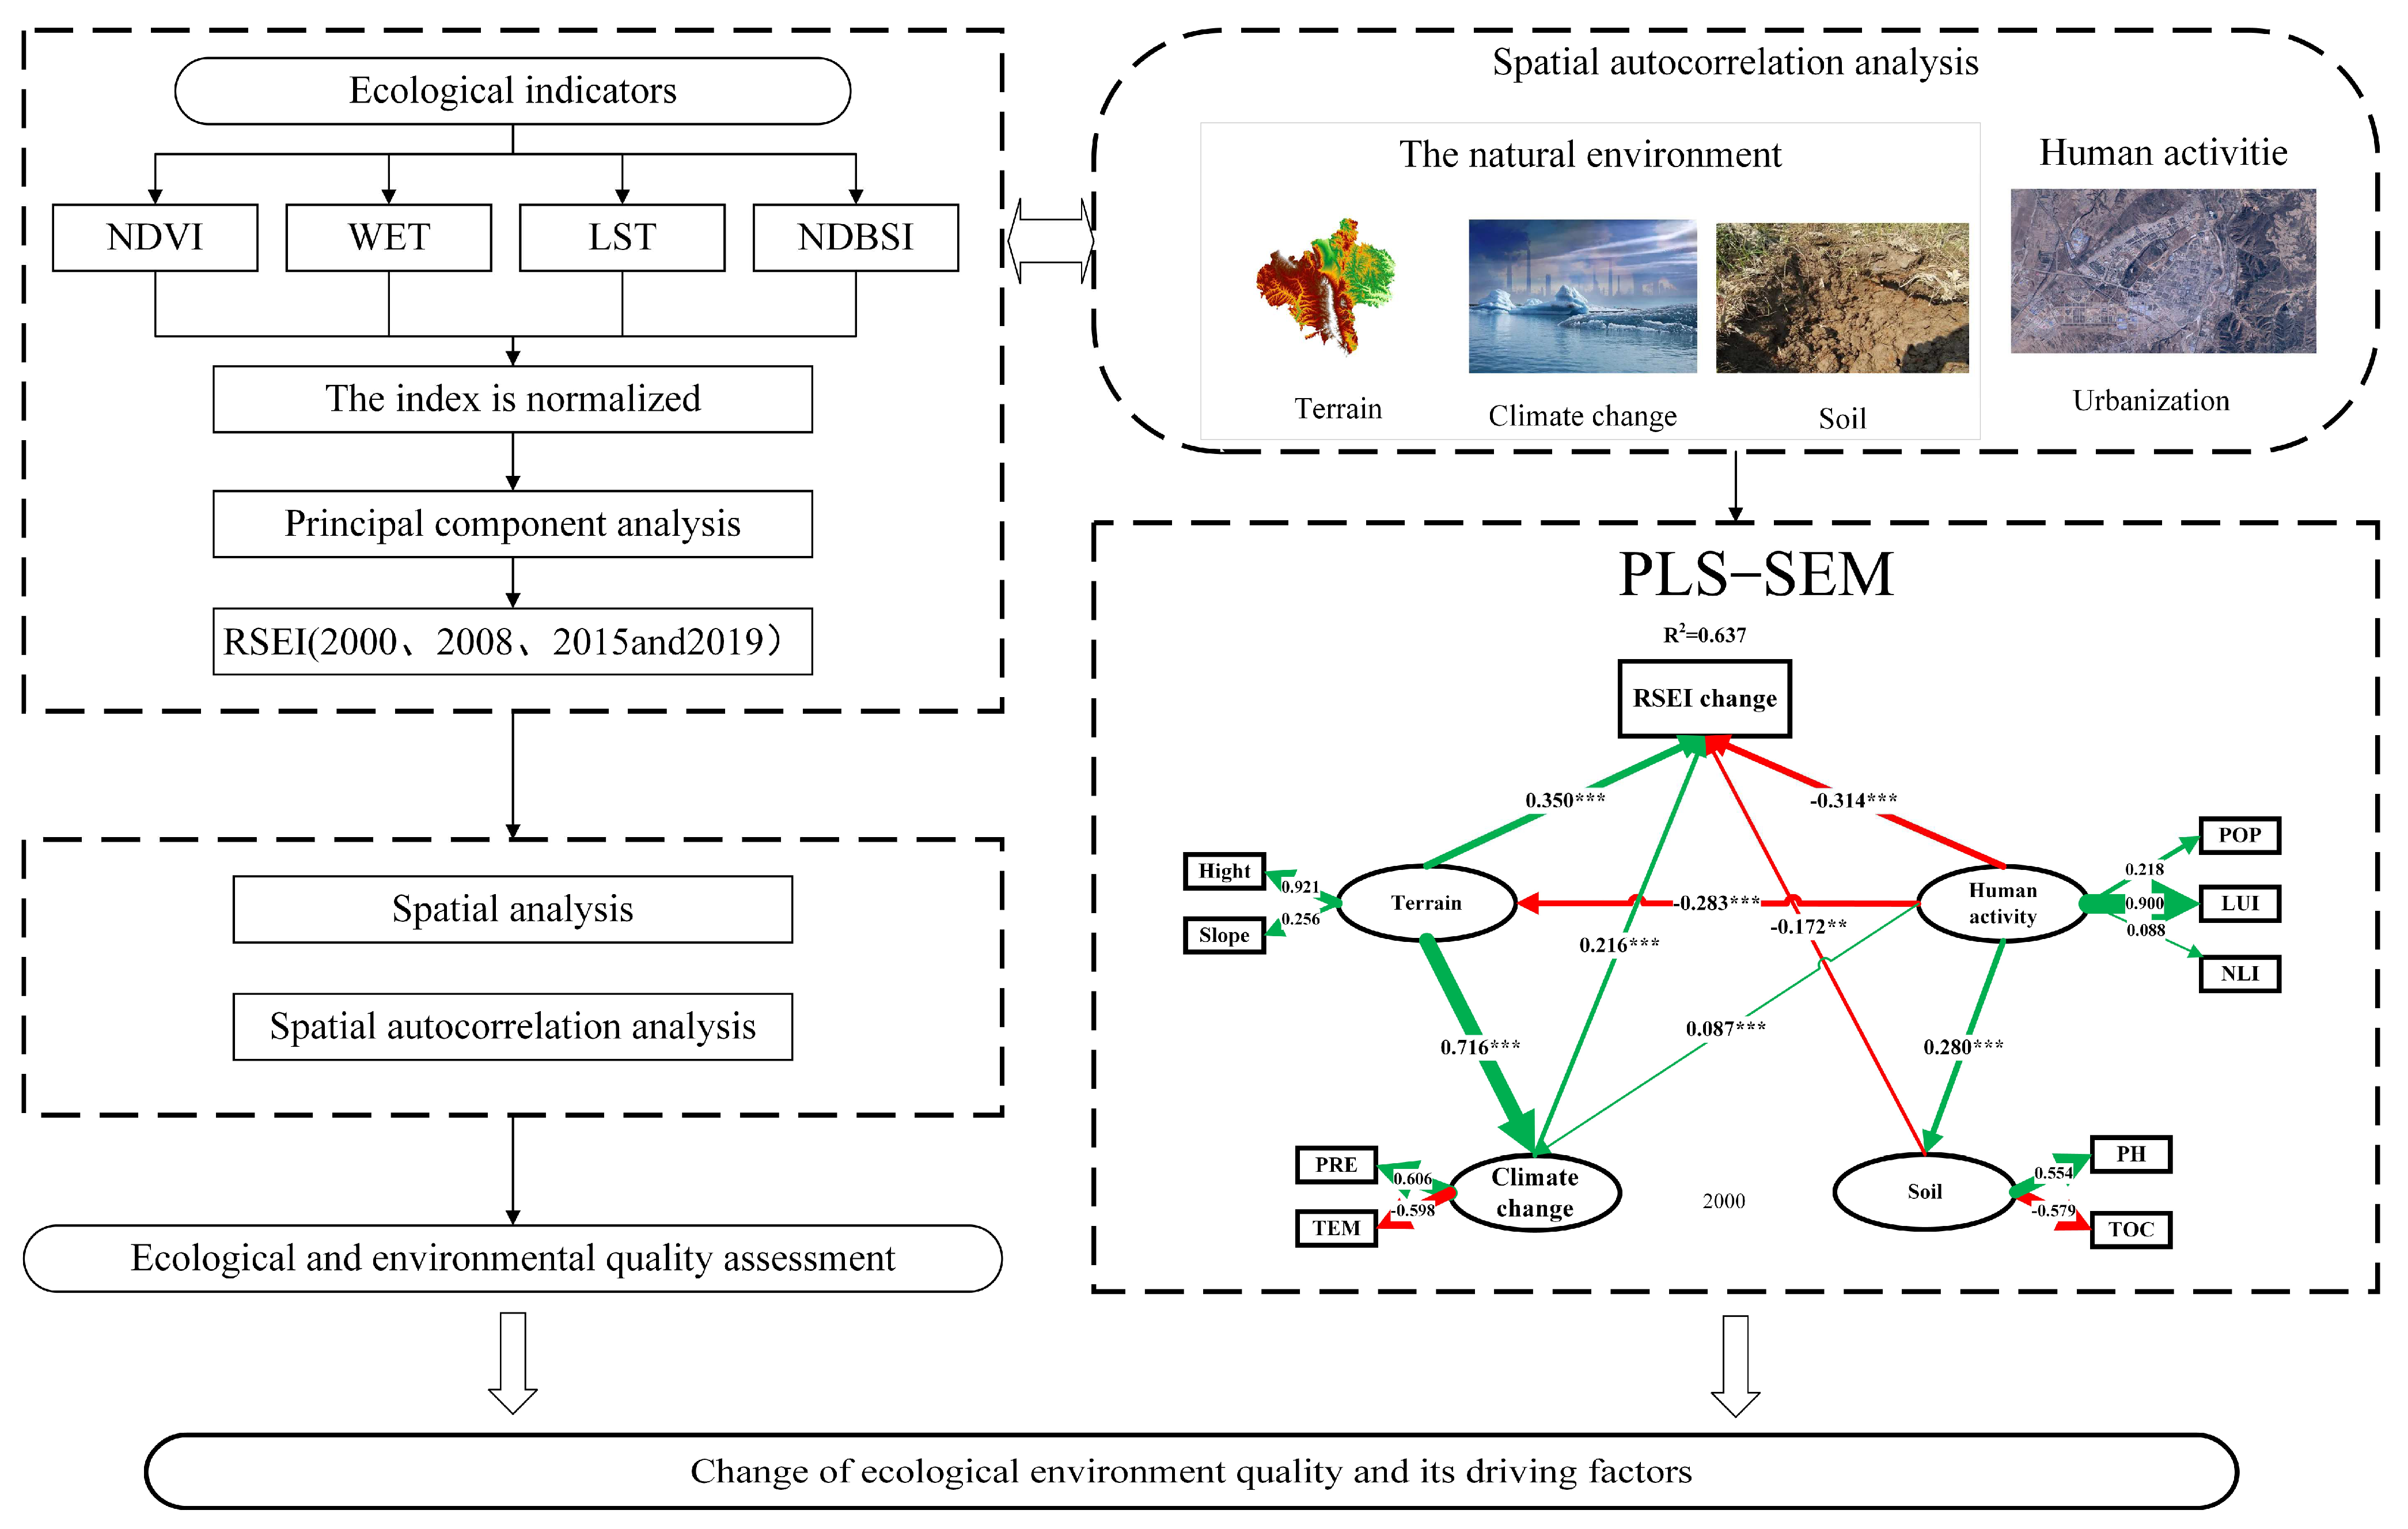
2.3. Research Methods

We calculated the RSEI from the Landsat data. Spatial statistical methods were employed to examine the spatial and temporal evolution of the RSEI within Guyuan City and to derive spatiotemporal information about the state of the ecological environment. To explore the multiple factors that contribute to these changes and how they interact with one another, PLS-SEM was used. The ecological environment of Guyuan City was evaluated for 2000, 2008, 2015, and 2019, and an analysis was conducted on the factors that have driven changes in this environmental state during the past 20 years (see Figure 2).

2.3.1. Ecological Environmental Quality Model

RSEI is a comprehensive ecological index using remote sensing data to assess ecological conditions and is closely associated to the state of the ecological environment. NDVI, WET, LST, and NDBSI were normalized; then, a principal component analysis (PCA) was conducted. These indicators were represented by PC1, and each indicator contribution to the RSEI was weighted by the loading on PC1. This method avoids the subjective assignment of index weight in the weighting method and makes the results more accurate [21,36]. The RSEI expression is shown below:
R S E I = P C 1 f N D V I , W E T , L S T , N D B S I
where NDVI denotes the normalized vegetation index, representing greenness; WET denotes humidity index; LST denotes surface temperature, representing heat; NDBSI denotes the soil-building index, which represents dryness. The calculation methods of each index are shown in Table 3.

2.3.2. Spatial Autocorrelation Analysis

The evaluation of spatial autocorrelation determines the correlation between the ecological environment quality of a particular area and that of its neighboring regions. The uniformity in the spatial distribution of the ecological environment quality was depicted with the assistance of Moran’s I index. GeoDa (1.14) software was used to perform global and local spatial autocorrelation calculations for Moran’s I index. The values of Moran’s I index reflect the correlation between attribute values for spatial units adjacent to one another, and its range extends from −1 to 1. The strength of the spatial correlation is greater as the absolute value approaches 1.

2.3.3. Calculation of Comprehensive Index of Land Use Degree

Land use was divided into four levels: Level 1: barren land; Level 2: ecological land such as forest, shrub, grass, and water; Level 3: agricultural land; and Level 4: construction land. Guyuan City was divided into a 300 × 300 m grid using ArcGIS and the land use index was calculated based on the grid. The calculation formula is as follows:
L U I x = i = 1 n A i S i / S
where LUIx represents the land use index of the grid x; Ai is the grade I land use degree grading index; Si is the grade land use area of i; S is the grid area; and n is the land use classification.

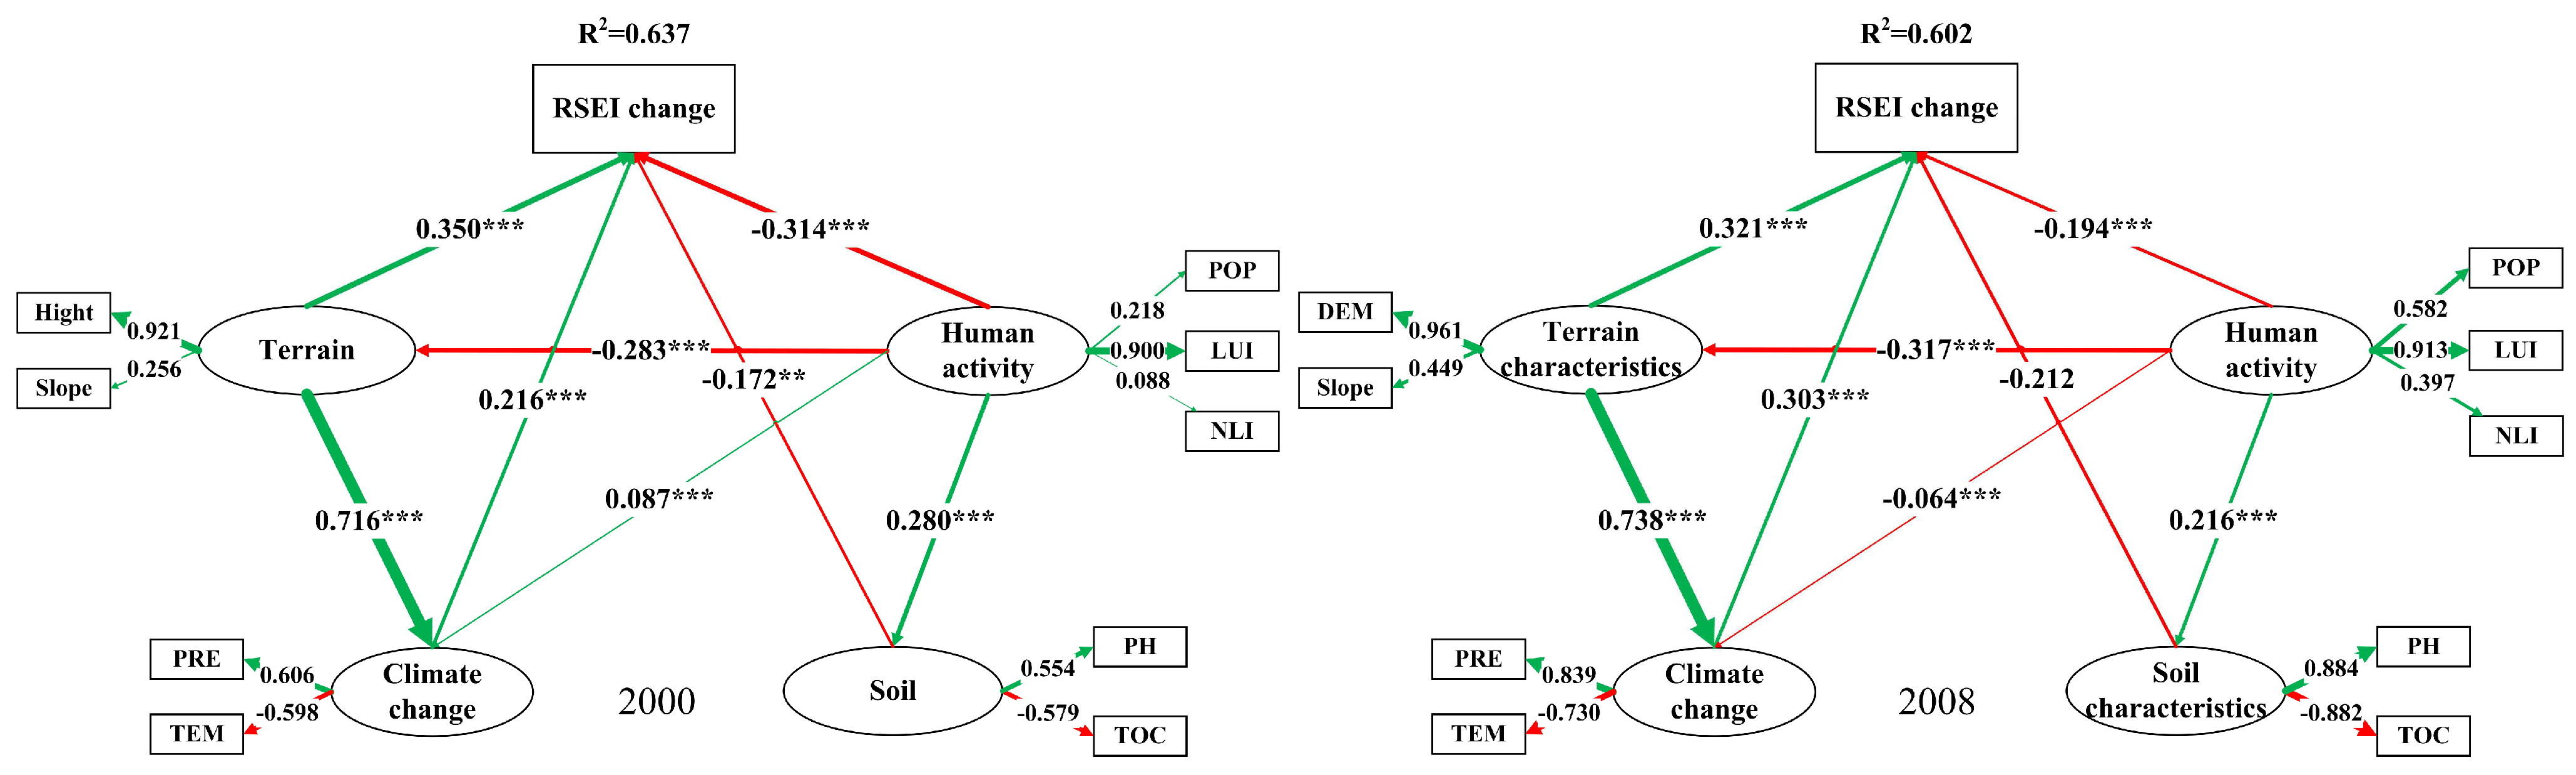
2.3.4. PLS-SEM Model Construction

PLS-SEM is a multivariate statistical method combining factor analysis and regression analysis. The model can simultaneously estimate the relationship between observation variables and potential variables and between different potential variables. Observed variables are indicators that are directly measurable (Table 4), while latent variables are theoretical constructs that are derived from one or more observed variables. The PLS-SEM model includes a measurement model, which consists of both latent and observed variables, and a structure model, which reflects the relationships among different latent variables through a path diagram. This is represented by the following formula:
X = Λ x ξ + δ
Y = Λ y η + ε
where ξ represents an exogenous latent variable matrix, X is the measurement variable matrix of ξ, and Λx is the measurement variable X and the exogenous potential variable matrix ξ. δ is the equation residual matrix, η is the matrix of endogenous latent variables, Y is the measured variable matrix of η, Λy is the measurement coefficient matrix of the relationship between η and Y, and ε is the residual matrix of the equation.
A structural model (or internal model) is a path diagram demonstrating the relationship between different latent variables and is represented by the following formula:
η = B η + Γ ξ + ς
where ξ is an exogenous latent variable, η is the endogenous latent variable, B is the coefficient matrix of the endogenous latent variable, Γ is the coefficient matrix of exogenous latent variable, and ζ is the residual of the equation.
Table 4. Composition of observed and potential variables in PLS-SEM model.
Potential VariablesObserved VariableObservation Year
TerrainHight2010
Slope2010
Climate changePrecipitation (PRE)2000, 2008, 2015, 2010
Temperature (TEM)2000, 2008, 2015, 010
SoilSoil water pH (PH)2000
Soil organic carbon (SOC)2000
Human activitiesThe population density (POP)2000, 2008, 2015, 2010
Land use index (LUI)2000, 2008, 2015, 2010
Night light index (NLI)2000, 2008, 2015, 2010
RSEI changeRSEI2000, 2008, 2015, 2010
Ten indicators such as height, slope, precipitation (PRE), temperature (TEM), TOC, population (POP), land use index (LUI), night light index (NLI), and PH were used as observed variables (Table 3). Topographic features, climate, soil characteristics, and urbanization construction were used as potential variables. A total of 5000 random points were extracted by ArcGIS as the sample dataset of PLS-SEM to study the drivers of ecological changes.

3. Results and Analysis

3.1. Principal Component Analysis Results of RSEI Model

By utilizing ENVI (5.3) software and Landsat image data, four ecological indicators were extracted: greenness (NDVI), humidity (WET), heat (LST), and dryness (NDBSI). To produce the Remote Sensing Ecological Environment Index (RSEI), ArcGIS10.2 software was utilized to perform PCA on the four ecological indicators. The contribution rates of the PC1 eigenvalues were 74.07%, 73.62%, 82.17%, and 77.34% in the years 2000, 2008, 2015, and 2019 (Table 5), indicating that PC1 concentrated the feature information. Guyuan City’s RSEI construction is valid based on PC1. Positive effects on the overall environmental quality were indicated by NDVI and WET in PC1, whereas negative effects were indicated by heat and dryness in PC1. These results are consistent with previous studies [2,19].

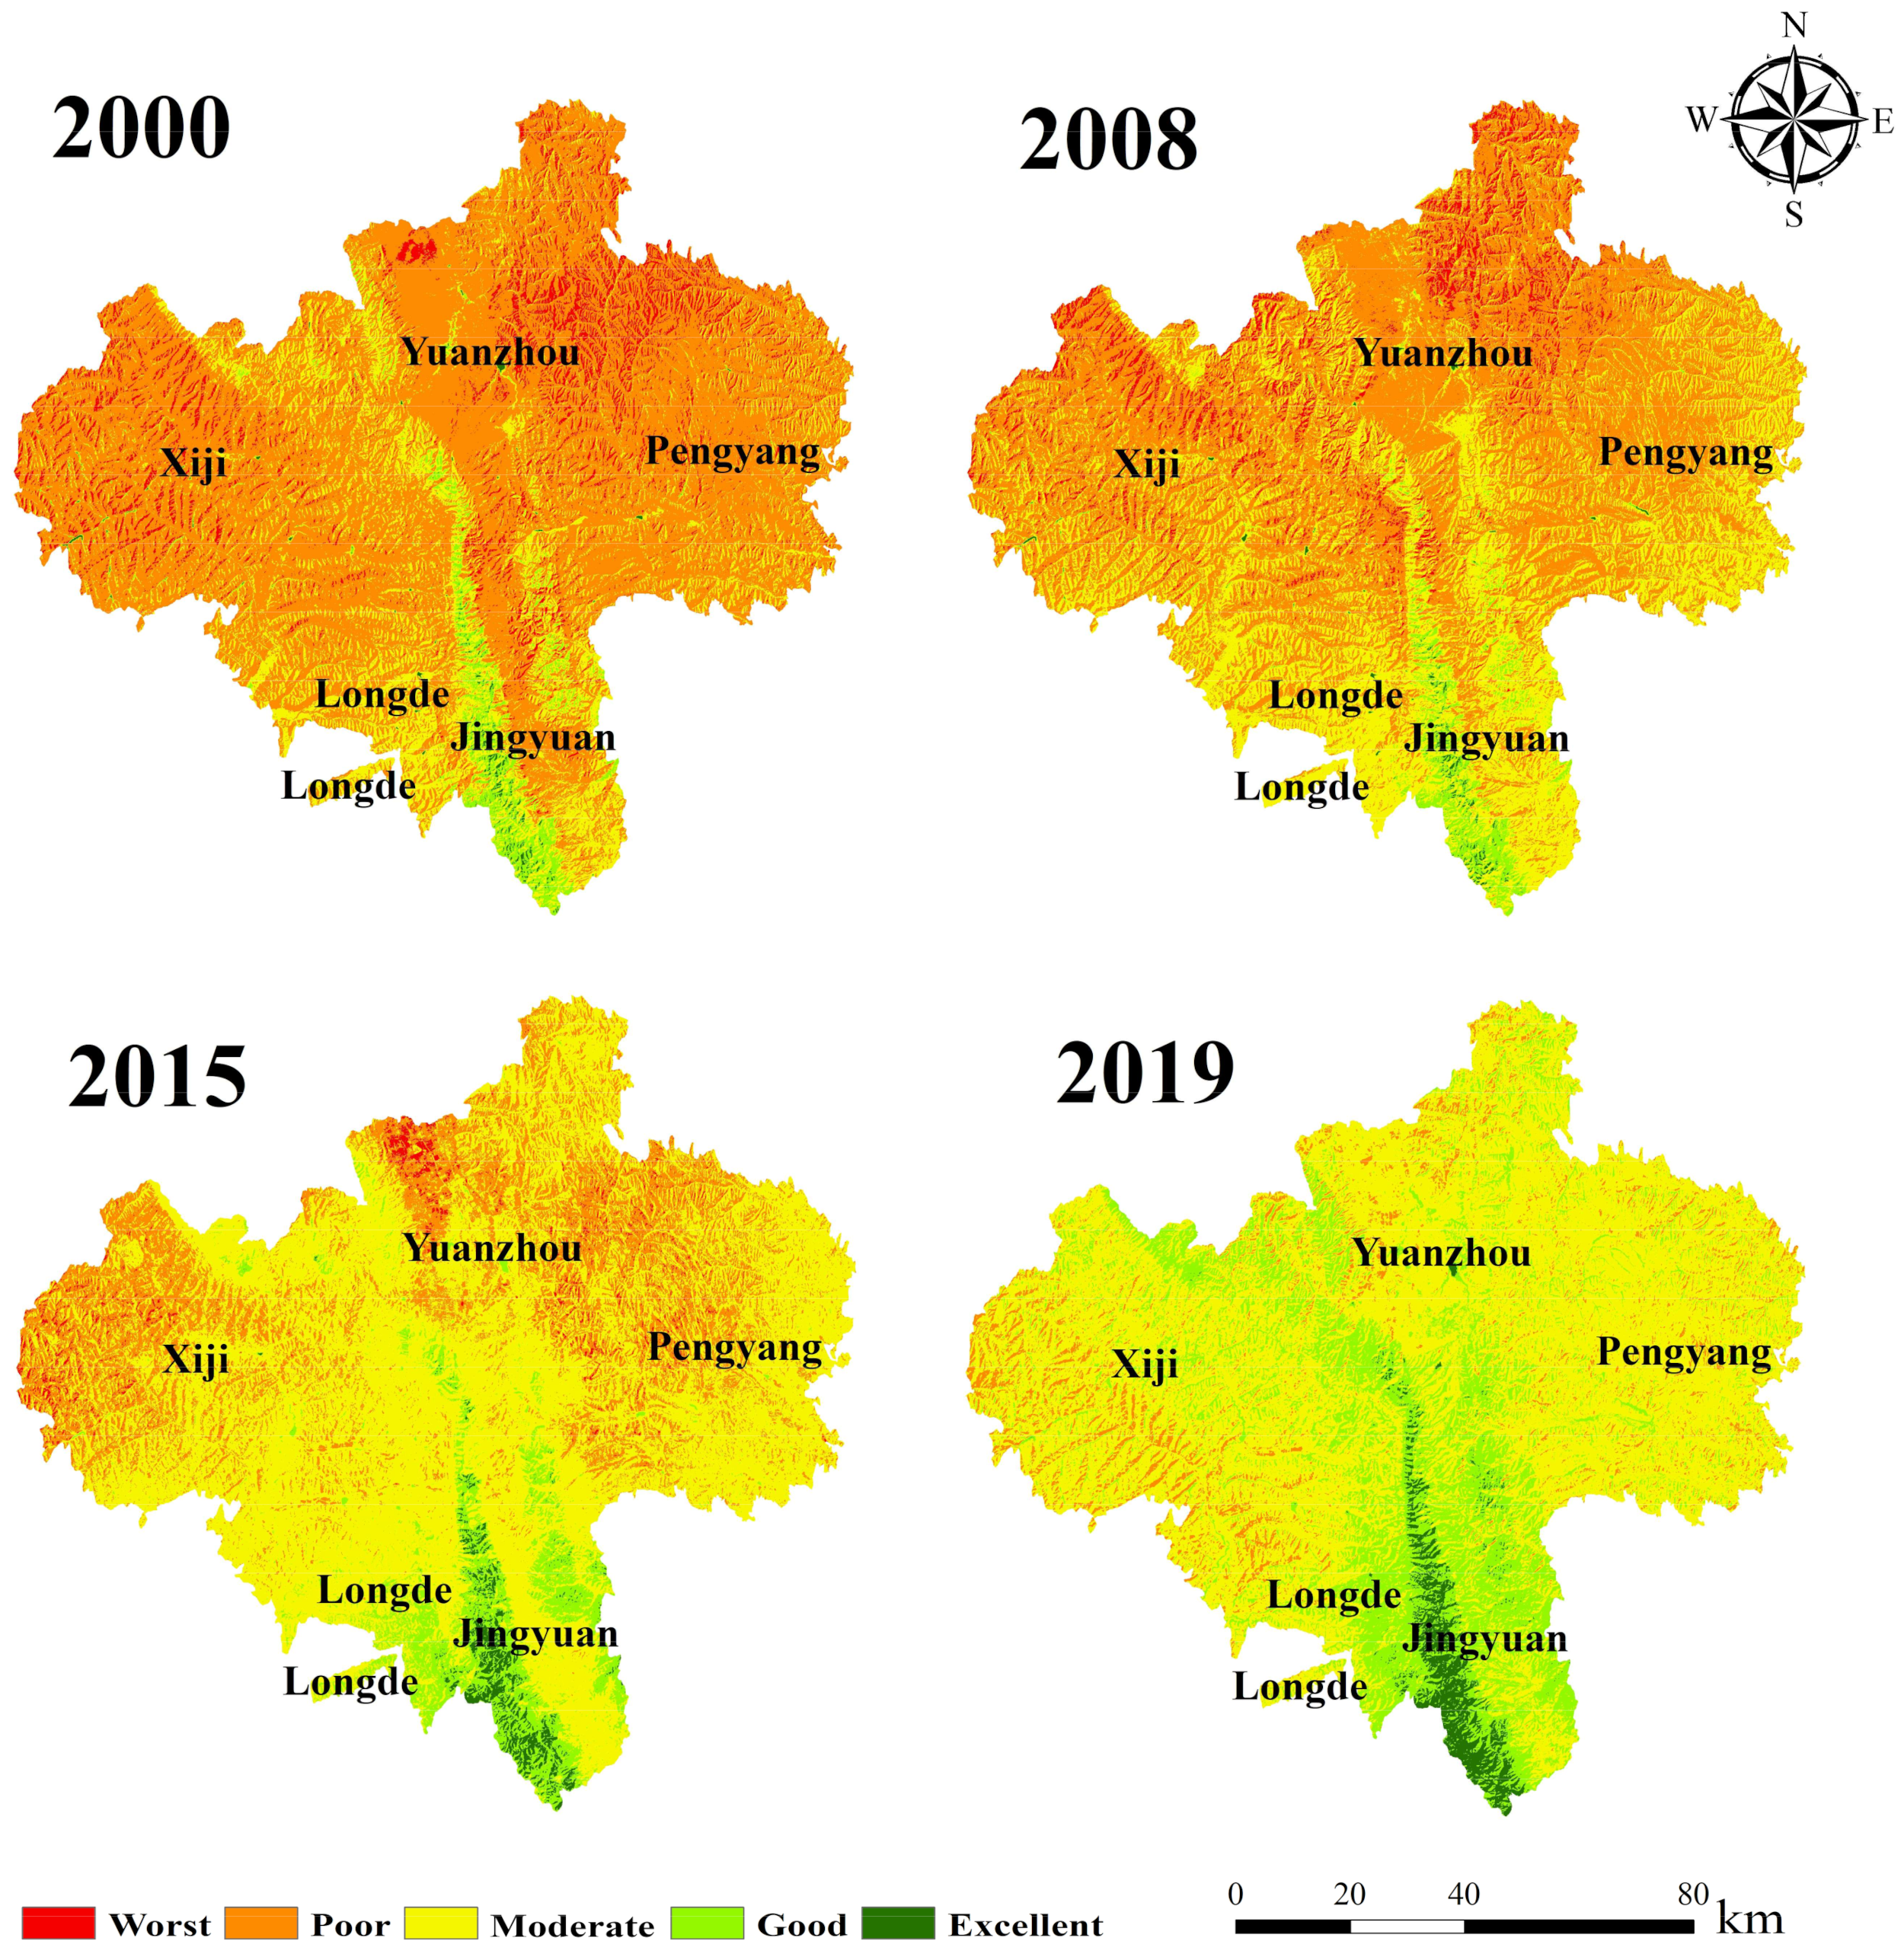
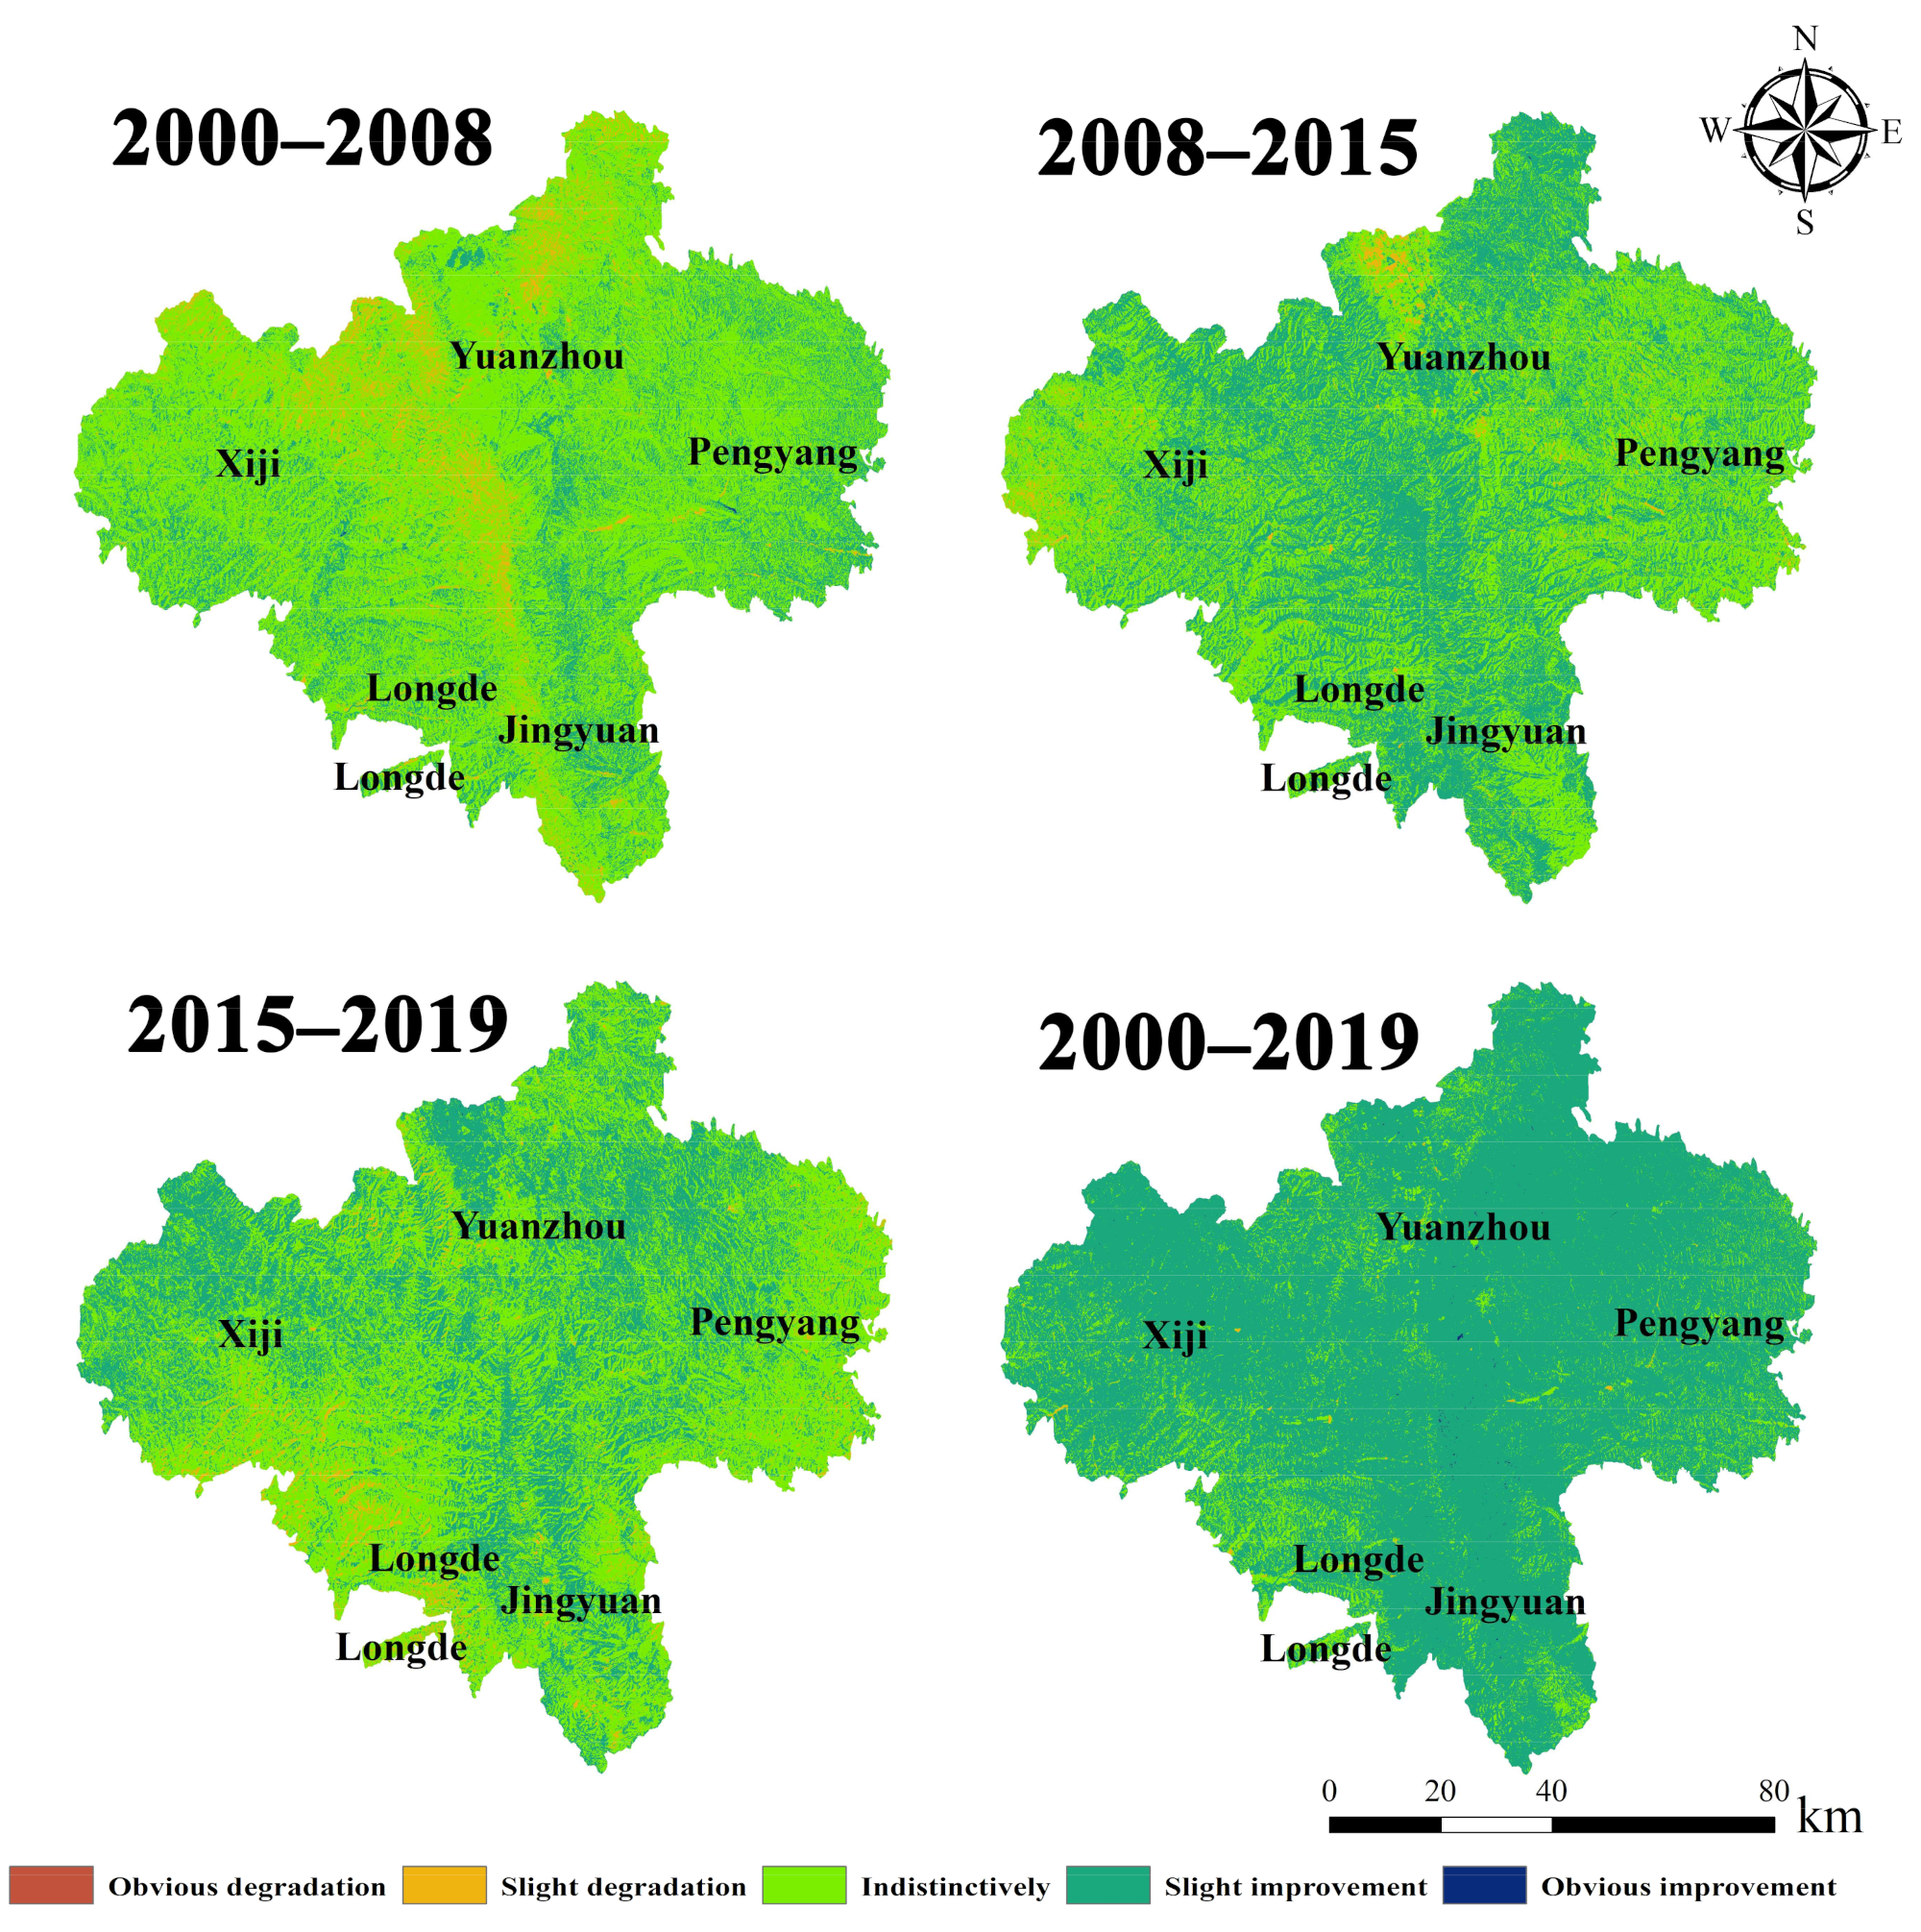
3.2. Spatial and Temporal Distribution Characteristics of Ecological Environment Quality

Figure 3 and Table 6 illustrate the results of ecological environment levels obtained by classifying the RSEI into five levels through the classification tool in ArcGIS. In 2000, the overall ecological environment quality of Guyuan City was low and had the lowest levels, accounting for 6.93% and 71.26%. The lowest areas were concentrated in the junction of Yuanzhou District and Pengyang county. Only part of Jingyuan county and the Liupan Mountains area was rated good and excellent. This area accounted for 2.71% and 0.31%, and the eastern ecological quality was lower than the western region. Although the ecological quality of the region in 2008 was still low compared with 2000, Pengyang county’s ecological environment has improved significantly. The ecological state of the intermediate area accounted for a significant increase and was primarily distributed in Longde county and Jinyuan county. In 2015 and 2019, the ecological environment in Guyuan City improved overall. This area was at a moderate ecological environment level of 65.74% and 68.32%, with the exception of Xiji County, Yuanzhou District, and a few other sporadic areas. The ecological environment quality was at a medium level and in 2019, reached a good level at 25.14%, and was primarily distributed in central Guyuan City.
RSEI differences in 2000, 2008, 2015, and 2019 were calculated. The results were classified into five categories: obvious degradation (range of difference: −4–−3), slight degradation (−2–0), indistinct (0), slight improvement (1–2), and obvious improvement (3–4). Results, presented in Figure 4, show that the ecological environment of Guyuan City improved overall during 2000–2019, and the improvement area accounted for 88.23% of the total study area. During 2000–2008, the ecological improvement area was 2365.32 km2, accounting for 22.49% of the total area of the study area, mainly concentrated in Panyang county and Jinyuan county, and the ecological significant deterioration area was 598.3 km2, accounting for 5.68% of the total study area, mainly concentrated in Xiji county and Yuanzhou district. From 2008 to 2015, influenced by the policy of returning farmland to forest and closing mountains to grazing, except for the northern sporadic region of Yuanzhou district, the ecological environment of the city showed improvement, accounting for 48.7% of the study area. The area of ecological deterioration was 215 km2, accounting for 2.05% of the total study area. From 2015 to 2019, the area of ecological degradation slightly increased due to the rapid development of urbanization construction, accounting for 2.93% of the total study area. Therefore, the status quo conditions for the coordination of ecological restoration and urbanization construction is the key to sustainable development.

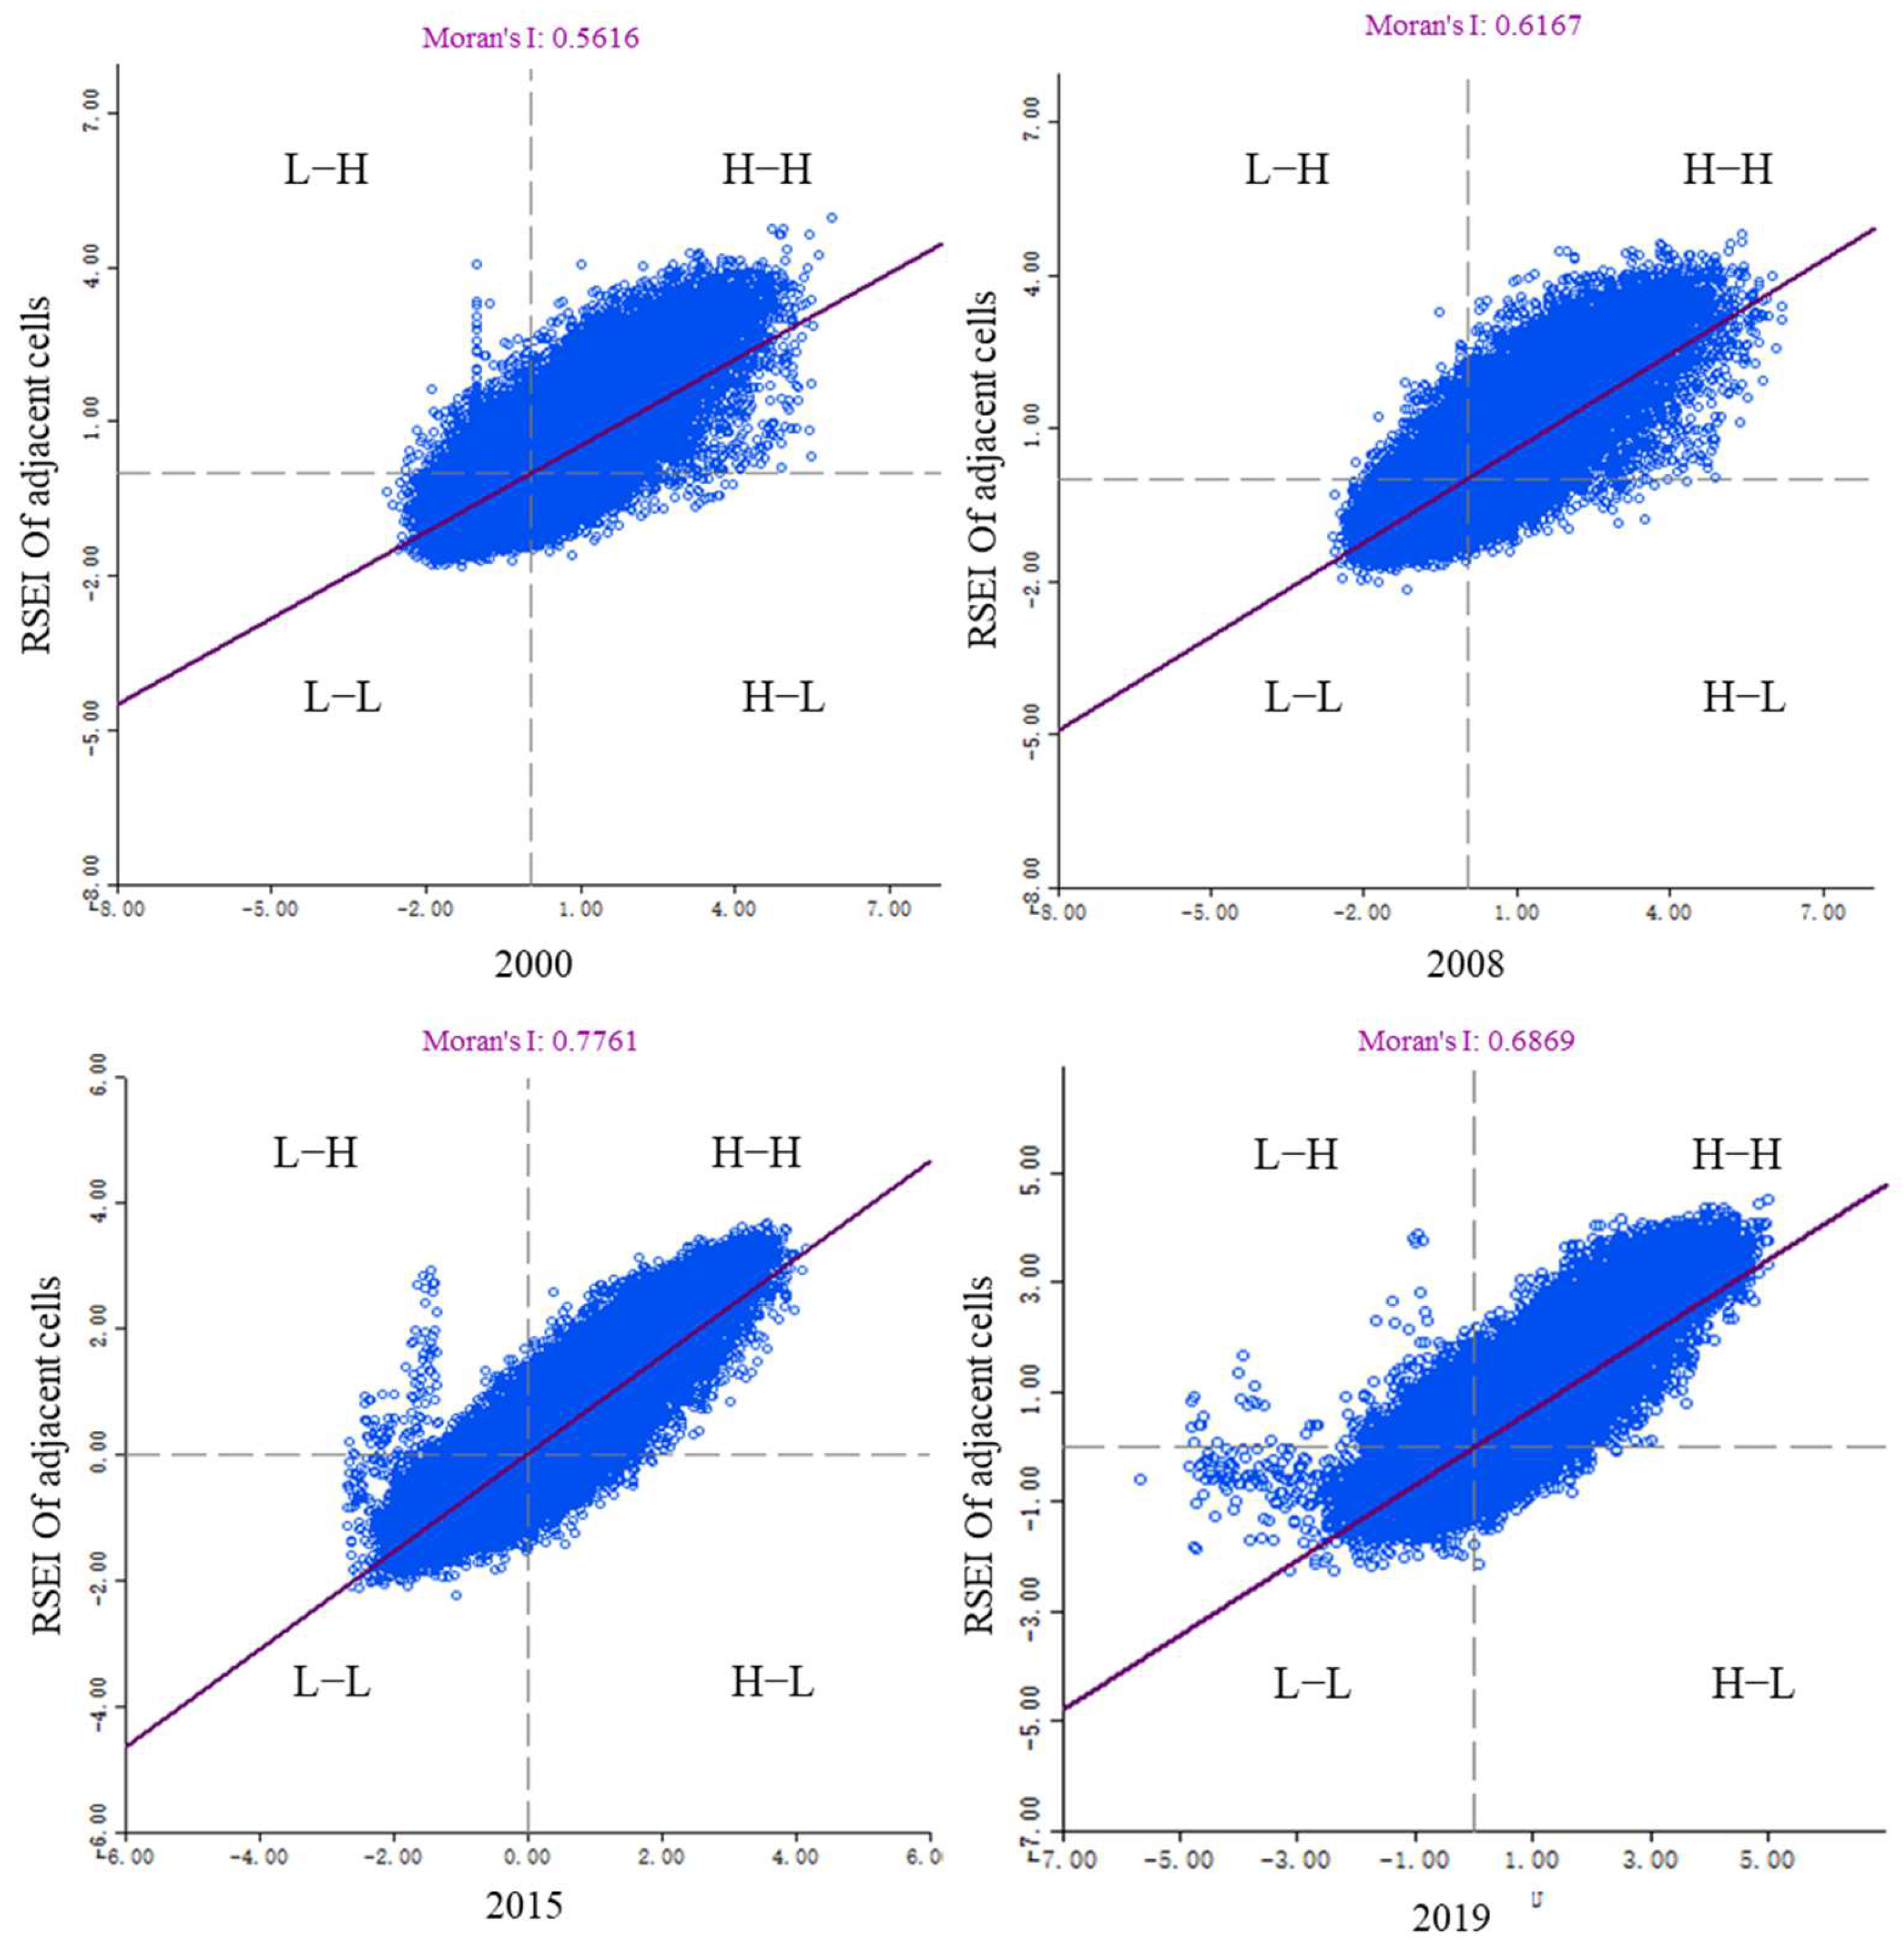
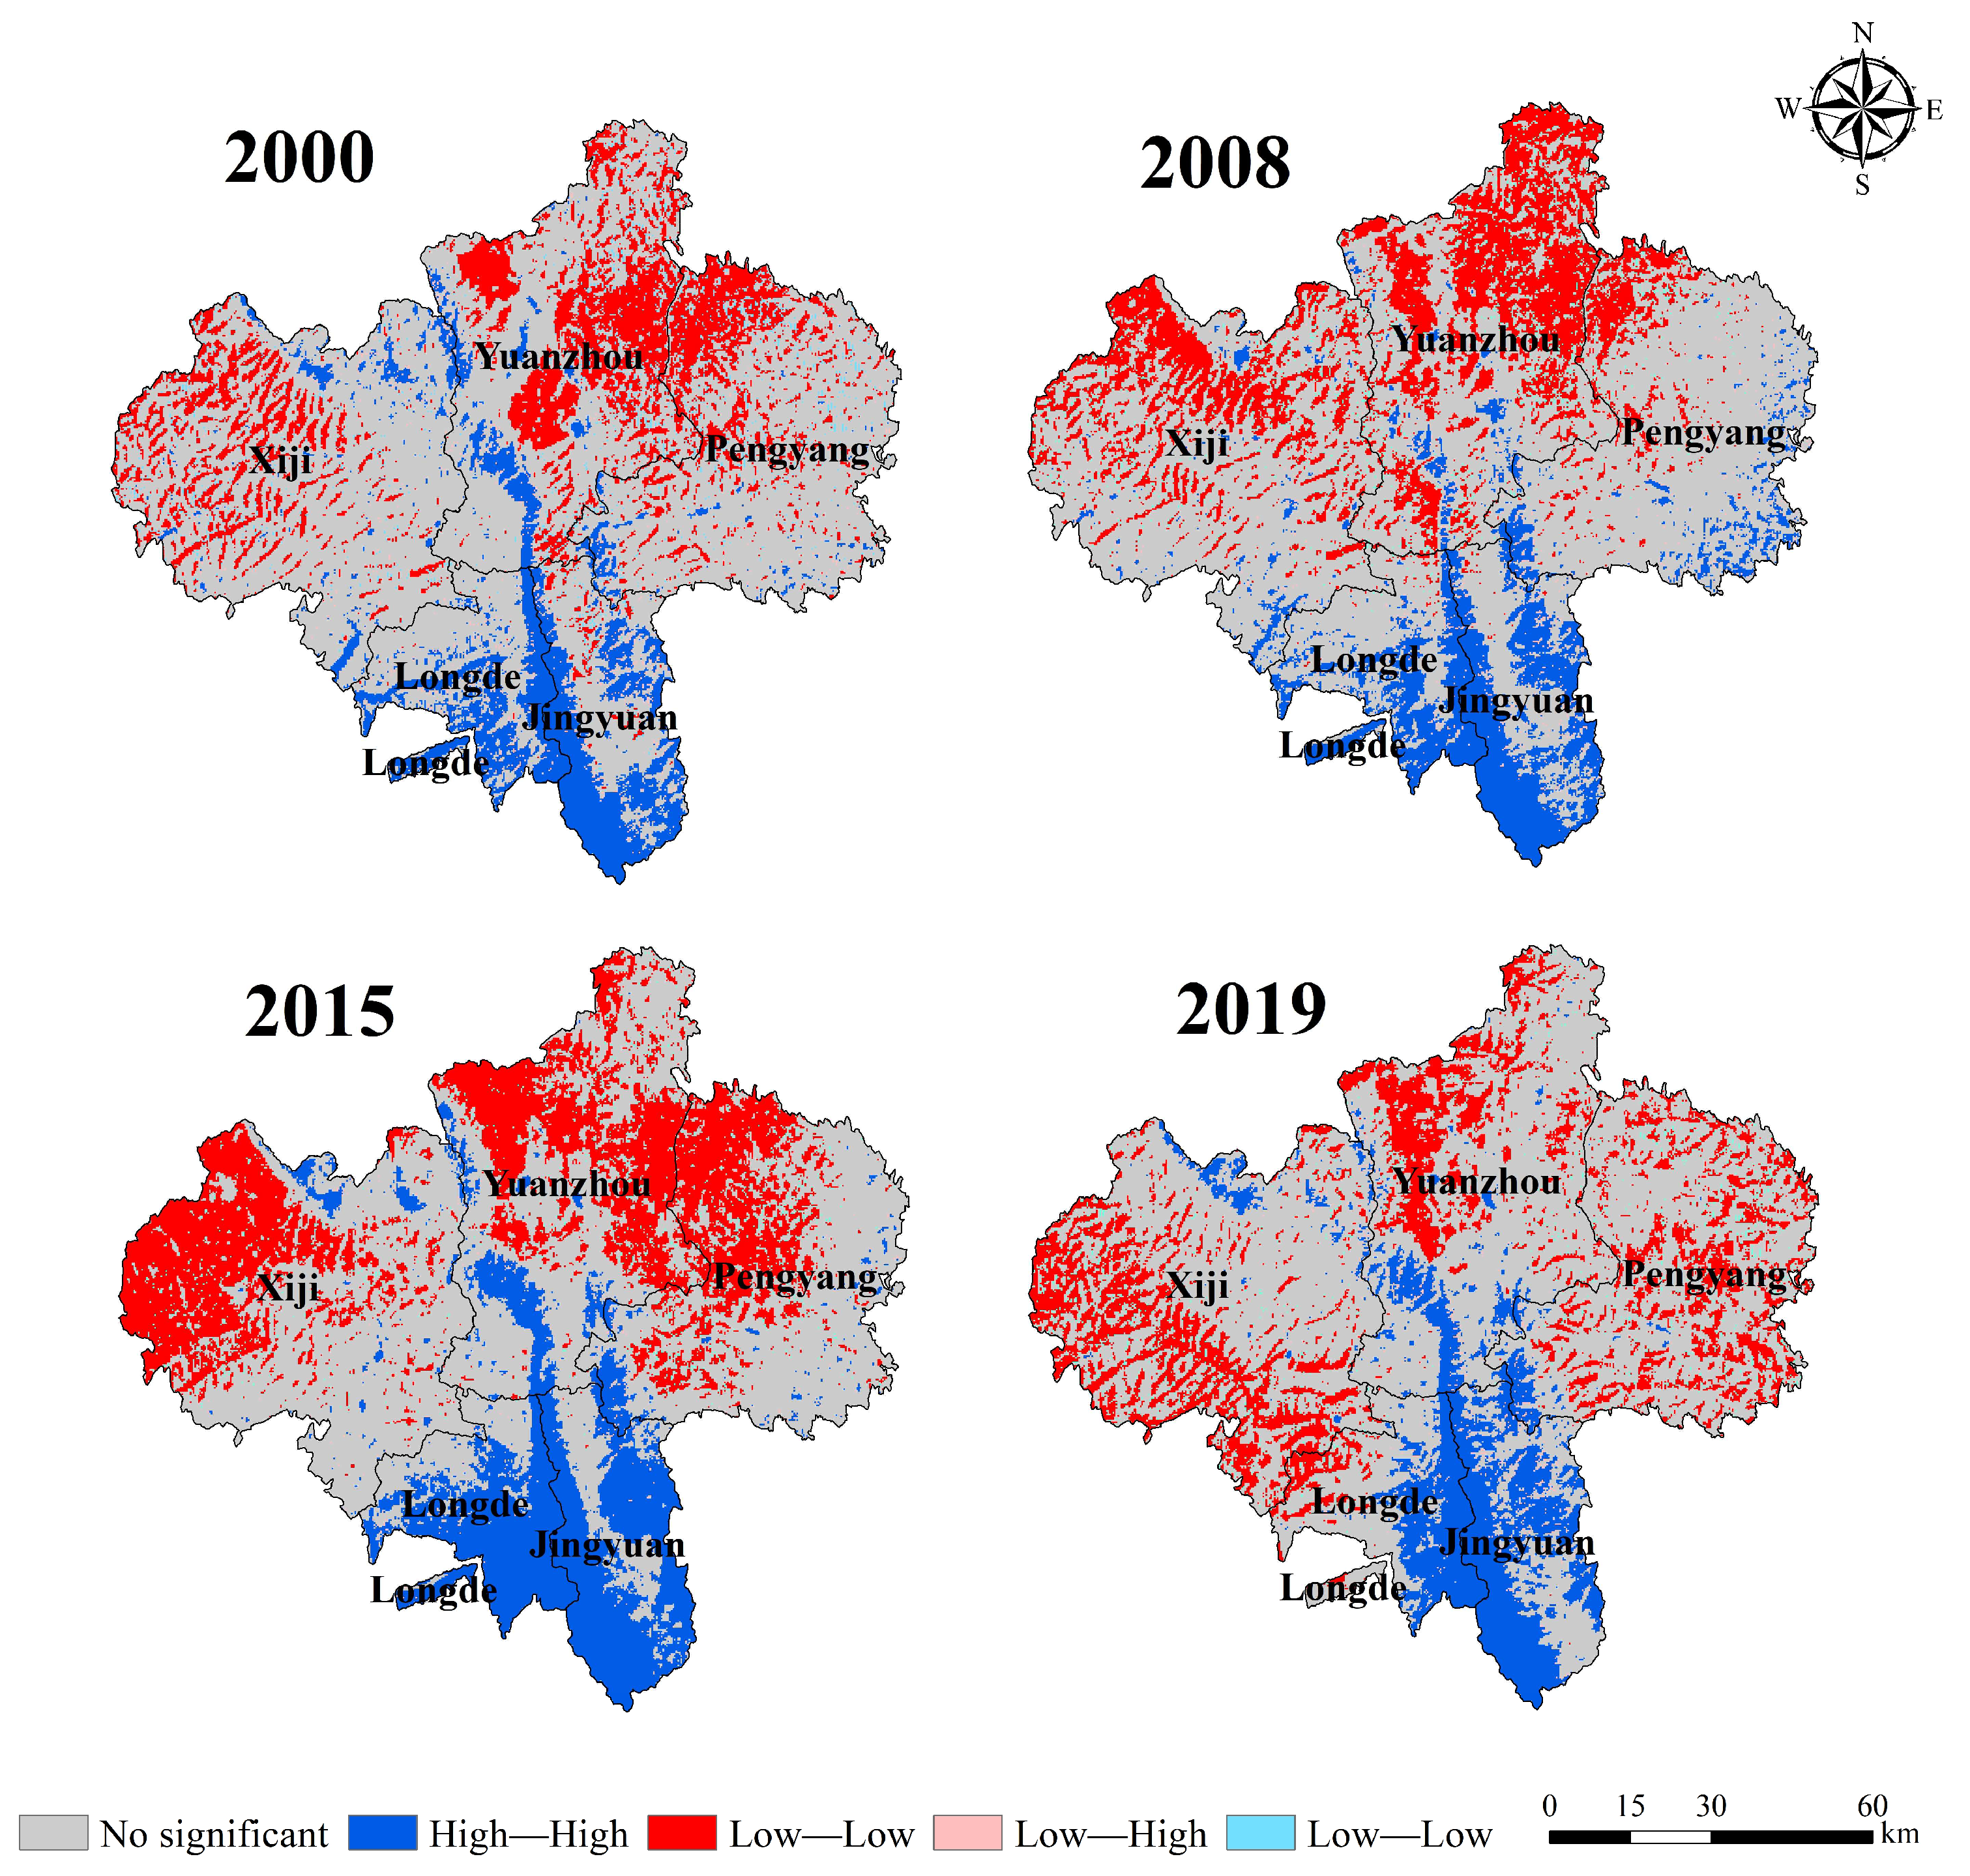
3.3. Spatial Autocorrelation Analysis of Ecological Environment Quality

Moran’s I index was used to perform the spatial autocorrelation analysis of Guyuan City’s RSEI. Results, shown in Figure 5, display the Moran’s I scatter plot of RSEI during 2000–2019. The plot shows a strong positive spatial correlation concentrated in the first and third quadrant of the coordinate axis. The global Moran’s I index was 0.561, 0.616, 0.776, and 0.686 in 2000, 2008, 2015, and 2019, respectively, indicating an aggregation phenomenon in the spatial distribution of ecological environmental quality during those years.
The local spatial autocorrelation aggregation map (Figure 6) depicted the “High-High” aggregation area of Guyuan City’s ecological environment index from 2000 to 2019, which was concentrated in the Liupan Mountain area in the south of Guyuan City. The “High-High” aggregation area shows a slow rising trend. The more significant change was in the “Low-Low” aggregation area, concentrated in the junction of the northern part of Penyang county and Yuanzhou district in 2000, which shifted to the northern part of Yuanzhou district in 2008. The “Low-Low” aggregation area gradually shifted from Pengyang county in the east of Guyuan City to Xijilongde and other places in the west in 2015 and 2019. This change reveals that the effectiveness of ecological and environmental management in the eastern part of Guyuan City is significantly greater than that in the western part. However, the low-value areas of RSEI gradually change from high-clustering distribution to significant discrete distribution.

3.4. Factors Influencing the Quality of the Ecological Environment

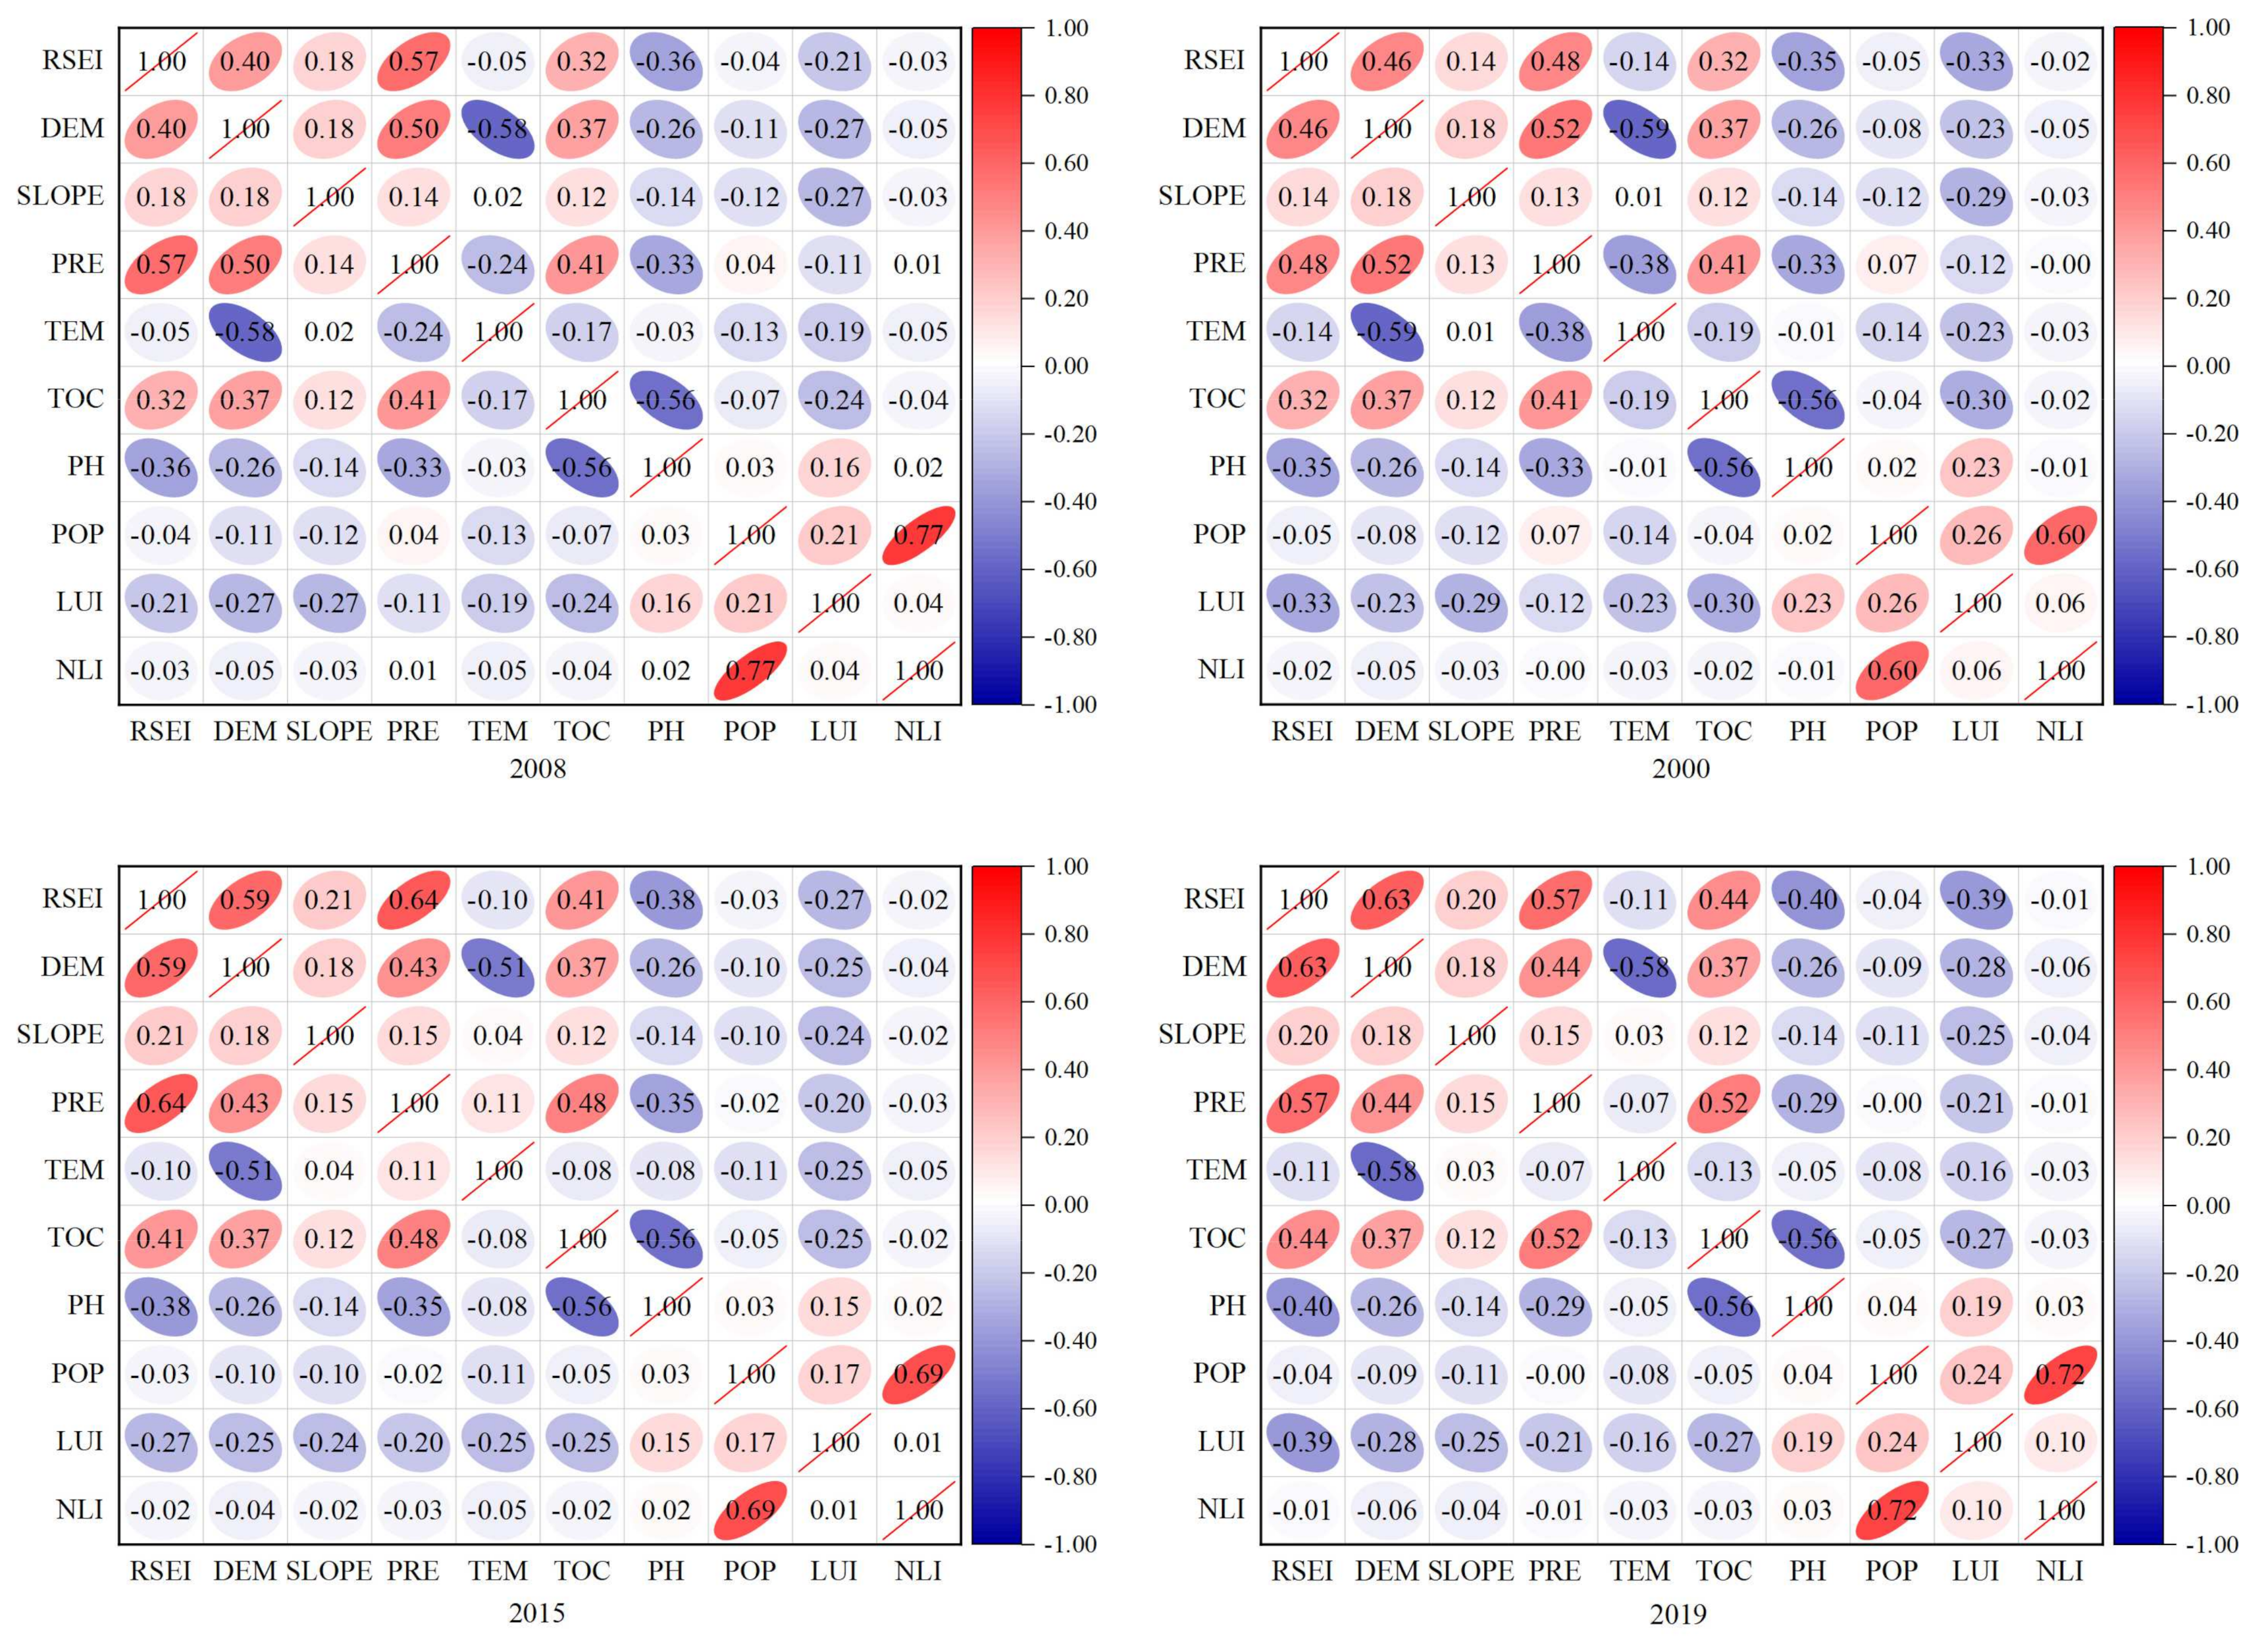
3.4.1. Correlation Analysis of Influencing Factors of Ecological Environment Quality

The factor correlation analysis with the changes in RSEI during 2000–2019 is shown in Figure 7. Results reveal that altitude, PRE, and TOC are significantly and positively correlated with RESI. Indicators with significantly negative correlations were TEM, LUI, and PH. Over time, the correlation between the above six indicators and the RSEI gradually increased. In addition, we found that: (1) Elevation is significantly and positively correlated with rainfall and negatively correlated with temperature; (2) TOC is significantly and positively correlated with elevation, and pH is significantly and negatively correlated with elevation; and (3) LUI is significantly and negatively correlated with height, slope, PRE, and TOC. This indicates that with the development of urban construction, the land use of Guyuan City has been changed, and some areas have been damaged by human activities. Higher-altitude mountainous areas are relatively untouched by human activities and have better ecological environment quality.

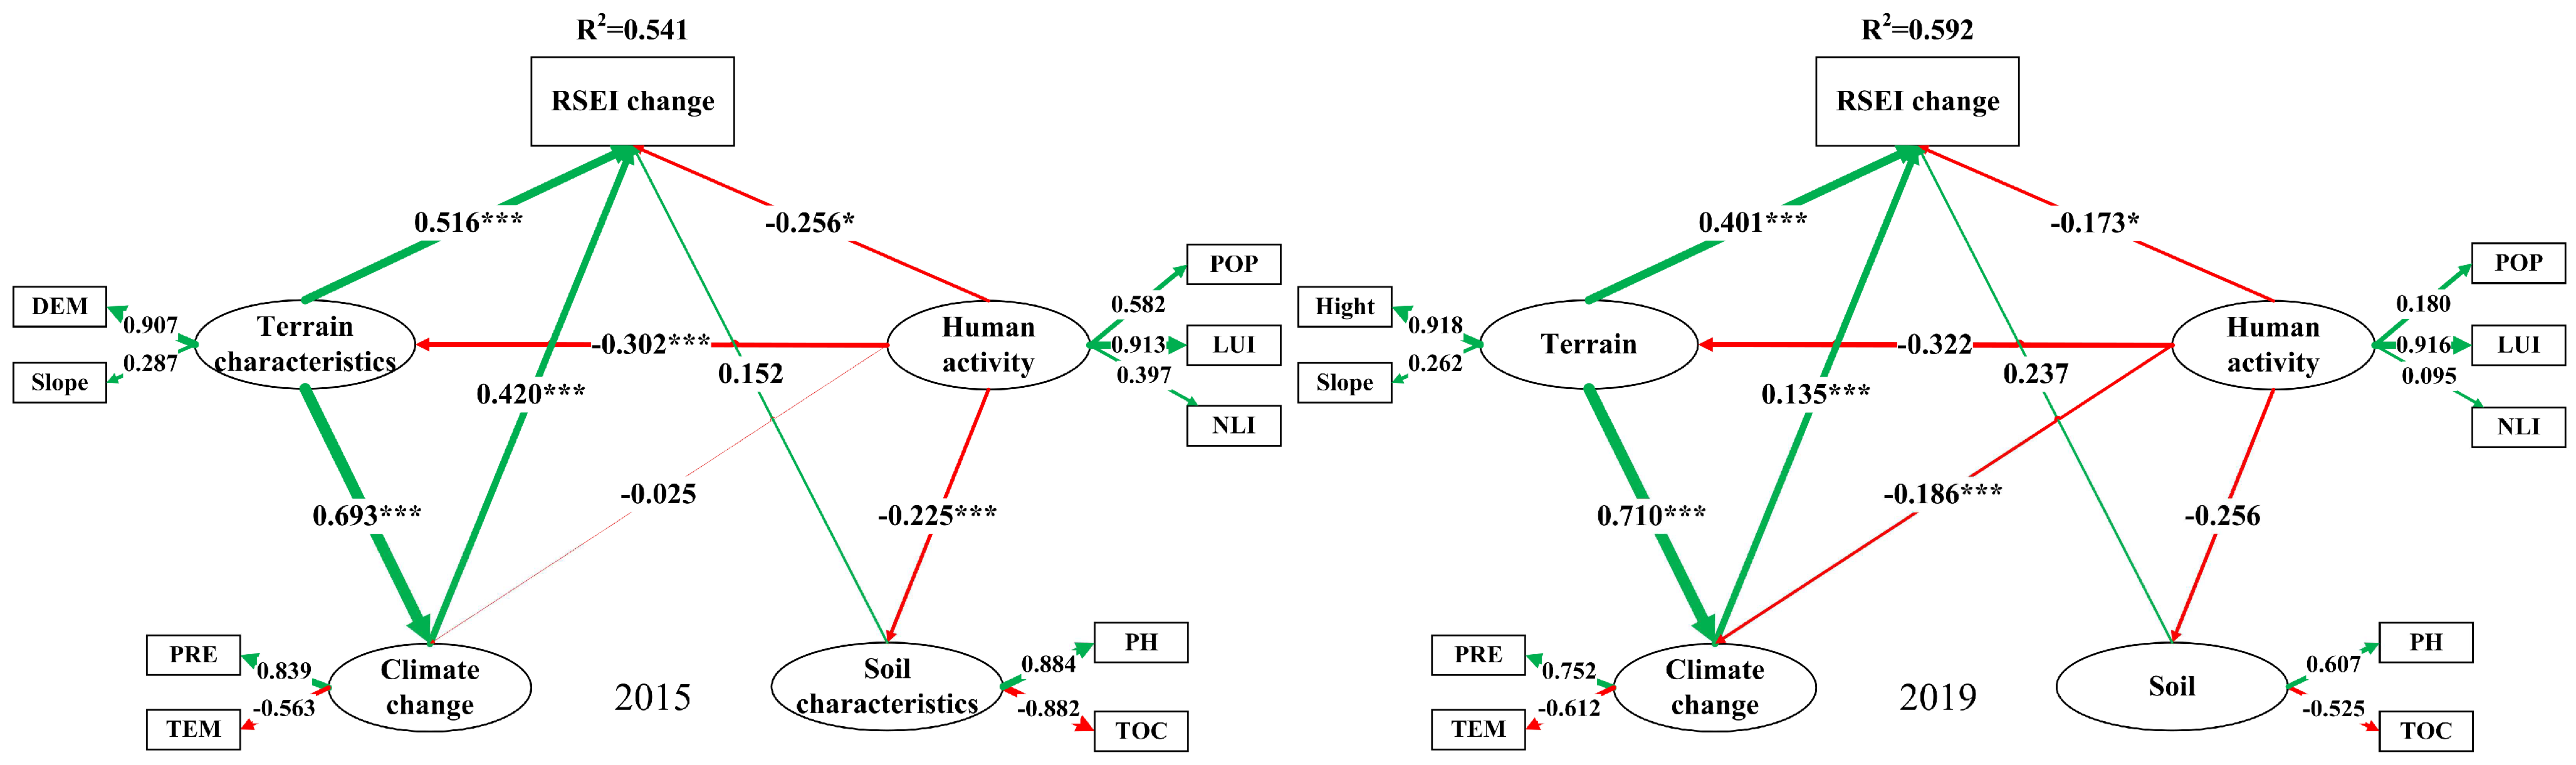
3.4.2. Evolutionary Patterns of Factors Influencing Ecological Environment Quality

To evaluate the extent of multicollinearity among the influencing factors, we employed the variance inflation factor (VIF). As indicated in Table 7, the VIF test results revealed that the VIF values of all variables under investigation were between 1 and 3, indicating the absence of covariance among the impact factors. The observed models for the four latent variables of climate urbanization, soil properties, and topographic characteristics were tested for reliability validity (Table 8). The SEM consistency was tested using combined reliability (CR). Typically, a CR value of 0.6 or higher indicates a credible model. We used the average variance (AVE) to assess the convergent validity of the measurement model, which should be greater than 0.5. From 2000 to 2019, the CR and AVE values of the constructed model were greater than 0.6 and 0.5, indicating that the SEM has good internal consistency and external independence. This suggests that the SEM and the selection of indicators are reasonable.
Topographic features, climate change, soil properties, and human activities all influenced the RSEI in different ways during 2000–2019. Figure 7 displays the SEM of Guyuan City’s ecological environmental quality index. The explanatory power of the model was 0.637, 0.602, 0.541, and 0.592 during the four study periods in 2000, 2008, 2015, and 2019, respectively. Topographic features and climate change consistently had a positive effect on the RSEI, suggesting they contributed to the improvement in the ecological environment in Guyuan City. Specifically, an increase in height, slope, and precipitation, along with a decrease in temperature, all led to a better ecological environment quality. On the other hand, human activities had a negative impact on RSEI and significantly limited the ecological environment’s recovery in Guyuan City. However, over time, the negative effect of human activities on RSEI gradually decreased from −0.314 to −0.173, indicating that urbanization’s restriction on the ecological environment reduced over time. The effect of soil properties on the ecological environment can be parsed into four stages. The total effect of soil on the RSEI was 0.172 and −0.212 in 2000 and 2008. The total effect of soil on the RSEI was 0.152 and 0.237 in 2015 and 2019. This change can be explained by the change in the total effect of human activities on soil. The four stages of total effect were 0.280, 0.216, −0.225, and −0.256, respectively. The positive effect of human activities on soil in 2000 and 2008 contributed to the negative impact of soil characteristics on the ecological environment. In contrast, the effect of human activities in 2015 and 2019 on the soil properties had a positive impact on the ecological environment (see Figure 8).

4. Discussion

4.1. Spatial Differentiation of Ecological Environment Quality and Driving Mechanisms

Utilizing Landsat remote sensing data and the Remote Sensing Ecological Environment Index (RSEI), a systematic analysis of the ecological environment quality in Guyuan City was carried out. The RSEI assesses the ecological environment quality from a macroscopic viewpoint, analyzing large-scale data and offering recommendations for ecological environment construction [37]. Results show that the greenness (NDVI) and humidity (WET) indices had a positive impact on the RSEI. Similar to previous studies, heat (LST) and dryness (NDBSI) indices negatively impacted RSEI. The enhancement in ecological environment quality in Guyuan City was primarily due to the enforcement of the foresting farmland policy and soil and water conservation. The results of the first principal component (Table 3) show that the NDVI eigenvalue were 0.357 in 2015 and 0.286 in 2019, indicating that improvement was reliant on vegetation restoration. In addition, limited water resources were the primary constraint of local ecological environment construction. Therefore, the influence of soil moisture, precipitation, and other factors related to water retention measures are important to consider when constructing ecological environments. From RSEI, the degree of aggregation for low-value areas changes from high-cluster distribution to low-cluster distribution. This suggests that the ecological environment construction in Guyuan City has been effective in the 20 years studied. However, it also reveals that the faceted measures should be changed to patch construction and that more targeted measures are needed [2].
The synergistic effects of urbanization construction and natural factors such as topographic features, climate change, and soil characteristics have impacted the spatial differentiation of ecological quality environment in Guyuan City. This research and other studies have shown that high urbanization rates and rapid industrial development can easily cause ecological damage [38,39], leading to issues such as vegetation degradation, soil erosion, and air pollution. In response, we propose that ecological restoration measures be implemented as policy to benefit for people’s livelihood [40]. Since the beginning of the 21st century, Guyuan City has implemented soil and water conservation measures during periods of rapid development, resulting in improved soil characteristics that positively impact the ecological environment. Organic carbon content increased and pH became more suitable for local crop growth [41]. Areas with higher altitudes and humidity provide ideal conditions for ecological restoration. The stronger the ability for ecological restoration, the higher the quality of the ecological environment.

4.2. Future Research Directions

This study shows that urbanization construction significantly influences the ecological environment quality directly or indirectly by influencing topographic features, climate change, and soil characteristics. As urban areas continue to expand, effective ecological management becomes increasingly challenging. Therefore, in future research, how to coordinate the relationship between natural conditions and human activities, reasonably plan the land use pattern, improve the soil environment, and restore the ecological environment according to local conditions becomes the key to sustainable development. We can use experimental analysis of small-scale areas such as counties or watersheds to further analyze soil physical and chemical properties of different land use types in the study area, as well as habitat quality, in order to provide guidance for future watershed precision management. The results of this study are applicable to loess hilly areas and similar regions and provide a strong theoretical basis for their regional state environmental management.

5. Conclusions

The following conclusions resulted from this study through analyzing the changes affecting the ecological environment during urbanization and its driving factors:
  • During 2000–2019, the overall ecological environment of Guyuan City continued to improve, with the ecological improvement area accounting for 88.23% of the total study area. However, due to the rapid development of urbanization construction, the ecological deterioration area increased slightly in 2019 compared with 2015, accounting for 2.93% of the total study area, mainly located in Xiji and Lund counties in the western part of the study area;
  • The spatial autocorrelation results show that the “high-high” agglomerations (high ecological environment and high human activity index) are concentrated in the Liupan Mountain area; the “low-low” agglomerations are mainly located in Xiji county and the urban area of Yuanzhou district. The low value of the RSEI index gradually changes from high-clustering distribution to significant discrete distribution, and the difficulty of ecological environment management increases;
  • The results showed the reliability of the PLE-SEM model used to reveal the influencing factors of the ecological environment. Elevation and rainfall show a significant positive correlation with the RSEI index, temperature and LUI show a significant negative correlation to the RSEI index, and the degree of correlation is gradually increasing. Topography and climate change have a positive impact on ecological changes, with urbanization becoming less limiting for ecological improvements.
The RSEI and PLS-SEM were used in this study to thoroughly examine the impact of urbanization and natural surroundings on the quality of the ecological environment in Guyuan City. The findings from this study offer valuable insights for implementing effective eco-environmental construction measures under different complex conditions.

Author Contributions

Conceptualization, H.L.; Methodology, J.H. and P.L.; Formal analysis, B.Z. and J.H.; Investigation, Y.F., B.H., G.Z. and J.L.; Resources, B.H., G.Z. and J.L.; Data curation, Y.F. and J.L.; Writing – original draft, B.Z. and J.H.; Writing – review & editing, B.Z. and P.L.; Supervision, H.L.; Funding acquisition, G.Z. All authors have read and agreed to the published version of the manuscript.

Funding

This research was funded by [National Natural Science Foundation of China] grant numbers [U2040208, 42007070, and 42277359], [Key Laboratory Project of Shaanxi Provincial Education Department] grant number [20JS100], and [Shaanxi Province Innovation Capability Support Plan in 2022] grant number [2022KJXX-86], [Shaanxi Province Water Conservancy Science and Technology Project] grant number [2021slkj-10].

Institutional Review Board Statement

Not applicable.

Informed Consent Statement

Not applicable.

Data Availability Statement

Not applicable.

Acknowledgments

We would like to thank Joseph Elliot at the University of Kansas for her assistance with English language and grammatical editing of the manuscript.

Conflicts of Interest

The authors declare no conflict of interests.

References

  1. Liu, H.; Fang, C.; Zhang, X.; Wang, Z.; Bao, C.; Li, F. The effect of natural and anthropogenic factors on haze pollution in Chinese cities: A spatial econometrics approach. J. Clean. Prod. 2017, 165, 323–333. [Google Scholar] [CrossRef]
  2. An, M.; Xie, P.; He, W.J.; Wang, B.; Huang, J.; Khanal, R. Spatiotemporal change of ecologic environment quality and human interaction factors in three gorges ecologic economic corridor, based on RSEI. Ecol. Indic. 2022, 141, 109090. [Google Scholar] [CrossRef]
  3. Fu, Y.; Shi, X.; He, J.; Yuan, Y.; Qu, L. Identification and optimization strategy of county ecological security pattern: A case study in the Loess Plateau, China. Ecol. Indic. 2020, 112, 106030. [Google Scholar] [CrossRef]
  4. Liu, D.; Cao, C.; Dubovyk, O.; Tian, R.; Chen, W.; Zhuang, Q.; Zhao, Y.; Menz, G. Using fuzzy analytic hierarchy process for spatio-temporal analysis of eco-environmental vulnerability change during 1990–2010 in Sanjiangyuan region, China. Ecol. Indic. 2017, 73, 612–625. [Google Scholar] [CrossRef]
  5. Li, J.; Yan, X.; Yan, X.; Guo, W.; Wang, K.; Qiao, J. Temporal and spatial variation characteristic of vegetation coverage in the Yellow River Basin based on GEE cloud platform. J. China Coal Soc. 2021, 46, 1439–1450. [Google Scholar]
  6. Fan, T.Y.; Wang, S.; Wang, X.M.; Chen, X.Y. Optimization effect of ecological restoration based on high-resolution remote sensing images in the ecological construction of soil and water conservation. J. Ambient. Intell. Humaniz. Comput. 2021, 13, 87. [Google Scholar] [CrossRef]
  7. Skogen, K.; Helland, H.; Kaltenborn, B. Concern about climate change, biodiversity loss, habitat degradation and landscape change: Embedded in different packages of environmental concern? J. Nat. Conserv. 2018, 44, 12–20. [Google Scholar] [CrossRef]
  8. Ding, Q.; Wang, L.; Fu, M.; Huang, N. An integrated system for rapid assessment of ecological quality based on remote sensing data. Environ. Sci. Pollut. Res. 2020, 27, 32779–32795. [Google Scholar] [CrossRef]
  9. Wu, J.; Wang, X.; Zhong, B.; Yang, A.; Jue, K.; Wu, J.; Zhang, L.; Xu, W.; Wu, S.; Zhang, N.; et al. Ecological environment assessment for Greater Mekong Subregion based on Pressure-State-Response framework by remote sensing. Ecol. Indic. 2020, 117, 106521. [Google Scholar] [CrossRef]
  10. Airiken, M.; Zhang, F.; Chan, N.W.; Kung, H.-T. Assessment of spatial and temporal ecological environment quality under land use change of urban agglomeration in the North Slope of Tianshan, China. Environ. Sci. Pollut. Res. 2021, 29, 12282–12299. [Google Scholar] [CrossRef]
  11. He, F.; Gu, L.; Wang, T.; Zhang, Z. The synthetic geo-ecological environmental evaluation of a coastal coal-mining city using spatiotemporal big data: A case study in Longkou, China. J. Clean. Prod. 2017, 142, 854–866. [Google Scholar] [CrossRef]
  12. Alcaraz-Segura, D.; Lomba, A.; Sousa-Silva, R.; Nieto-Lugilde, D.; Alves, P.; Georges, D.; Vicente, J.R.; Honrado, J.P. Potential of satellite-derived ecosystem functional attributes to anticipate species range shifts. Int. J. Appl. Earth Obs. Geoinf. 2017, 57, 86–92. [Google Scholar] [CrossRef]
  13. Li, Y.; Cao, Z.; Long, H.; Liu, Y.; Li, W. Dynamic analysis of ecological environment combined with land cover and NDVI changes and implications for sustainable urban–rural development: The case of Mu Us Sandy Land, China. J. Clean. Prod. 2017, 142, 697–715. [Google Scholar] [CrossRef]
  14. Wu, S.-T.; Chen, Y.-S. Examining eco-environmental changes at major recreational sites in Kenting National Park in Taiwan by integrating SPOT satellite images and NDVI. Tour. Manag. 2016, 57, 23–36. [Google Scholar] [CrossRef]
  15. Furberg, D.; Ban, Y.; Nascetti, A. Monitoring of Urbanization and Analysis of Environmental Impact in Stockholm with Sentinel-2A and SPOT-5 Multispectral Data. Remote Sens. 2019, 11, 2408. [Google Scholar] [CrossRef]
  16. Schneider, A.; Friedl, M.A.; Potere, D. Mapping global urban areas using MODIS 500-m data: New methods and datasets based on ‘urban ecoregions’. Remote Sens. Environ. 2010, 114, 1733–1746. [Google Scholar] [CrossRef]
  17. Ivits, E.; Buchanan, G.; Olsvig-Whittaker, L.; Cherlet, M. European Farmland Bird Distribution Explained by Remotely Sensed Phenological Indices. Environ. Model. Assess. 2011, 16, 385–399. [Google Scholar] [CrossRef]
  18. Xiong, Y.; Xu, W.H.; Lu, N.; Huang, S.D.; Wu, C.; Wang, L.G.; Dai, F.; Kou, W.L. Assessment of spatial?temporal changes of ecological environment quality based on RSEI and GEE: A case study in Erhai Lake Basin, Yunnan province, China. Ecol. Indic. 2021, 125, 107518. [Google Scholar] [CrossRef]
  19. Xu, H.; Wang, M.; Shi, T.; Guan, H.; Fang, C.; Lin, Z. Prediction of ecological effects of potential population and impervious surface increases using a remote sensing based ecological index (RSEI). Ecol. Indic. 2018, 93, 730–740. [Google Scholar] [CrossRef]
  20. Xu, H.; Li, C.; Shi, T. Is the z-score standardized RSEI suitable for time-series ecological change detection? Comment on Zheng et al. (2022). Sci. Total. Environ. 2022, 853, 158582. [Google Scholar] [CrossRef]
  21. Yuan, B.; Fu, L.; Zou, Y.; Zhang, S.; Chen, X.; Li, F.; Deng, Z.; Xie, Y. Spatiotemporal change detection of ecological quality and the associated affecting factors in Dongting Lake Basin, based on RSEI. J. Clean. Prod. 2021, 302, 126995. [Google Scholar] [CrossRef]
  22. Yan, Y.B.; Chai, Z.Y.; Yang, X.D.; Zibibula, S.; Yang, S.T. The temporal and spatial changes of the ecological environment quality of the urban agglomeration on the northern slope of Tianshan Mountain and the influencing factors. Ecol. Indic. 2021, 133, 108380. [Google Scholar]
  23. Shan, W.; Jin, X.; Ren, J.; Wang, Y.; Xu, Z.; Fan, Y.; Gu, Z.; Hong, C.; Lin, J.; Zhou, Y. Ecological environment quality assessment based on remote sensing data for land consolidation. J. Clean. Prod. 2019, 239, 118126. [Google Scholar] [CrossRef]
  24. Pyles, M.V.; Magnago, L.F.S.; Maia, V.A.; Pinho, B.X.; Pitta, G.; de Gasper, A.L.; Vibrans, A.C.; dos Santos, R.M.; Berg, E.V.D.; Lima, R.A.F. Human impacts as the main driver of tropical forest carbon. Sci. Adv. 2022, 8, 7968. [Google Scholar] [CrossRef] [PubMed]
  25. Xu, G.; Cheng, Y.; Zhao, C.; Mao, J.; Li, Z.; Jia, L.; Zhang, Y.; Wang, B. Effects of driving factors at multi-spatial scales on seasonal runoff and sediment changes. Catena 2023, 222, 106867. [Google Scholar] [CrossRef]
  26. Zhao, T.; Miao, C.; Wang, J.; Su, P.; Chu, K.; Luo, Y.; Sun, Q.; Yao, Y.; Song, Y.; Bu, N. Relative contributions of natural and anthropogenic factors to the distribution patterns of nature reserves in mainland China. Sci. Total. Environ. 2022, 847, 157449. [Google Scholar] [CrossRef]
  27. Han, J.Y.; Wang, J.H.; Zhao, Y.; Wang, Q.M.; Zhang, B.; Li, H.H.; Zhai, J.Q. Spatio-temporal variation of potential evapotranspiration and climatic drivers in the Jing-Jin-Ji region, North China. Agric. For. Meteorol. 2018, 256, 75–83. [Google Scholar] [CrossRef]
  28. Gao, Y.; Zhao, J.; Han, L. Exploring the spatial heterogeneity of urban heat island effect and its relationship to block morphology with the geographically weighted regression model. Sustain. Cities Soc. 2021, 76, 103431. [Google Scholar] [CrossRef]
  29. Wang, C.; Ma, L.; Zhang, Y.; Chen, N.; Wang, W. Spatiotemporal dynamics of wetlands and their driving factors based on PLS-SEM: A case study in Wuhan. Sci. Total. Environ. 2022, 806, 151310. [Google Scholar] [CrossRef]
  30. Gou, R.; Zhao, J. Eco-Environmental Quality Monitoring in Beijing, China, Using an RSEI-Based Approach Combined with Random Forest Algorithms. IEEE Access 2020, 8, 196657–196666. [Google Scholar] [CrossRef]
  31. Jiang, M.; He, Y.; Song, C.; Pan, Y.; Qiu, T.; Tian, S. Disaggregating climatic and anthropogenic influences on vegetation changes in Beijing-Tianjin-Hebei region of China. Sci. Total. Environ. 2021, 786, 147574. [Google Scholar] [CrossRef]
  32. Liu, C.; Wang, C.; Li, Y.; Wang, Y. Spatiotemporal differentiation and geographic detection mechanism of ecological security in Chongqing, China. Glob. Ecol. Conserv. 2022, 35, e02072. [Google Scholar] [CrossRef]
  33. Cortizas, A.M.; Horák-Terra, I.; Pérez-Rodríguez, M.; Bindler, R.; Cooke, C.A.; Kylander, M. Structural equation modeling of long-term controls on mercury and bromine accumulation in Pinheiro mire (Minas Gerais, Brazil). Sci. Total. Environ. 2021, 757, 143940. [Google Scholar] [CrossRef] [PubMed]
  34. Sobral, M.; Silvius, K.M.; Overman, H.; Oliveira, L.F.B.; Raab, T.K.; Fragoso, J.M.V. Mammal diversity influences the carbon cycle through trophic interactions in the Amazon. Nat. Ecol. Evol. 2017, 1, 1670–1676. [Google Scholar] [CrossRef] [PubMed]
  35. Xie, M.; Chen, J.; Zhang, Q.; Li, H.; Fu, M.; Breuste, J. Dominant landscape indicators and their dominant areas influencing urban thermal environment based on structural equation model. Ecol. Indic. 2020, 111, 105992. [Google Scholar] [CrossRef]
  36. Sun, C.J.; Li, X.M.; Zhang, W.Q.; Li, X.G. Evolution of Ecological Security in the Tableland Region of the Chinese Loess Plateau Using a Remote-Sensing-Based Index. Sustainability 2020, 12, 3489. [Google Scholar] [CrossRef]
  37. Boori, M.S.; Choudhary, K.; Paringer, R.; Kupriyanov, A. Spatiotemporal ecological vulnerability analysis with statistical correlation based on satellite remote sensing in Samara, Russia. J. Environ. Manag. 2021, 285, 112138. [Google Scholar] [CrossRef] [PubMed]
  38. Li, W.; An, M.; Wu, H.; An, H.; Huang, J.; Khanal, R. The local coupling and telecoupling of urbanization and ecological environment quality based on multisource remote sensing data. J. Environ. Manag. 2023, 327, 116921. [Google Scholar] [CrossRef]
  39. Gui, X.; Wang, L.; Yao, R.; Yu, D.; Li, C. Investigating the urbanization process and its impact on vegetation change and urban heat island in Wuhan, China. Environ. Sci. Pollut. Res. 2019, 26, 30808–30825. [Google Scholar] [CrossRef]
  40. Marsh, P.; Auckland, S.; Dudley, T.; Kendal, D.; Flies, E. A mountain of health benefits? Impacts of ecological restoration activities on human wellbeing. Wellbeing Space Soc. 2023, 4, 100132. [Google Scholar] [CrossRef]
  41. Jin, Z.; Luo, D.; Yu, Y.; Yang, S.; Zhang, J.; Cao, G. Soil pH changes in a small catchment on the Chinese Loess Plateau after long-term vegetation rehabilitation. Ecol. Eng. 2022, 175, 106503. [Google Scholar] [CrossRef]
Figure 1. Geographical location of the study area.
Sustainability 15 08629 g001
Figure 2. Overall framework of driving factors of ecological environment change. Note: “**” represents a significant relationship at the 0.01 level; “***” represents a significant relationship at the 0.001 level.
Sustainability 15 08629 g002
Figure 3. Change in RSEI in Guyuan City from 2000 to 2019.
Sustainability 15 08629 g003
Figure 4. Proportion of ecological-quality-grade area in Guyuan City from 2000 to 2019.
Sustainability 15 08629 g004
Figure 5. Moran scatter plot of RSEI in Guyuan City. Note: “L−H” Represents low and high value aggregation areas; “H−H” Represents high value and high value aggregation area; “H−L” Represents high and low value aggregation areas; “L−L” Represents low value and low value aggregation area.
Sustainability 15 08629 g005
Figure 6. Local spatial autocorrelation of RSEI in Guyuan City.
Sustainability 15 08629 g006
Figure 7. Correlation and interaction of variables from 2000 to 2019. Note: Red indicates a positive correlation; Blue indicates a negative correlation.
Sustainability 15 08629 g007
Figure 8. PLS−SEM model diagram shows the relationship between each variable and RSEI index (ellipses represent potential variables and rectangles represent observed variables). The arrows indicate the functional relationship between them. Green solid line indicates positive correlation, and red solid line indicates negative correlation). “*” represents a significant relationship at the 0.05 level; “**” represents a significant relationship at the 0.01 level; “***” represents a significant relationship at the 0.001 level).
Sustainability 15 08629 g008aSustainability 15 08629 g008b
Table 1. Strengths and weaknesses of research related to ecological environment quality.
Research ScholarsResearch ContentResearch MethodsStrengths and Weaknesses
Ding et al. [8]Comprehensive evaluation of ecological and environmental conditionsBuilding an evaluation system; Analytic Hierarchy Process (AHP)Strengths: The study was able to combine multiple factors for a comprehensive evaluation of the study area. Weaknesses: Research methods are highly subjective.
Wu et al. [9]Comprehensive evaluation of ecological and environmental conditions“pressure-state-response” frameworkStrengths: Research enables objective assessment of ecological conditions. Weaknesses: Research methods are too dependent on evaluation systems.
Li et al. [13]Analysis of dynamic changes in the ecological environmentVegetation cover (NDVI); Trend analysisStrengths: The method is simple and not easily influenced by other factors. Weaknesses: The research method index is single.
Wu et al. [14]Impact of ecological environment on tourism developmentNDVI; Spatial statistical analysisStrengths: Highly targeted research objectives and reliable methodology. Weaknesses: The research method index is single.
Schneider et al. [15].Impact of urbanization on biodiversitySpatial statistical analysisStrengths: The study analyzed habitat quality in the context of urbanization. Weaknesses: The research objectives are slightly homogeneous.
XU et al. [19]Comprehensive evaluation of ecological and environmental conditionsRemote Sensing Ecological Index (RSEI)Strengths: The research method is more comprehensive and the data are easily accessible. Weaknesses: This method is suitable for macroscopic evaluation.
An et al. [2]The impact of human activities on the ecological environmentRemote Sensing Ecological Index; GeodetectorsStrengths: The study analyzed the interaction of multiple factors on the ecological environment. Weaknesses: The effect of natural conditions was ignored and only the two-factor interaction was studied.
XU et al. [20]Reliability of remote sensing ecological indicesContrast analysisThe study shows the reliability of the RSEI index for ecological studies.
Table 2. Landsat image series data of Guyuan City from 2000 to 2019.
DateTypeStripe Number/Row NumberCloud Cover/%
16 April 2000Landsat5/ETM129/350.00
16 April 2008Landsat5/ETM129/350.00
12 May 2015Landsat8/OLI129/350.01
5 April 2019Landsat8/OLI129/350.01
Table 3. Index Calculation Method.
IndicatorComputing Method
NDVI N D V I = ( ρ N I R ρ Re d ) / ( ρ N I R + ρ Re d )
WET W E T T M = 0.03151 ρ B l u e + 0.2021 ρ G r e e n + 0.3102 ρ Re d + 0.1594 ρ N I R 0.6806 ρ S W I R 1 0.6109 ρ S W I R 2
W E T O L I = 0.1511 ρ B l u e + 0.1973 ρ G r e e n + 0.3283 ρ Re d + 0.3407 ρ N I R 0.7117 ρ S W I R 1 0.4559 ρ S W I R 2
LST L S T = T / 1 + λ T / ρ ln ε 273.15
NDBSI I B I 1 = 2 ρ S W R 1 / ρ S W I R 1 + ρ N I R ρ N I R / ( ρ Re d + ρ N I R ) + ρ G reen / ρ S W I R 1 + ρ G r e e m
I B I 2 = 2 ρ S W R 1 / ρ S W I R 1 + ρ N I R + ρ N I R / ( ρ Re d + ρ N I R ) + ρ G reen / ρ S W I R 1 + ρ G r e e m
I B I = I B I 1 / I B I 2
S I = ρ S W I R 1 + ρ Re d ρ N I R + ρ B l u e / ρ S W I R 1 + ρ Re d + ρ N I R + ρ B l u e
N D B S I = I B I + S I / 2
Note: where ρBlue, ρGreen, ρRed, ρNIR, ρSWIR1, and ρSWIR2 represents band 1, 2, 3, 4, 5, and 7 of the Landsat5/ETM remote sensing images and band 2, 3, 4, 5, 6, and 7 of the Landsat8/OLI images, respectively.
Table 5. Results of principal component analysis conducted by RSEI in 2000, 2008, 2015, and 2019, respectively.
YearIndictorsEigenvalue
PC1PC2PC3PC4
2000NDVI0.152−0.156−0.108−0.969
WET0.591−0.743−0.2080.235
LST−0.790−0.602−0.113−0.014
NDBSI−0.0520.249−0.9650.059
Percentage of variance (%)74.07615.6895.6314.603
2008NDVI0.102−0.4230.689−0.579
WET0.540−0.289−0.643−0.459
LST−0.708−0.640−0.298−0.012
NDBSI−0.4430.573−0.149−0.673
Percentage of variance (%)73.61717.0416.9322.409
2015NDVI0.357−0.826−0.426−0.091
WET0.166−0.1710.629−0.740
LST−0.904−0.4180.064−0.052
NDBSI−0.1630.336−0.647−0.664
Percentage of variance (%)82.17114.4792.7740.576
2019NDVI0.286−0.938−0.194−0.008
WET0.2260.212−0.661−0.683
LST−0.930−0.233−0.237−0.151
NDBSI−0.023−0.1420.684−0.7145
Percentage of variance (%)77.33513.2887.2912.086
Table 6. Proportion of area of different levels of ecological environment from 2000 to 2019.
Level of RSEIWorstPoorModerateGoodExcellent
2000Area/km2728.367494.081976.31284.6232.91
proportion/%6.9371.2618.792.710.31
2008Area/km2551.546049.283623.51261.1830.77
proportion/%5.2457.5234.462.480.29
2015Area/km2128.272554.996913.65766.81152.56
proportion/%1.2224.3065.747.291.45
2019Area/km20.02687.487185.212363.71279.87
proportion/%0.006.5468.3222.482.66
Table 7. Results of covariance test for each influence factor.
Influence Factors2000201820152019
DEM1.041.041.031.04
LUI1.091.091.061.07
NLI1.592.571.942.11
PH1.451.451.451.45
POP1.702.682.002.21
PRE1.171.061.011.00
RSEI1.001.001.001.00
SLOPE1.041.041.031.04
TEM1.171.061.011.00
TOC1.451.451.451.45
Table 8. Evaluation of combined reliability and validity of PLS-SEM model.
Influence Factors2000200820152019
CRAVECRAVECRAVECRAVE
Climate change0.7300.6890.7150.6190.8340.5490.6330.532
Human activity0.6410.5220.6350.5190.6060.5950.6290.513
Soil0.6290.5190.6150.7780.7350.5070.7560.778
Terrain0.6870.5580.6940.5620.6960.5630.6890.559
Note: The criteria for each index are: CR > 0.6; AVE > 0.5.
Disclaimer/Publisher’s Note: The statements, opinions and data contained in all publications are solely those of the individual author(s) and contributor(s) and not of MDPI and/or the editor(s). MDPI and/or the editor(s) disclaim responsibility for any injury to people or property resulting from any ideas, methods, instructions or products referred to in the content.

