
A Driver Behavior Monitoring System for Sustainable Traffic and Road Construction
Institute of Forensic Research and Education, University of Žilina, Ulica 1. Mája 32, 01001 Zilina, Slovakia
*
Author to whom correspondence should be addressed.
Sustainability 2023, 15(16), 12305; https://0-doi-org.brum.beds.ac.uk/10.3390/su151612305
Submission received: 15 June 2023
/
Revised: 2 August 2023
/
Accepted: 10 August 2023
/
Published: 12 August 2023
(This article belongs to the Collection Emerging Technologies and Sustainable Road Safety)
Abstract
:The perception and behavior of human drivers is of great importance for both sustainable road construction and sustainable coexistence with self-driving vehicles. To record the (hazard) perception and responsiveness of drivers, as many parameters as possible of the recognition and reaction process must be measured and recorded. It must be known what the drivers see or perceive and how they react to it. In modern vehicles, all pedal positions and driving data are transmitted to the CAN bus and can be assigned to the associated sources using reverse engineering methods. What drivers see or recognize can be recorded from the driver’s perspective using (eye-tracking) videos or photos. To evaluate the vehicle and image data, systems are required that can, among other things, record both channels and link them synchronously. To fulfill this purpose, two different systems are developed and compared here, both of which can be used in real traffic.
1. Introduction
Transport safety is one of the most important fields currently. Except vehicles, roads, and their equipment, an essential element is the driver’s perception of the situation and their reactions [1]. To enable sustainable infrastructure projects and make existing streets more sustainable, both must comply with structural engineering regulations. Furthermore, the design, signage, and floor markings must also meet the aspects of infrastructure and road safety. The focus is on the way drivers experience the respective situation, which is also closely related to the hazard perception skills of the driver [2].
Due to the fact that there will be an extremely difficult transition period in traffic management within the next years, the elements of autonomous driving will manifest themselves more and more. In the transition phase, autonomous driving systems of various degrees and classic driving will coexist. To make the phase of coexistence as sustainable as possible, the level of cooperation and the behavior between self-driving and human-driven cars must be as homogeneous as possible. Only then can the capacity of the road be increased by such a coexistence [3]. To feel comfortable as a driver in an autonomous vehicle and to make the behavior of autonomous vehicles more predictable for drivers of classic vehicles, the behavior of autonomous vehicles should be as similar as possible to that of real drivers. The more similar the approach to a dangerous situation of an autonomously driven car is to human behavior, the greater the acceptance and comfort of self-driving cars is [4]. For the purposes of sustainable transport, it will be necessary to tune these systems and adjust the physical and mental abilities and reactions of the drivers as well as building and maintaining sustainable roads and traffic infrastructure.
Also, the field of driver training is important with regard to sustainability in road traffic. For example, learning and improving the ability of hazard perception is one of the key factors whose direct connection to the risk of accidents is constantly being confirmed [5,6,7,8,9,10]. It can be trained not only in novice drivers, but in drivers of all ages, and thus represents promising teaching content for a sustainable long-term and permanent reduction in the number of accidents. The way in which the topic of hazard perception is taught is a key factor in the success that can be achieved [2]. Driving lessons that not only strengthen the skills but also the self-confidence of the trainee have the great disadvantage that increased self-confidence in road traffic has also led to an increased willingness to take risks, since the great belief in one’s own driving abilities also leads to the wrong assumption of being more able to deal with dangerous situations. Therefore, the topic must be integrated into driver training of all ages without increasing the self-assessment of the trainees [2].
To summarize, the overall goal of this research is the development and construction of complete technical solutions to make the mentioned aspects measurable.
2. Means and Methods
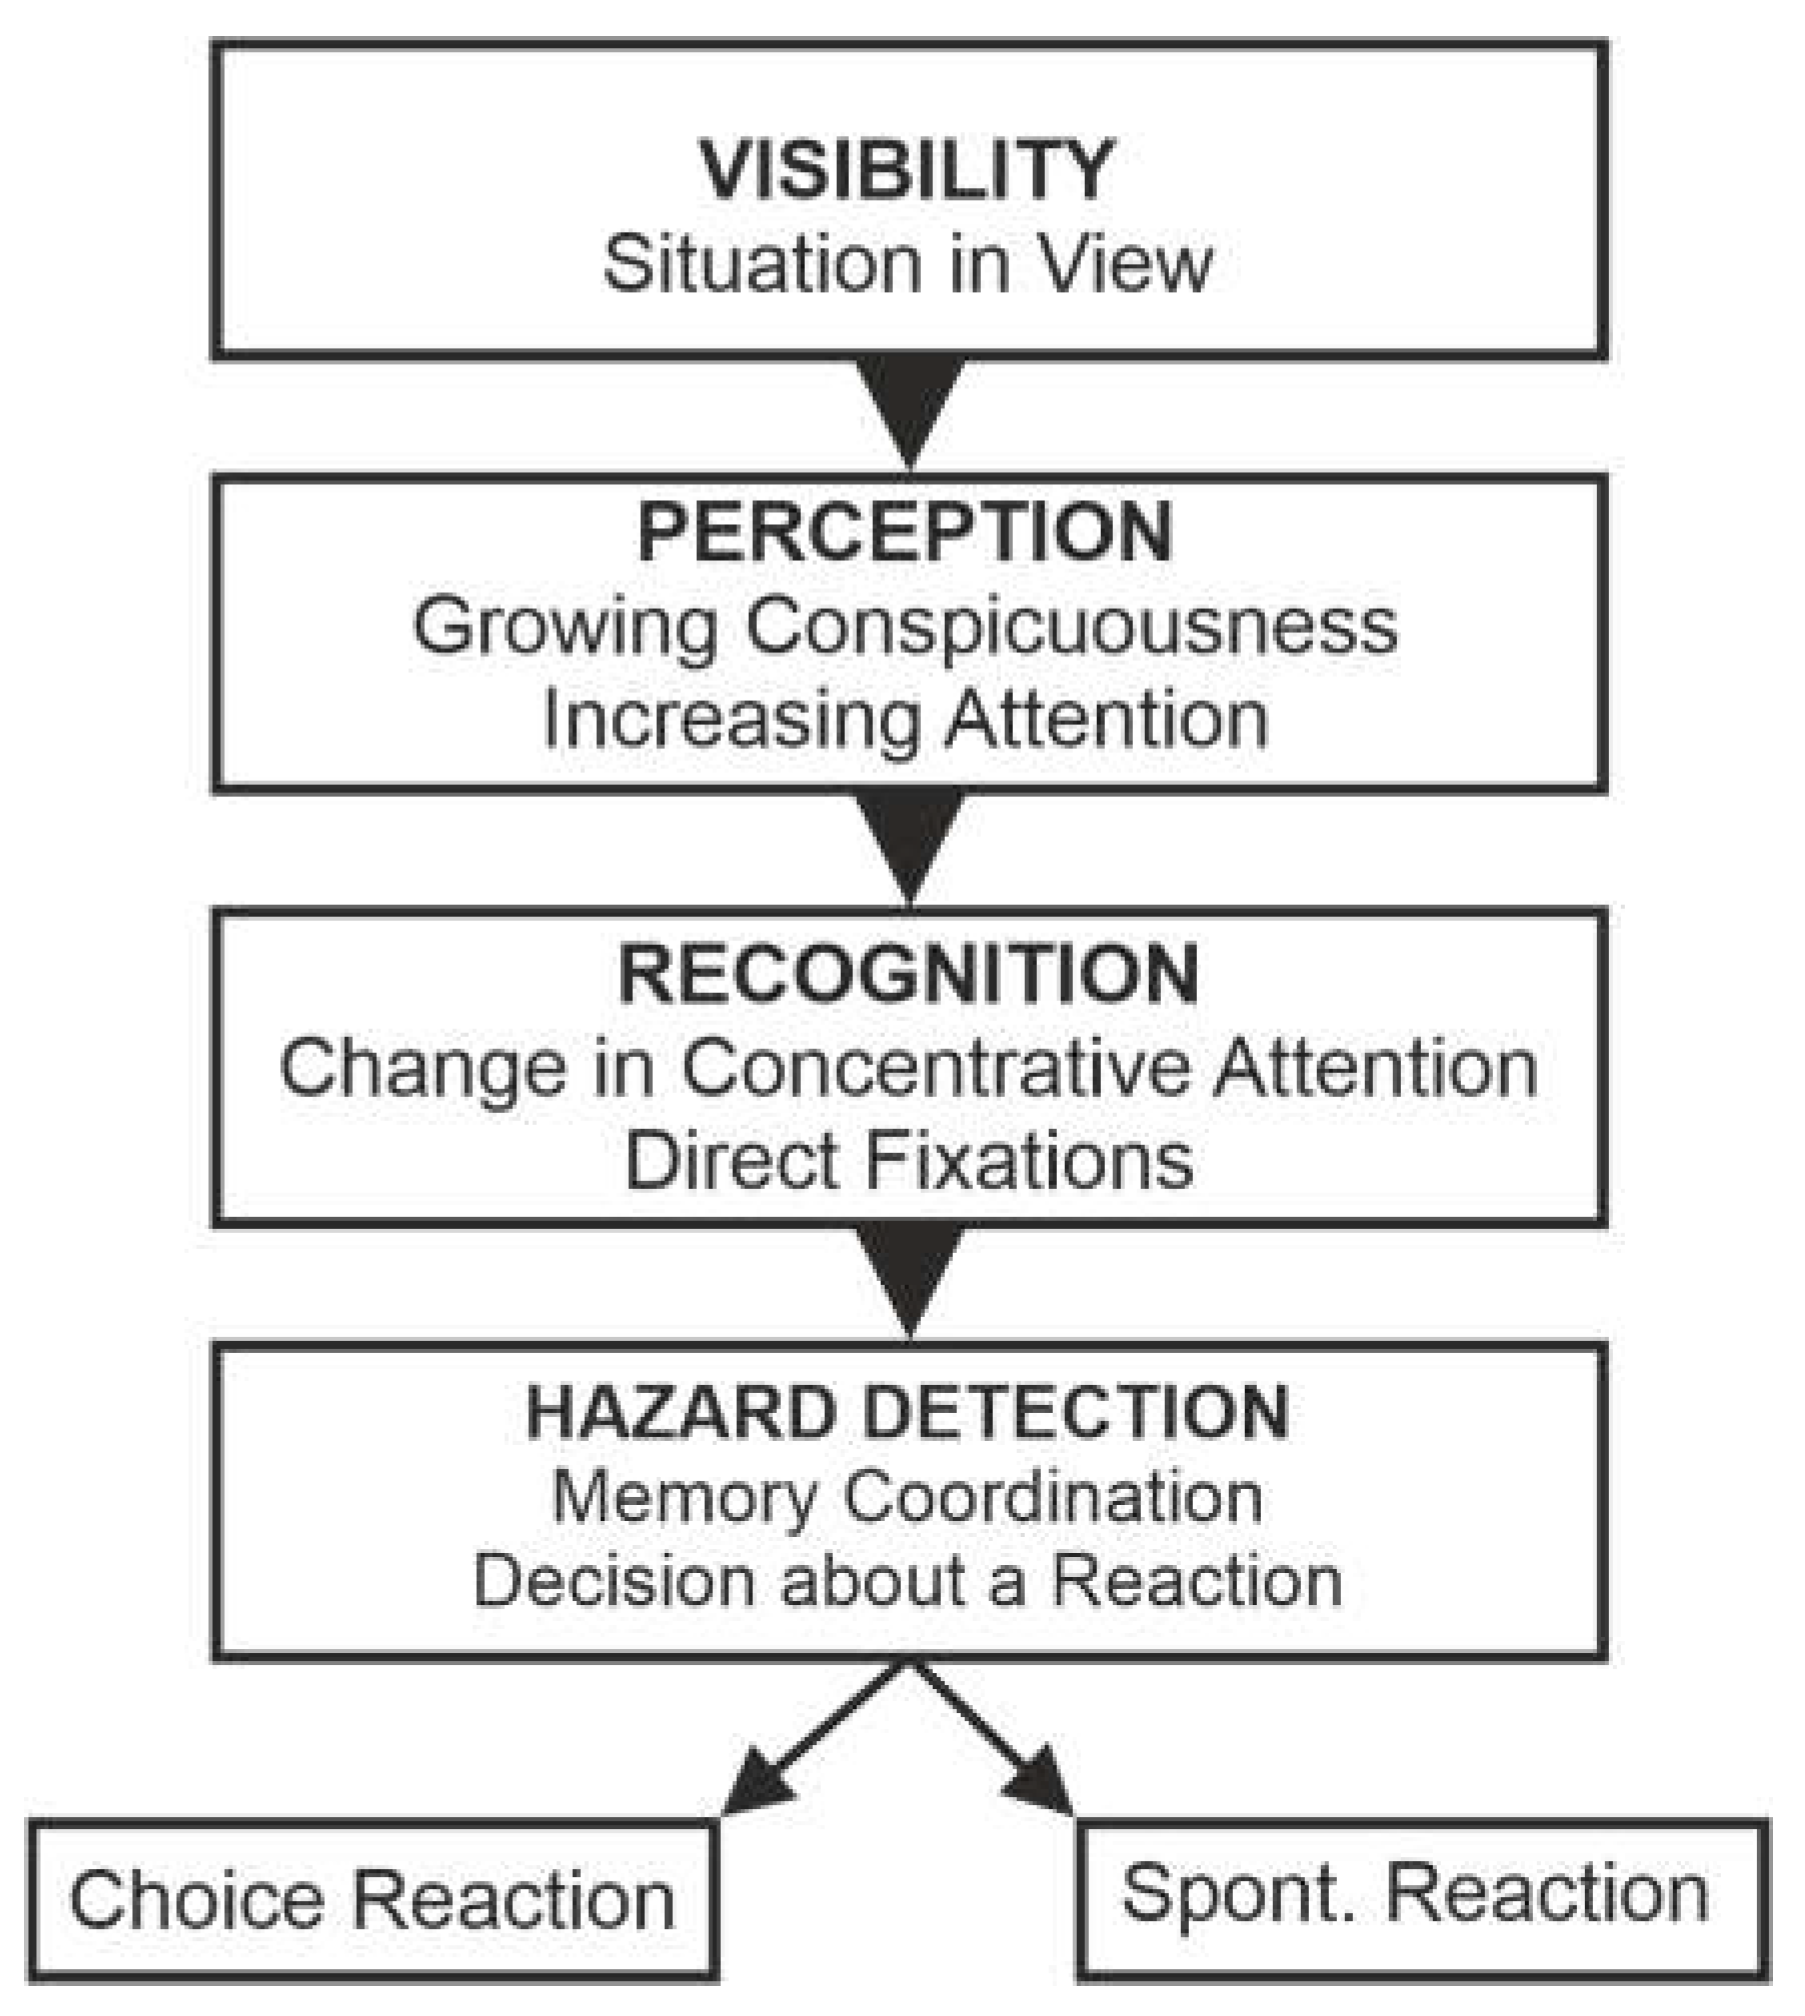
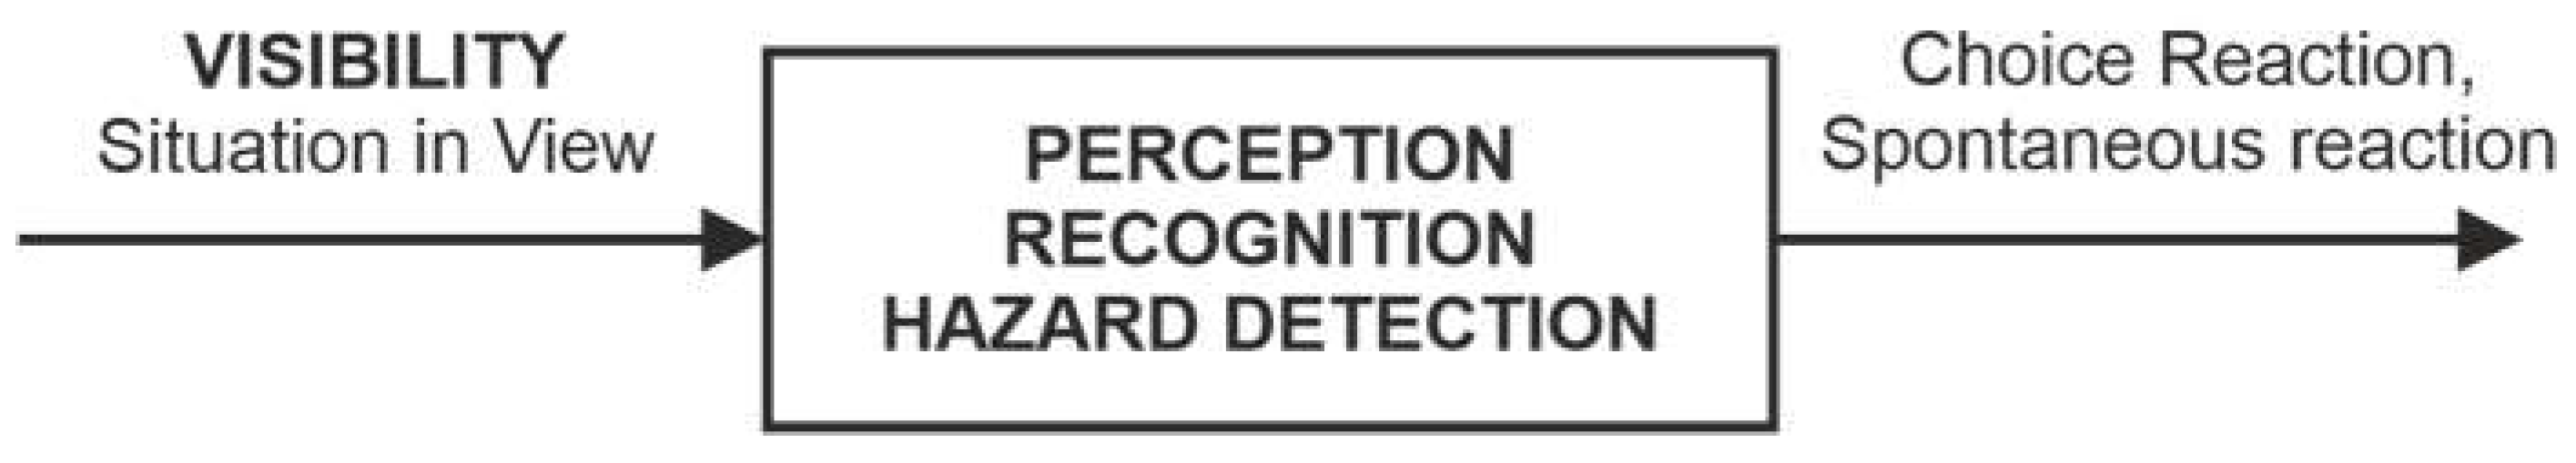
The visual acquisition of information is a process in which an object is initially perceived peripherally or parafoveally, whereupon the gaze is turned to subsequently perceive and recognize the object foveally. Only then can a decision be made about the behavior or an associated reaction [11]. In ÖNORM V 5050, which defines this terminology (Figure 1), the step of identifying a hazard is followed by either a choice reaction, in which the driver selects the appropriate defensive action, or a spontaneous reaction in which ingrained automatisms determine the defensive action [12]. The type of reaction that takes place in practice is often a coincidental product of the interaction of routine, the degree of prompting, and the value of the experience [11].
To record the hazard perception and responsiveness of drivers, as many parameters as possible of the recognition and reaction process according to ÖNORM V 5050 must be recorded. It must be known what the drivers see or perceive and how they react to it. What drivers see or recognize can be recorded from the driver’s perspective using eye-tracking videos or photos. The response can be detected by a change in vehicle operation. For example, a change in the position of the accelerator, brake pedal, or clutch pedal, or a change in the steering wheel angle. In modern vehicles, all pedal positions and driving data are transmitted unencrypted on the CAN bus. Rather, vehicle manufacturers are pursuing the “security through obscurity” approach by using proprietary data formats. When reading out the communication taking place on a specific CAN bus, it remains completely unclear which byte in which identifier transmits the searched signal or which unit it has. Even if there is some research work that deals with machine-learning-based (partially) automated reverse engineering, for example, there is often no other option for manual reverse engineering, even if this process turns out to be laborious and time-consuming.
3. Results
3.1. CAN Bus Reverse Engineering
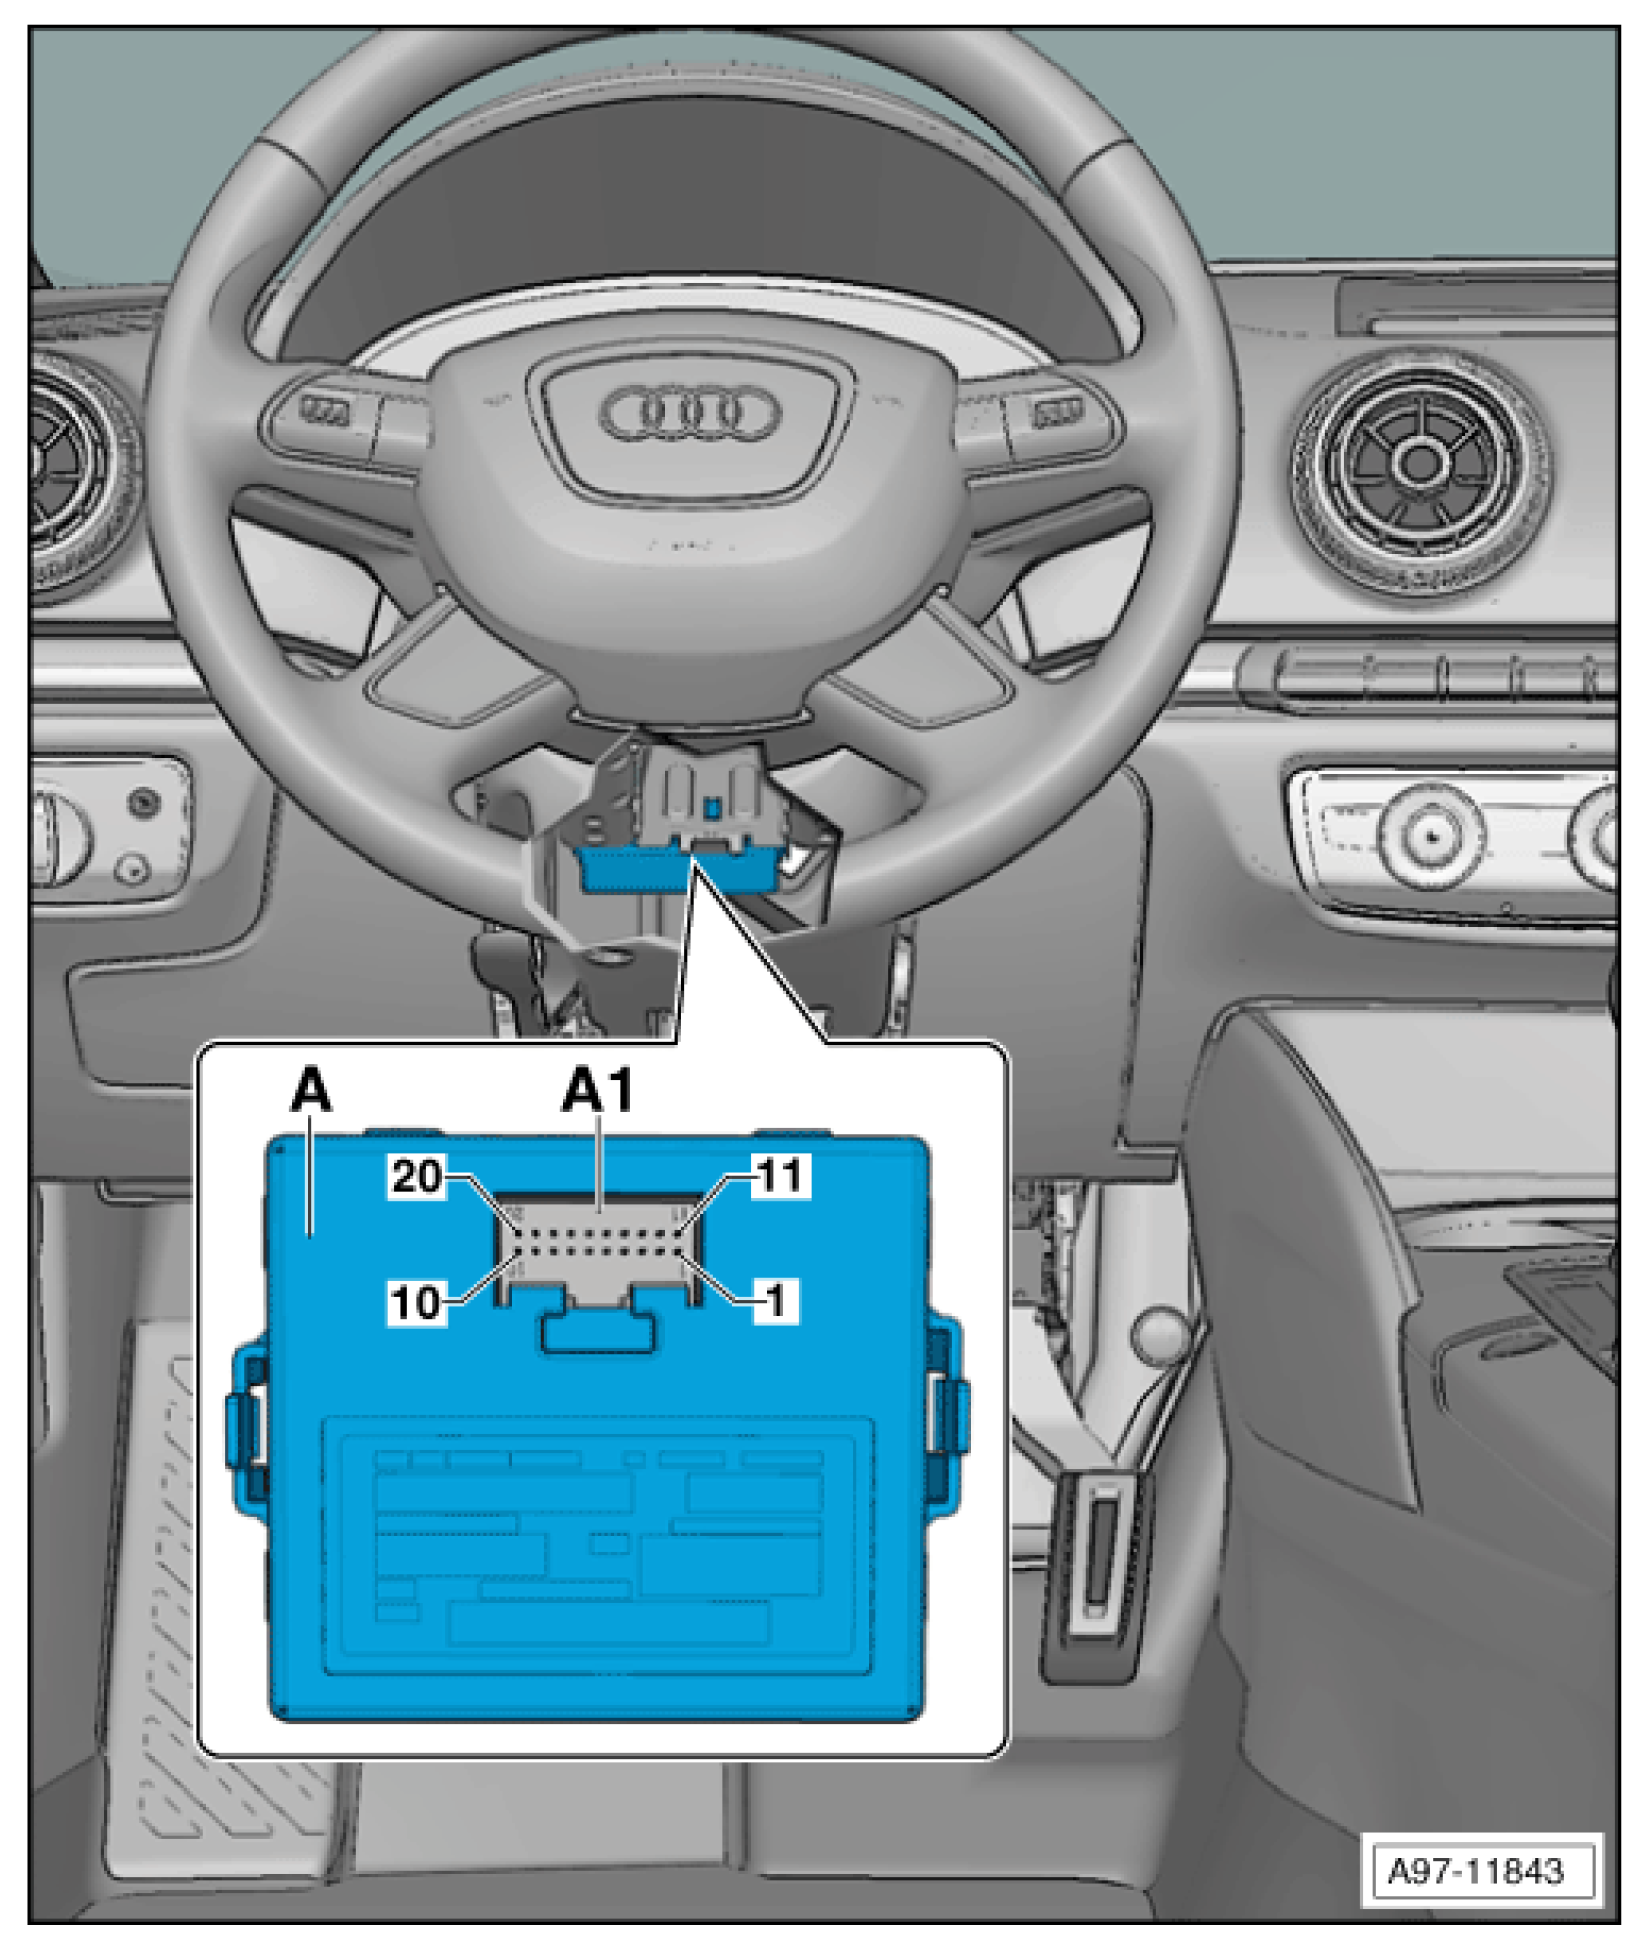
As it is known that basically all CAN bus systems used in the vehicle converge in the CAN gateway, this is a good starting point for tracking down the lines that are being operated. The official Audi workshop documents state that the CAN gateway, which Audi calls “control unit J533—diagnosis interface for data bus”, is located in the driver’s footwell below the steering wheel (Figure 2).
The RKS+CAN CAN interface hardware from Kaufmann Automotive and the supplied KCANMonitor software (version RKS+CAN 2.70) are used to read out the bus communication. This means that communication to the bus can be displayed and filtered in real time, and changing values can be highlighted in color, which significantly simplifies the signal search. A total of 82 different identifiers can be sniffed on the CAN bus while the engine is running. Practice shows that, when the ignition is switched on and the engine is not running, significantly fewer IDs are sent to the bus, and that some values of the sent IDs hardly change or do not change at all, which of course greatly simplifies the search for a special signal. The next step is to start looking for the accelerator pedal position. To do this, the pedal is slowly actuated with the ignition switched on, while the KCANMonitor software used shows which bits are changing or which values are increasing, and which are decreasing. Table 1 shows the signals of the Audi A3, and which were developed using the reverse engineering method described.
The CAN bus is also relevant for vehicle safety and improper handling of the vehicle electronics would lead to a loss of warranty. Therefore, safety was of great importance in this work. To rule out any negative interference with the CAN bus, an inductive CAN bus coupler was used to pick up the signals without contact and therefore with no ability to send messages to the bus. Furthermore, the CAN controllers used are operated exclusively in listen-only mode. This would also ensure that no signals are sent even if there is a galvanic connection between the system and the CAN bus.
3.2. Developing an Eye-Tracking-Based System
3.2.1. Eye-Tracking System (System 1)
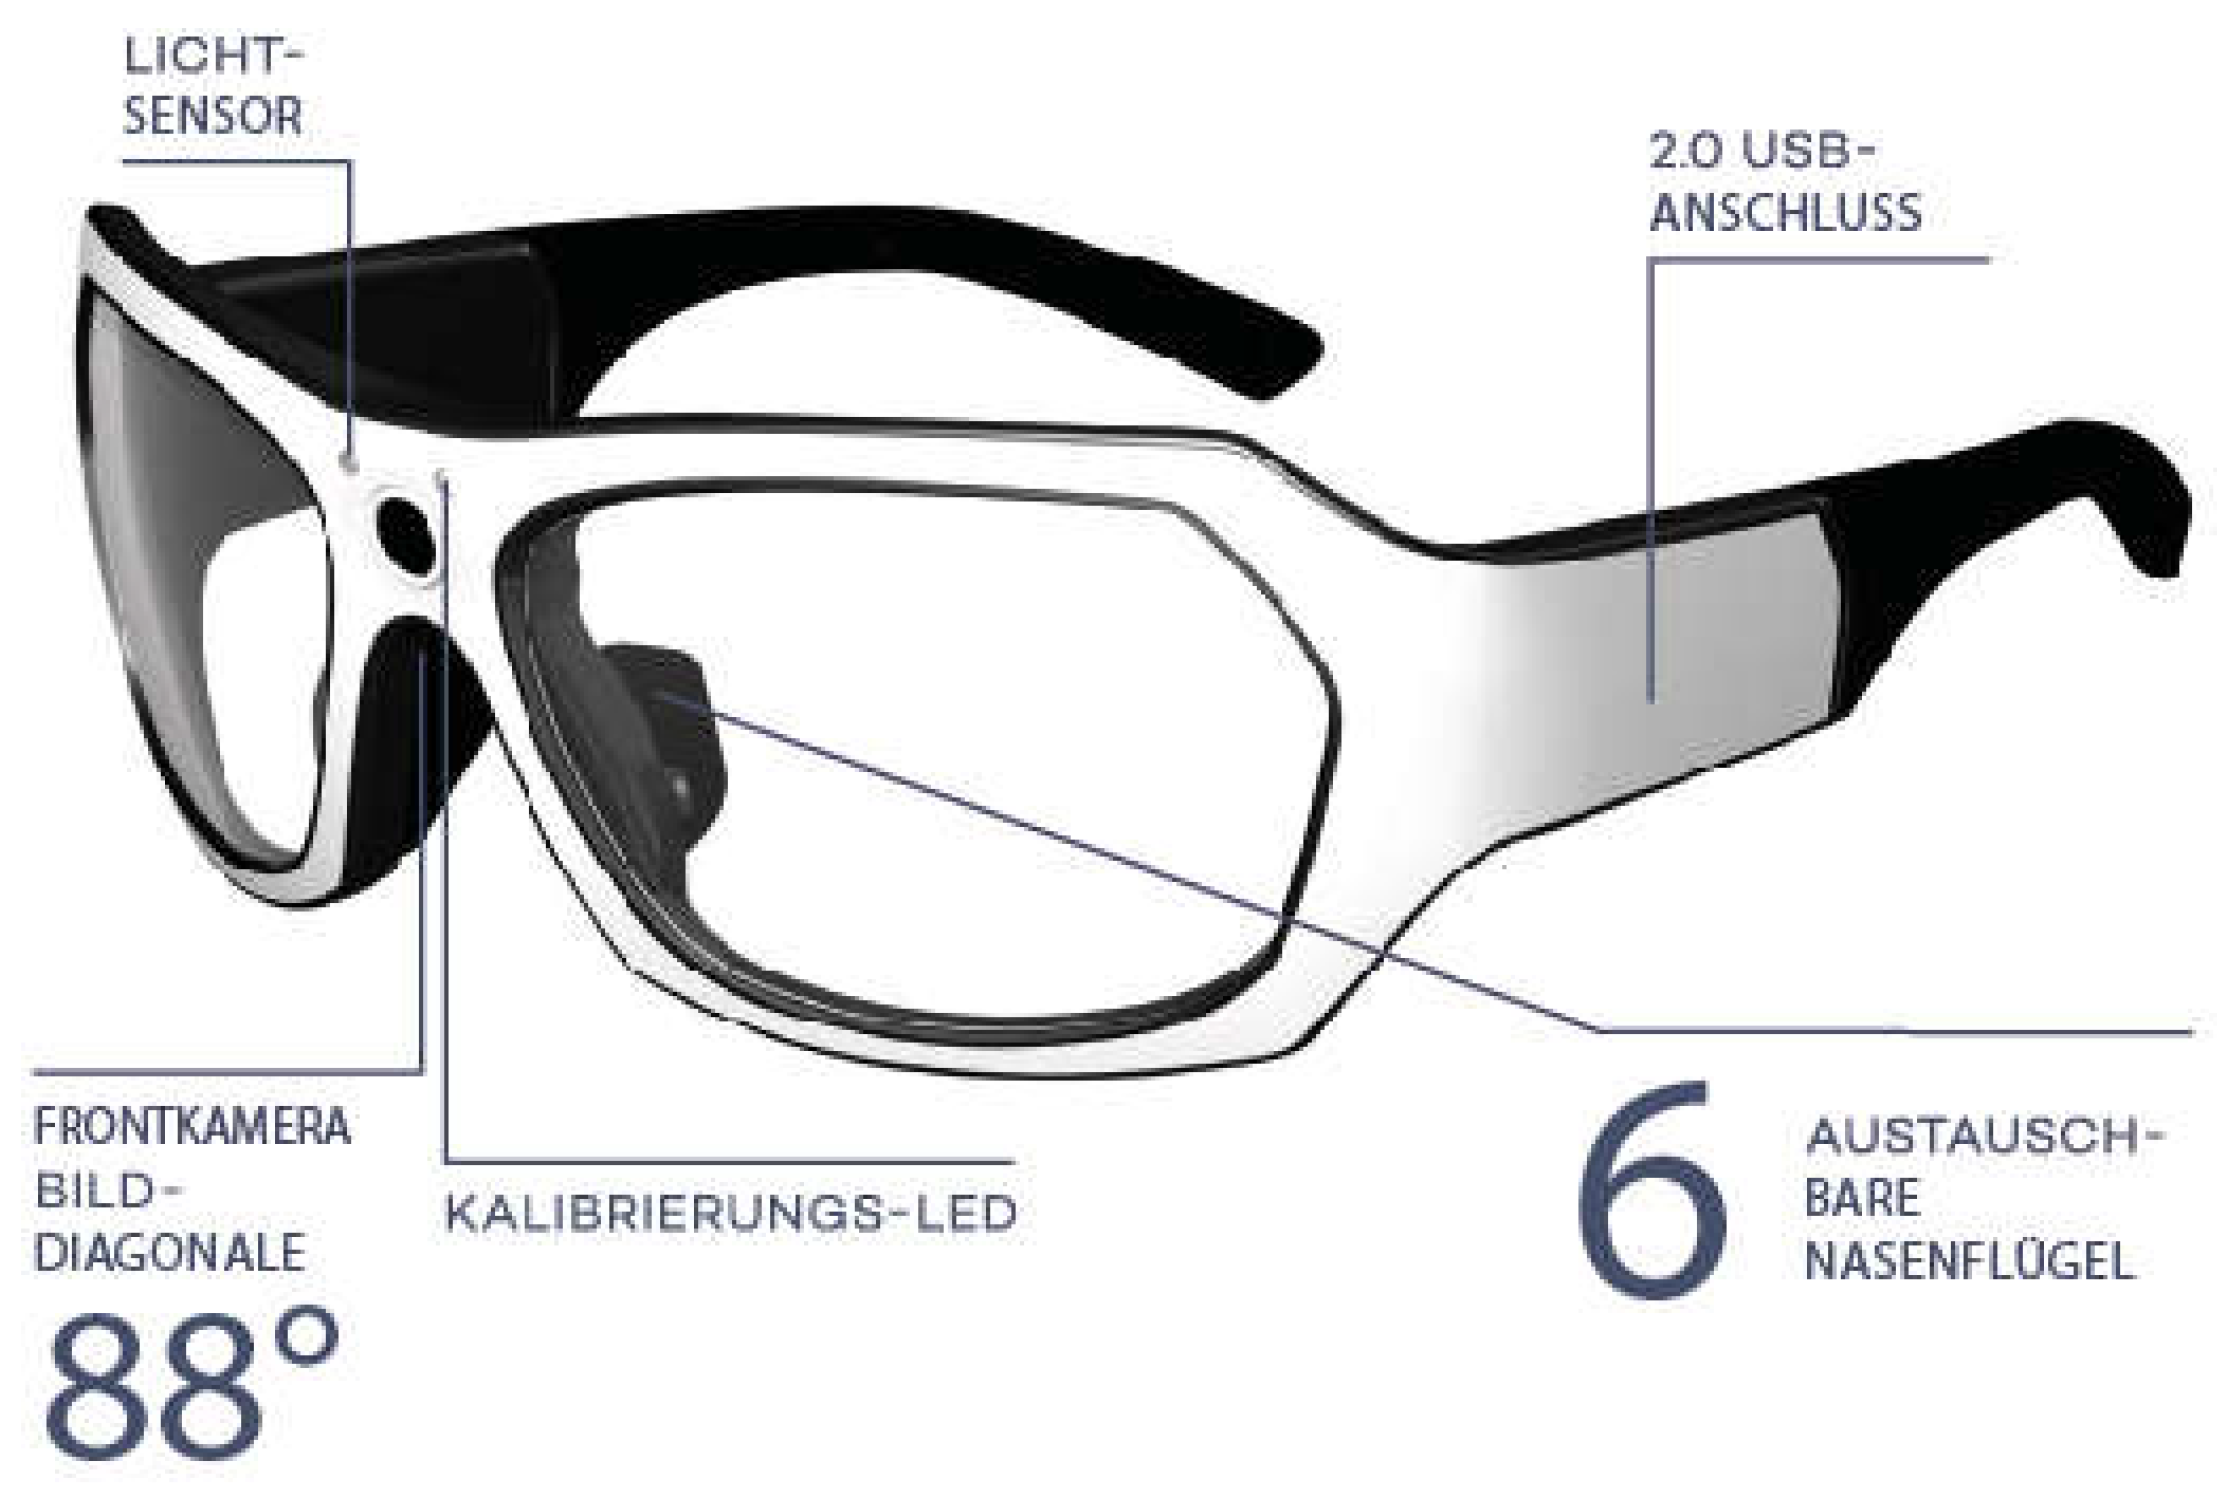
Further, an easy-to-use eye-tracking system is required to record the gaze data, which can be integrated into the driving lesson without disturbing the driver or otherwise impairing them in any way. It provides videos of the highest possible quality and can be quickly adapted to different people. The Viewpointsystem VPS16 system was chosen. This eye-tracking system was cleverly built into a spectacle frame with non-optical lenses, which records the wearer’s perspective with the front camera at 25 fps and at the same time the eye camera captures the eye movements and the viewing direction (Figure 3). To adapt to different wearers, the six nose flaps supplied with the glasses can be exchanged. The recorded data are transferred to the associated Smart Unit via a USB cable and superimposed to form a joint video. The Smart Unit is also used to operate the system, to supply power, and to store the generated data.
3.2.2. Data Logging
The DL1 Pro data logger from Race Technology was chosen to record and store driving and vehicle data. This consists of an aluminum housing and can be supplied via the 12-volt vehicle on-board voltage. It also has a connection for a GPS antenna that records GPS data at 20 Hz, an integrated acceleration sensor, two CAN bus ports with 105 channels each, eight analog inputs for a detection range of 0–25 V with a 12 bits analog-to-digital converter, and a sampling rate of 1000 Hz, as well as several other functions. The recorded data are stored in the form of a RUN file on a maximum 32 GB SD card, which can be inserted into the integrated SD card slot on the front. The recorded data can either be read from the SD card using a card reader or directly from the DL1 using a USB cable. The RUN file is then evaluated in the supplied “RTAnalysis” software (version 8.5.369). The data logger and the data to be recorded or CAN IDs are configured from the PC using a USB cable and the supplied software. Appropriate cables with open cable ends are supplied for the rear connections. A separate input–output board was developed to connect all the required signals from and to the data logger. To be able to operate the data logger from the driver’s or front passenger’s seat, a wired remote control was also developed. Finally, the fully assembled measuring device was positioned behind the passenger seat in the Audi A3 and all components were connected.
3.2.3. Overlay with the Eye-Tracking Video
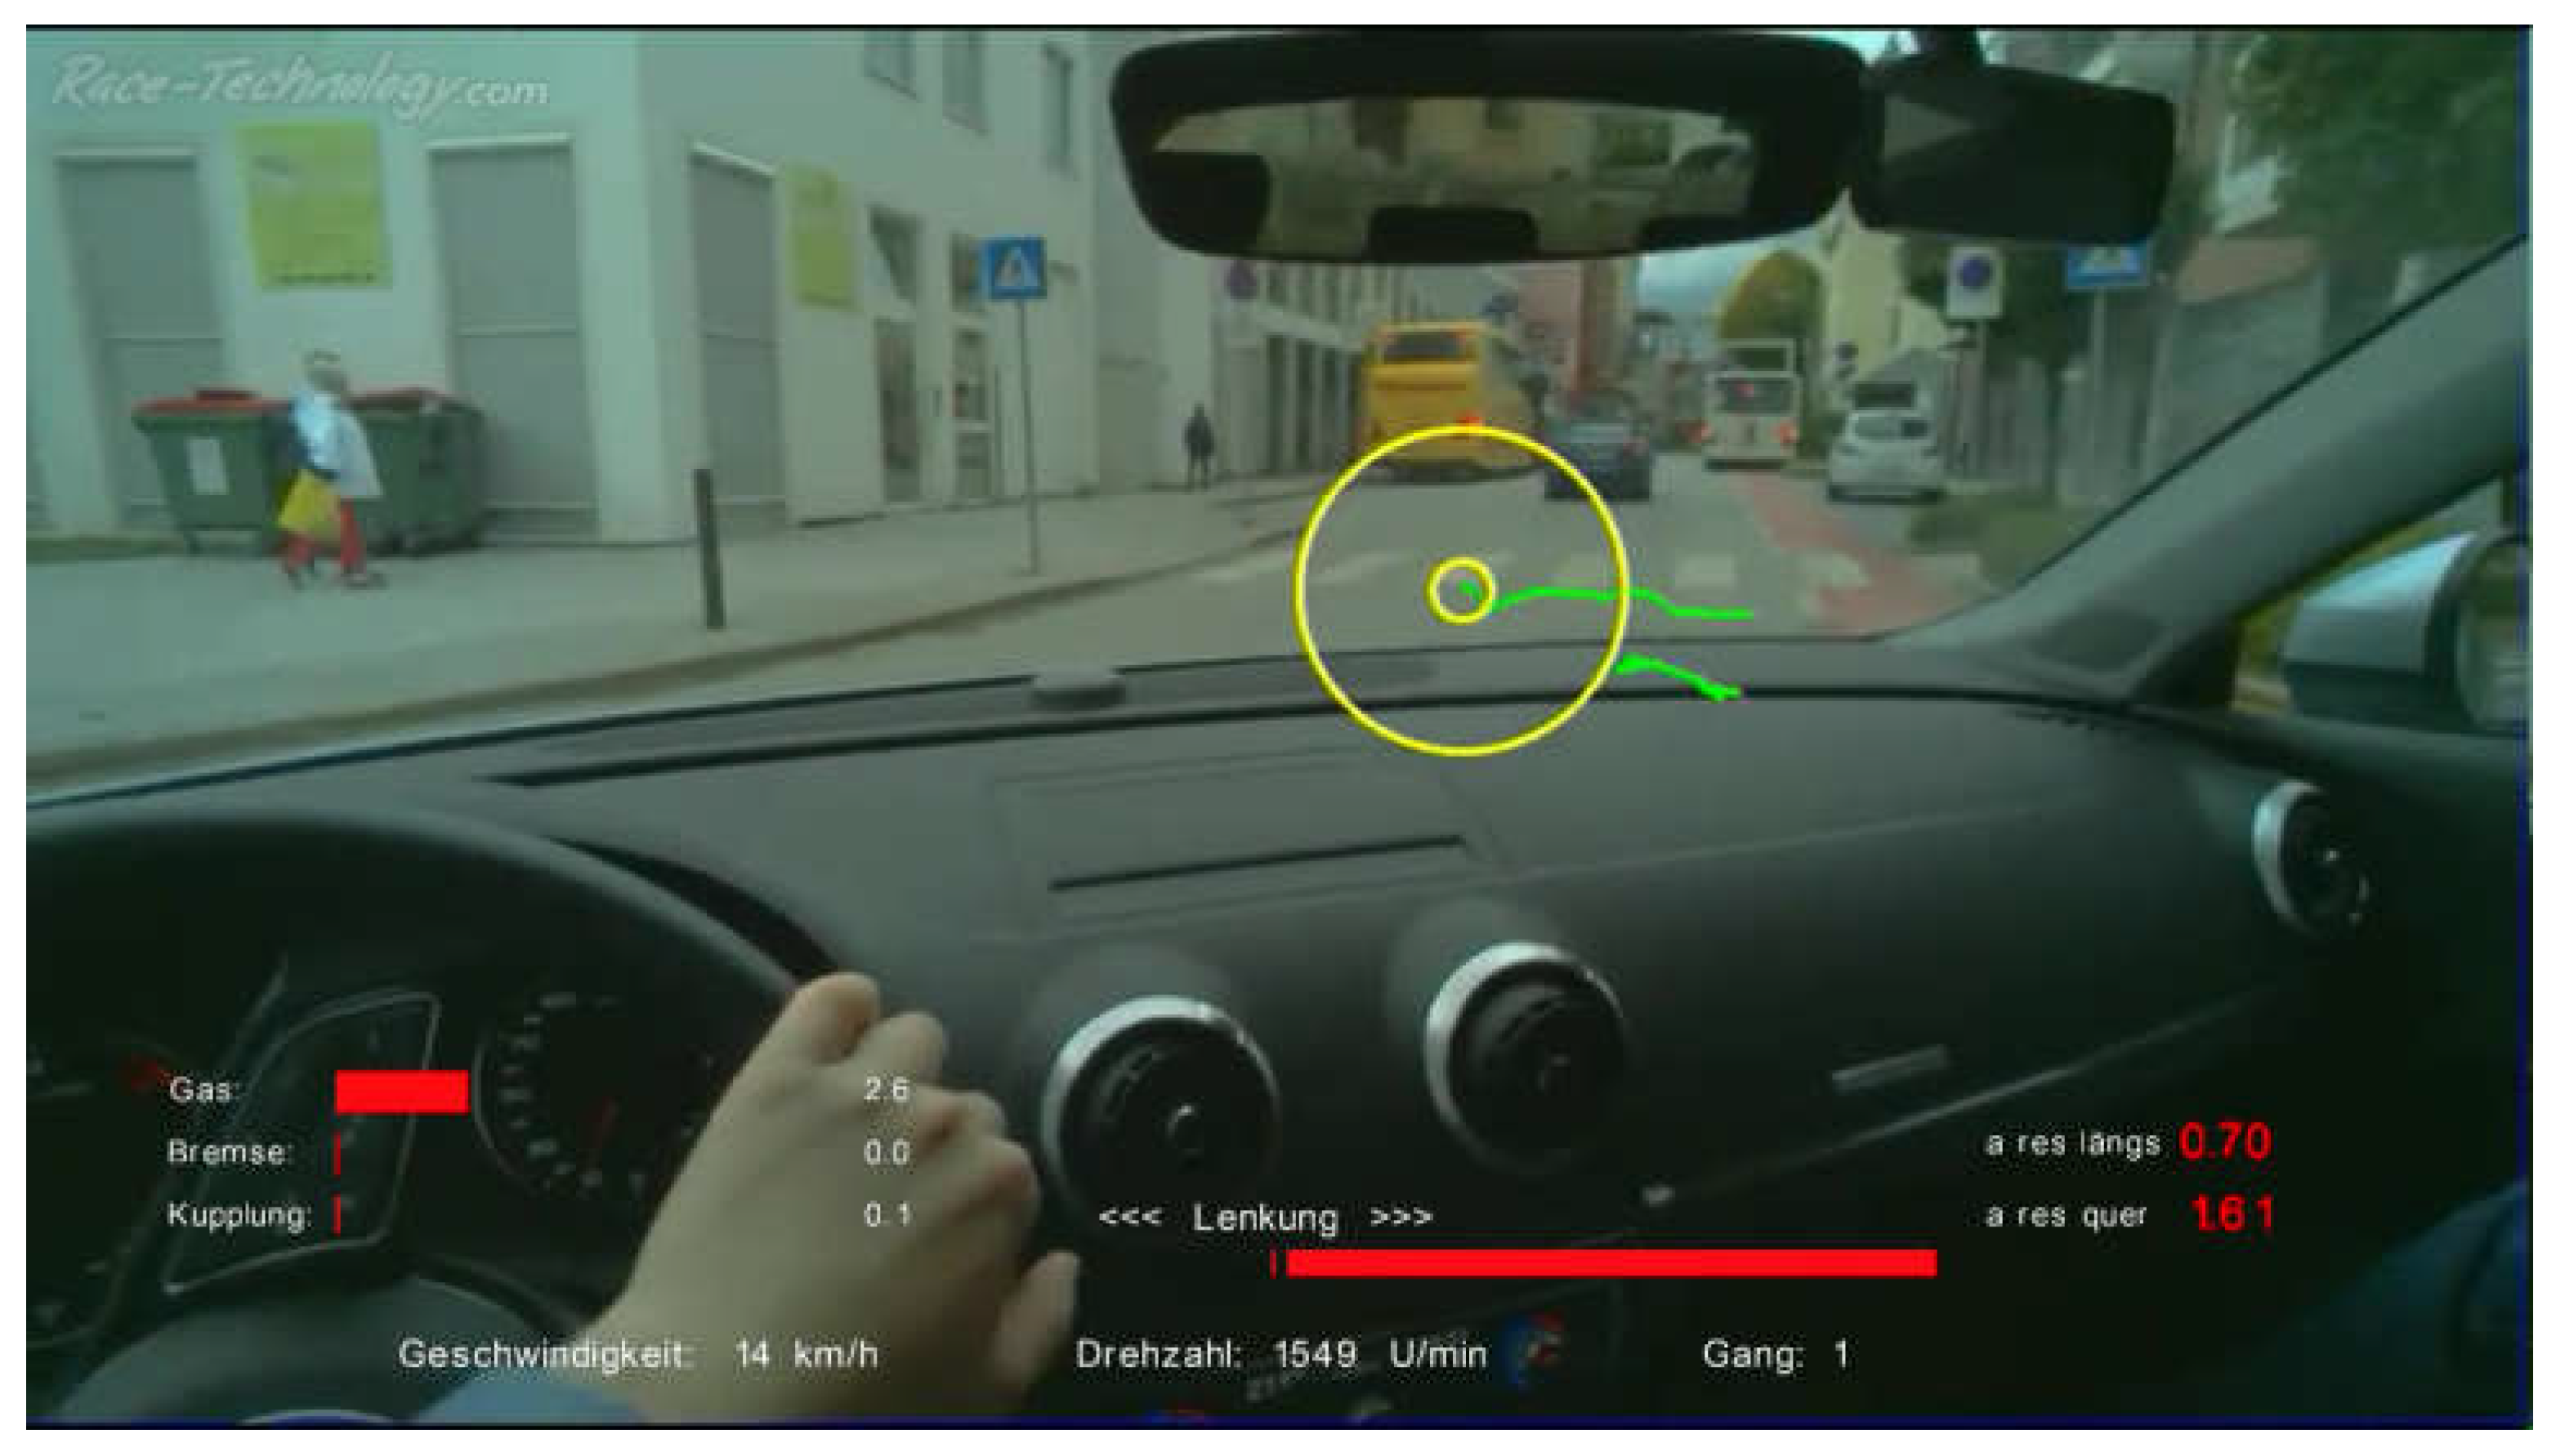
An LED is used to synchronize the video with the eye-tracking system and the logged data. By pressing a button on the remote, an LED lights up in the driver’s field of view. The event of pressing the button is also logged by the data logger. So, at the end, all captured data can be synchronized and overlaid at this time. To avoid a deviation due to non-100%-consistent framerates, the process of synchronization can be repeated as often as desired. Figure 4 below shows a screenshot of an overlaid eye-tracking video. In the lower left half of the picture, the accelerator pedal, brake pedal, and clutch pedal position in percent can be seen. In the lower right half of the image, the longitudinal and lateral acceleration can be seen. The steering angle is displayed in the center below, as well as the display of the current speed, the RPM, and the gear selected based on the transmission ratio.
3.2.4. Use in Practical Driver Training
In the next step, the described system installed in the Audi A3 was practically tested in an Austrian driving school. In Austria, it is mandatory for learner drivers to carry out a so-called multi-phase drive with a specially trained driving instructor about 2–4 months or 6–12 months after passing the practical driving test, depending on the driving license class they have completed. In these units, among other things, the topic of gaze technique is a focus. Since all learner drivers in the multi-phase training already have driving experience and are very familiar with the handling of vehicles, this group was selected as the subject of the study. In total, lessons with 25 drivers were recorded and 50 situations were analyzed in detail. Due to the well-known problems of eye-tracking glasses with made-up eyes, only male drivers were analyzed. The average age was 18 years. The test subjects had held a driver’s license for an average of 10.2 months and had driven an average of 15,100 km to date.
Before the drive was carried out, each candidate was asked to assess their driving skills themselves with regard to their hazard perception skill on a scale of 1–10. The average self-assessment of the 25 candidates was 8 out of 10 points. After watching the recorded videos following the driving lesson, every tested driver admitted that there was at least one situation where they were surprised or shocked by their own gaze behavior or by the fact that a prospective hazardous situation was not recognized properly. Faced with these videos, the tested drivers downscaled the self-assessment of their hazard perception abilities from 8/10 to 6/10 points on average, which provides a deterioration of 25%.
The four driving instructors involved in the evaluation period all agreed that the time-consuming process of calibration and evaluation represents a serious obstacle to the accompanying use in driver training. For this reason, the use of System 1 was limited to the second phase of the multi-phase drive.
3.2.5. Conclusion—System 1
The described System 1 is thus able to measure the response time to the occurrence of a hazard or other events. In addition, the application takes place entirely in real traffic and, apart from wearing the eye-tracking glasses, the test drivers do not have to do anything that they do not have to do when driving a vehicle without the measurement setup. By using the eye-tracking glasses, the entire perception process according to Figure 1 can be followed and strengths and weaknesses can be assigned to individual sub-items. The fact that ultimately every candidate admitted deficits in their hazard perception in at least one situation, as well as the fact that the self-assessment of the hazard perception abilities deteriorated by 25%, makes the developed system also seem suitable for the requirements of sustainable driver training without strengthening the driver’s self-confidence due to [2]. At the same time, a lot of video and image material is generated, which in turn can be integrated into driver training, or be used to improve infrastructure and road safety.
A disadvantage of the overall developed solution is the high unit costs of approx. EUR 12,000 net per vehicle without installation. Furthermore, the generation and evaluation of the video material is complex, time-consuming, and requires good computer skills. Furthermore, the adjustment or calibration of the eye-tracking glasses requires a certain lead time and does not always work reliably for some people (e.g., with made-up eyes). All in all, it must be assumed that a person with very good computer skills and a high-performance PC would need around three to four times the time of the measurement run just for the evaluation and generation of the finished material.
3.3. Developing an App-Based System (System 2)
According to the experience gained so far, an ideal technical solution for the cost-effective and comprehensive training and testing of hazard perception skills and road and infrastructure safety must be as cheap as possible to purchase. Additionally, a quick and uncomplicated operation in everyday life or real traffic, even by people with little IT knowledge, must be guaranteed. The preparation and follow-up time must be negligible.
To meet the requirements of real traffic, as with the previous approach, only a combination of image material and vehicle data (pedal positions and speed) can be considered. Without image material, it would not be known what the driver sees or which traffic situation they are in, and without driving data it would not be known how or at what speed the driver approaches a situation or traffic scene. The measurement of response times on the subject of hazard perception serves to compare the abilities with those of other test subjects. However, since every situation is unique in real time traffic anyway and therefore there is no comparability of students or situations, this functionality can be omitted in favor of the goals defined here.
The integration of eye tracking is by far the most expensive functional component of the first system, which also consumes a lot of time due to the re-encoding of the video. Ultimately, even a photo of a traffic situation without eye-tracking would be sufficient, since it is not primarily relevant what exactly the driver focuses on, but rather which subjective perception of a traffic situation, infrastructure, or possible danger triggers their behavior and determines how they approach the situation. Without eye tracking, the model of perception and response shown in Figure 1 is just a black box, the inside of which cannot be investigated (Figure 5). All that is known is whether a situation is in the field of vision (visibility) and how this is approached (choice reaction or spontaneous reaction).
For the basic evaluation of road and infrastructure safety or hazard perception, however, it ultimately plays a subordinate role where the exact error that happened inside the black box was a driving error or a non-adapted behavior can ultimately still be pointed out.
The current generation of tablets and smartphones already have a powerful processor, a GPS receiver, a high-resolution camera, and a three-axis acceleration sensor. This means that these functions can already be used for the system setup without having to purchase a GPS receiver or camera. Furthermore, these devices usually also have enough storage space, which makes an additional data logger superfluous. As a result, and by omitting eye tracking, the costs can already be drastically reduced.
3.3.1. Hardware Setup
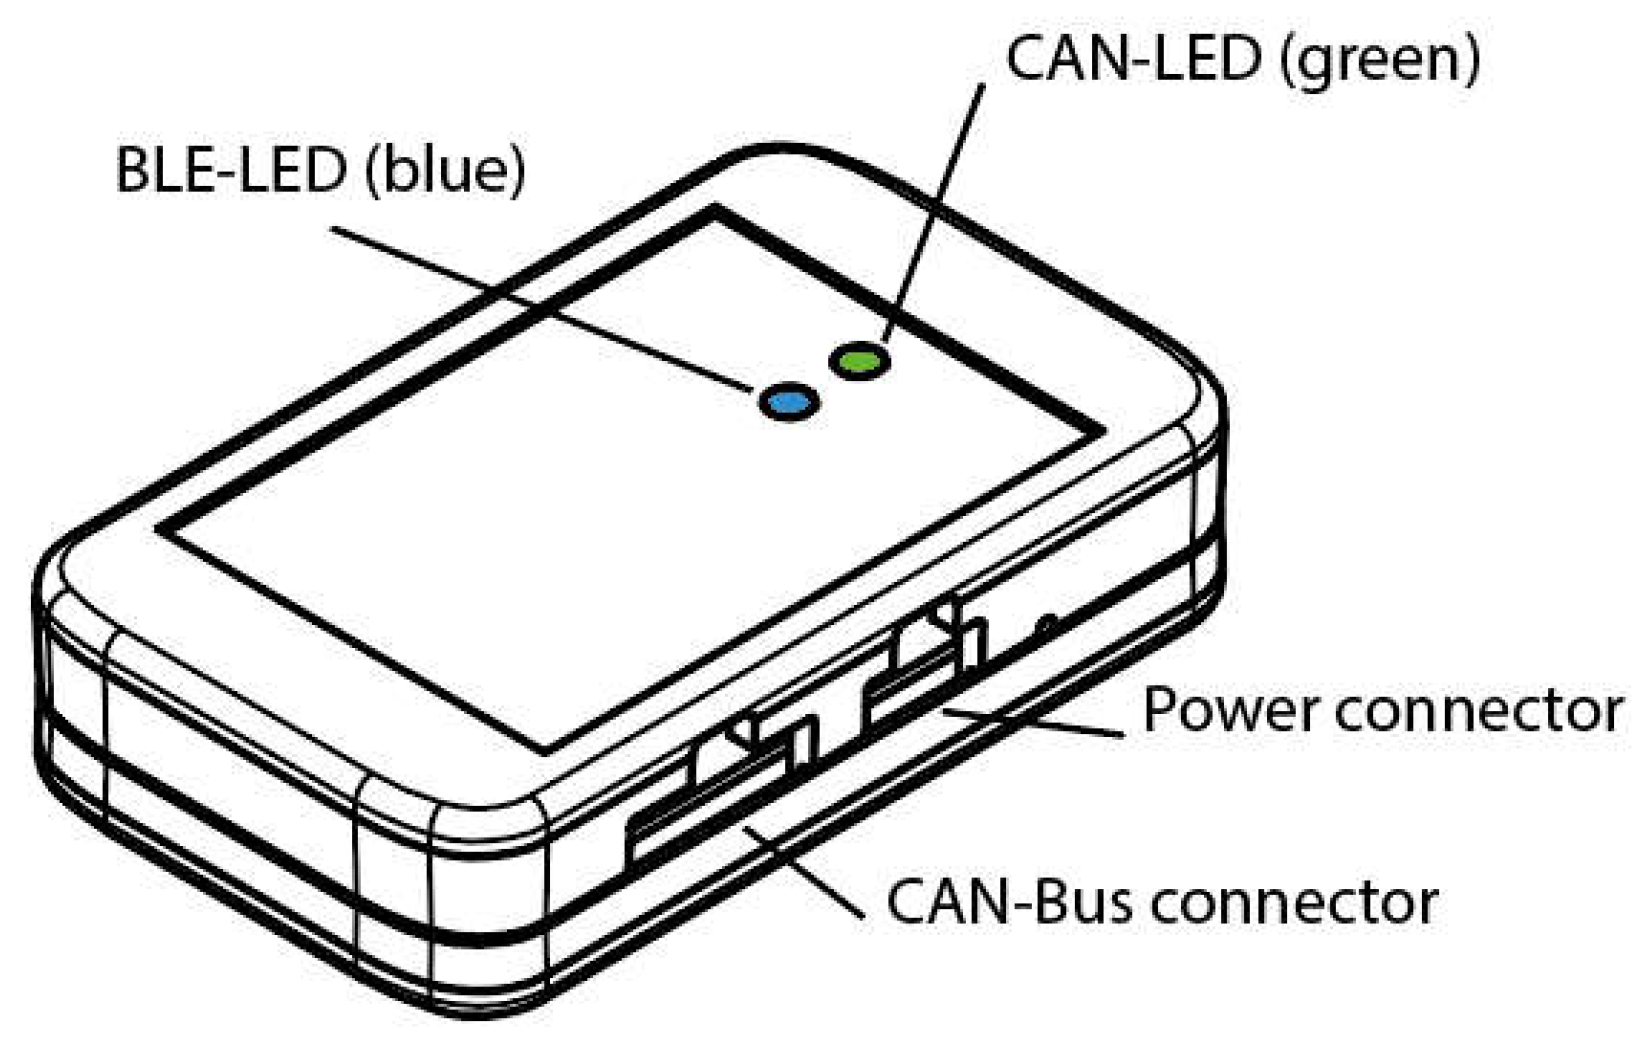
The only hardware component that is still required is a circuit that reads the desired data from the CAN bus and a way to transmit this to the tablet synchronously. Since only a small amount of data has to be transmitted, this task can easily be carried out via BLE (Bluetooth Low Energy). In addition, this standard, which has existed since 2009, is also state of the art for tablets. Furthermore, no further transmission devices such as cables, etc., are required, which saves costs and increases flexibility and sustainability. In principle, this remaining hardware effort can also be implemented in a very space-saving and energy-saving manner, especially since the BLE standard also has significantly lower power consumption than classic Bluetooth. This would allow for the invisible implementation of the hardware in the vehicle, e.g., under the dashboard or other trim parts, without affecting the wireless connection with the tablet. Furthermore, a dedicated display can be dispensed with. Only the BLE connection status (connected/not connected) and the successful receipt of a CAN message should be recognizable via an LED on the hardware housing for the purpose of troubleshooting. The only connections required are one to the 12-volt on-board power supply and one to the CAN bus. Figure 6 shows a schematic representation of the planned hardware structure in the housing.
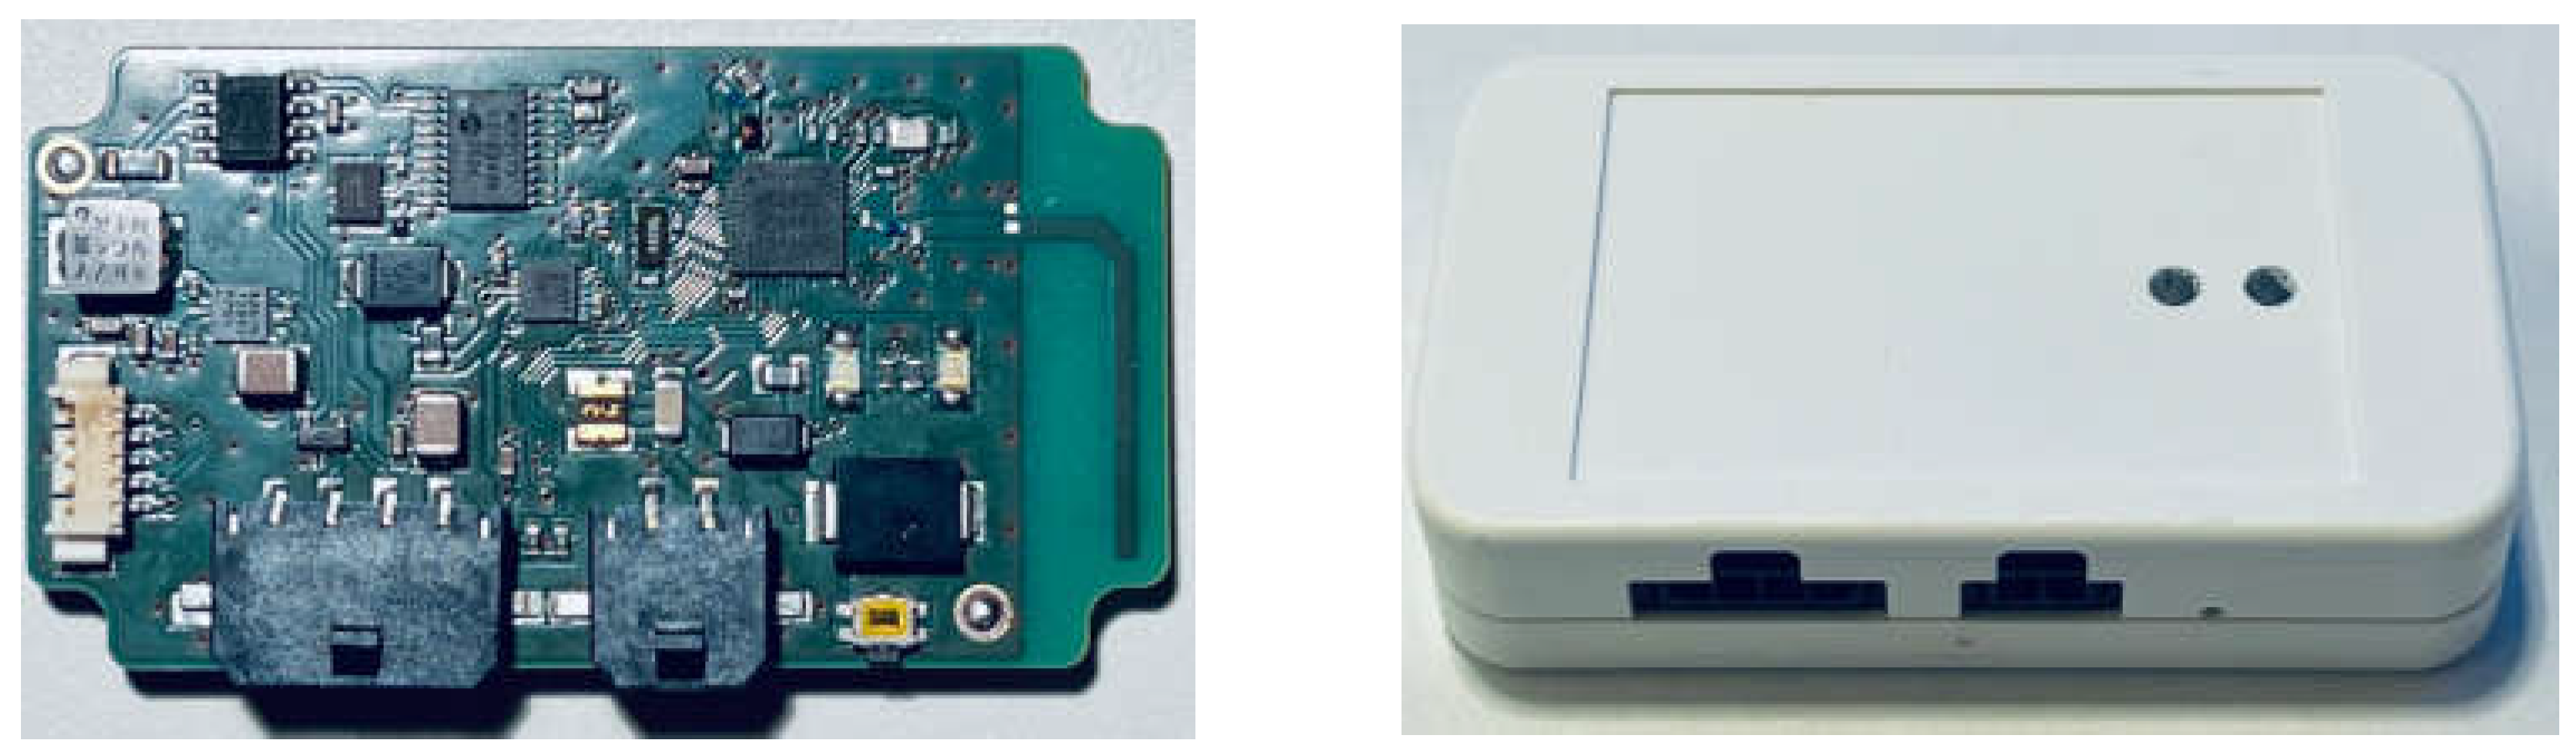
For the development of a first prototype, a Bluetooth Low Energy Development Kit from Nordic Semiconductor was used, which contains a BLE-capable SoC and a Mikroe CAN bus shield, on which a CAN transceiver and CAN controller are used. The most important required hardware components are included in these kits and designed in such a way that all essential pins are routed to the outside on headers. The Serial Peripheral Interface (SPI), a standardized 4-wire bus system that is supported by both components, is used for communication between the CAN bus shield and the SoC from Nordic Semiconductor. For test purposes, a micro-SD card was also connected to the SoC via SPI. When selecting the components, care was always taken to ensure that they are as energy-saving as possible during operation and have a particularly energy-saving standby mode due to the sustainability of the system. After some weeks of intense testing, the first prototype was routed and assembled. Afterwards, the desired case was prepared to install the first hardware prototype. Figure 7 shows the first prototype outside and inside the housing.
Due to the optimization carried out during the development phase in the direction of sustainability, the power consumption of the finished prototype with full BLE visibility is only 135 microamperes. In this state, the circuit could theoretically remain connected to a car battery with 75 ampere hours used in small cars for approx. 63 full years until it was completely discharged. This energy-saving mode makes it possible to operate the circuit on the vehicle’s permanent plus. A cumbersome switching on and off before and after each ride or an operation limited to the ignition plus of vehicles is no longer necessary. In addition, a microSD card reader was integrated into the circuit to write the received data onto an SD card if desired.
3.3.2. Software Setup
In addition, software is required that at least displays and evaluates the CAN bus data transmitted via BLE and can link this with image material. For this purpose, an Android app was developed using the free development environment Android Studio, which includes the desired range of functions as well as the additional functions described below. The programming language Kotlin was used for programming. Kotlin has been Google’s official preferred programming language for Android apps since May 2019. [HEI21].
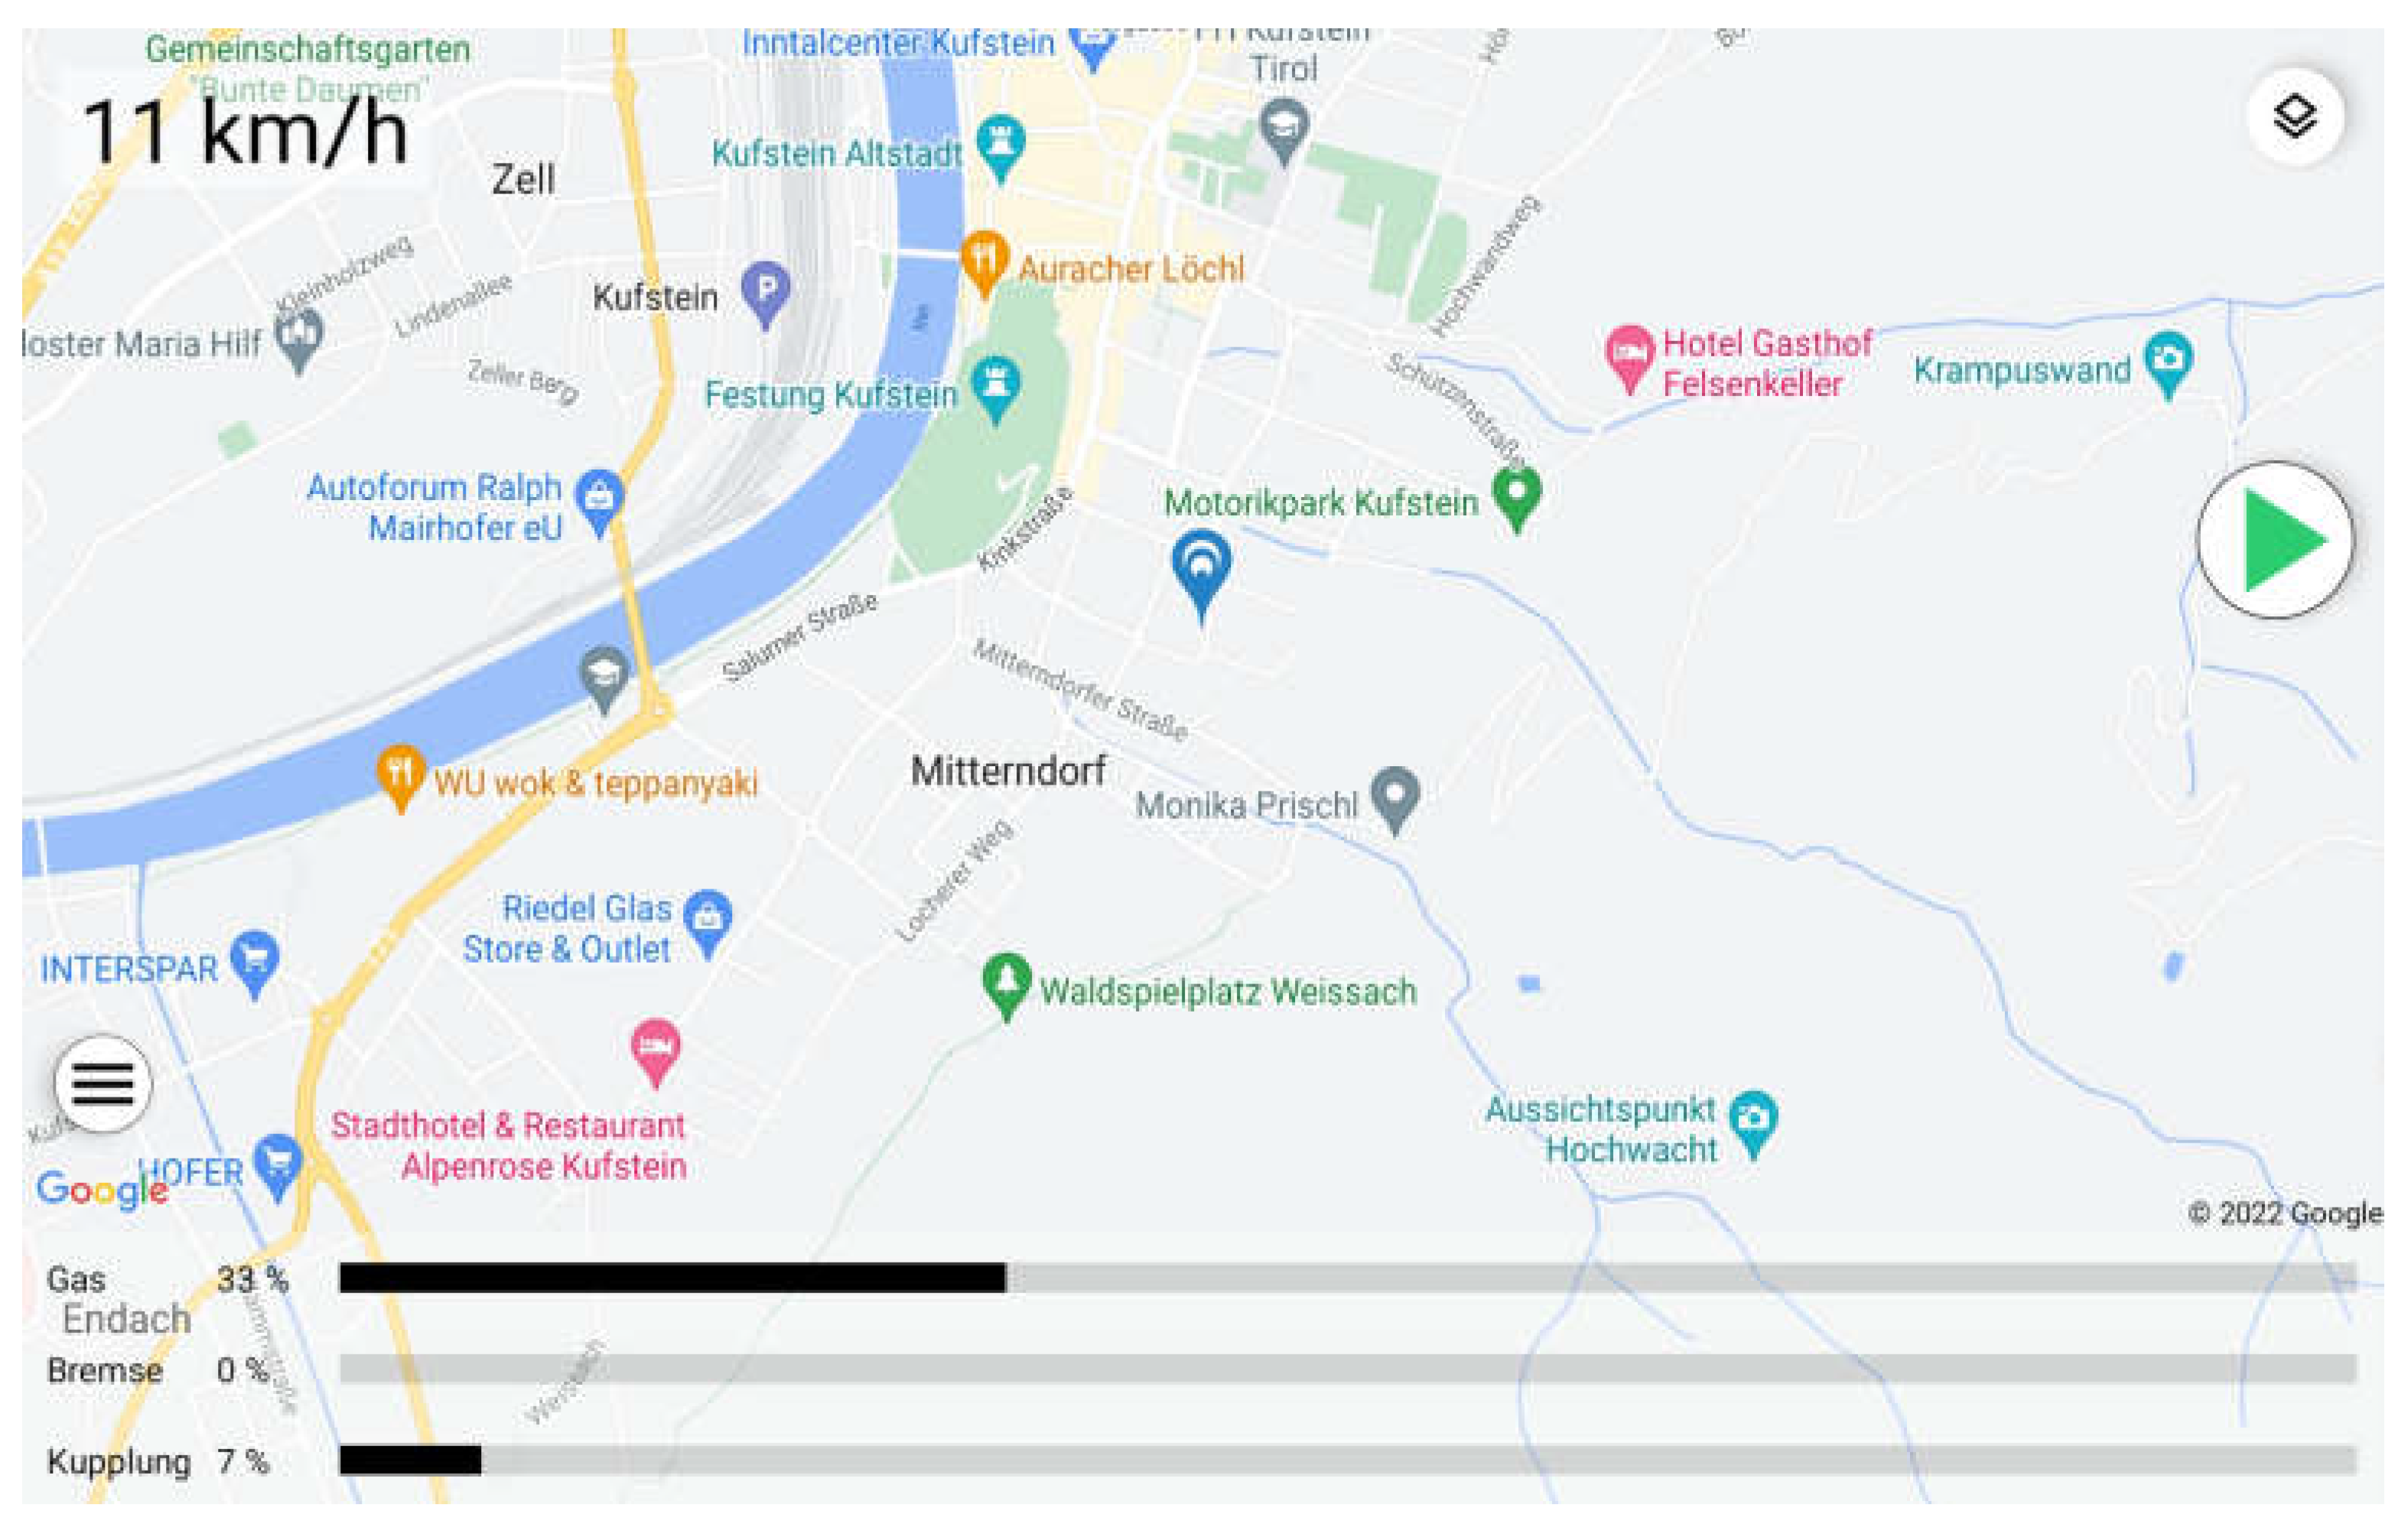
In the main view of the app shown in Figure 8, the current pedal positions of the vehicle read out from the CAN bus and transmitted to the tablet via Bluetooth Low Energy as well as the speed of the vehicle are displayed. The speed is displayed as a number in the top left and the pedal positions are displayed in the bottom as a number and as a bar. In the example, the current speed is 11 km/h with 33% accelerator pedal position, 0% brake pedal position, and 7% clutch pedal position. In addition, the current GPS position of the tablet is displayed using a blue marker. By clicking on the green arrow on the right side, the recording of the data can be started, which also activates the photo recording function.
To take pictures, the supervisor can either hold the tablet in their hands and choose any perspective or attach the tablet to a magnetic holder on the dashboard, for example. The trigger can be pressed on the tablet or an extra trigger the size of a button cell connected to the tablet via Bluetooth can be used to be able to react more quickly to interesting situations and not to distract the driver.
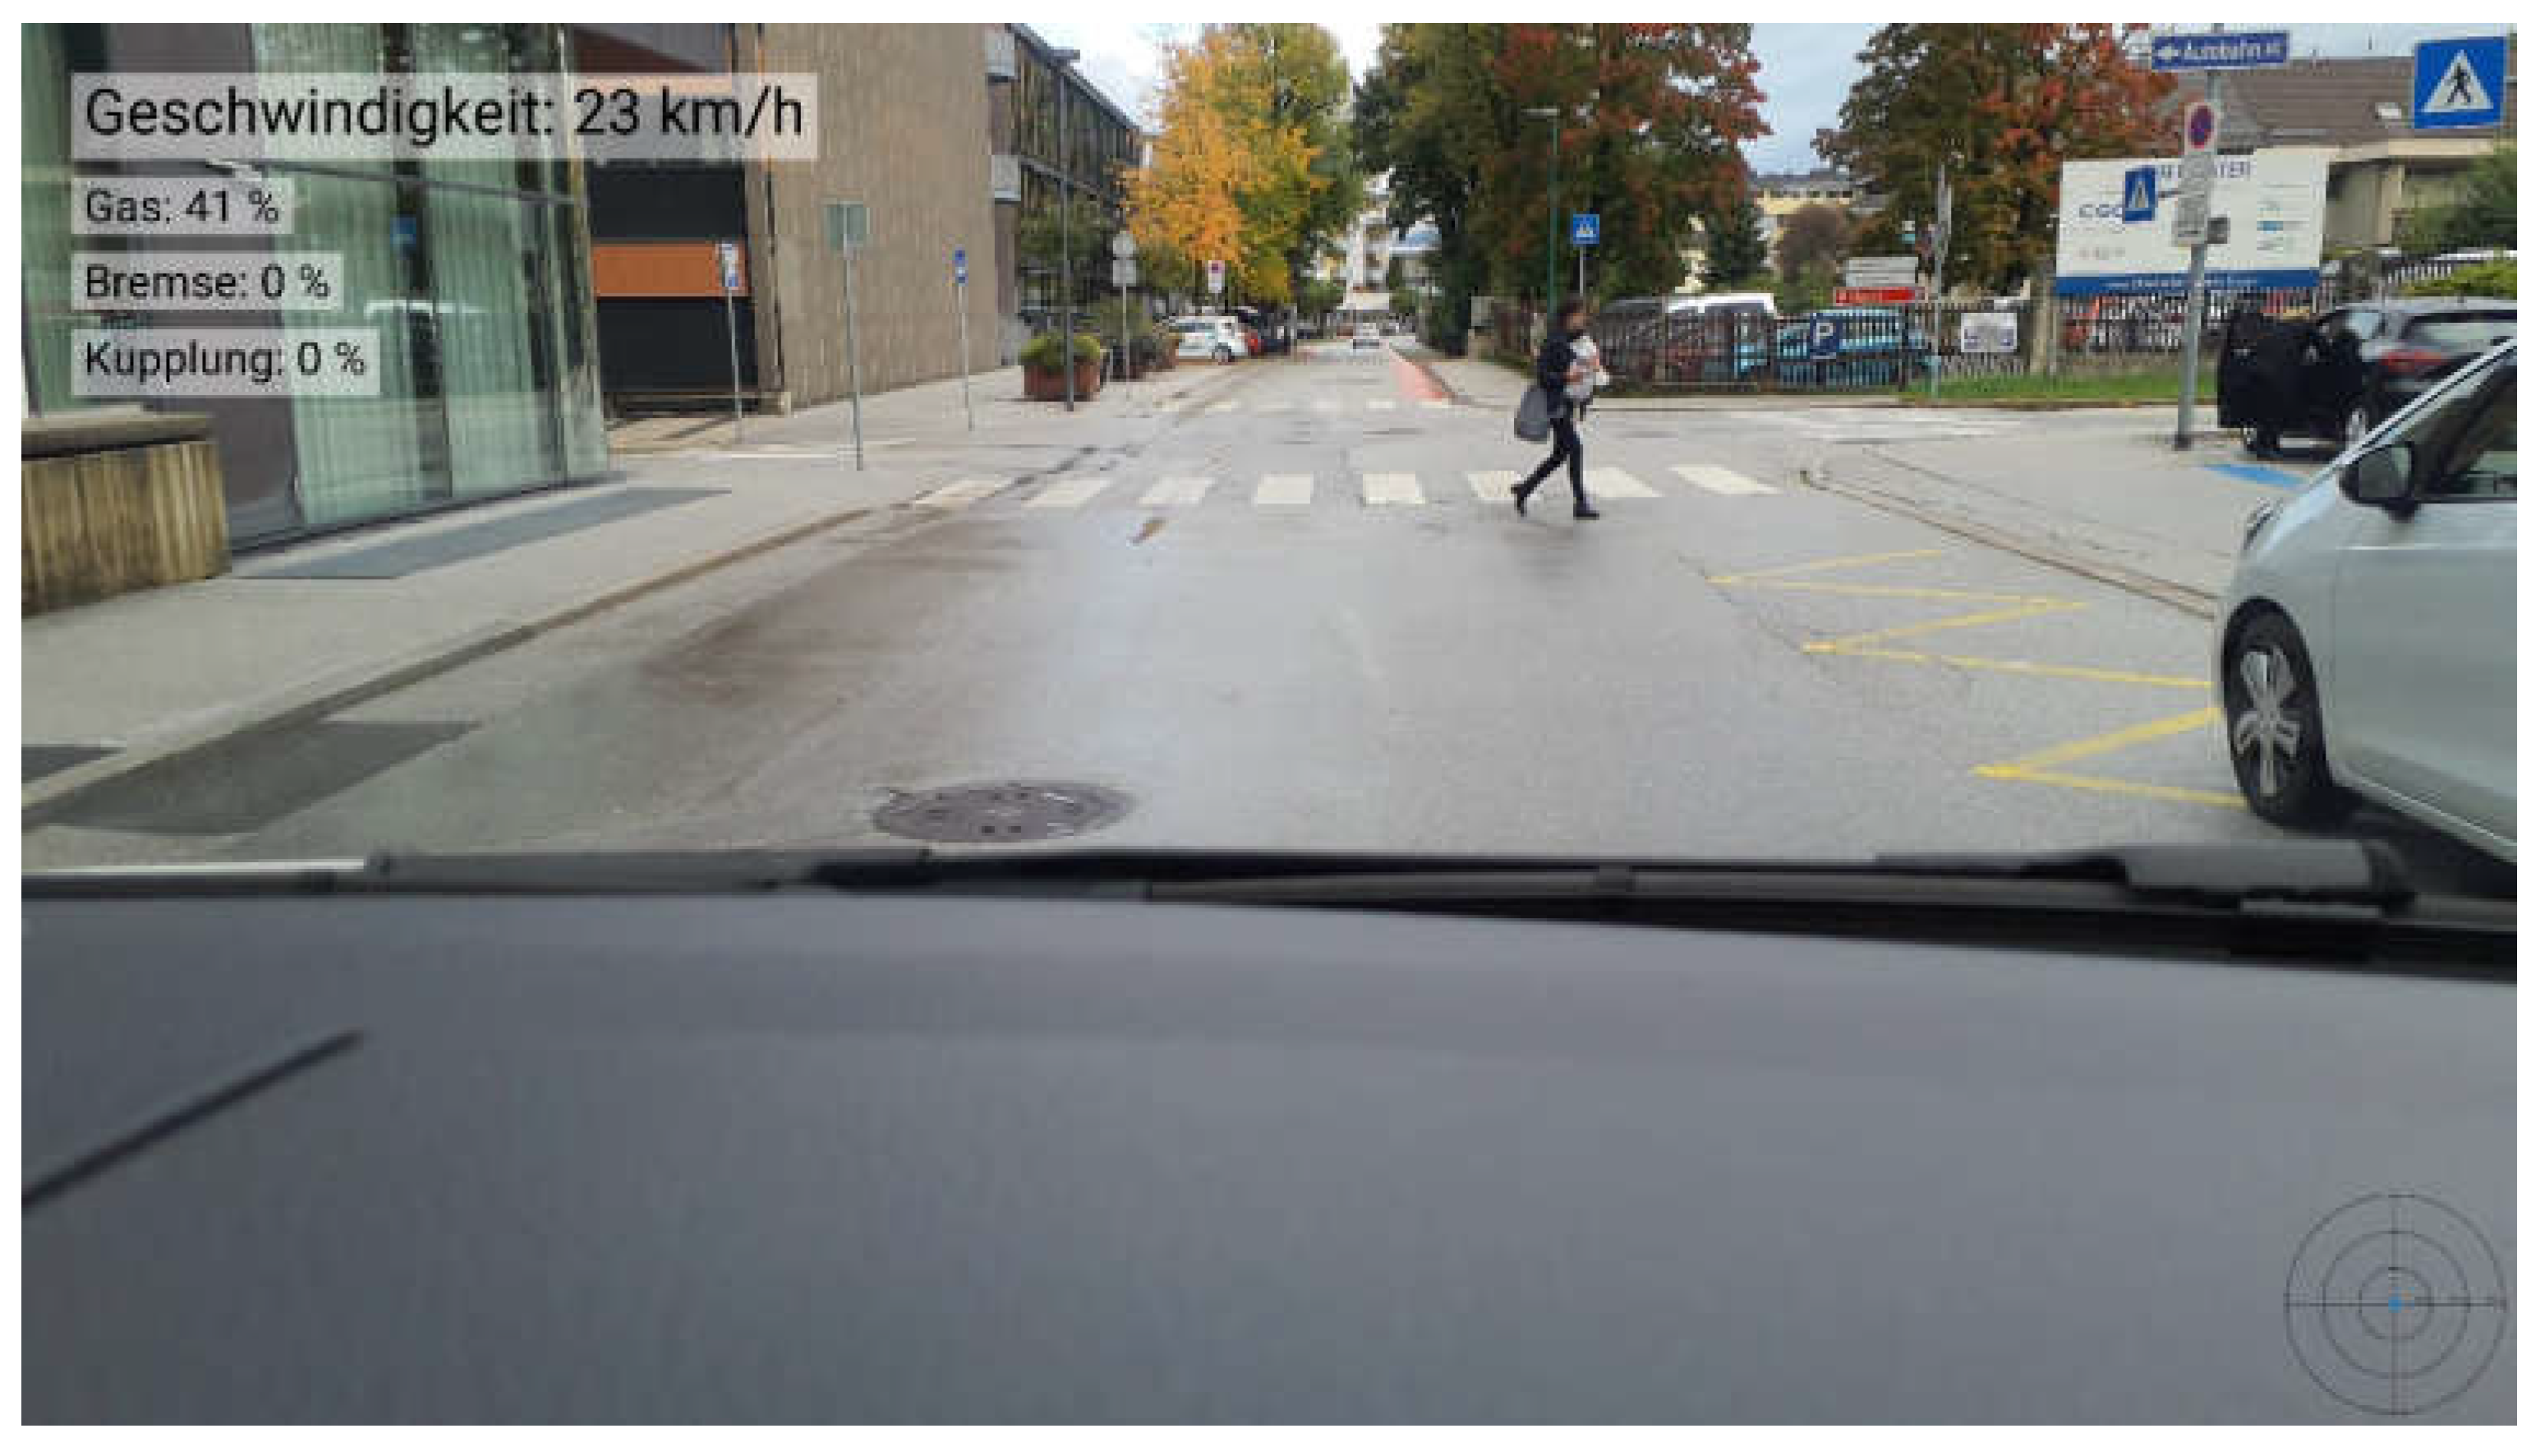
3.3.3. Picture Overlay
If a picture is taken with the photo function of the app, the pedal positions, and the speed at the time of recording are automatically synchronized and displayed as an overlay on the picture. Furthermore, an automatic recognition of faces and vehicle number plates was implemented in the app to automatically make these areas in the photo, which are sensitive under data protection law, unrecognizable or pixelated without further action. This process takes place completely and already at the time of recording directly on the tablet. In the picture in Figure 9, a young woman with a child is walking across a zebra crossing. The driver of the vehicle approaches this situation completely unadjusted at a speed of 23 km/h and with an accelerator pedal position of 41%. Due to the lack of eye tracking, it is not known in this case where the driver is looking and whether they even noticed the pedestrian. However, this information is ultimately irrelevant for assessing the ability to perceive hazards. What is evident is that a pedestrian is immediately in front of the vehicle and the driver approaches this situation in a completely unadapted manner. In any case, it can be said that the behavior is wrong in the sense of an adapted ability to perceive danger.
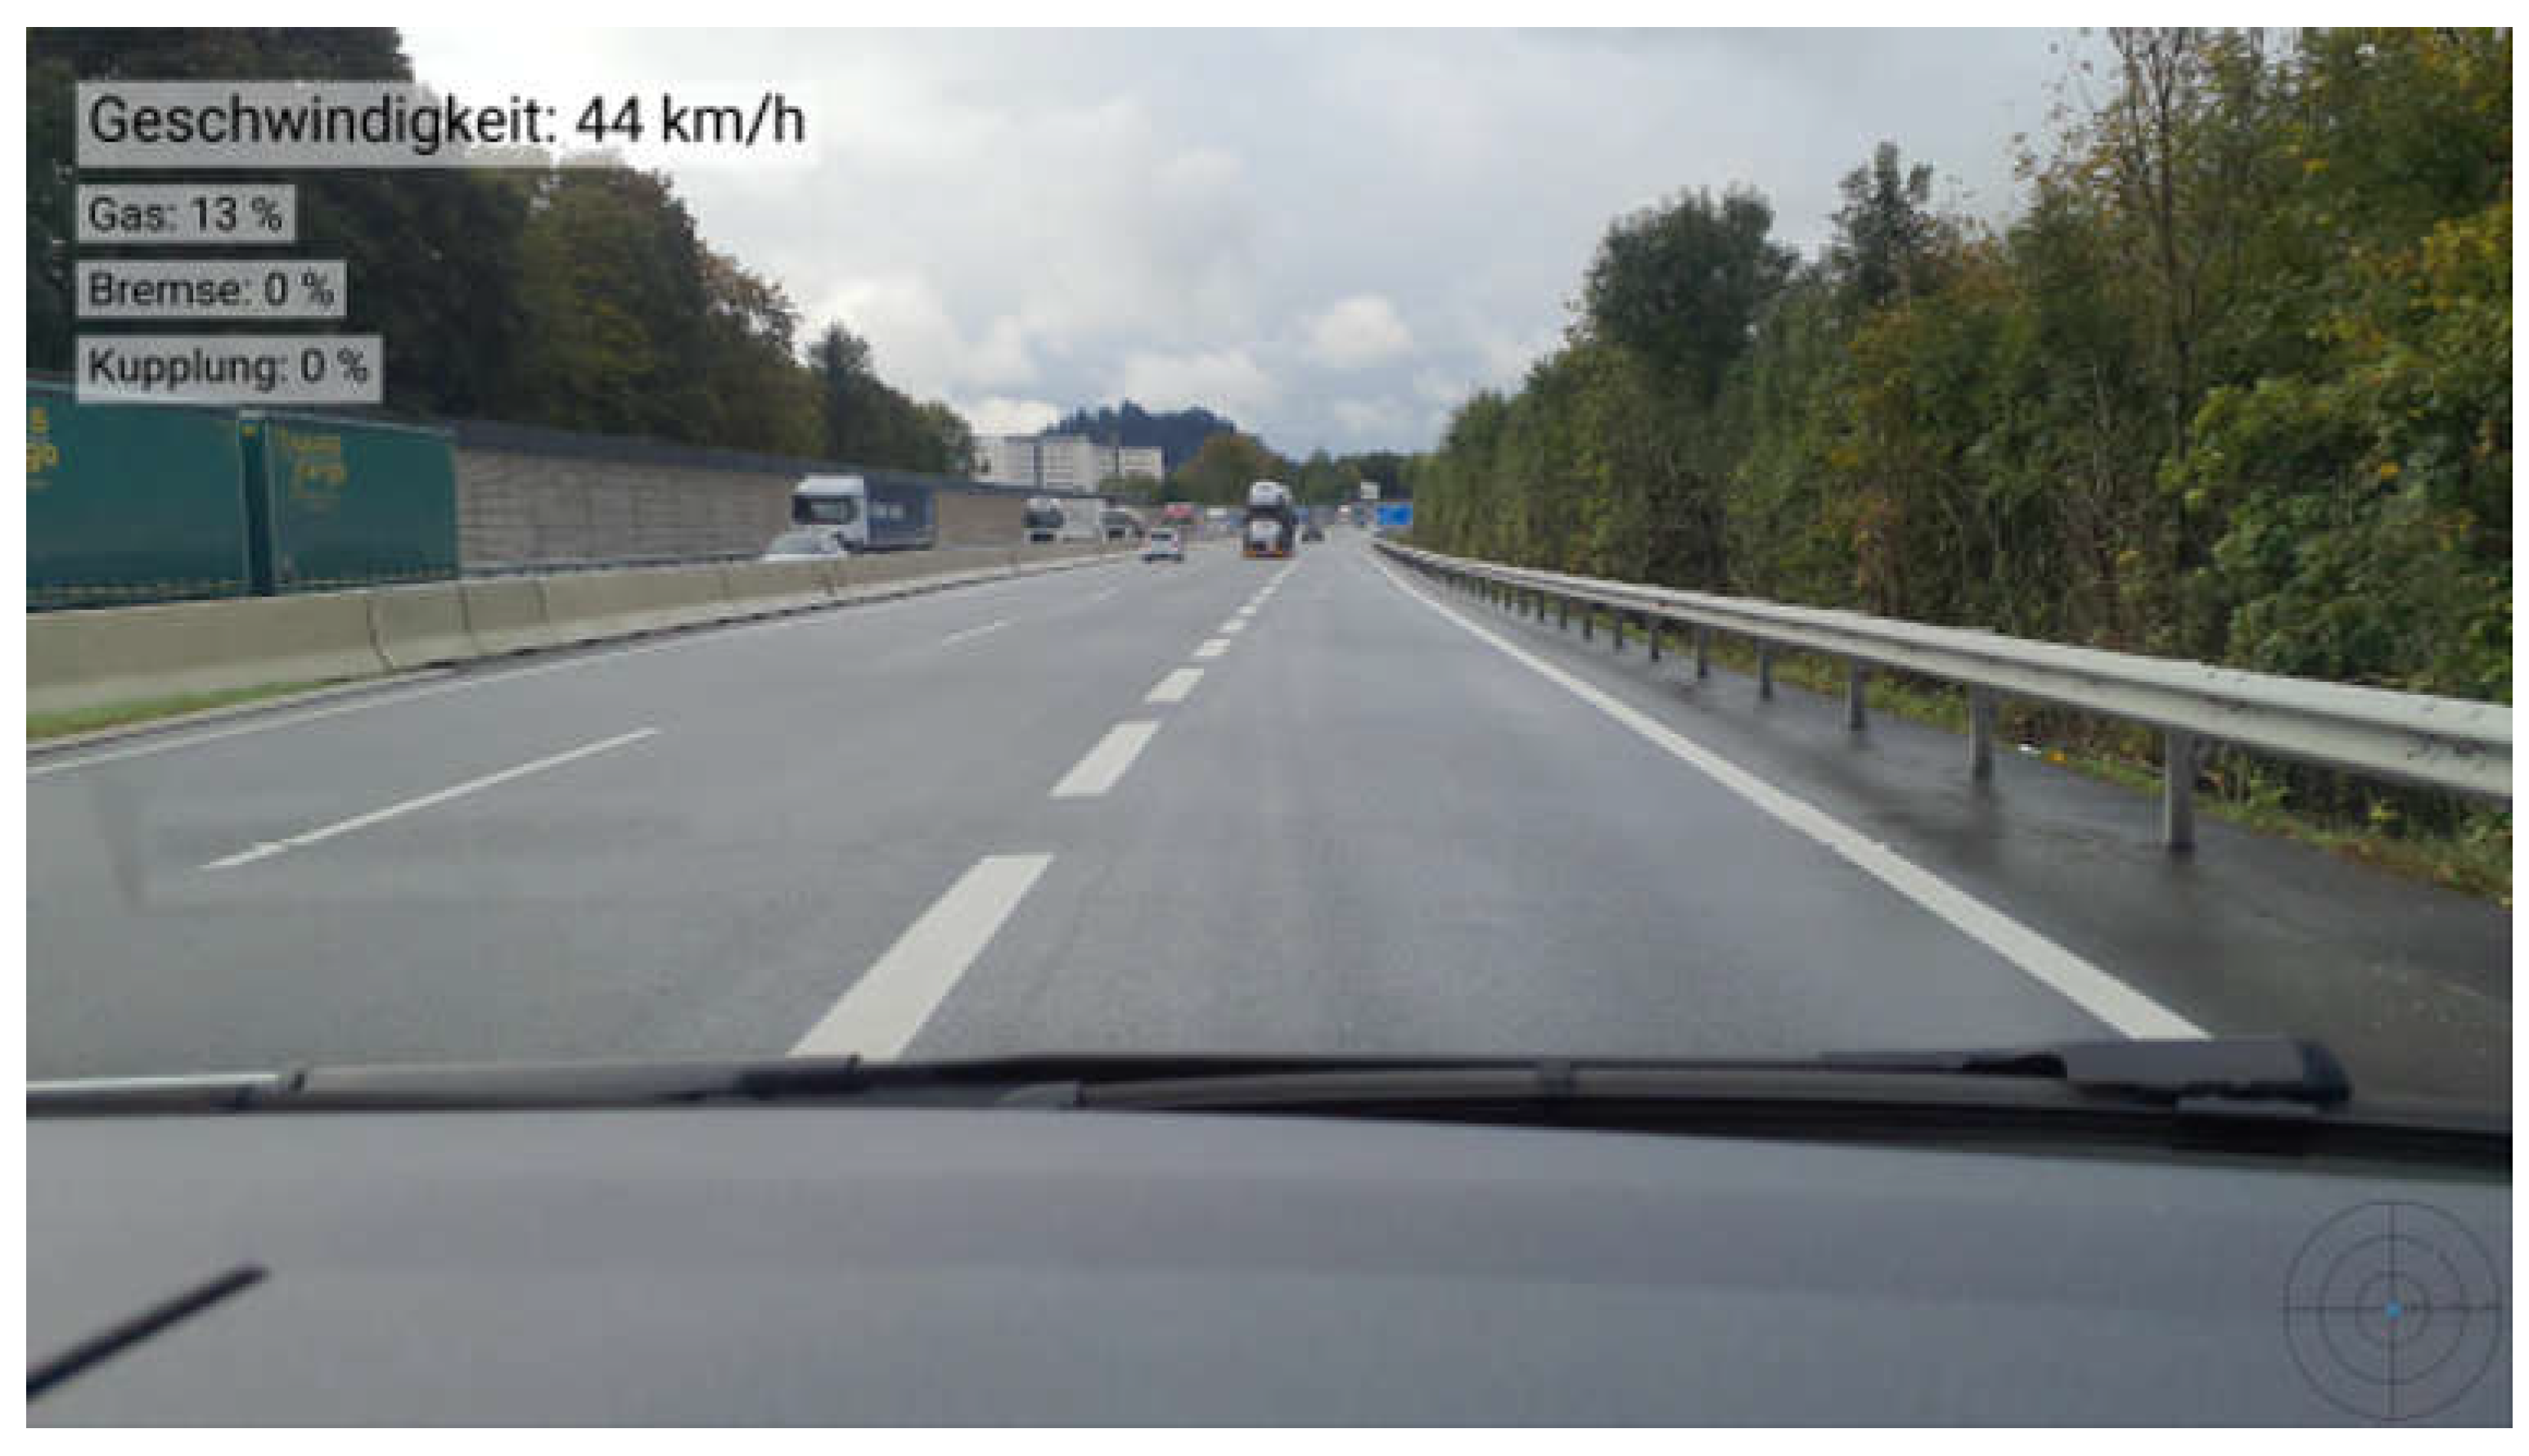
The next example shown in Figure 10 shows a situation that is unclear for the driver in relation to road or infrastructure safety. the vehicle drives onto a motorway at just 44 km/h and with the accelerator pedal pressed 13 percent. This means that the speed required to change lanes safely is not reached in the time required. This dangerous situation could possibly be prevented by improved signage.
3.3.4. Creation of Road and Infrastructure Safety Maps
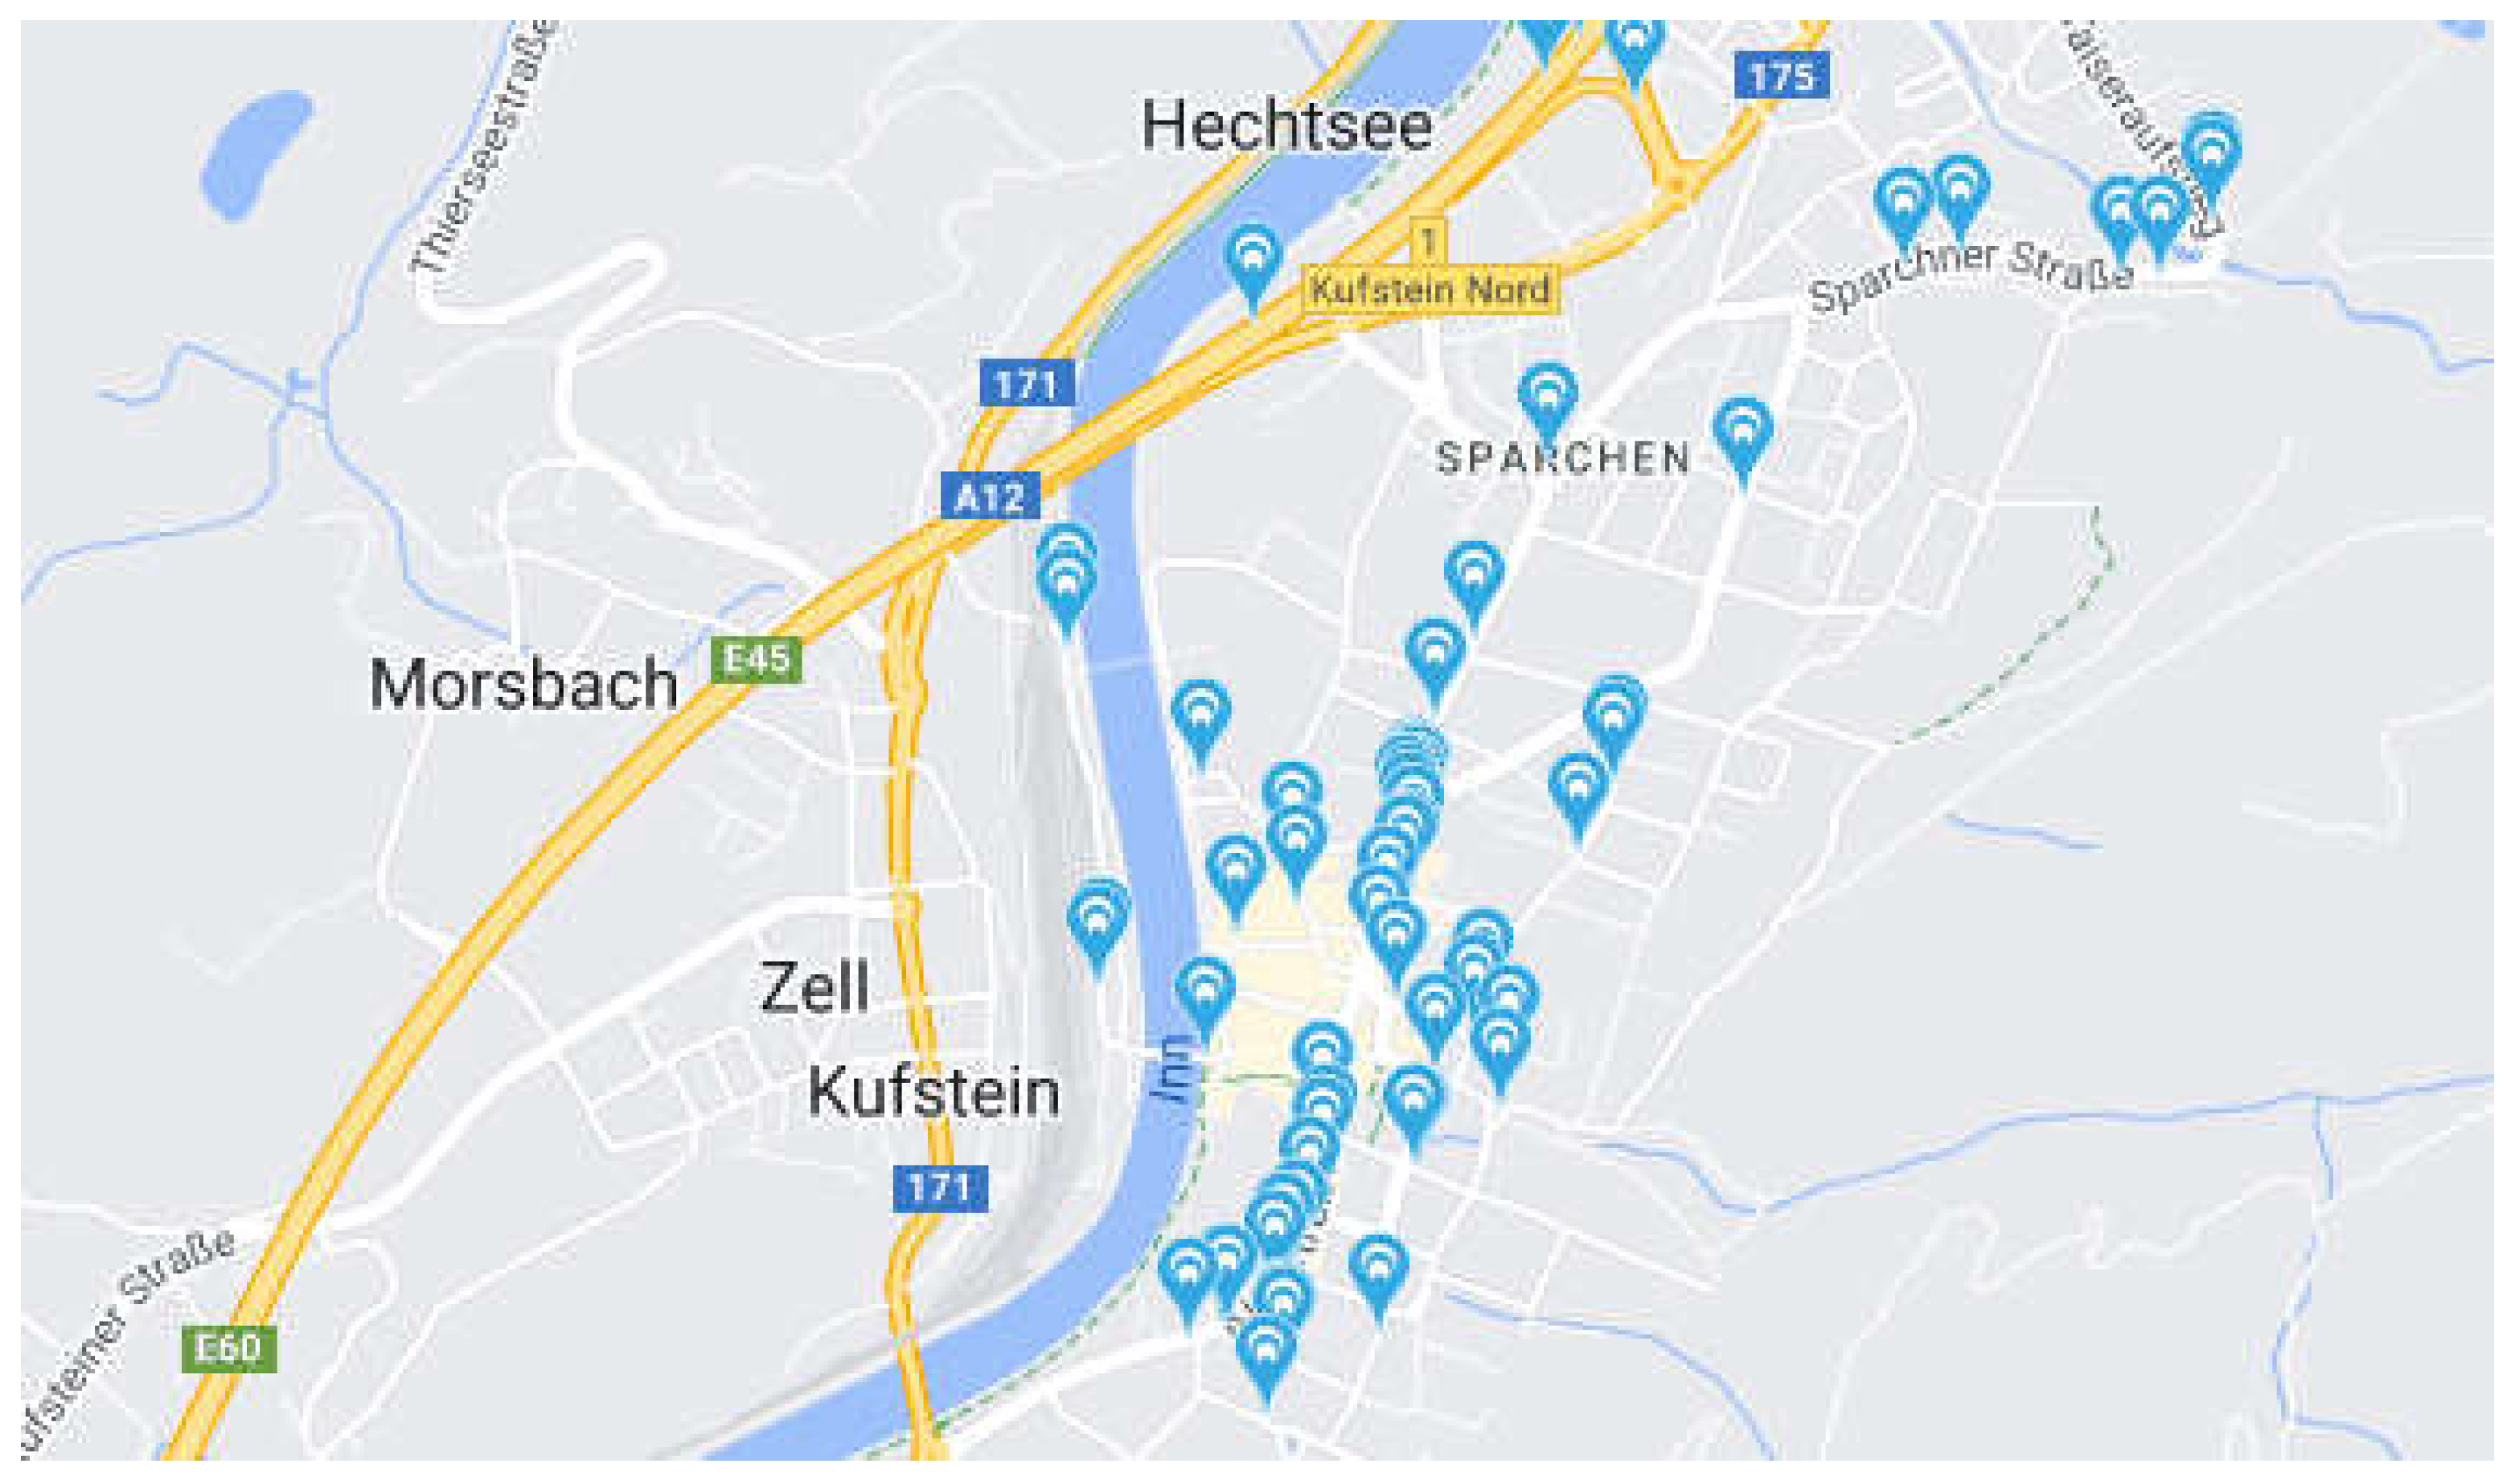
The photos taken, including the respective GPS coordinates, can be uploaded automatically and anonymously to cloud storage. For this purpose, a map view was also created in the form of an online platform in which the positions of the pictures taken are collected and displayed so that they can be filtered by the date they were taken. Figure 11 shows such a map view of recordings made. Clicking on one of the blue markers opens the corresponding photo. The more recordings are made, the more areas are shown in which more photos were taken. From this, it is possible to draw conclusions about streets or areas of road traffic in which there are obviously often situations that are worth noting in relation to road and infrastructure safety. This means that areas such as accident blackspots or unclear road layouts can also be identified and shared online within the cloud.
3.3.5. Use in Practical Driver Training
System 2 was evaluated for 3 months in 4 driving school cars in Austria in selected driving lessons. A total of 114 driving hours were accompanied and recorded. All learner drivers who completed at least one driving lesson with the system were asked about the added value of accompanied driving lessons in an anonymous questionnaire after completing their training. In total, 97% of the students stated that the images created represent added value in their driver training compared to driving lessons that are not accompanied by the system. A total of 84% stated that the lessons learned from the pictures taken had a more lasting impact on driving behavior than purely verbal feedback. Furthermore, they agreed that the quality of the debriefing was significantly better through the use of the system without costing the student valuable driving time. The 4 driving instructors involved in the evaluation period all agreed that the demonstrative character of the pictures taken during the debriefing led to significantly fewer discussions with the students, since the students no longer had the opportunity to dispute their (wrong) behavior.
By using the map view, it was also possible to identify some road areas where learner drivers had problems particularly often or where the traffic signs installed obstruct the view of the approaching traffic. This information is also of great importance with regard to sustainable road design. Since then, the map view and the recordings made have also been used in the theory course in order to learn from the mistakes of others at an early stage.
3.3.6. Conclusion—System 2
Even if System 2, as shown in Figure 4, only offers a limited insight into the process of perception and therefore does not enable the response or reaction time to be measured, it is sufficient for the use in identifying problems in road and infrastructure safety or in the field of driver training. It can be made clear whether a driver has coped well or badly with a situation as driving errors or non-adapted behavior can ultimately still be pointed out by a picture. Here, too, the use takes place entirely in real traffic. Ultimately, the test drivers are not impaired by the wiring and putting on eye-tracking glasses, nor are they nervous because of the knowledge that extensive measurements are carried out with the eye-tracking glasses, which means their driving behavior is therefore not completely natural. With System 2, the driver does not have to be informed at all that measurements of the pedal positions or photos are to be taken. Through the described use of a Bluetooth remote control, the driver who is focused on road traffic hardly notices the photographing. This ensures that they find themselves in a completely familiar environment and act completely naturally. In addition, the unit costs can be reduced from around EUR 12,000 for System 1 to around EUR 250 per vehicle. This ensures cost-effective and comprehensive use. The evaluation of the generated material is easy and does not need any time-consuming preparation. Furthermore, the results can be easily saved online and can be evaluated in the form of a map view, which means that no time is lost, and no additional costs are incurred. The app can also be easily operated by people without IT knowledge and does not require lengthy training or an additional high-performance computer. The use of the system was assessed as mostly positive by both the students and the instructors. In total, 84% of the students also stated that this training had a lasting effect on their driving behavior.
4. Discussion
The developed System 1 has the great advantage that the complete process of visual information acquisition can be analyzed and recorded down to the last detail. This makes it possible to record whether a driver focuses on a possible danger at all or not, and in what exact period they react to it. This makes it possible to analyze chains of behavior in complex traffic situations with an accuracy of fractions of a second and to give the supervisor or driver undreamt-of insights into traffic perception and their own traffic characteristics. However, the price of this powerful tool is very high in terms of acquisition and time required for evaluation and presentation. The temporal component could be countered by integrating the driving data read from the CAN bus directly into the eye-tracking video via an interface at runtime. This would make the laborious synchronization and overlaying of the two data streams, which were previously only recorded separately, superfluous. However, the high price of an eye-tracking system remains a stumbling block for widespread use.
In summary, the development of System 2 reverses the advantages and disadvantages of System 1. The omission of eye-tracking lowers the costs, but also the possibility to dive deep into the process of visual information acquisition. The use of images instead of videos, the automatic time-synchronous superimposition, and the elimination of calibration reduces the time required to accompany the process many times over. The use of an Android app also simplifies operation considerably and eliminates the need for evaluation on a desktop PC. As a result, far less IT knowledge is required for operation, which makes System 2 ideal for use in the fields of infrastructure and road safety or driver training across the board and at low cost. In addition, the generated image material can also be displayed automatically online in a map view used for further investigation of road safety aspects such as identifying accident blackspots or confusing road design. The possibility of combining the advantages of both systems without merging the disadvantages would only be possible through the development of an eye-tracking system which is able to record the external data stream of the vehicle data as an input signal and to process it synchronously without any further action.
If it is of great importance for an application to depict the complete perception process instead of a snapshot, and the dynamic creation of this moment is also of great importance, then the disadvantages of System 1 must be accepted. In summary, based on the experience gained so far, it can be recommended that System 2 be used frequently due to the simpler operation and lower costs to identify frequent sources of error or dangerous road sections based on the frequency of recordings made in those locations. With the experience gained in this way, these errors or situations can then be subjected to a more in-depth analysis with System 1.
As part of this research, both systems were successfully tested in the following vehicles: Audi A3 8V, Audi A3 8Y, Audi A6 4G, BMW 3 Series G21, Mercedes A W177, Mercedes GLA X156, VW Golf 2021, VW T6 2018, VW T-Cross 2019, and VW T Roc 2021. In principle, however, both systems can be used in all vehicles in which the relevant driving data is available on the CAN bus.
For further research work, the development of algorithms has been planned that, based on the recorded driving data, are able to automatically assess the driver with regard to certain characteristics such as anticipatory driving and economical driving style, but also with regard to their ability of hazard perception. By integrating the map display, the possibility of automatic detection of hazard accumulation points and problem areas in road design should also be examined. The cost-effective and comprehensive use of System 2 could make a valuable contribution to sustainable driver training and traffic management.
Author Contributions
Conceptualization, H.S. and T.K.; methodology, H.S.; hardware, H.S.; software, H.S.; formal analysis, H.S.; data curation, H.S.; writing—original draft preparation, H.S.; writing—review and editing, H.S. and T.K.; visualization, H.S. All authors have read and agreed to the published version of the manuscript.
Funding
This research received no external funding.
Conflicts of Interest
The authors declare no conflict of interest.
References
- Wang, F.; Di, S.; Liu, H.; Zhang, W. Study on Driver’s Subjective Perception of Road Safety and Traffic Safety. In Proceedings of the 11th International Conference of Chinese Transportation Professionals (ICCTP), Nanjing, China, 14–17 August 2011; pp. 29–35. [Google Scholar]
- Horswill, M.; Hill, A. Drivers’ Hazard Perception Skill, International Encyclopedia of Transportation; Elsevier: Amsterdam, The Netherlands, 2021; pp. 151–157. [Google Scholar]
- Arnaout, G.M.; Arnaout, J.-P. Exploring the effects of cooperative adaptive cruise control on highway traffic flow using microscopic traffic simulation. Transp. Plan. Technol. 2014, 37, 186–199. [Google Scholar] [CrossRef]
- Paddeu, D.; Parkhurst, G.; Shergold, I. Passenger comfortand trust on first-time use of a shared autonomous shuttle vehicle. Transp. Res. Part C 2020, 115, 102604. [Google Scholar] [CrossRef]
- Boufous, S.; Ivers, R.; Senserrick, T. Mark Stevenson, Attempts at the practical on-road driving test and the hazard perception test and the risk of traffic crashes in young drivers. Traffic Inj. Prev. 2011, 12, 475–482. [Google Scholar] [CrossRef] [PubMed]
- Cheng, A.S.K.; Ng, T.C.K.; Lee, H.C. A comparison of the hazard perception ability of accident-involved and accident-free motorcycle riders. Accid. Anal. Prev. 2011, 43, 1464–1471. [Google Scholar] [CrossRef] [PubMed]
- Congdon, P. Vic Roads Hazard Perception Test: Can It Predict Accidents; Australian Council for Educational Research: Camberwell, VIC, Australia, 1999. [Google Scholar]
- McKenna, F.; Horswill, M. Hazard perception and its relevance for driver licensing. J. Int. Assoc. Traffic Saf. Sci. 1999, 23, 26–41. [Google Scholar]
- Quimby, A.R.; Maycock, G.; Carter, I.D.; Dixon, R.; Wall, J.G. Perceptual Abilities of Accident Involved Drivers; Transport and Road Research Laboratory: Crowthorne, UK, 1986. [Google Scholar]
- Tūskė, V.; Šeibokaitė, L.; Endriulaitienė, A.; Lehtonen, E. Hazard perception test development for Lithuanian drivers. IATSS Res. 2019, 43, 108–113. [Google Scholar] [CrossRef]
- Pfleger, E. Fehler der Wahrnehmungen des Lenkers als Ursache von Verkehrsunfällen. Sachverständige 2018, 1, 11–21. [Google Scholar]
- ÖNORM V 5050:2011; Traffic-Accident and Vehicle Damage―Terminology, Appendix A. Austrian Standards Institute: Vienna, Austria, 2011.
Figure 1.
Perception and response according to [11].
Figure 1.
Perception and response according to [11].

Figure 2.
Installation location of the control unit J533 in the Audi A3 8V.

Figure 3.
Front view of the Viewpointsystem VPS16.

Figure 4.
Eye-tracking video overlaid with signals from the datalogger.

Figure 5.
Perception and response without eye tracking.

Figure 6.
Schematic representation of the hardware setup.

Figure 7.
Hardware prototype outside and inside the case.

Figure 8.
Main view of the app.

Figure 9.
Picture taken with overlaid vehicle data—focus: hazard perception.

Figure 10.
Picture taken with overlaid vehicle data—focus: road safety.

Figure 11.
Pictures taken in a specific map section.


Table 1.
CAN IDs of the Audi A3 8V used.
| Signal | CAN-ID | Start Bit | Bit Length |
|---|---|---|---|
| Accel. pedal | 0 × 391 | 40 | 8 |
| Braking pedal | 0 × 106 | 16 | 10 |
| Clutch pedal | 0 × 104 | 32 | 8 |
| Steering wheel angle | 0 × 086 | 16 | 14 |
| RPM | 0 × 107 | 24 | 12 |
| Speed | 0 × 30B | 48 | 10 |
Disclaimer/Publisher’s Note: The statements, opinions and data contained in all publications are solely those of the individual author(s) and contributor(s) and not of MDPI and/or the editor(s). MDPI and/or the editor(s) disclaim responsibility for any injury to people or property resulting from any ideas, methods, instructions or products referred to in the content. |
© 2023 by the authors. Licensee MDPI, Basel, Switzerland. This article is an open access article distributed under the terms and conditions of the Creative Commons Attribution (CC BY) license (https://creativecommons.org/licenses/by/4.0/).
Share and Cite
MDPI and ACS Style
Sappl, H.; Kubjatko, T. A Driver Behavior Monitoring System for Sustainable Traffic and Road Construction. Sustainability 2023, 15, 12305. https://0-doi-org.brum.beds.ac.uk/10.3390/su151612305
AMA Style
Sappl H, Kubjatko T. A Driver Behavior Monitoring System for Sustainable Traffic and Road Construction. Sustainability. 2023; 15(16):12305. https://0-doi-org.brum.beds.ac.uk/10.3390/su151612305
Chicago/Turabian StyleSappl, Hannes, and Tibor Kubjatko. 2023. "A Driver Behavior Monitoring System for Sustainable Traffic and Road Construction" Sustainability 15, no. 16: 12305. https://0-doi-org.brum.beds.ac.uk/10.3390/su151612305
Note that from the first issue of 2016, this journal uses article numbers instead of page numbers. See further details here.