Article

Using PLE-SEM to Quantify the Impacts of Natural and Human Factors on Vegetation Change: A Case Study of the Jialing River Basin

1
State Key Laboratory of Eco-Hydraulics in Northwest Arid Region, Xi’an University of Technology, Xi’an 710054, China
2
Key Laboratory of National Forestry Administration on Ecological Hydrology and Disaster Prevention in Arid Regions, Xi’an University of Technology, Xi’an 710048, China
3
Northwest Surveying, Planning Institute of National Forestry and Grassland Administration, Xi′an 710048, China
4
Northwest Engineering Corporation Limited, Xi’an 710065, China
5
Yulin High-Tech Zone Yuheng No. 1 Industrial Sewage Treatment Company, Yulin Coal Chemical Waste Resource Utilization and Low Carbon Environmental Protection Engineering Technology Research Center, Yulin 719000, China
*
Author to whom correspondence should be addressed.
Sustainability 2023, 15(17), 13089; https://0-doi-org.brum.beds.ac.uk/10.3390/su151713089
Submission received: 25 June 2023 / Revised: 31 July 2023 / Accepted: 28 August 2023 / Published: 30 August 2023
(This article belongs to the Special Issue Soil Erosion and Water and Soil Conservation)

Abstract

:
Vegetation cover is an important indicator reflecting changes in terrestrial ecosystems and plays an important role in regulating and maintaining ecosystem stability. To investigate the spatial and temporal variations in the NDVI (normalized difference vegetation index) and their intrinsic driving influences, this paper uses trend analysis and a barycentric model to study the temporal and spatial variation characteristics of vegetation in the Jialing River Basin from 2000 to 2020, constructs PLS-SEMs (partial least squares structural equation models), analyzes the indirect and direct effects of latent and observable variables of surface, human activities, and climate on vegetation growth, and explores the driving processes of different levels of NDVI. The vegetation center gradually migrates northwards. The impact of surface factors on the NDVI is mainly direct and positive. The impact of human activities on the NDVI is mainly direct and negative. The impact of climate factors on the NDVI is mainly positive. The driving mechanisms of low and medium NDVI are relatively similar but tend to be opposite to those of high NDVI. Medium and high NDVI values are more influenced by observable variables. The research on vegetation change and its driving factors, through indirect and direct paths, illustrates the driving processes of different latent and observable variables of the NDVI in more detail and provides a theoretical basis for the implementation of ecological restoration projects and construction of ecological civilizations in the future.

1. Introduction

Vegetation cover serves as an essential indicator for assessing erosion intensity [1,2]. It exhibits a certain level of response to soil erosion in watersheds [3] and changes in the regional ecological environment [4,5,6,7]. It plays an important role in regulating and maintaining ecosystem stability. The NDVI (normalized difference vegetation index) can accurately and effectively reflect the surface vegetation cover [8,9,10] and is now widely used in studies related to regional vegetation changes. The influence of rainfall and temperature on the NDVI cannot be understated, as they directly impact local hydrothermal conditions and subsequently affect vegetation cover in the area [11]. To enhance the accuracy of analyzing nonlinear mutations and spatial-temporal changes in the NDVI, researchers have suggested combining traditional trend analysis methods with mutation tests [12]. This holistic approach enables a more precise evaluation of the behavior exhibited by the NDVI. Of notable significance are the distinct spatial variations observed in vegetation cover across different seasons [13]. Furthermore, in the Yanghe River Basin, it has been observed that the maximum NDVI is primarily influenced by annual precipitation rather than by annual mean temperature [14]. These findings contribute to our understanding of the environmental factors impacting vegetation dynamics.
The NDVI is not only affected by changes in natural climate factors, but in fact, is also influenced by surface factors such as elevation [15], slope [16], slope direction [17], landform type, and soil type [18]. Moreover, anthropogenic factors like land use type [19], GDP [20], and population density [21,22] can also impact the NDVI. Research shows that the spatial and temporal distribution changes in NDVI are jointly dominated by annual precipitation, mean annual temperature, vegetation type, and soil type [23]. Each driving factor exhibits significant interaction in the spatial distribution changes of vegetation cover [24]. Human activities were found to exert the greatest influence on the NDVI in the lake estuary of the Taihu Lake system below Wujiang River and the main stream [25]. Additionally, a positive correlation was observed between the NDVI in India and rainfall during the southwest and northeast monsoon periods [26], while a close relationship was identified between NDVI decline and reduced rainfall in the internal seas of the Americas [27]. Nevertheless, although previous research has provided quantitative analyses of the impacts of individual driving factors on the NDVI, it often fails to differentiate between the indirect and direct effects of surface, human activity, and climate factors on the NDVI. It also overlooks the response of different levels of NDVI to different types of influencing factors.
The Jialing River Basin is one of the areas with relatively serious water and soil loss in the Yangtze River Basin. Due to the loose soil in the loess area upstream, the purple shale at the middle and lower reaches is easily weathered, and the soil loss is serious. The average annual erosion and sediment yield is 366 million tons. It is one of the main sediment-producing areas in the upper reaches of the Yangtze River [28]. Some scholars have studied the impacts of population density, elevation, and climate on the NDVI in the Jialing River Basin [29,30], but there is a lack of relevant research on other surface, climate, and human activity factors. Additionally, most previous studies adopted the correlation analysis method [31], thus failing to quantitatively analyze the indirect and direct impacts of driving factors on changes in vegetation in the Jialing River Basin. Partial least squares structural equation modeling (PLS-SEM) can handle complex relationships between multiple latent and observable variables. By building a structural equation model, the causal relationship between different latent and observable variables can be quantified and evaluated, so as to better understand the mechanism and influencing factors of the research object.
Therefore, this paper uses the trend analysis method to study the temporal and spatial change characteristics of the NDVI in the Jialing River Basin from 2000 to 2020. PLS-SEMs were constructed to clarify the driving processes of different latent and observable variables on the NDVI in more detail through indirect and direct paths, and to distinguish the impacts of surface, human activities, and climate factors on different levels of the NDVI. The findings of this study can provide scientific guidance for the protection and restoration of the ecological environment in the Jialing River Basin and other similar areas. This, in turn, facilitates the implementation of sustainable development practices and construction of ecological civilizations. In addition, the study introduces new ideas and methods that will enrich research in related disciplines. It enhances our understanding of the driving factors behind changes in vegetation cover and serves as a valuable reference for future studies.

2. Study Area and Methods

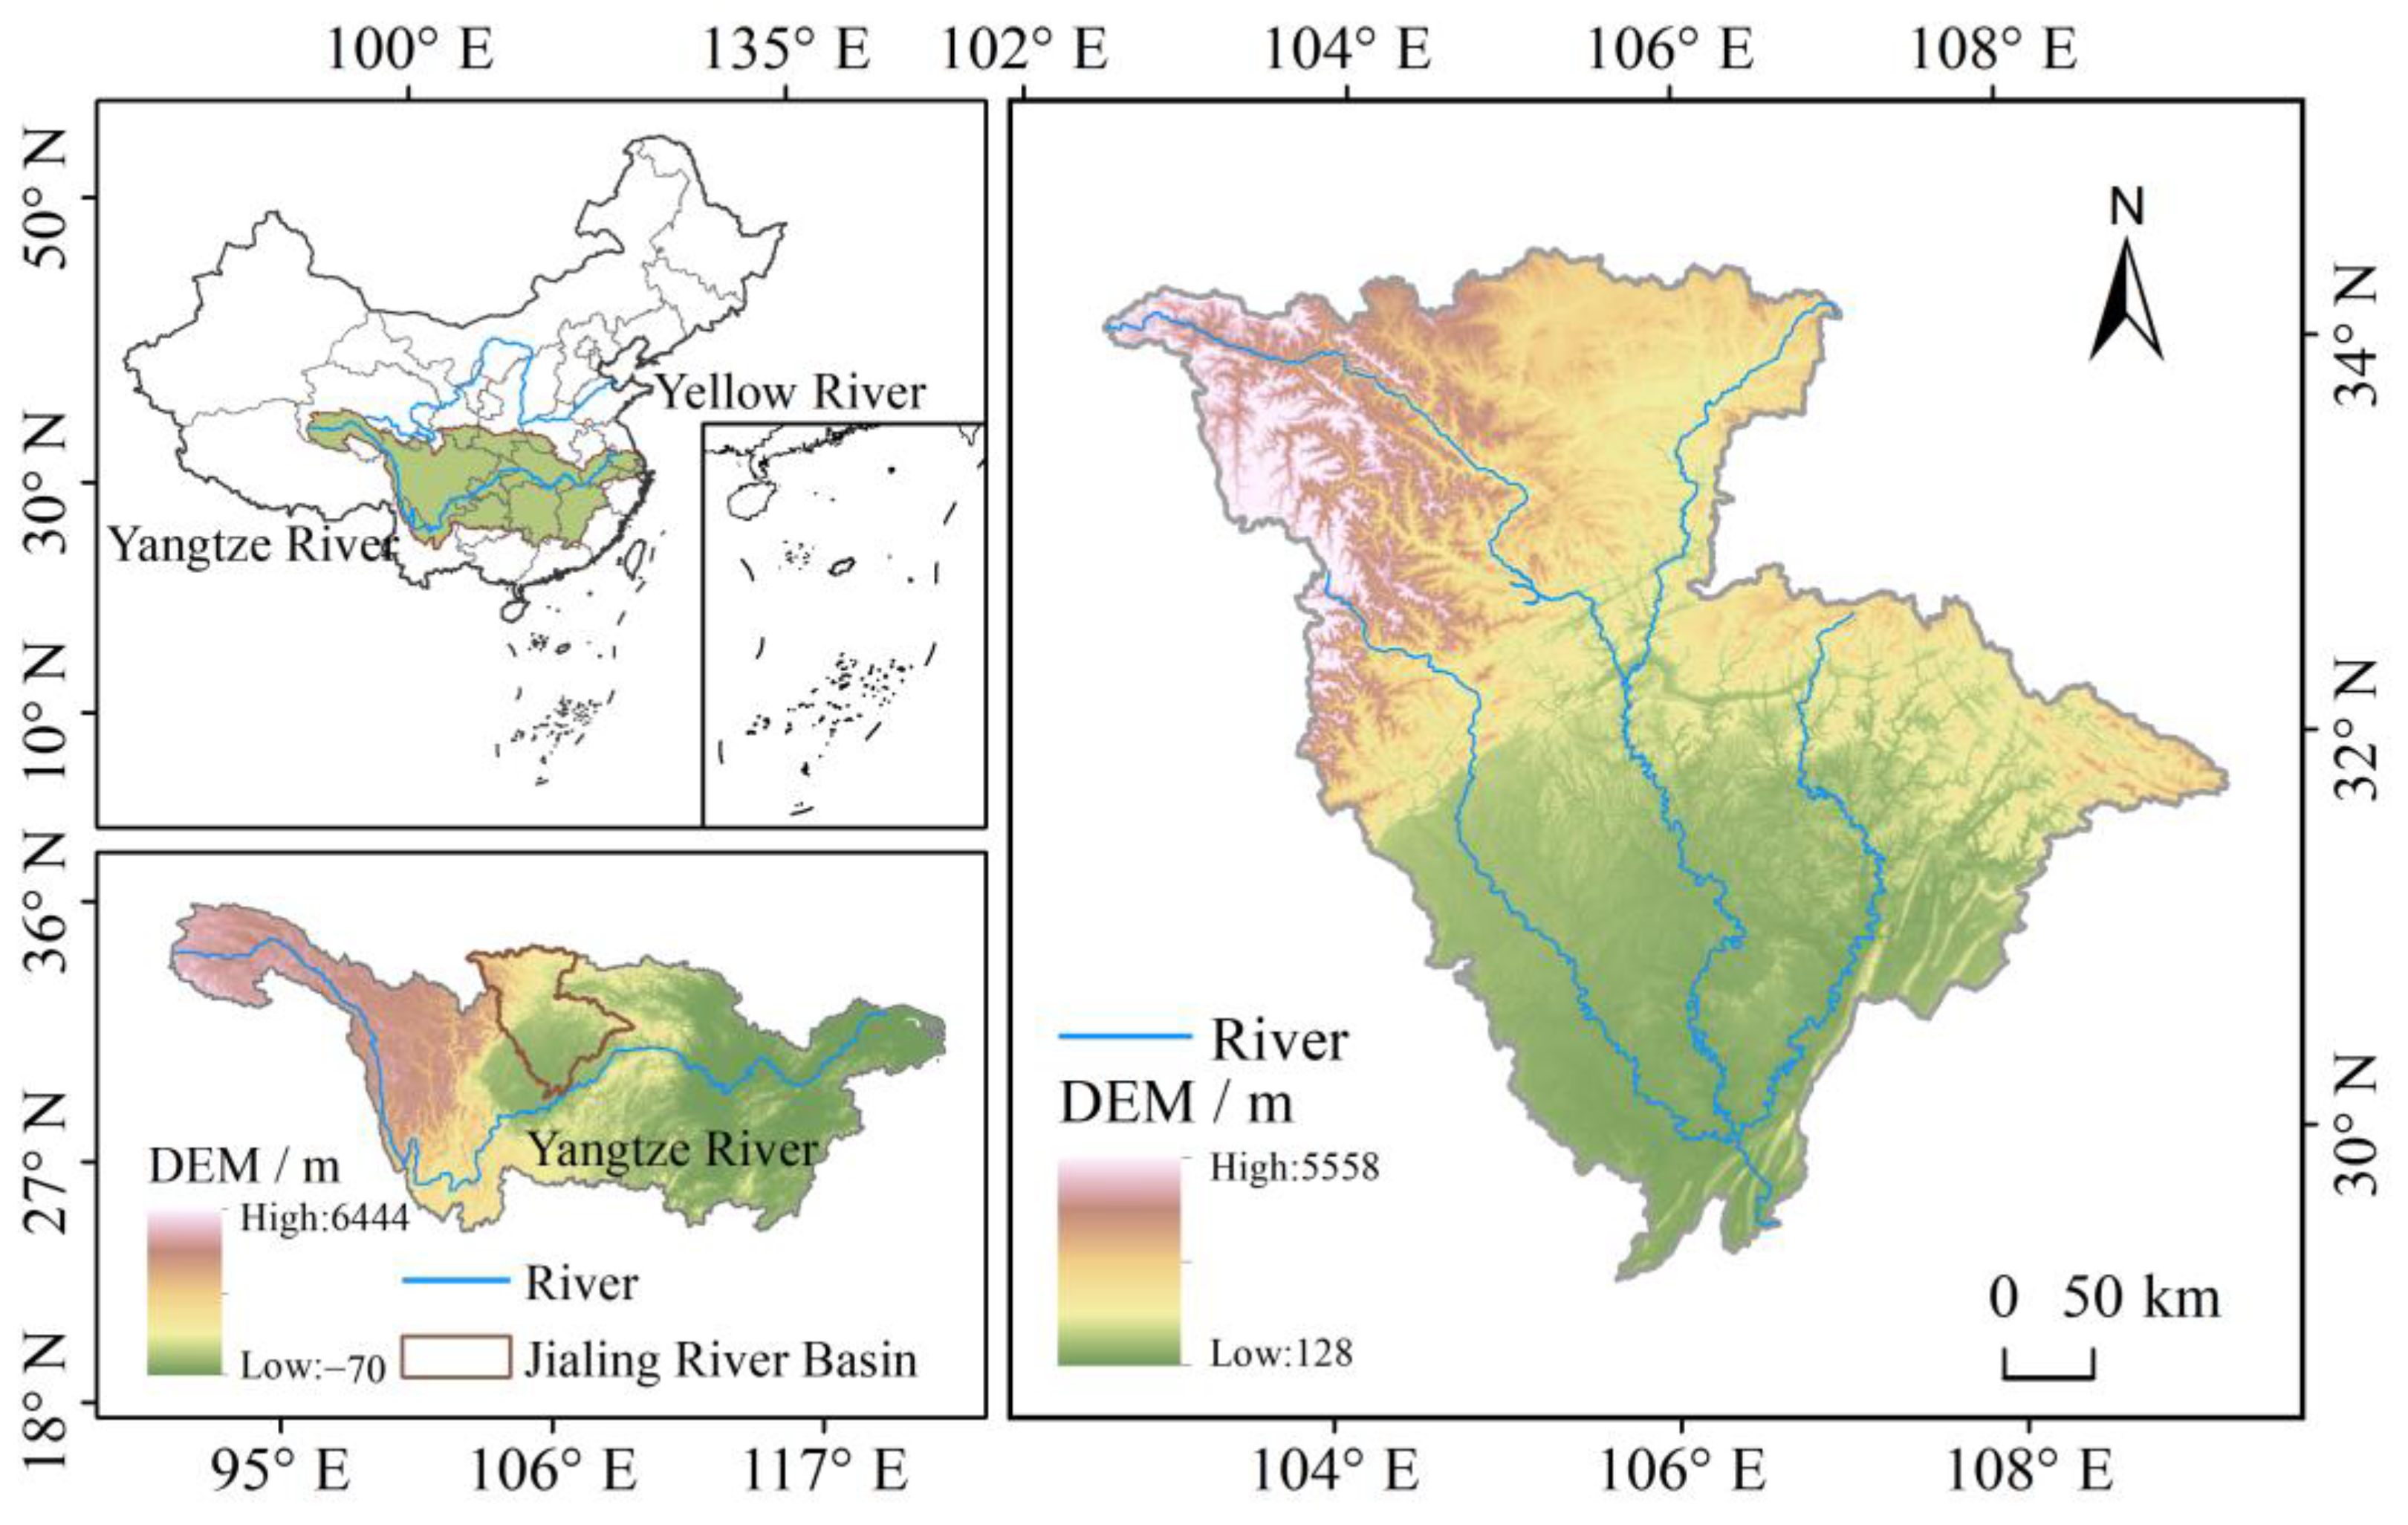
2.1. Overview of the Study Area

The location of the Jialing River Basin is shown in Figure 1. It is located in the central and western regions of China, spanning Shaanxi, Sichuan, Gansu, and Chongqing. Its geographical location is 102°35′36″~109°01′08″ E and 29°17′30″~34°28′11″ N. The Jialing River originates from Daiwang Mountain, Fengxian County, north of the Qinling Mountains, Shaanxi Province. The tributary has the largest drainage area in the Yangtze River system. It flows into the main stream of the Yangtze River at the wharf in Chongqing, with a total length of approximately 1120 km. The overall water system is fan shaped [32]. Its main tributaries are the Fujiang River and Qujiang River, with a total drainage area of 161,900 km2. It has complex geological, geomorphic, and climatic conditions. Due to the loose soil quality in the upstream loess area, the purple red shale in the middle and downstream is prone to weathering, resulting in severe soil erosion. The southern part is Sichuan Basin, one of the four Great Basins in China. The basin bottom is low, and the northern part is the western section of the Qinling Mountains. The mountains are all above 1500 m above sea level. The terrain is steep and there are many canyons. The study area is far from the sea and located at a low latitude, with a subtropical monsoon climate [33]. The annual rainfall distribution is uneven, with more rainfall in summer and autumn and less rainfall in winter and spring. The annual average temperature is approximately 10 °C, and the annual evaporation is 800~900 mm [34].

2.2. Data Source and Processing

This study selected surface, climate, and human activity factors to analyze the driving forces of vegetation changes in the Jialing River Basin [35,36,37]. The NDVI data from 2000 to 2020 were obtained from the spatial distribution dataset of the annual vegetation index (NDVI) in China (https://www.resdc.cn/ (accessed on 20 March 2022)), with a resolution of 1 km. Surface factors: 90 m DEM data were derived from 90 m DEM data (SRTM 90 m), 1 km grid data were obtained by sampling, and slope and aspect data were obtained by ArcGIS. The soil and geomorphic data were derived from the spatial distribution data of soil types and China’s geomorphic types, with a resolution of 1 km. Climatic factors: annual precipitation monthly temperature data were all obtained from China’s meteorological background dataset, with a resolution of 1 km. Using ArcGIS software, the same grid temperature data were processed by taking the average, maximum, and minimum values to obtain the annual average, maximum, and minimum temperatures, respectively. The data of the above influencing factors were obtained from the Resource and Environmental Science Data Center of the Chinese Academy of Sciences (https://www.resdc.cn/ (accessed on 20 March 2022)). Human activity factors: gross domestic product, land use type, and nighttime lighting data were obtained from the GDP spatial distribution kilometer grid dataset, land use status remote sensing monitoring data, and annual dataset of nighttime lighting in China, respectively, and all had a resolution of 1 km. The data of the above influencing factors were all obtained from the Resource and Environmental Science Data Center of the Chinese Academy of Sciences (https://www.resdc.cn/ (accessed on 29 March 2022)). The population density data were obtained from the world grid population (GPW) v4 dataset (https://www.worldpop.org/ (accessed on 23 April 2022)). All data were unified in the coordinate system using ArcGIS software, mask extraction was carried out according to the shp file of Jialing River Basin, and the data were resampled to 1 km.

2.3. Research Method

2.3.1. Trend Analysis

The Sen slope estimation and M–K test were combined to explore the NDVI change trend at the pixel scale [38]. Sen slope estimation is a robust, nonparametric, estimation trend calculation method that is applicable to long time series data. The formula is as follows:
θ s l o p e = n i = 1 n i x i i = 1 n i i = 1 n x i n i = 1 n i 2 i = 1 n x i 2
where θ s l o p e is the slope of the NDVI change; if   θ s l o p e > 0, the NDVI value of the Jialing River Basin shows an increasing trend, and vice versa.
The M–K test is a nonparametric trend test method. Normal distribution does not have to obeyed for the test object and the test is not susceptible to the influence of outliers and missing values. It is applicable for use in testing long time series [39]. The formula is as follows:
Z s = S / V a r S                                             S > 0 0                                                                                     S = 0 S + 1 / V a r S                         S < 0
where V a r S = n n 1 2 n + 5 18 ; S = i n 1 j = i + 1 n s g n x i x j ; and s g n θ = 1   , θ > 0 0   , θ = 0 1 , θ < 0 . Z s is the test statistic and s g n is the sign function. At the confidence interval of 0.05, it passes the significance test with confidence levels of 99% ( Z s 2.58 ) and 95% ( Z s 1.96 ). Through grid superposition analysis of the NDVI change results and the M–K test results in the Jialing River Basin, the change type was divided into six levels, as shown in Table 1.

2.3.2. Barycentric Model

The “center of gravity” refers to the balance point where the sum of all grid moments in the study area is zero, and its spatial position change can directly reflect NDVI change trend and track [40]. The formulas are as follows:
x ¯ = i = 1 n z i x i i = 1 n z i
y ¯ = i = 1 n z i y i i = 1 n z i
where the coordinates of the i th grid in the layer are x i , y i , z i is the attribute value of the i th plane grid, and the spatial mean value composed of n planar spatial grid cells is x i ¯ , y i ¯ .

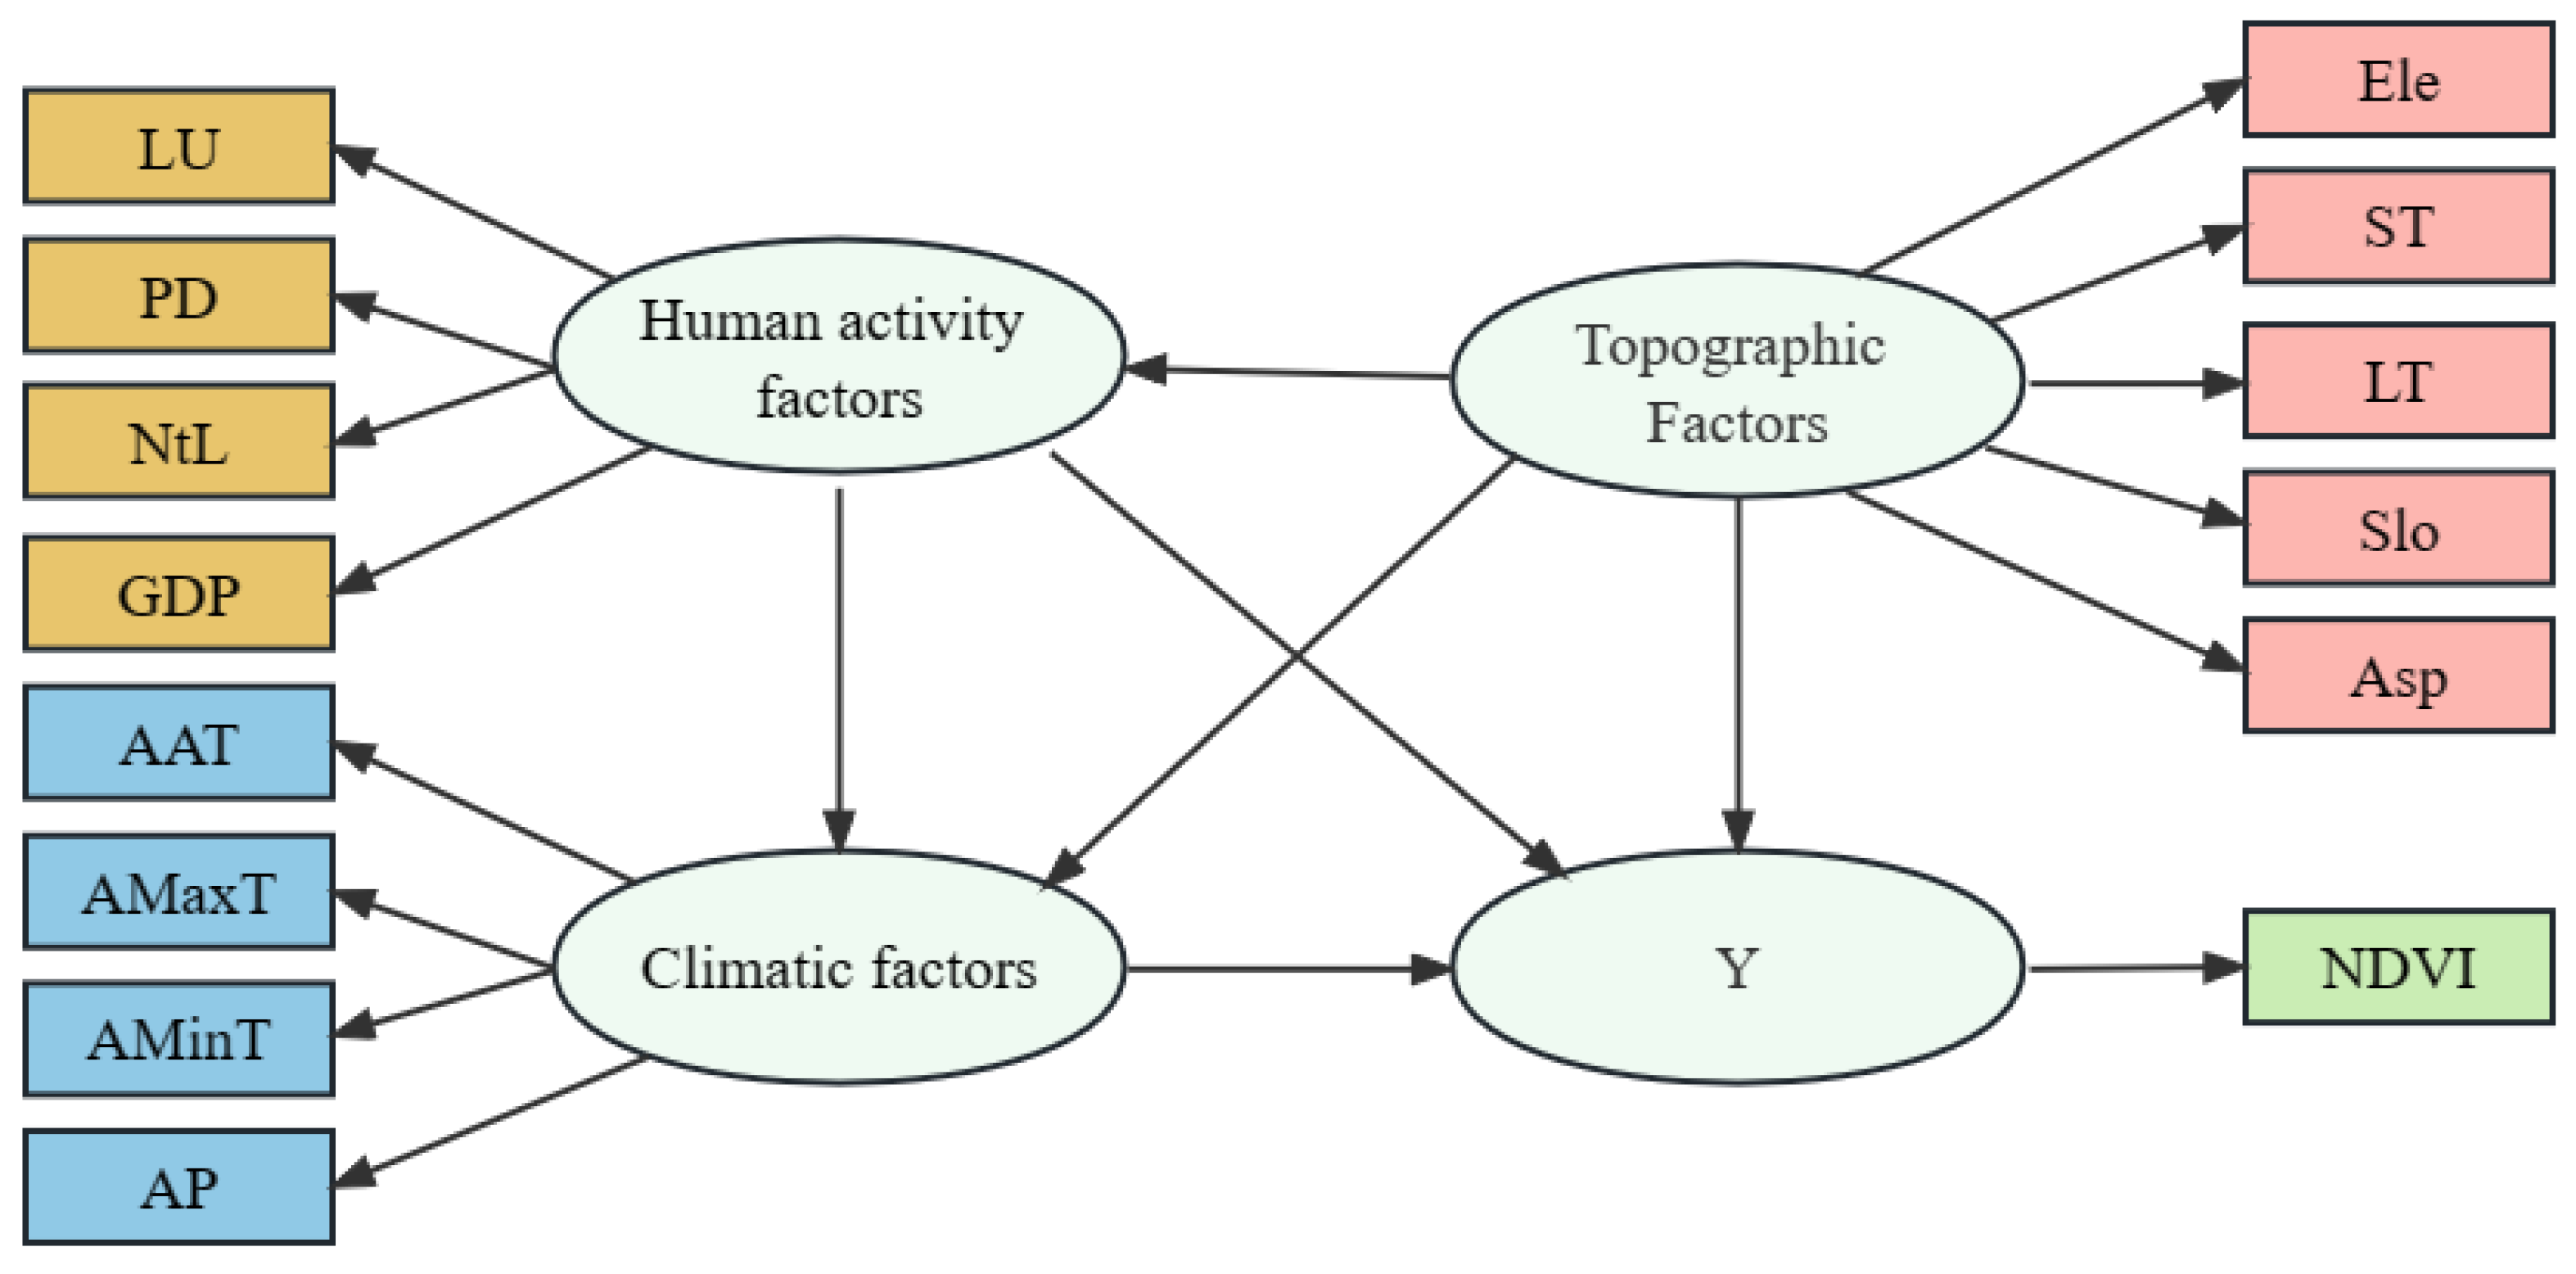
2.3.3. PLS-SEM for NDVI Changes

PLS-SEM is a method for exploring and testing system relationship hypotheses [41]. It has many advantages in causal analysis. First, it quantitatively identifies direct and indirect causal effects. Indirect effects refer to the interaction between potential variables through other potential variables. For example, terrain factors can indirectly affect NDVI changes by influencing human activities. Second, PLS-SEM can measure the driving relationships between observable variables and potential variables that cannot be quantitatively observed. Potential variables are typically represented by multiple observable variables. For example, climate factors cannot be directly observed but can be represented by temperature and rainfall, thus being defined as potential variables.
In the conceptual model, terrain, human activities, and climate factors are potential variables that cannot be directly observed. As shown in Figure 2, elevation (Ele), soil type (ST), landform type (LT), slope (Slo), and aspect (Asp) were the observable variables reflecting topographic factors. Average annual temperature (AAT), annual maximum temperature (AMaxT), annual minimum temperature (AMinT), and annual precipitation (AP) were the observational variables that reflected climate factors. Land use (LU), population density (PD), nighttime lighting (NtL), and gross domestic product (GDP) were used as the observational variables to characterize changes in human activity factors.
Based on the NDVI values in 2000, 2010, and 2020 and the corresponding human ac-tivities and surface and climate factors, 10,000 random points were created in ArcGIS eve-ry year to capture the data of each layer. After removing the outliers, 9890, 9903, and 9895 valid sample data were obtained, respectively. The Johnson transform method was carried out on the valid data to meet the normal hypothesis requirement, and three PLS-SEMs were established to study the changes in the driving effects of various factors on the NDVI. The SRMR (standardized root mean square residual) values were 0.076, 0.078, and 0.077, respectively, and all were less than 0.08. The ULS (squared Euclidean distance) values were 0.606, 0.631, and 0.793, respectively, and all were less than 0.95. The geometric distances were 0.911, 0.845, and 0.687, respectively, all of which were less than 0.95. These results showed that PLS-SEM is effective and can be used to analyze the impacts of human activities and surface and climate factors on the NDVI. These three latent and observable variables had significant impacts on vegetation change.
To carry out further research, with low (NDVI ≥ 0.2), medium (0.6 > NDVI ≥ 0.4), and high (NDVI ≥ 0.6) vegetation indexes as latent and observable variables, based on the data including the 2000, 2010, and 2020 NDVI values and corresponding human activities, surface, and climate factors, 10,000 random points were created in ArcGIS every year. After removing outliers, the Johnson transform method was performed on the effective data to establish six PLS-SEMs. The numbers of valid samples and model fitting results are shown in Table 2, and all models were valid.

3. Results

3.1. Spatiotemporal Variation Characteristics of the NDVI in the Jialing River Basin

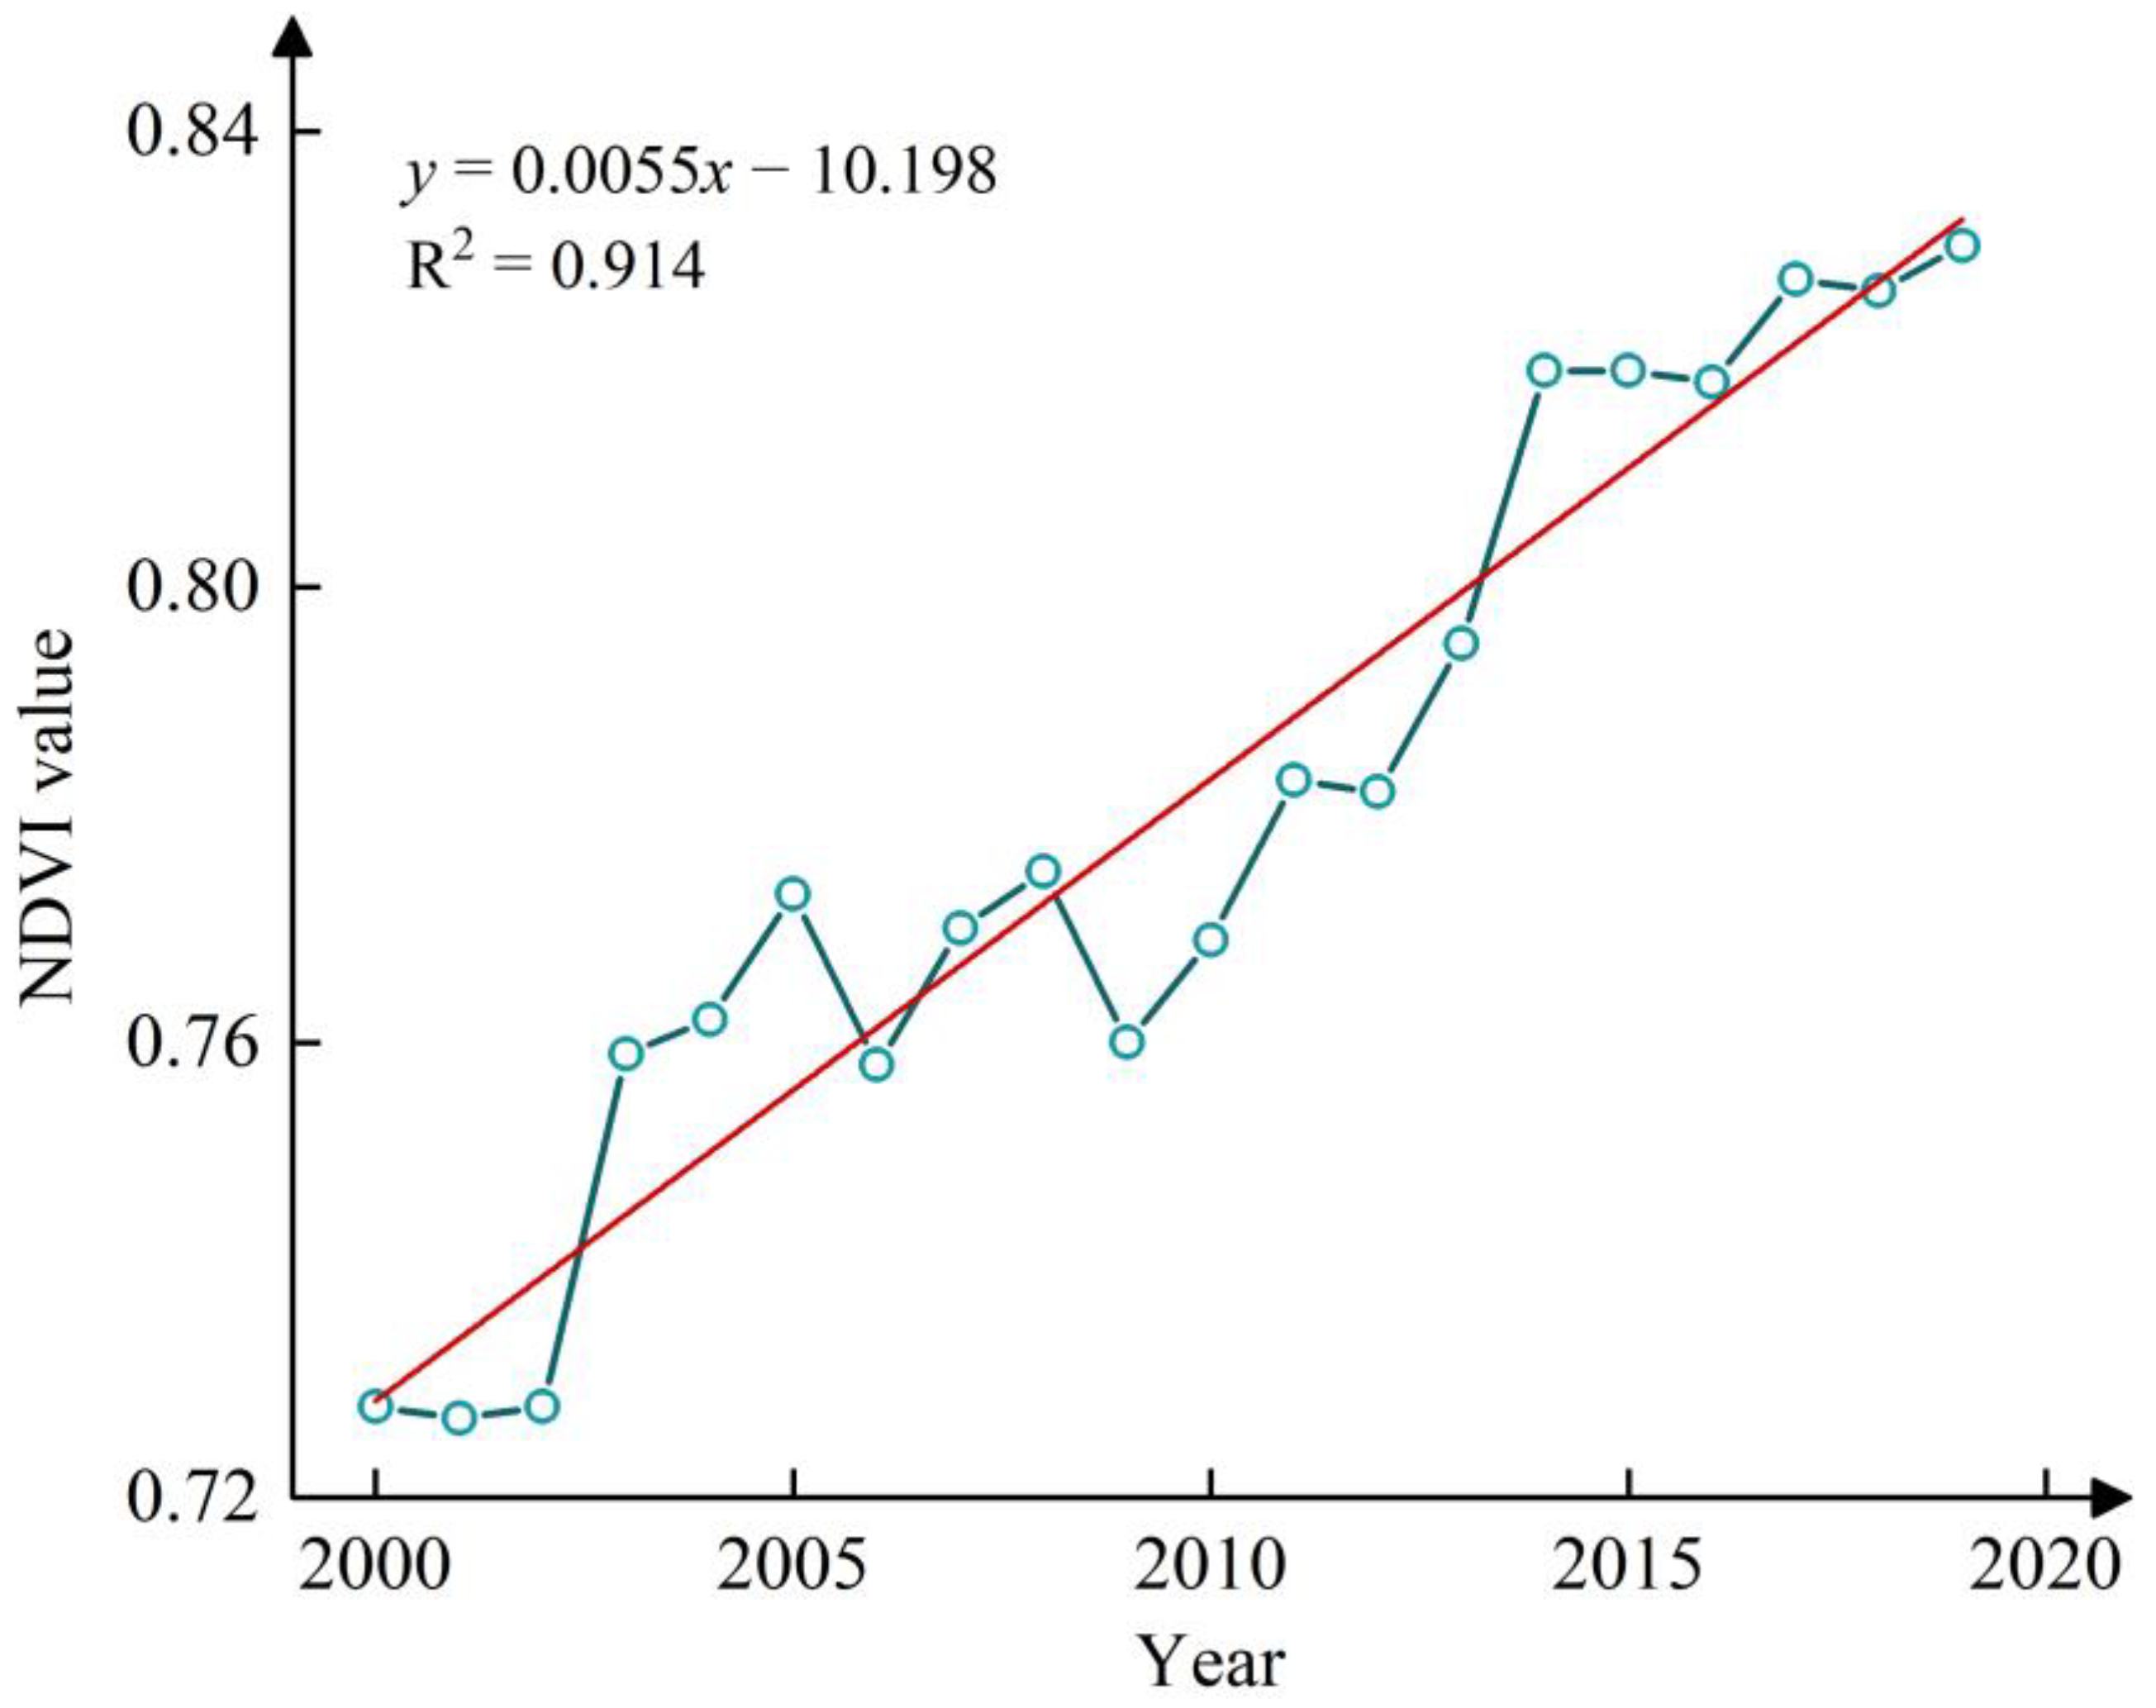
3.1.1. Temporal Variation Trend of the NDVI at Different Scales

As shown in Figure 3, during the period from 2000 to 2020, the annual average NDVI values showed a fluctuating upwards trend overall. During the period from 2000 to 2020, the annual average NDVI values showed a fluctuating upwards trend overall. From 2000 to 2002, the annual average NDVI values showed a relatively small change, with a range of plus or minus 0.001. From 2003 to 2005, the annual average NDVI values showed a significant upwards trend, with an increase rate of 0.007/a. The NDVI values reached a low point in 2006, a decrease of 0.015 compared to 2005. The main reason was that the Sichuan and Chongqing regions experienced a severe 100-year drought in the summer of 2006, the precipitation decreased, and the total amount of water resources was insufficient, resulting in insufficient soil water content and inactive vegetation growth after evaporation and infiltration of surface water on the ground. The NDVI value in the growing season of that year was significantly low [42,43]. From 2007 to 2008, the vegetation condition gradually recovered, and the annual average NDVI values showed an upwards trend. Starting in 2006, the growth rate was 0.009/a. In 2009, the Jialing River Basin was affected by continuous low rainfall during the flood season, and the inflow of water from the main stream and tributaries of the Jialing River Basin was significantly lower than that in previous years, resulting in a reduction in the NDVI value in the growth season of that year [44,45]. From 2010 to 2020, there was a fluctuating upwards trend, with an increase rate of 0.005/a. In 2020, the annual average NDVI values reached a peak at 0.829.
According to the M–K test results (0.05 confidence level), the significance of the NDVI change was divided into 5 levels. The change trend in Figure 4 shows that the NDVI in the Jialing River Basin improved overall from 2000 to 2020. The area with a very significant increase accounted for 74.08% of the total basin area. The area with an insignificant increase was the second largest, accounting for 9.26%. The area with a significant increase accounted for 6.73%. The total area with a degradation trend accounted for 5.92% of the Jialing River Basin area, far less than the land area with an increasing trend.

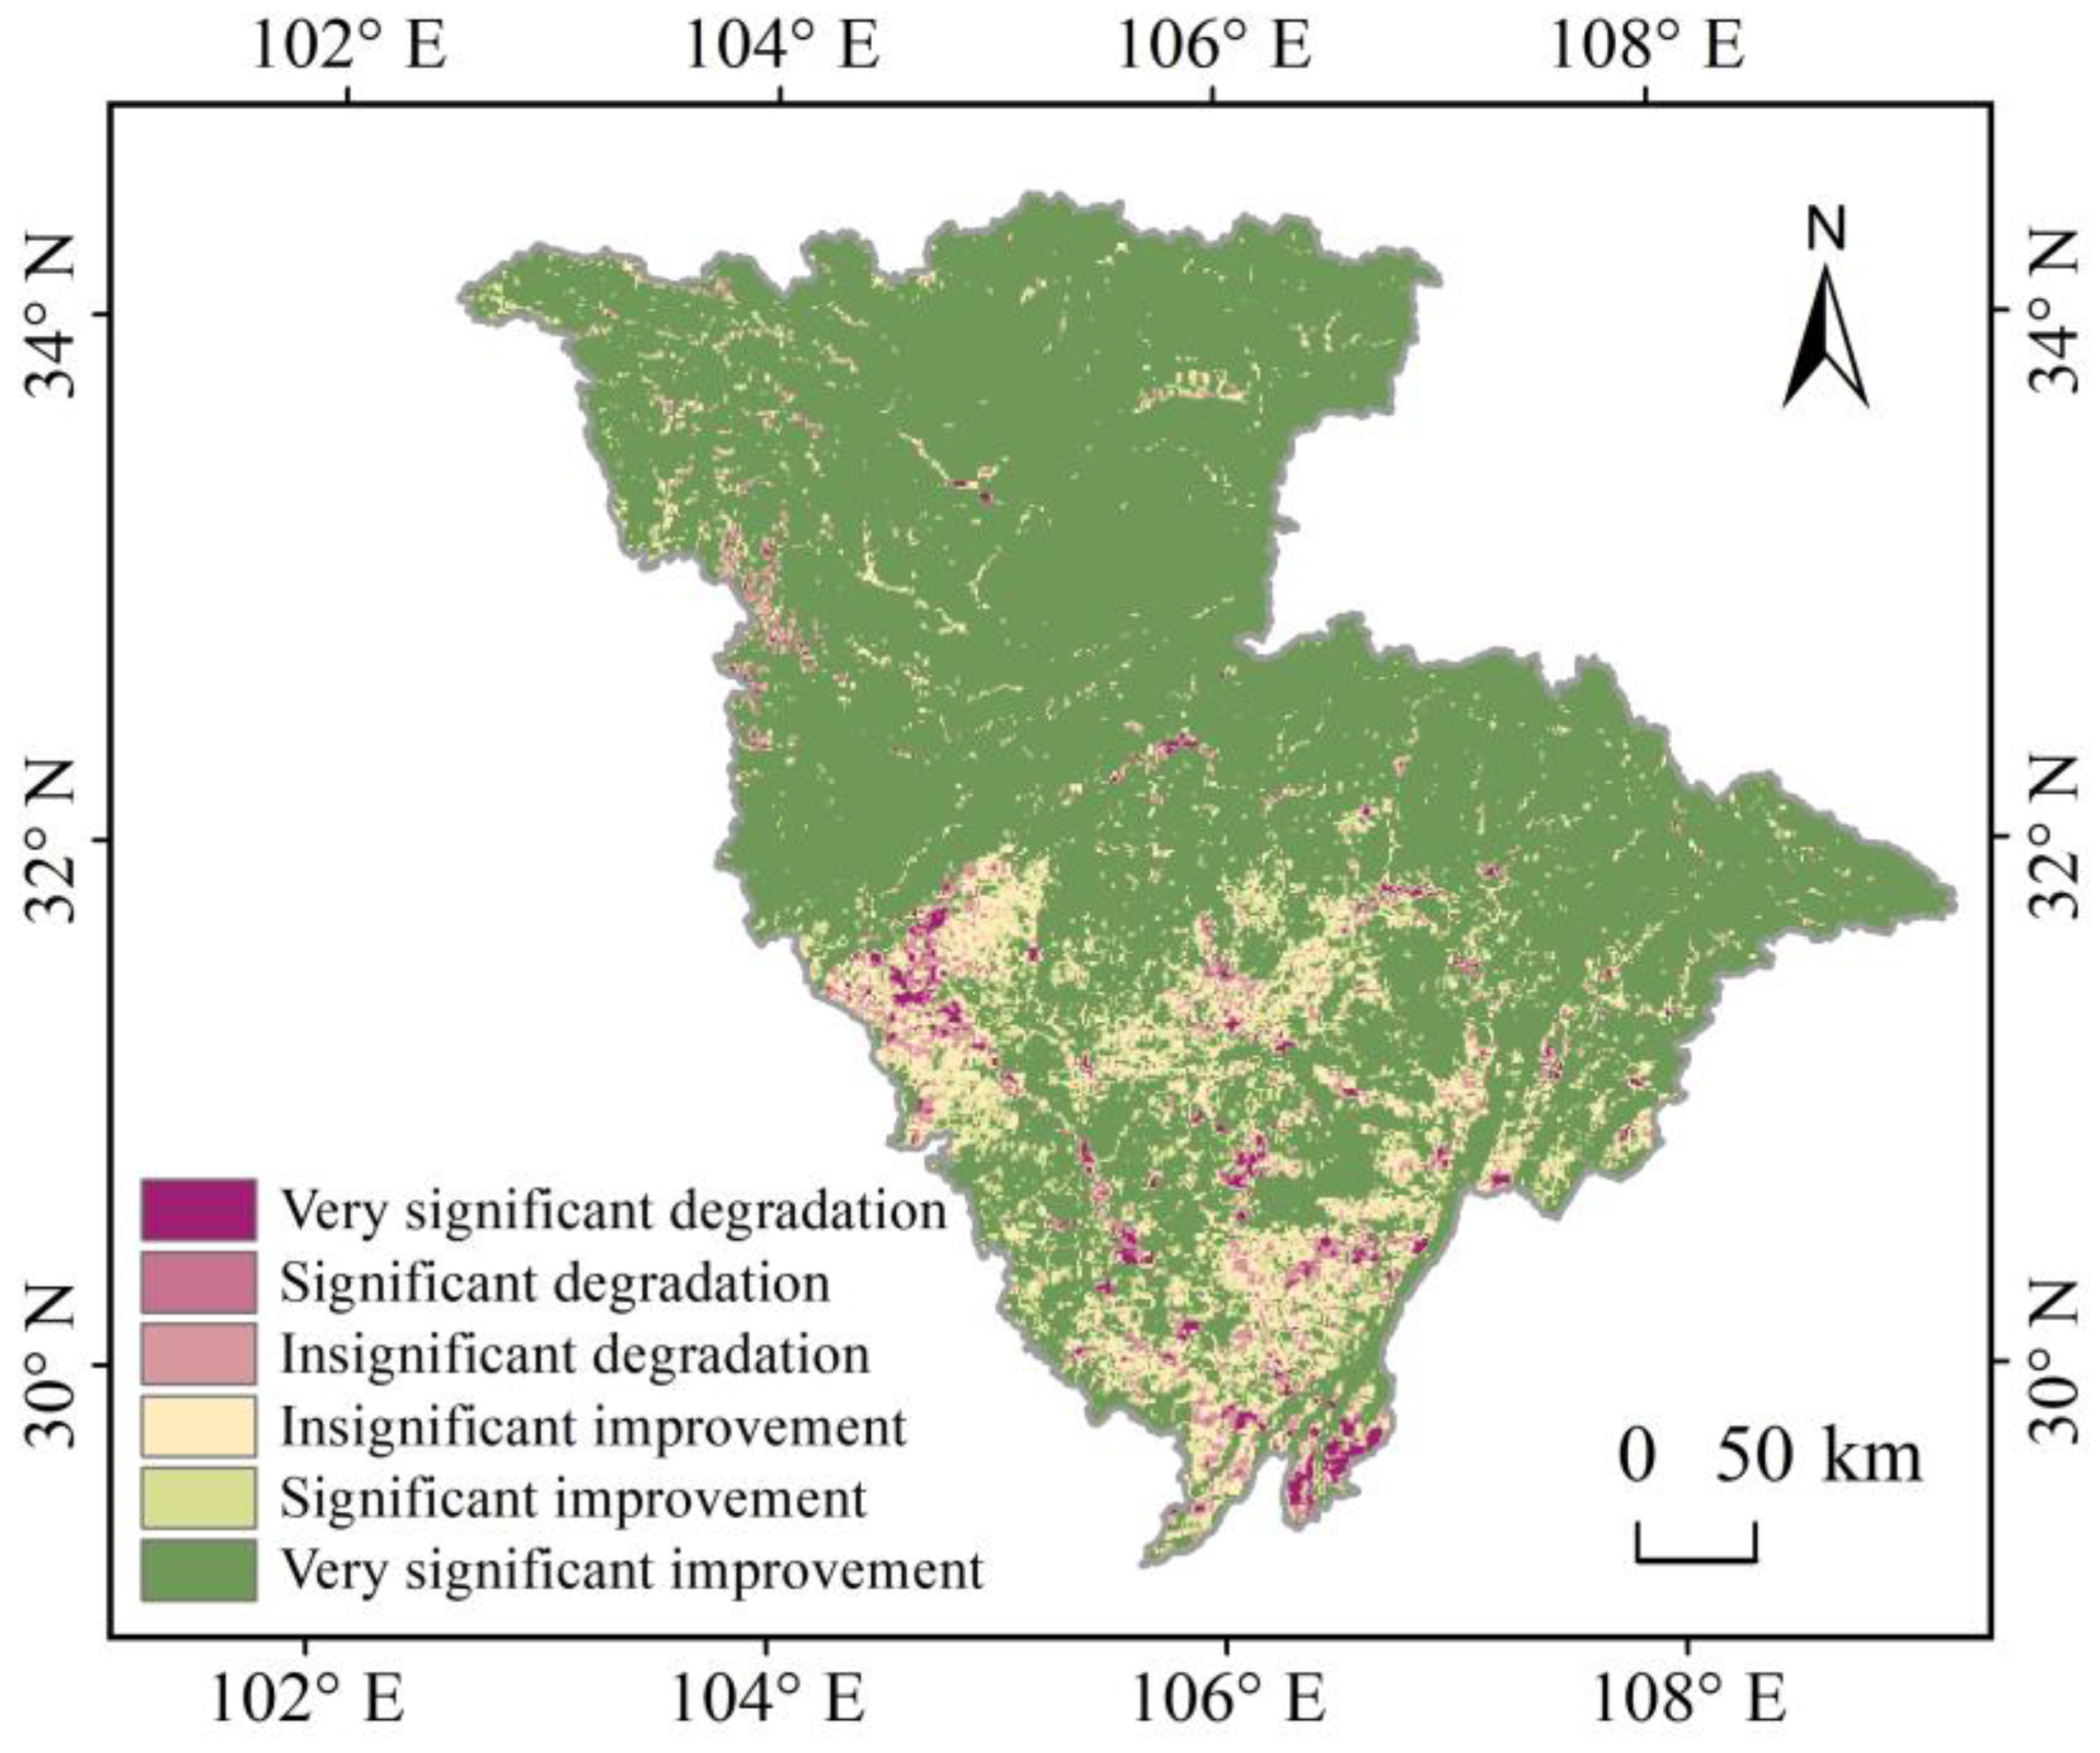
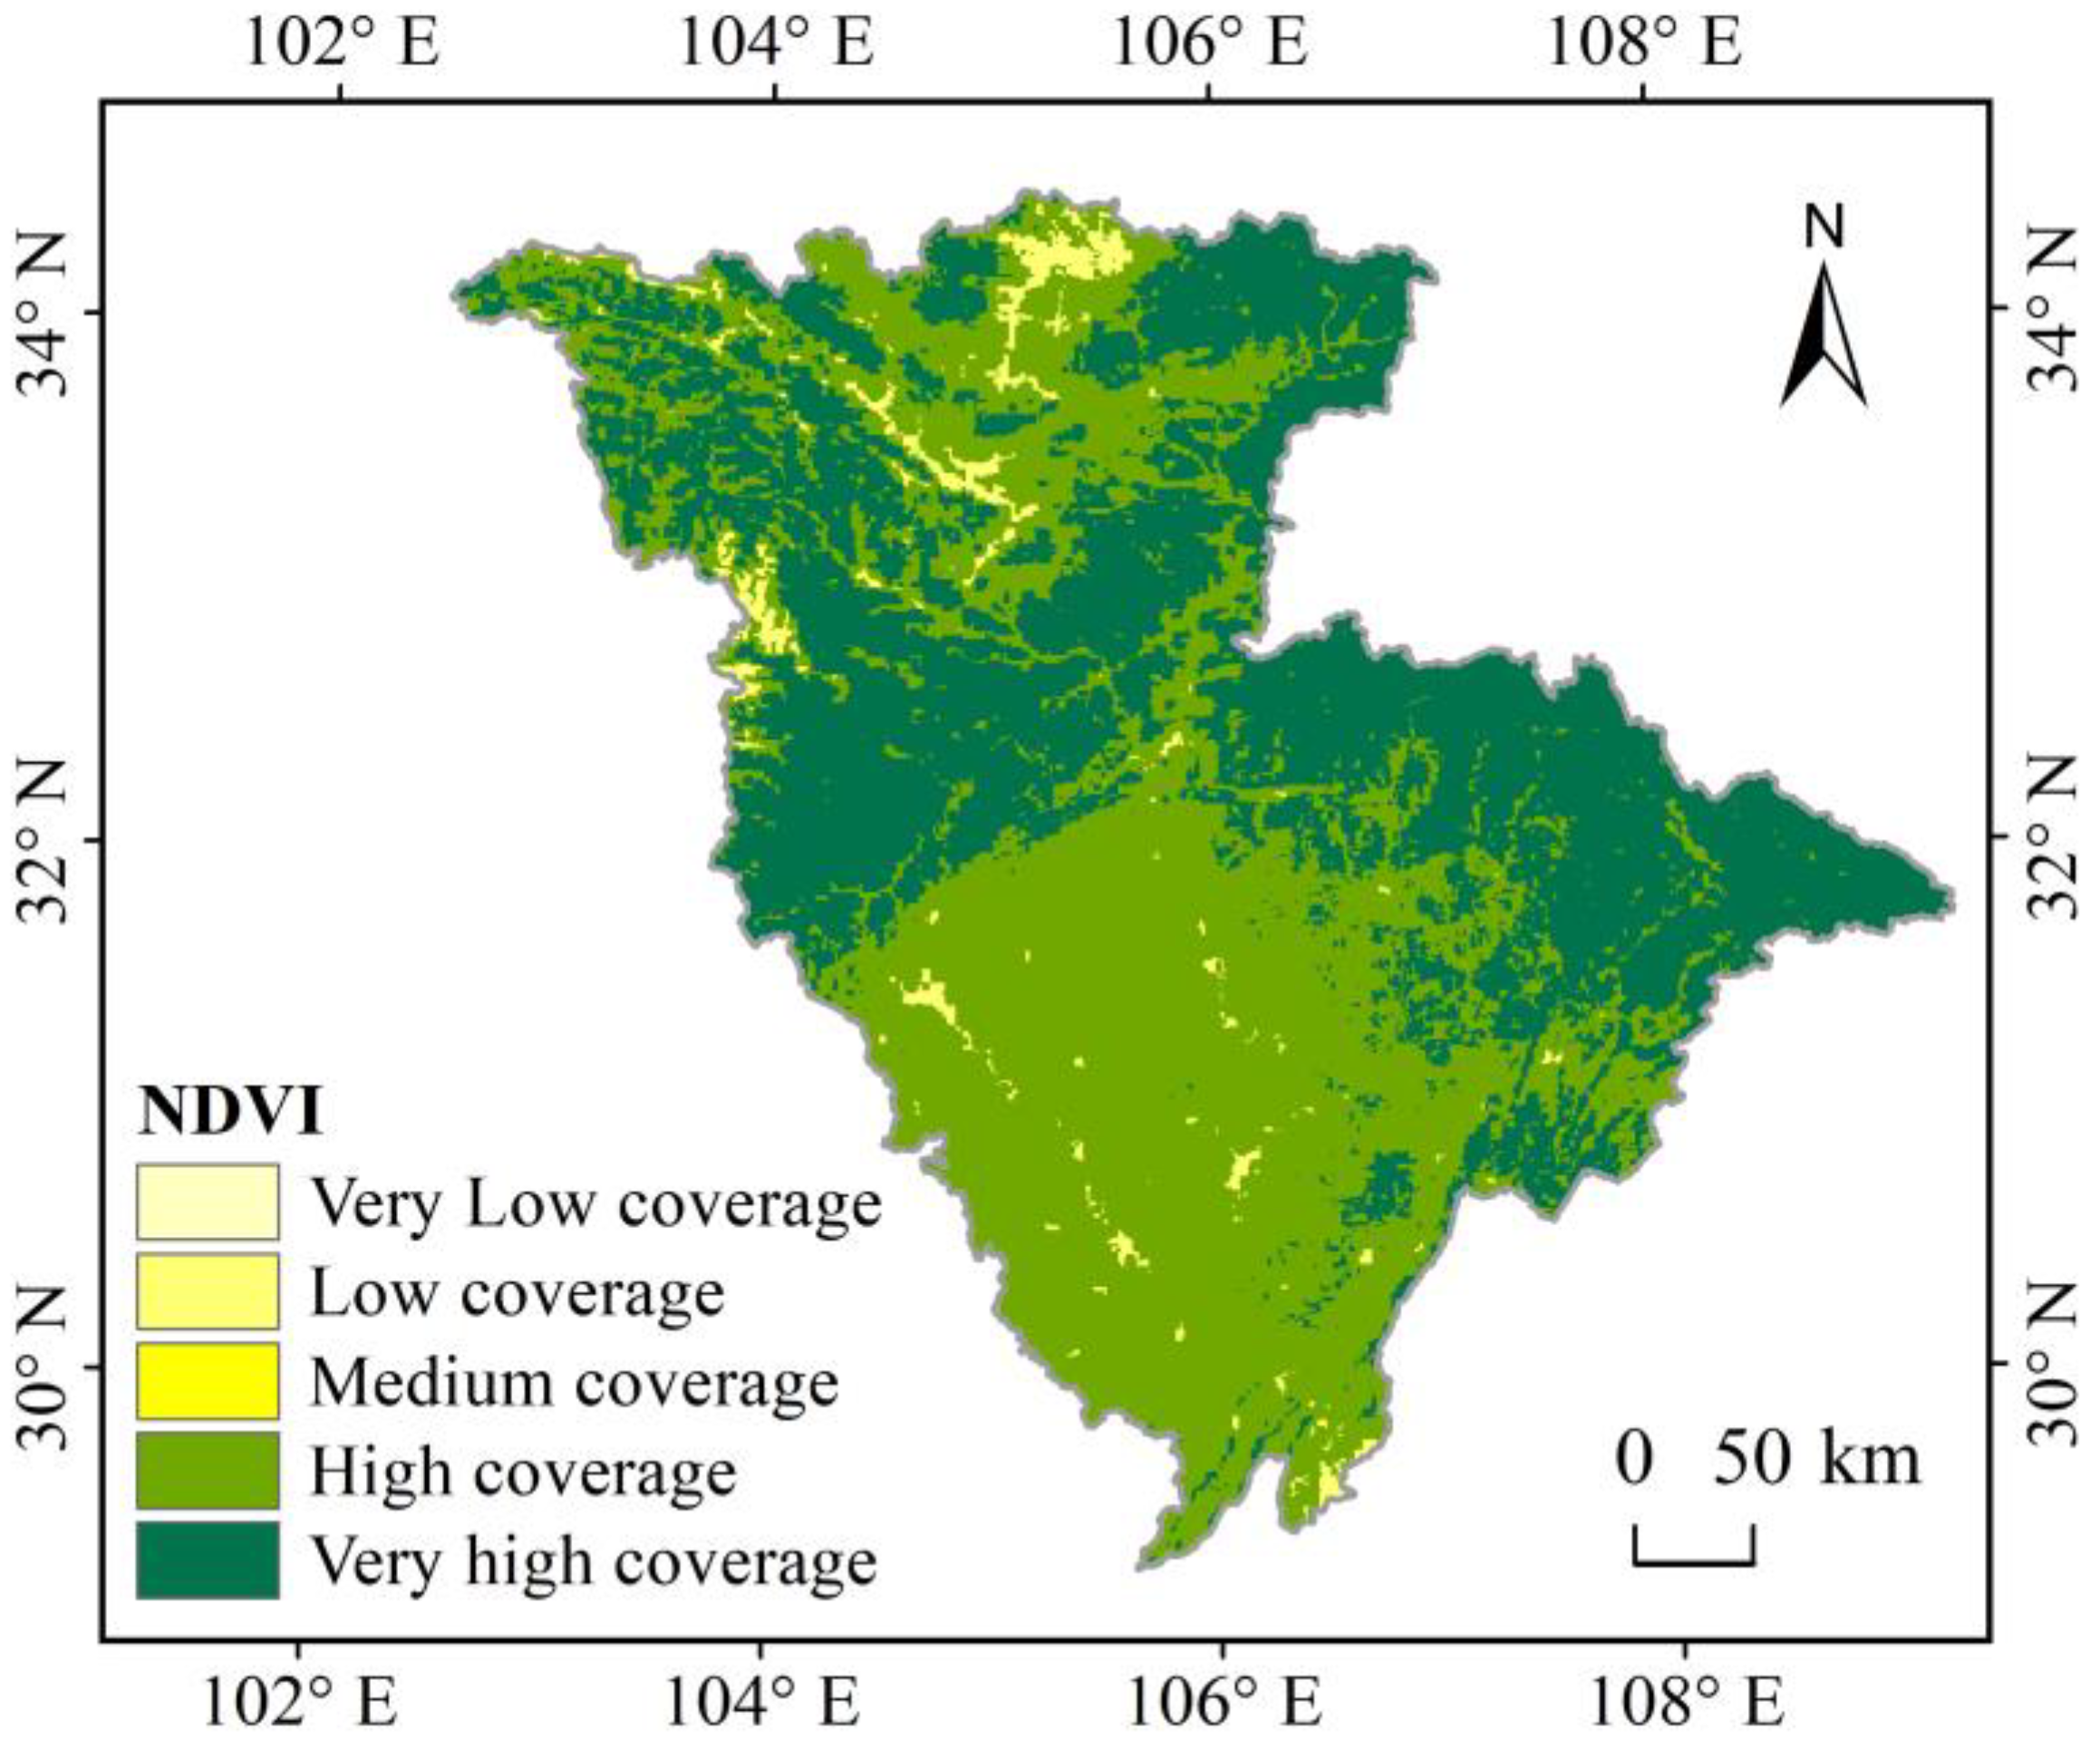
3.1.2. The Spatial Characteristics of Annual Average NDVI

Based on the vegetation data from 2000 to 2020, combined with the actual situation of the Jialing River Basin and the previous classification standards, the vegetation coverage was divided into five categories by the mean NDVI value at equal intervals: extremely low coverage (0–20%), low coverage (20–40%), medium coverage (40–60%), high coverage (60–80%), and extremely high coverage (80–100%). As shown in Figure 5 and Figure 6, 45.45% of the Jialing River Basin was classified as a very high vegetation coverage area, most of which was located in the northwest and east of the basin, including the Sichuan Basin, southern Shaanxi, and Wushan region. The high vegetation coverage area accounted for 51.87%, making it the main vegetation coverage type, and most sites were located in the south of the basin and distributed in a continuous strip. The medium vegetation coverage area accounted for 2.53%, and it was concentrated in the north of the basin and distributed in a relatively scattered and continuous strip. The areas of low and very low vegetation coverage accounted for only 0.15%, and these areas were scattered in the northern part of the basin, mostly including urban construction land and unused land.

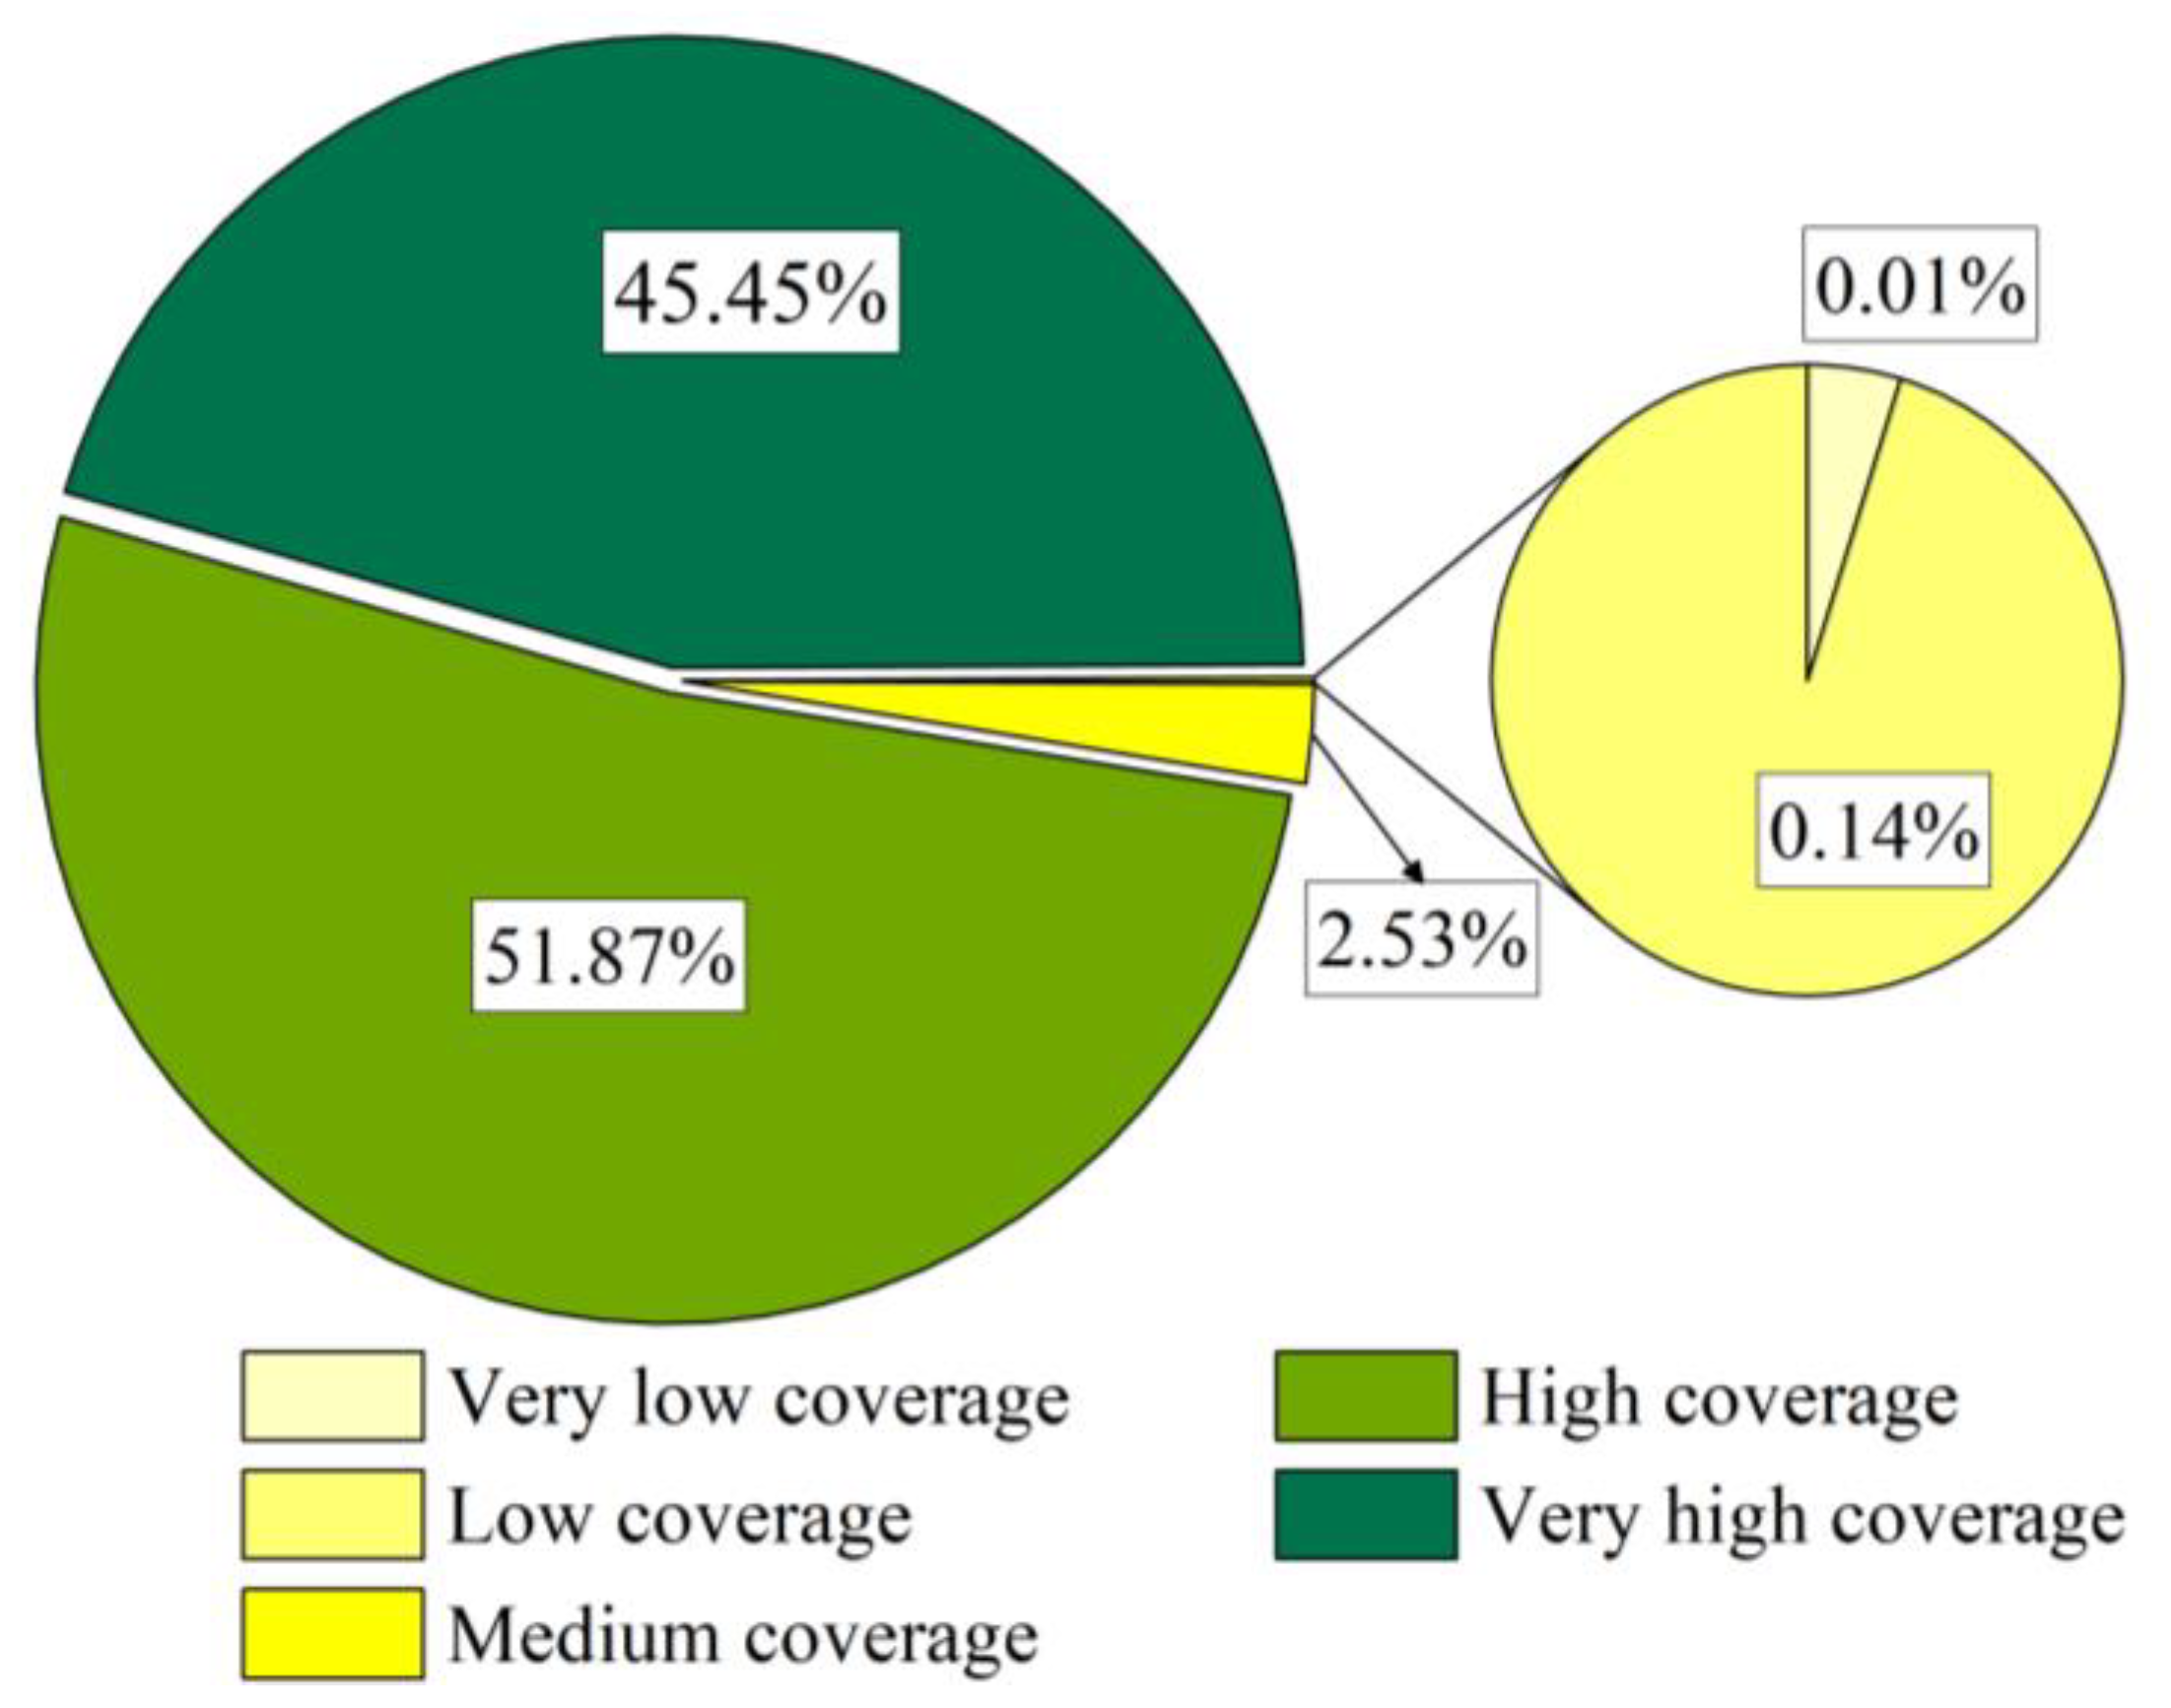
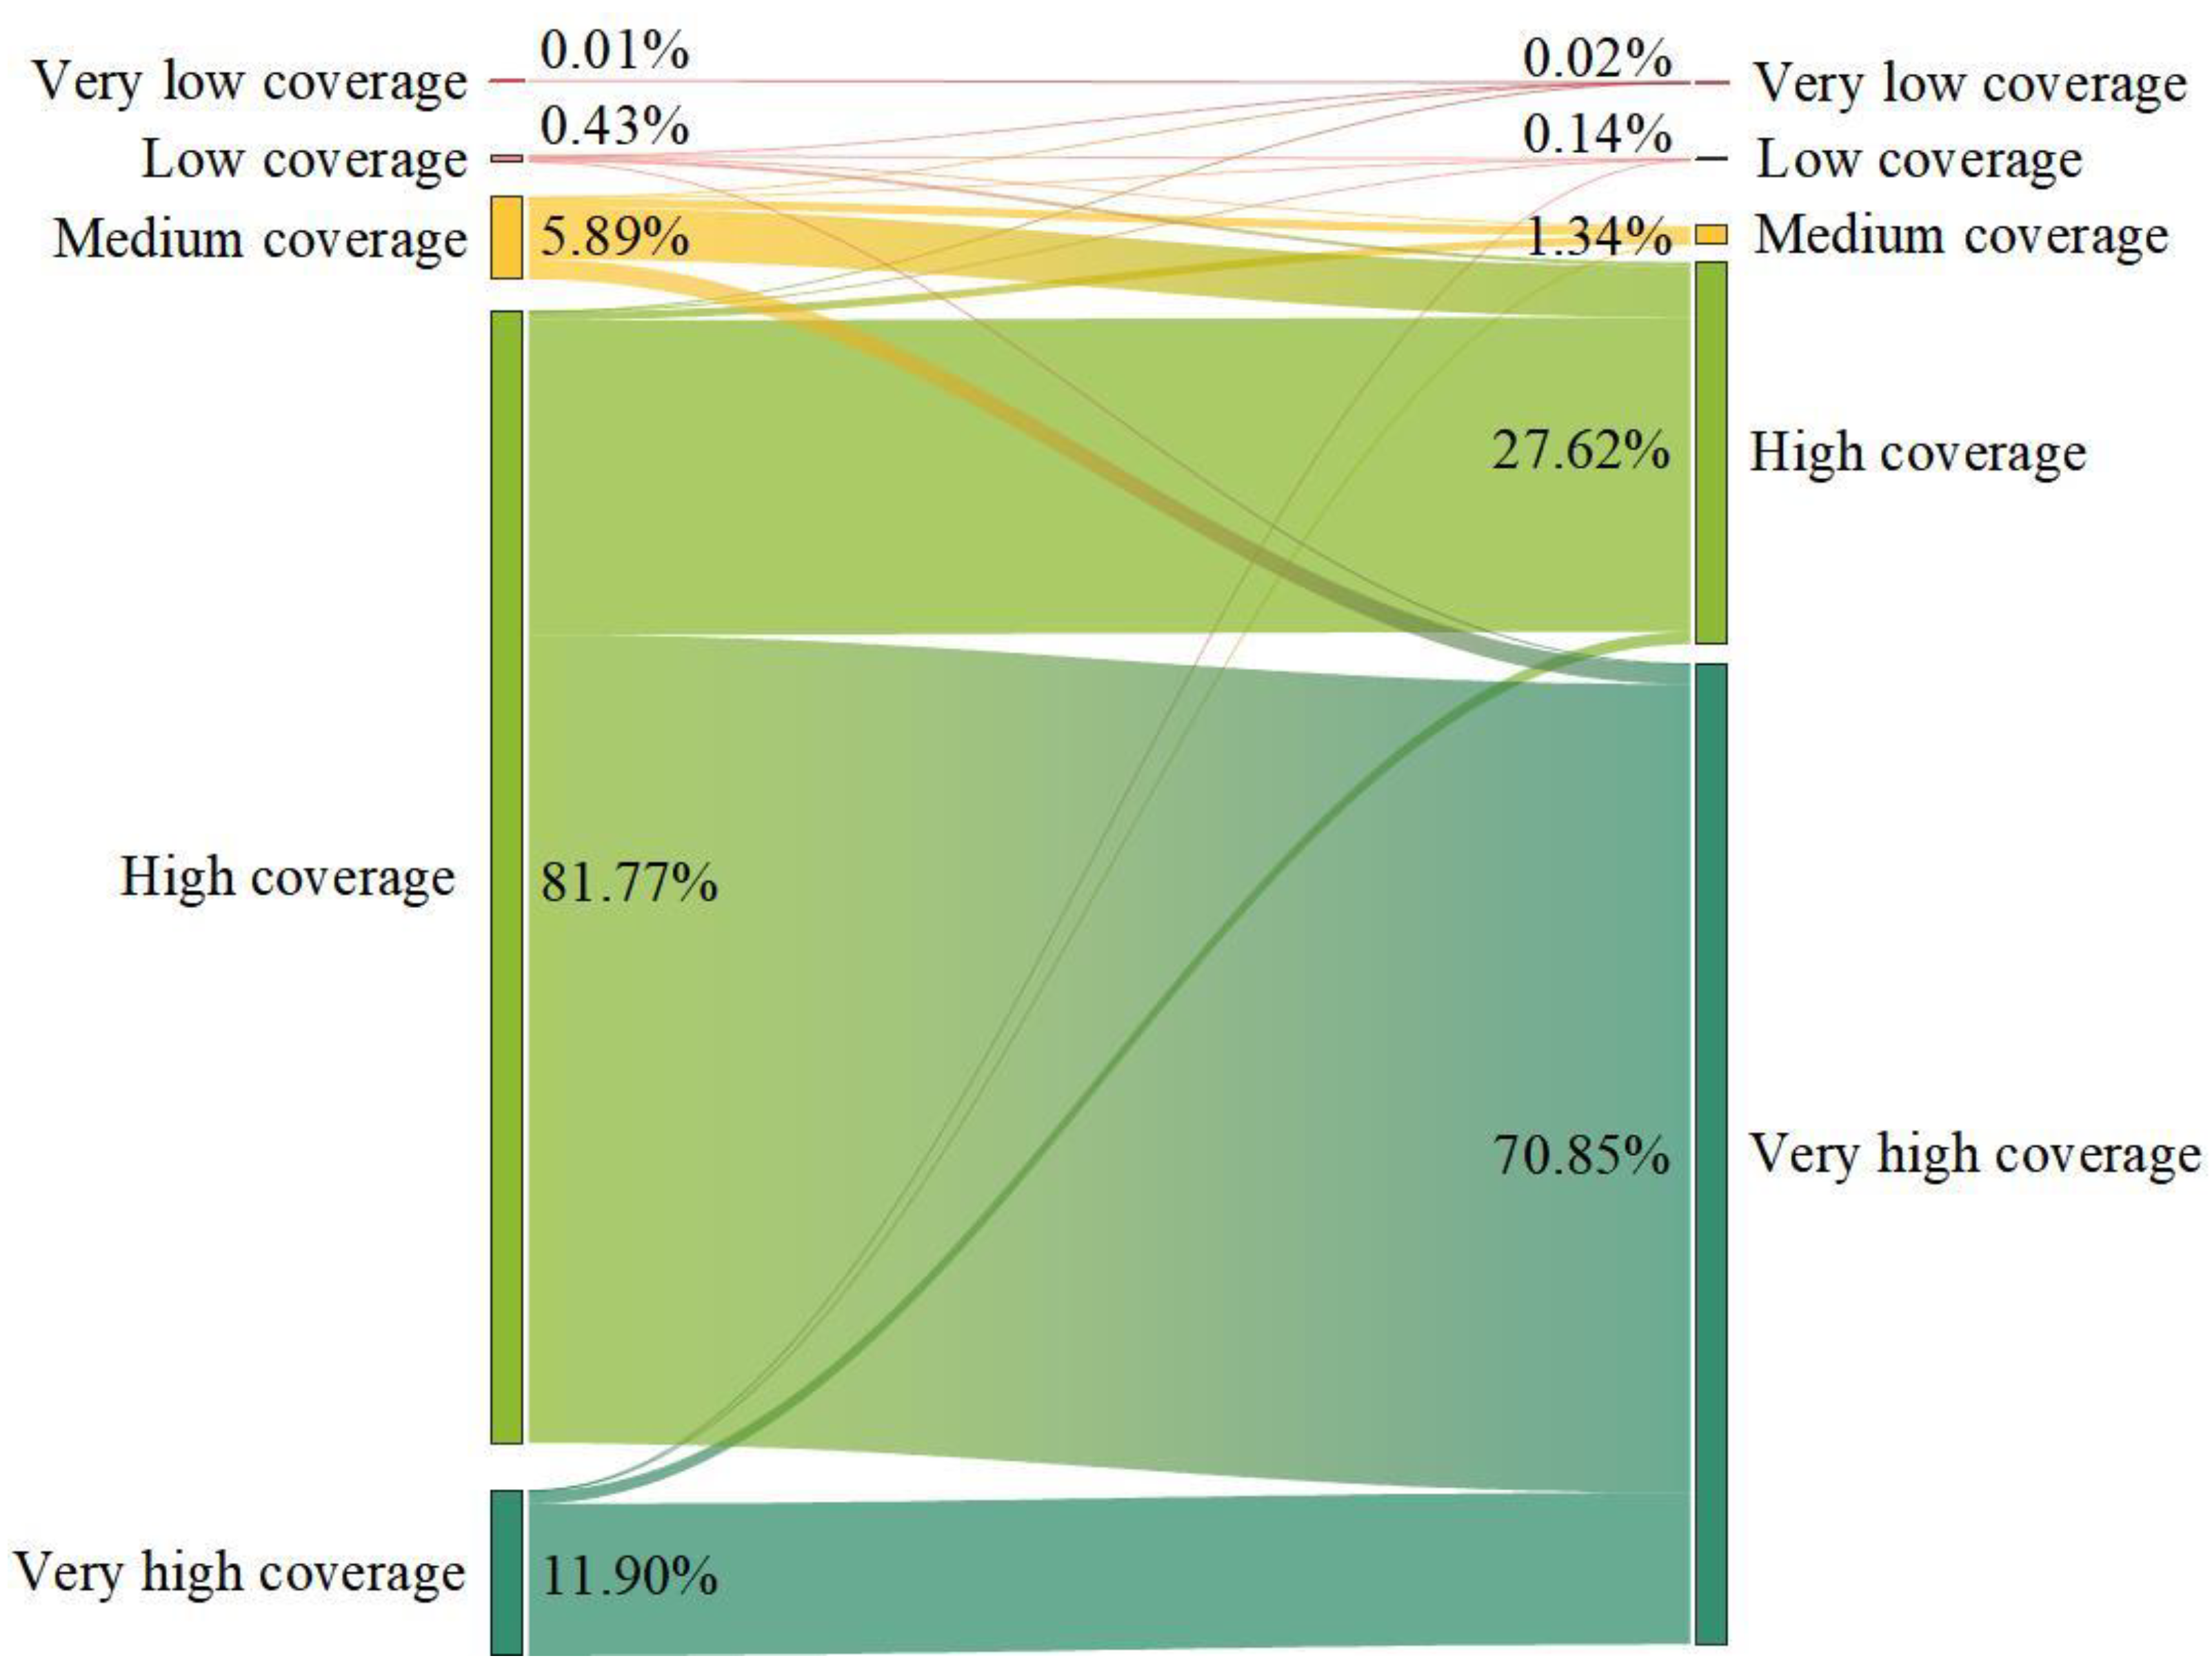
3.1.3. Transformation of Vegetation Grade Area from 2000 to 2020

As shown in Figure 7, during 2000–2020, the area with high vegetation coverage increased significantly, mainly due to the transformation from lower to higher vegetation coverage. Due to the increase in construction land area, low vegetation coverage showed an increasing trend. From 2000 to 2020, the areas of very low and very high vegetation coverage in the Jialing River Basin gradually increased, while the areas of low, medium, and high vegetation coverage gradually decreased. The original area with very low vegetation coverage remained unchanged, and the proportion of new area was 0.05%. Low vegetation coverage was mainly converted to high vegetation coverage, and the percentage of conversion area was 0.27%, with 0.03% remaining as the initial attribute. Medium vegetation coverage was mainly transformed into high (3.73%) and very high (1.45%) coverage, with 0.63% remaining as the initial attribute. After transformation, the area of very high coverage increased by 58.95%. According to the transfer matrix analysis, it mainly came from two categories: high coverage (58.41%) and medium coverage (1.45%). The area of high vegetation coverage decreased by 54.15%, which was mainly converted into two categories: extremely high coverage (58.41%) and medium coverage (0.59%).

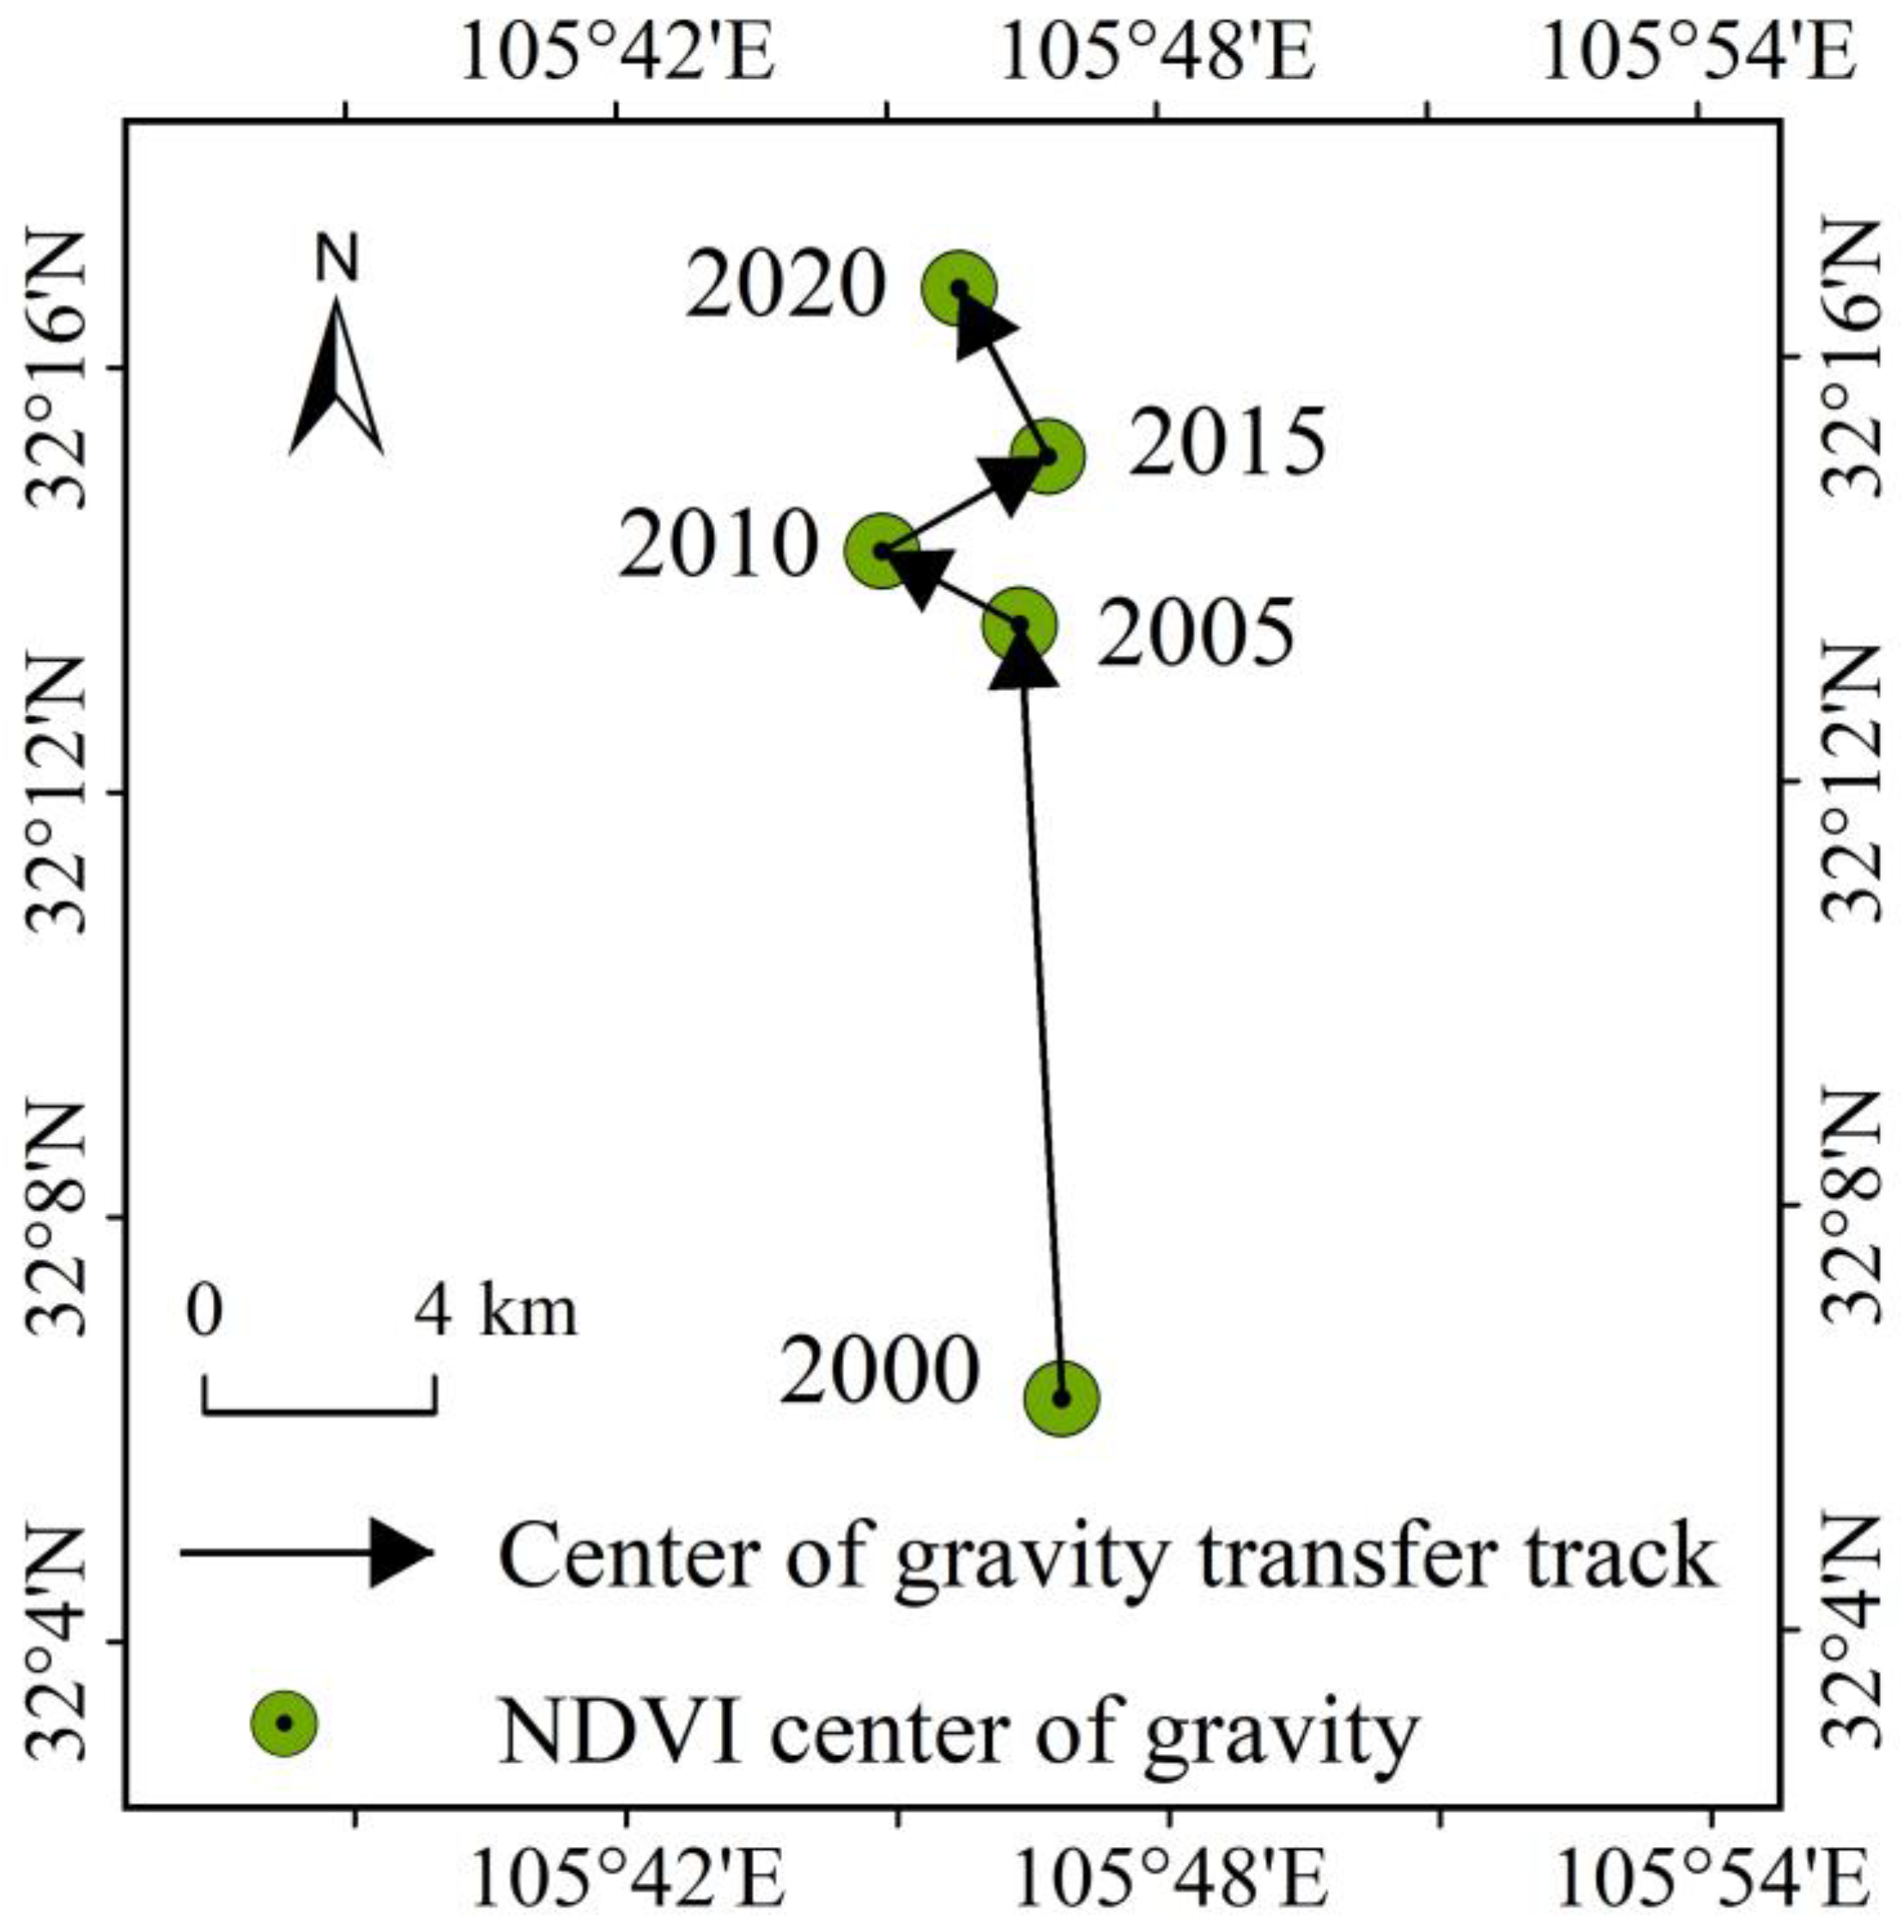
3.2. NDVI Barycentric Distribution and Migration

The NDVI center of gravity can effectively display the uneven and biased spatial distribution of the NDVI within the study area. The period from 2000 to 2020 was divided into four periods, each of which was 5 years, and the average NDVI of the different time intervals was analyzed. Figure 8 shows that the NDVI center of gravity showed a northwards migration trend over the past 20 years, with a longitude of 105°44′56″–105°46′52″ and latitude of 32°6′13″–32°16′41″. The shift in focus from 2000 to 2005 was the largest, followed by a decrease in the magnitude of the shift. These results indicated that growth of the NDVI in the north was better than that in the south during the study period.

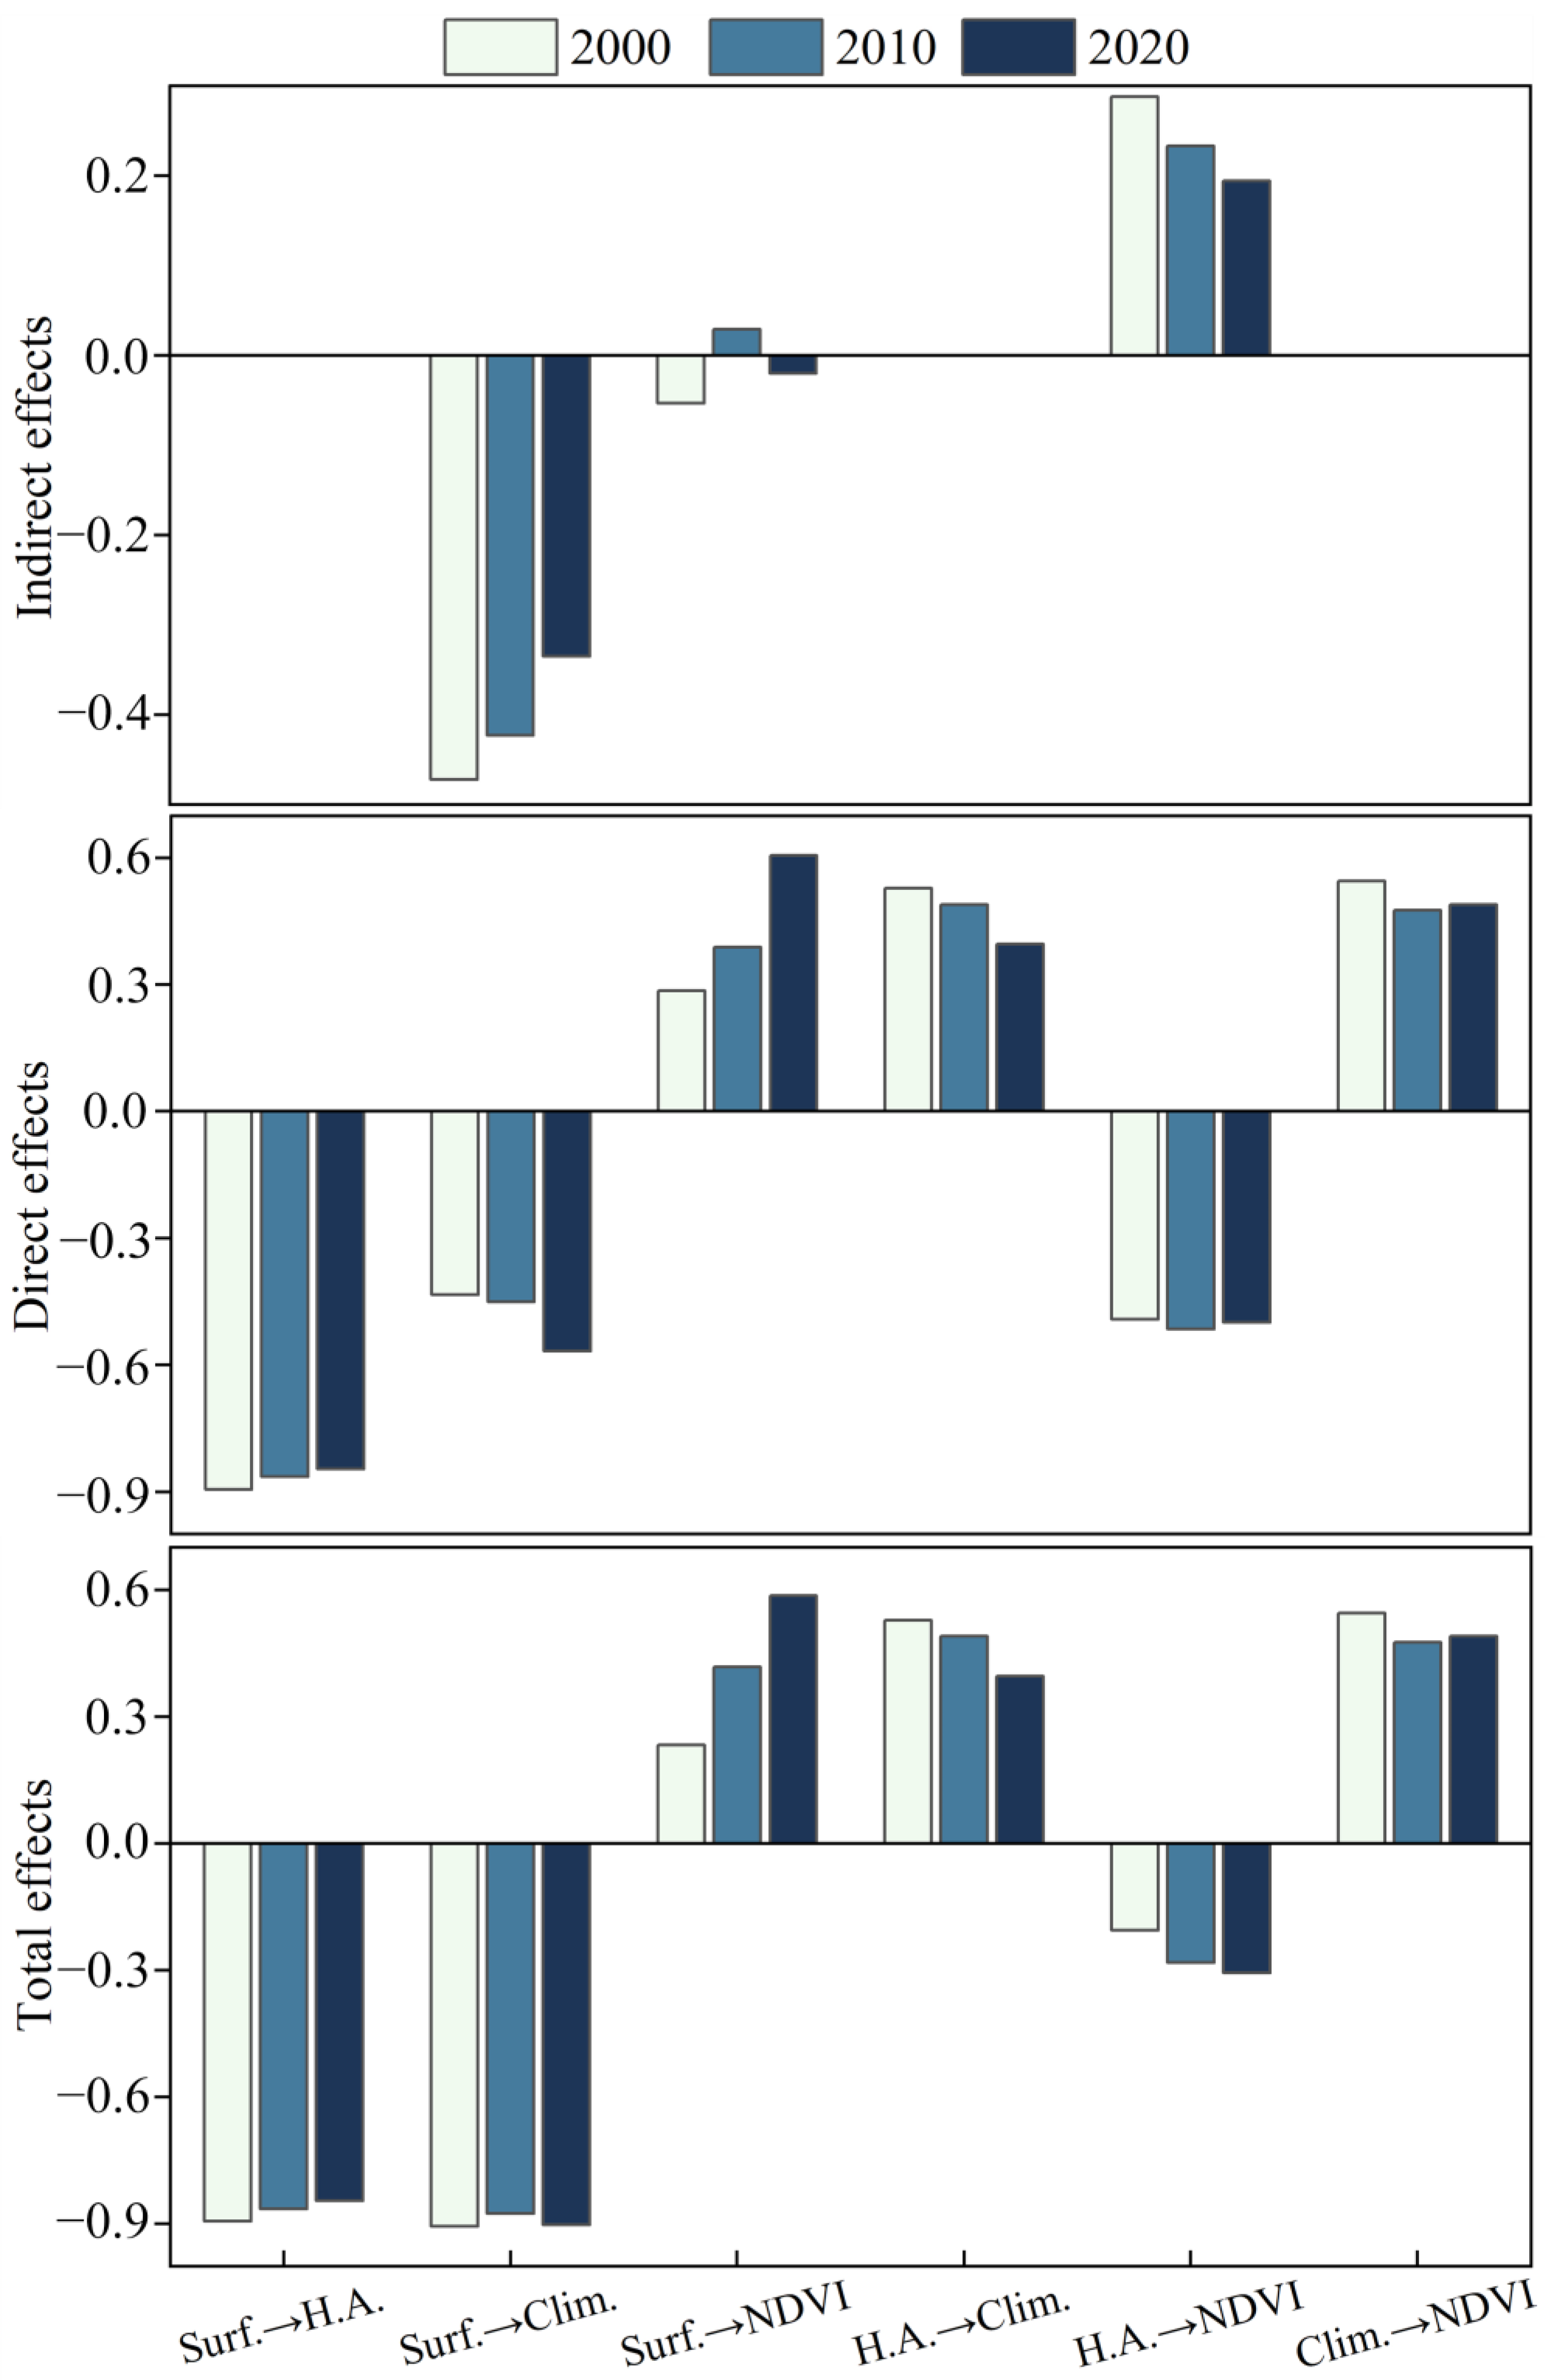
3.3. Changes in the Driving Effects of Various Factors on NDVI

The changes in the driving effects of various factors on the NDVI are shown in Figure 9. The impact of surface factors on the NDVI was mainly direct and positive. The direct path coefficients in 2000, 2010, and 2020 were 0.286, 0.389, and 0.606, respectively, showing a significant upwards trend. The average absolute value of the indirect path coefficient was only 0.034, which had little impact on vegetation. The average overall diameter coefficient was 0.412. Among its observable variables, the factor load of the DEM was the highest in all three models, with an average value of 0.402. The second factor was the geomorphic type factor, with an average value of 0.313.
The impact of human activities on the NDVI was mainly direct and negative. The direct path coefficients in 2000, 2010, and 2020 were −0.492, −0.515, and −0.500, respectively, with relatively small changes. The indirect path coefficients were 0.288, 0.233, and 0.194, respectively, showing a significant downwards trend. The average overall diameter coefficient was −0.264. Among the observable variables, the factor load of population density was the highest in the three-phase model, with an average value of 0.424, which indicated a relatively high impact on the human activity factors by the latent and observable variables. Next was the land use factor, with an average value of 0.313.
The impact of climate factors on the NDVI was mainly positive. The overall path coefficients of the three phases were 0.545, 0.476, and 0.490, respectively, showing an overall downwards trend. Among its observational variables, the average factor load values of the three temperature observational variables (AAT, AMaxT, AMaxT) were 0.313, 0.310, and 0.305, respectively. The average factor load value of annual precipitation was 0.098, and its influence on the latent and observable climate factors was far lower than that of the temperature factors.

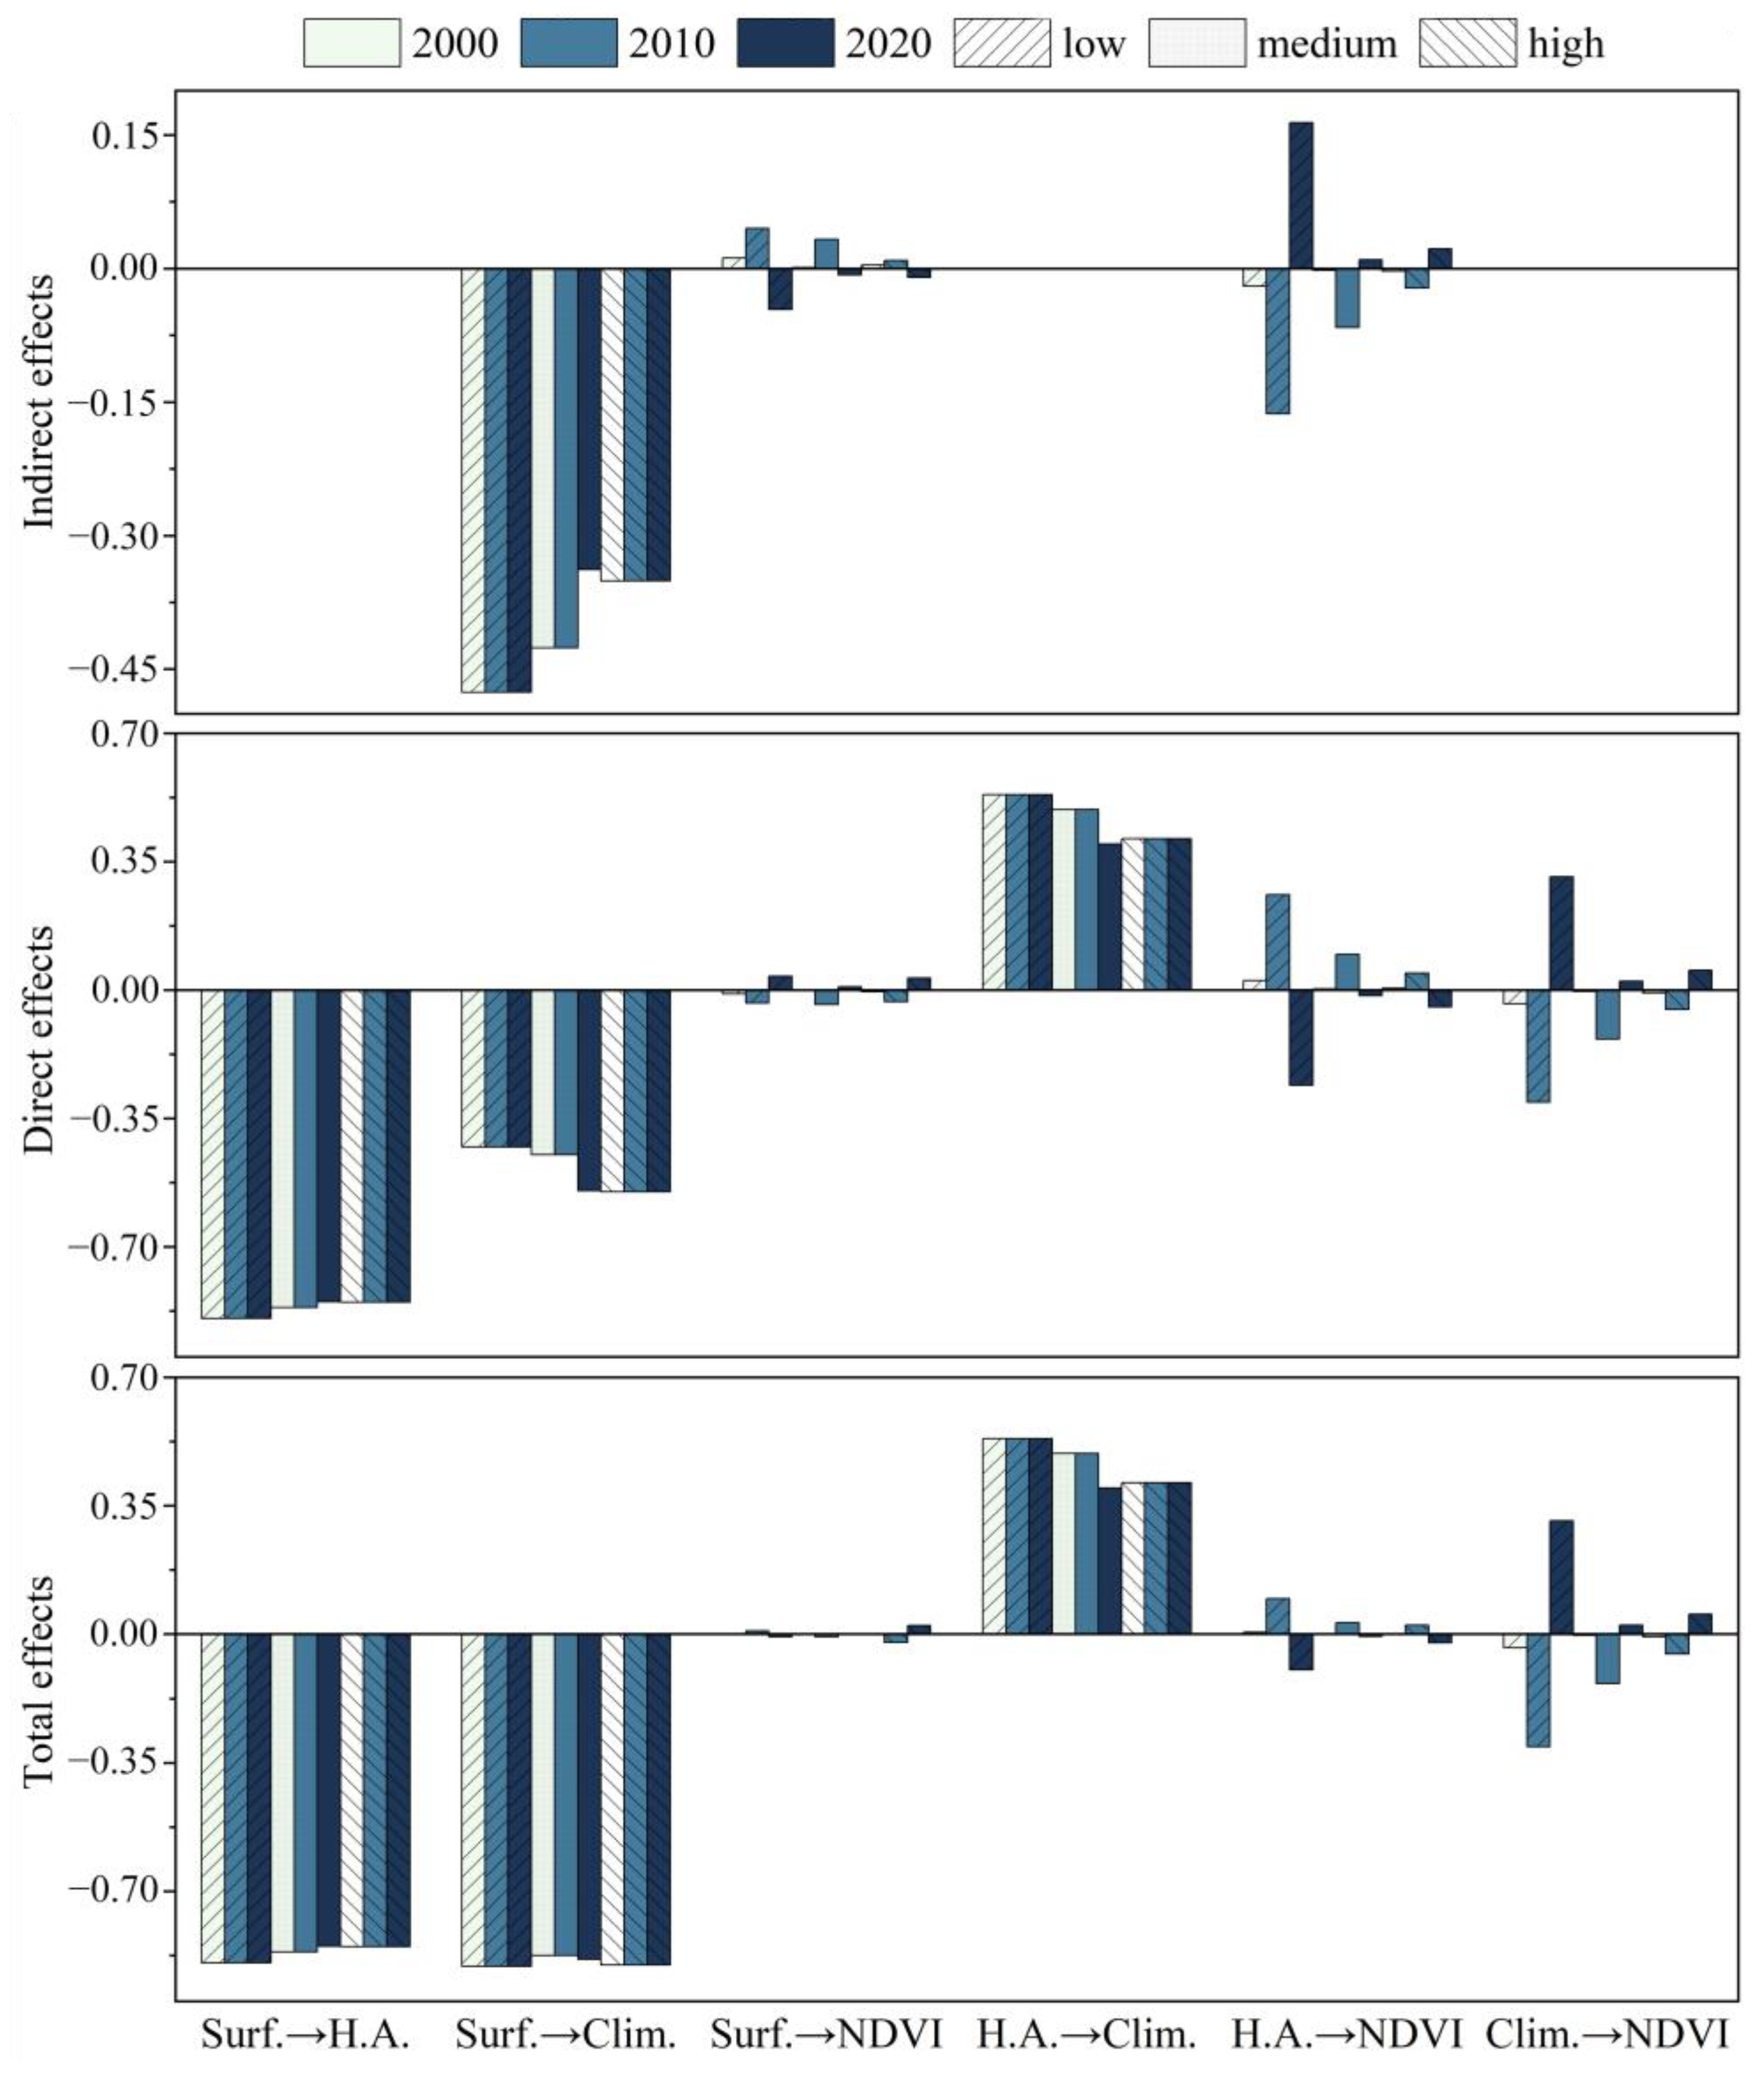
3.4. The Driving Effects of Various Factors on Different Levels of NDVI

The driving effects of various factors on different levels of the NDVI are shown in Figure 10. Different latent and observable variables had different effects on different levels of the NDVI. The impact of surface factors on the NDVI was mainly indirect. Among indirect effects, the surface had a positive effect on low and medium NDVI and a negative effect on areas with high vegetation coverage. The impact of human activities on the NDVI was mainly direct. Among direct effects, human activity factors had a negative effect on high NDVI and a positive effect on the NDVI in areas with low and medium vegetation coverage. The indirect effect was the opposite of the direct effect. The impact of climate factors on the NDVI was direct. Among direct effects, the latent and observable variables had a negative effect on the NDVI in low and medium vegetation coverage areas and a positive effect on high NDVI areas. The impact on medium and high NDVI was relatively strong. In summary, the driving mechanisms of low and medium NDVI were relatively similar but tended to be opposite to those of high NDVI. Medium and high NDVI values were more influenced by observable variables.

4. Discussion

4.1. Analysis of Spatiotemporal Changes in Vegetation Index

Vegetation is affected by the surface, climate, human activities, and other factors and is vulnerable to external interference. In the Jialing River Basin, due to various artificial engineering protection measures, the vegetation coverage has generally improved, and the NDVI values showed a fluctuating upwards trend. NDVI growth in the north was better than that in the south. This was consistent with the research results of Wang Gang [46]. Through the M–K test and barycentric model, the spatiotemporal change characteristics of vegetation in the Jialing River Basin were clarified. The M–K test results showed that significant degradation was mainly distributed in the southern and lower reaches of the Jialing River Basin. The migration results of the barycentric model showed that the barycenter of vegetation coverage continued to move northwards, and the growth rate of vegetation coverage in the north was greater than that in the south. Both simulation results supported the other and were consistent with previous research results [47]. There are two main reasons: on the one hand, the northern part of the Jialing River Basin is located in mountainous and hilly areas, such as the Qinling Mountains, which are less disturbed by human activities [48]. With the Three-North Shelterbelt Program Project and protection policies for mountainous areas, such as returning farmland to forests and closing mountains for afforestation, the growth rate and volume of vegetation in the northern part of the study area were higher than those in the southern part, leading to the gradual northwards shift of the NDVI center of gravity. On the other hand, the southern part of the Jialing River Basin is located in the Sichuan-Chongqing urban agglomeration. With reform and opening up policies [49], the urbanization rate has increased significantly, and a large part of the rural population has gradually flowed into cities. The increase in the number of permanent residents has led to an increase in the demand for urban and residential land. The expansion of urban land has become an objective demand, causing the construction area to grow rapidly. Forestland, grassland, and farmland have been transformed into urban construction land, destroying the original vegetation and resulting in a decrease in vegetation coverage in the south.

4.2. Main Control Factors of Vegetation Index

The NDVI in the Jialing River Basin was more sensitive to temperature changes than to precipitation changes, which was consistent with the research results of Zhang et al. [50]. Because most drainage basins are located in humid or semi-humid areas at low latitudes and with subtropical monsoon climates, compared with semiarid areas with less rainfall, the NDVI was not sensitive to rainfall changes [51]. The climate of the Loess Plateau is dry, with insufficient precipitation and low annual average rainfall. Temperature had a greater impact on the NDVI than precipitation [52]. Previous studies in semiarid regions have shown that rainfall has a more significant driving effect on the NDVI than temperature [53]. Therefore, the study findings of the driving forces of the NDVI suggest that there is a “short board effect”; that is, the NDVI is more sensitive to changes in lower values of temperature or rainfall and vulnerable to interference. Previous studies in semiarid areas showed that rainfall had a more significant driving effect on NDVI than temperature, further supporting the view of the “short board effect.” The enormous pressure of continuous population growth, the intensification of human socioeconomic activities, the development of the planting industry, and the expansion of agricultural areas in the research area has inevitably led to a continuous reduction in forest vegetation [54,55], causing damage to the environment [56]. Human activity factors had a negative impact on the direct pathway affecting the NDVI, and the impact was gradually strengthening. In recent years, with the advancement of technology, improvement of production tools, and further expansion of human activities, the impact capacity has been enhanced. The negative driving effect of human activity factors on the NDVI was particularly significant [57,58].
Most previous studies explained only the impacts of different influencing factors on the NDVI. In this study, we delved deeper into the impacts of different influencing factors on different levels of NDVI. Through indirect and direct paths, the driving processes of different latent and observable variables of the NDVI were explained in more detail, and the similarities and differences of the three driving modes were analyzed. Interestingly, the driving mechanisms of low and medium NDVI were relatively similar but tended to be opposite to those of high NDVI. This is a field that has rarely been explored by predecessors. Therefore, we chose watersheds with poor and good vegetation coverage for a simple comparison. In the study by Hu et al. [59], human activities in the inland arid grassland areas of China promoted growth of the NDVI. In the study by Tu et al. [60], vegetation degradation in the Yangtze Delta was mainly affected by human activities. Human activities such as delineating natural reserves and implementing ecological construction projects can promote the restoration of areas with poor vegetation. However, human activities such as urban expansion and agricultural cultivation have a significant inhibitory effect on vegetation growth in large urban agglomerations.

4.3. Possible Future Work

There were limitations in this study. First, the seasonal changes in the Jialing River Basin were obvious, the nongrowing and growing seasons were not distinguished, and the response of NDVI to climate change was analyzed at the seasonal scale [61]. Second, the time lag effect and periodicity of climate impact on vegetation growth were not considered, and further research is needed in the future. Third, this study identified 13 driving factors, but they were still not comprehensive. Some studies have shown that nitrogen deposition and CO2 concentration are important factors affecting vegetation growth [62,63], so further research is needed when these data are sufficient. Finally, our study did not analyze the impact of the interaction between the two potential factors on vegetation change, and we can further explore this topic using geographic detectors or machine learning.

5. Conclusions

This paper used trend analysis and a barycentric model to study the temporal and spatial changes in the NDVI in the Jialing River Basin from 2000 to 2020. PLS-SEM was carried out to analyze the indirect and direct effects of latent and observable variables of surface, human activities, and climate on vegetation growth and to explore the driving processes of different levels of NDVI. The conclusions are as follows:
(1)
From 2000 to 2020, the NDVI in the Jialing River Basin improved. It mainly increased significantly, accounting for 74.08% of the total basin area. The areas of high vegetation coverage increased significantly, mainly due to transformation of the lower and higher vegetation coverage areas. Due to the increase in construction land area, the low vegetation coverage area showed an increasing trend.
(2)
From 2000 to 2020, the overall center of the NDVI shifted northwards. The longitude of the center of gravity was between 105°44′56″ and 105°46′52″, and the latitude was between 32°6′13″ and 32°16′41″. During the study period, growth of the NDVI in the north of the Jialing River Basin was better than that in the south.
(3)
The impact of surface factors on the NDVI was mainly direct and positive. Among its observable variables, the factor load of the DEM was the highest, and the impact of human activity factors on the NDVI was mainly direct and negative. Population density had the highest impact on human activities. The impact of climate factors on the NDVI was mainly positive. The average factor load value of annual precipitation was 0.098, and its influence on the latent and observable climate factors was far lower than that of temperature factors.
(4)
Different latent and observable variables had different effects on different levels of NDVI. The driving mechanisms of low and medium NDVI were relatively similar but tended to be opposite to those of high NDVI. Medium and high NDVI values were more influenced by observable variables.
The results can help landscape managers understand the temporal and spatial characteristics of the NDVI in the Jialing River Basin and the mechanisms of different variables on vegetation growth. The information can provide a scientific basis for landscape management decisions, such as reasonable planning and management of land use, thus improving coordination between human activities and vegetation growth and adjustment of climate adaptation measures. By understanding the evolution trend of the ecological environment in the Jialing River Basin, areas where vegetation is degraded, damaged, or restored can be identified.

Author Contributions

Conceptualization, Data curation, Investigation, Methodology, Formal analysis, Writing—original draft: X.G.; Conceptualization, Methodology, Formal analysis, Writing—review and editing, Supervision, Funding acquisition: T.W.; Validation, Writing—review and editing: Z.L.; Project administration, Funding acquisition. S.C.; Supervision, Funding acquisition: P.L.; Validation, Writing—review and editing: H.L., N.Z., X.L. and Z.M. All authors have read and agreed to the published version of the manuscript.

Funding

This research was supported by the National Natural Science Foundation of China (Grant No. U2040208, 52009104, and U2243201), the Natural Science Foundations of Shaanxi Province (Grant No. 2023-ZDLSF-65 and 2022JQ-509), Yulin High-tech Zone Science and technology plan project (Grant No. YF-2022-197), Yulin High tech Zone Science and Technology Plan Project (Grant No. ZD-2021-08) and Yulin High tech Zone “Scientists+Engineers” Talent Team (Grant No. YGXKG-2022-107).

Institutional Review Board Statement

Not applicable.

Informed Consent Statement

Not applicable.

Data Availability Statement

The NDVI data from 2000 to 2020 are from the 1 km vegetation index spatial distribution dataset in China. The DEM data are from the DEM 90 m data (SRTM 90 m) dataset. The soil and geomorphic data are derived from the spatial distribution data of soil types and the spatial distribution dataset of China’s geomorphic types. The meteorological data are all from the China Meteorological Background Data Set. The GDP and land use type data are from the GDP spatial distribution kilometer grid dataset and the remote sensing monitoring data of land use status, respectively. The data of the above influencing factors are from the Resource and Environmental Science Data Center of the Chinese Academy of Sciences (https://www.resdc.cn/). Population density data are from the world grid population (GPW) v4 dataset (https://www.worldpop.org/).

Conflicts of Interest

The authors declare no conflict of interest.

References

  1. Mao, J.; Shi, X.; Thornton, P.E.; Hoffman, F.M.; Zhu, Z.; Myneni, R.B. Global Latitudinal-Asymmetric Vegetation Growth Trends and Their Driving Mechanisms: 1982–2009. Remote Sens. 2013, 5, 1484–1497. [Google Scholar] [CrossRef]
  2. Xu, G.; Cheng, Y.; Zhao, C.; Mao, J.; Li, Z.; Jia, L.; Zhang, Y.; Wang, B. Effects of Driving Factors at Multi-Spatial Scales on Seasonal Runoff and Sediment Changes. CATENA 2023, 222, 106867. [Google Scholar] [CrossRef]
  3. Dong, Y.; Yin, D.; Li, Y.; Yan, T.; Wang, H. Spatio-temporal patterns of vegetation change and driving forces in the Loess Plateau. J. China Agric. Univ. 2020, 25, 120–131. [Google Scholar] [CrossRef]
  4. Gao, L.; Wang, X.; Johnson, B.A.; Tian, Q.; Wang, Y.; Verrelst, J.; Mu, X.; Gu, X. Remote Sensing Algorithms for Estimation of Fractional Vegetation Cover Using Pure Vegetation Index Values: A Review. ISPRS J. Photogramm. Remote Sens. 2020, 159, 364–377. [Google Scholar] [CrossRef]
  5. Hu, Y.; Duan, W.; Chen, Y.; Zou, S.; Kayumba, P.M.; Qin, J. Exploring the changes and driving forces of water footprint in Central Asia: A global trade assessment. J. Clean. Prod. 2022, 375, 134062. [Google Scholar] [CrossRef]
  6. Lin, L.; Wei, X.; Luo, P.; Wang, S.; Kong, D.; Yang, J. Ecological Security Patterns at Different Spatial Scales on the Loess Plateau. Remote Sens. 2023, 15, 1011. [Google Scholar] [CrossRef]
  7. Luo, P.; Luo, M.; Li, F.; Qi, X.; Huo, A.; Wang, Z.; He, B.; Takara, K.; Nover, D.; Wang, Y. Urban flood numerical simulation: Research, methods and future perspectives. Environ. Model. Softw. 2022, 156, 105478. [Google Scholar] [CrossRef]
  8. Guo, L.; Zuo, L.; Gao, J.; Jiang, Y.; Zhang, Y.; Ma, S.; Zou, Y.; Wu, S. Revealing the Fingerprint of Climate Change in Interannual NDVI Variability among Biomes in Inner Mongolia, China. Remote Sens. 2020, 12, 1332. [Google Scholar] [CrossRef]
  9. Zhang, H.; Ma, J.; Chen, C.; Tian, X. NDVI-Net: A fusion network for generating high-resolution normalized difference vegetation index in remote sensing. ISPRS J. Photogramm. Remote Sens. 2020, 168, 182–196. [Google Scholar] [CrossRef]
  10. Bagherzadeh, A.; Hoseini, A.V.; Totmaj, L.H. The effects of climate change on normalized difference vegetation index (NDVI) in the Northeast of Iran. Model. Earth Syst. Environ. 2020, 6, 671–683. [Google Scholar] [CrossRef]
  11. Shan, Y.; Wala, D.; Xiang, Z.; Ying, H.; Yang, L.; Mei, H.; Siyu, C. Spatiotemporal Changes in NDVI and Its Driving Factors in the Kherlen River Basin. Chin. Geogr. Sci. 2023, 33, 377–392. [Google Scholar]
  12. Zhong, X.; Li, J.; Wang, J.; Zhang, J.; Liu, L.; Ma, J. Linear and Nonlinear Characteristics of Long-Term NDVI Using Trend Analysis: A Case Study of Lancang-Mekong River Basin. Remote Sens. 2022, 14, 6271. [Google Scholar] [CrossRef]
  13. Fan, X.; Gao, P.; Tian, B.; Wu, C.; Mu, X. Spatio-Temporal Patterns of NDVI and Its Influencing Factors Based on the ESTARFM in the Loess Plateau of China. Remote Sens. 2023, 15, 2553. [Google Scholar] [CrossRef]
  14. Jia, J.; Niu, J.; Lin, X.; Zhu, Z.; Wu, S. Temporal and spatial variations of NDVI and its driving factors in the Yanghe Watershed of northern China. J. Beijing For. Univ. 2019, 41, 106–115. [Google Scholar] [CrossRef]
  15. Chen, H.; Ou, Y.; Lv, F.; Song, Y.; Hao, R. Variation of Vegetation Cover and Its Correlation of Topographic Factors in Guandu River Basin. Res. Soil Water Conserv. 2019, 26, 135–140+147. [Google Scholar] [CrossRef]
  16. Dong, Y.; Yin, D.; Li, X.; Huang, J.; Su, W.; Li, X.; Wang, H. Spatial–Temporal Evolution of Vegetation NDVI in Association with Climatic, Environmental and Anthropogenic Factors in the Loess Plateau, China during 2000–2015: Quantitative Analysis Based on Geographical Detector Model. Remote Sens. 2021, 13, 4380. [Google Scholar] [CrossRef]
  17. Xiong, Y.; Wang, H. Spatial relationships between NDVI and topographic factors at multiple scales in a watershed of the Minjiang River, China. Ecol. Inform. 2022, 69, 101617. [Google Scholar] [CrossRef]
  18. Ding, H.; Xingming, H. Spatiotemporal Change and Drivers Analysis of Desertification in the Arid Region of Northwest China Based on Geographic Detector. Environ. Chall. 2021, 4, 100082. [Google Scholar] [CrossRef]
  19. Qiu, K.; Zhang, Y.; Wang, T. Analysis on the dynamics of the vegetation coverage and the drivers in Taihu Basin via NDVI. Sci. Soil Water Conserv. 2019, 17, 119–125. [Google Scholar] [CrossRef]
  20. Yang, C.; Deng, K.; Peng, D.; Jiang, L.; Zhao, M.; Liu, J.; Qiu, X. Spatiotemporal Characteristics and Heterogeneity of Vegetation Phenology in the Yangtze River Delta. Remote Sens. 2022, 14, 2984. [Google Scholar] [CrossRef]
  21. Hao, J.; Xu, G.; Luo, L.; Zhang, Z.; Yang, H.; Li, H. Quantifying the relative contribution of natural and human factors to vegetation coverage variation in coastal wetlands in China. CATENA 2020, 188, 104429. [Google Scholar] [CrossRef]
  22. Chen, C.; Li, T.; Sivakumar, B.; Li, J.; Wang, G. Attribution of Growing Season Vegetation Activity to Climate Change and Human Activities in the Three-River Headwaters Region, China. J. Hydroinform. 2020, 22, 186–204. [Google Scholar] [CrossRef]
  23. Zhang, S.; Nie, Y.; Zhang, H.; Li, Y.; Han, Y.; Liu, X.; Wang, B. Spatiotemporal Variation of Vegetation NDVI and its Driving Forces in Mongolia Based on Geodetector. Acta Agrestia Sin. 2020, 28, 1460–1472. [Google Scholar] [CrossRef]
  24. Wang, D.; Tian, Y.; Zhang, Y.; Huang, L.; Zhang, Q.; Tao, J.; Yang, Y.; Lin, J. Spatiotemporal evolution and attribution of vegetation coverage in the peak-cluster depression basins. China Environ. Sci. 2022, 42, 4274–4284. [Google Scholar] [CrossRef]
  25. Xu, Y.; Zheng, Z.; Guo, Z.; Dou, S.; Huang, W. Dynamic Variation in Vegetation Cover and Its Influencing Factor Detection in the Yangtze River Basin from 2000 to 2020. Environ. Sci. 2022, 43, 3730–3740. [Google Scholar] [CrossRef]
  26. Revadekar, J.V.; Tiwari, Y.K.; Kumar, K.R. Impact of climate variability on NDVI over the Indian region during 1981-2010. Int. J. Remote Sens. 2012, 33, 7132–7150. [Google Scholar] [CrossRef]
  27. Allen, T.L.; Curtis, S.; Gamble, D.W. The Midsummer Dry Spell’s Impact on Vegetation in Jamaica. J. Appl. Meteorol. Climatol. 2010, 49, 1590–1595. [Google Scholar] [CrossRef]
  28. Liu, S.; Zhang, P.; Miao, W.; Wang, Z.; Li, D. Study on sediment transport law of flood event in different areas of the Jialingjiang River basin. Adv. Water Sci. 2022, 33, 38–47. [Google Scholar] [CrossRef]
  29. Cleland, E.; Chuine, I.; Menzel, A.; Mooney, H.; Schwartz, M. Shifting plant phenology in response to global change. Trends Ecol. Evol. 2007, 22, 357–365. [Google Scholar] [CrossRef]
  30. Chen, H.; Ren, Z. Response of Vegetation Coverage to Changes of Precipitation and Temperature in Chinese Mainland. Bull. Soil Water Conserv. 2013, 33, 78–82+4. [Google Scholar] [CrossRef]
  31. Chu, H.; Venevsky, S.; Wu, C.; Wang, M. NDVI-based vegetation dynamics and its response to climate changes at Amur-Heilongjiang River Basin from 1982 to 2015. Sci. Total Environ. 2019, 650, 2051–2062. [Google Scholar] [CrossRef]
  32. Zhang, T.; Zhang, X.; Xia, D.; Liu, Y. An Analysis of Land Use Change Dynamics and Its Impacts on Hydrological Processes in the Jialing River Basin. Water 2014, 6, 3758–3782. [Google Scholar] [CrossRef]
  33. Zeng, X.; Zhao, N.; Sun, H.; Ye, L.; Zhai, J. Changes and Relationships of Climatic and Hydrological Droughts in the Jialing River Basin, China. PLoS ONE 2015, 10, e0141648. [Google Scholar] [CrossRef] [PubMed]
  34. Zhou, Y.; Li, D.; Lu, J.; Yao, S.; Yan, X.; Jin, Z.; Liu, L.; Lu, X.X. Distinguishing the Multiple Controls on the Decreased Sediment Flux in the Jialing River Basin of the Yangtze River, Southwestern China. CATENA 2020, 193, 104593. [Google Scholar] [CrossRef]
  35. Gu, Z.; Duan, X.; Shi, Y.; Li, Y.; Pan, X. Spatiotemporal variation in vegetation coverage and its response to climatic factors in the Red River Basin, China. Ecol. Indic. 2018, 93, 54–64. [Google Scholar] [CrossRef]
  36. Lu, C.; Hou, M.; Liu, Z.; Li, H.; Lu, C. Variation Characteristic of NDVI and its Response to Climate Change in the Middle and Upper Reaches of Yellow River Basin, China. IEEE J. Sel. Top. Appl. Earth Obs. Remote Sens. 2021, 14, 8484–8496. [Google Scholar] [CrossRef]
  37. Florinsky, I.V.; Kuryakova, G.A. Influence of topography on some vegetation cover properties. CATENA 1996, 27, 123–141. [Google Scholar] [CrossRef]
  38. Lin, M.; Hou, L.; Qi, Z.; Wan, L. Impacts of climate change and human activities on vegetation NDVI in China’s Mu Us Sandy Land during 2000–2019. Ecol. Indic. 2022, 142, 109164. [Google Scholar] [CrossRef]
  39. Lie, Q.; Hu, Z.; Wang, J.; Zhang, Y.; Wu, G. Spatiotemporal dynamics of NDVI in China from 1985 to 2015: Ecosystem variation, regional differences, and response to climatic factors. Acta Ecol. Sin. 2023, 43, 6378–6391. [Google Scholar] [CrossRef]
  40. Hu, T.; Wu, J.; Li, W. Assessing Relationships of Ecosystem Services on Multi-Scale: A Case Study of Soil Erosion Control and Water Yield in the Pearl River Delta. Ecol. Indic. 2019, 99, 193–202. [Google Scholar] [CrossRef]
  41. Yu, S.; Wang, L.; Zhao, J.; Shi, Z. Using Structural Equation Modelling to Identify Regional Socio-Economic Driving Forces of Soil Erosion: A Case Study of Jiangxi Province, Southern China. J. Environ. Manag. 2021, 279, 111616. [Google Scholar] [CrossRef] [PubMed]
  42. Zhu, W.; Zha, X.; Luo, P.; Wang, S.; Cao, Z.; Lyu, J.; Zhou, M.; He, B.; Nover, D. A quantitative analysis of research trends in flood hazard assessment. Stoch. Environ. Res. Risk Assess. 2023, 37, 413–428. [Google Scholar] [CrossRef]
  43. Luo, P.; Liu, L.; Wang, S.; Ren, B.; He, B.; Nover, D. Influence assessment of new Inner Tube Porous Brick with absorbent concrete on urban floods control. Case Stud. Constr. Mater. 2022, 17, e01236. [Google Scholar] [CrossRef]
  44. Duan, W.; Zou, S.; Christidis, N.; Schaller, N.; Chen, Y.; Sahu, N.; Li, Z.; Fang, G.; Zhou, B. Changes in temporal inequality of precipitation extremes over China due to anthropogenic forcings. npj Clim. Atmos. Sci. 2022, 5, 33. [Google Scholar] [CrossRef]
  45. Luo, P.; Mu, Y.; Wang, S.; Zhu, W.; Mishra, B.K.; Huo, A.; Zhou, M.; Lyu, J.; Hu, M.; Duan, W.; et al. Exploring Sustainable Solutions for the Water Environment in Chinese and Southeast Asian Cities. Ambio 2022, 51, 1199–1218. [Google Scholar] [CrossRef] [PubMed]
  46. Wang, G.; Zhang, H.; Liu, Y.; Xia, D. Annual and seasonal variation characteristics of NDVI and its relationship with meteorological factors in Jialing River Basin. J. Hohai Univ. (Nat. Sci.) 2013, 41, 21–25. [Google Scholar] [CrossRef]
  47. Hu, M.; Yu, H.; Kong, B.; Xiong, Z.; Xu, T. Spatial-temporal variations of fractional vegetation coverage in Jialing River Basin from 2001 to 2020. Yangtze River 2022, 53, 82–89+96. [Google Scholar] [CrossRef]
  48. Jiang, M.; Tian, P.; Mu, X.; Zhao, G. Spatiotemporal Variation and Attribution Analysis of Sediment Load in Jialing River Basin. Res. Soil Water Conserv. 2023, 30, 116–121+128. [Google Scholar] [CrossRef]
  49. Zha, X.; Luo, P.; Zhu, W.; Wang, S.; Lyu, J.; Zhou, M.; Huo, A.; Wang, Z. A bibliometric analysis of the research on Sponge City: Current situation and future development direction. Ecohydrology 2021, 14, e2328. [Google Scholar] [CrossRef]
  50. Zhang, T.; Xue, D.; Duan, J.; Yang, L. Spatio-temporal Variation Characteristics and Climate Response Analysis of Vegetation Coverage in Jialing River Basin from 2000 to 2019. Resour. Environ. Yangtze Basin 2021, 30, 1110–1120. [Google Scholar] [CrossRef]
  51. Zhang, S.; Li, W.; An, W.; Hou, J.; Hou, X.; Tang, C.; Gan, Z. Temporal and spatial evolutionary trends of regional extreme precipitation under different emission scenarios: Case study of the Jialing River Basin, China. J. Hydrol. 2023, 617, 129156. [Google Scholar] [CrossRef]
  52. Liu, M.; Zhao, R.; Shao, P.; Jiao, J.; Li, L.; Che, Y. Temporal and spatial variation of vegetation coverage and its driving forces in the Loess Plateau from 2001 to 2015. Arid. Land Geogr. 2018, 41, 99–108. [Google Scholar] [CrossRef]
  53. Zhu, Y.; Luo, P.; Zhang, S.; Sun, B. Spatiotemporal Analysis of Hydrological Variations and Their Impacts on Vegetation in Semiarid Areas from Multiple Satellite Data. Remote Sens. 2020, 12, 4177. [Google Scholar] [CrossRef]
  54. Barbier, E.B.; Burgess, J.C.; Grainger, A. The Forest Transition: Towards a More Comprehensive Theoretical Framework. Land Use Policy 2010, 27, 98–107. [Google Scholar] [CrossRef]
  55. Tang, C.; Sun, W. Comprehensive Evaluation of Land Spatial Development Suitability of the Yangtze River Basin. Acta Geogr. Sin. 2012, 67, 1587–1598. [Google Scholar]
  56. Wang, S.; Luo, P.; Xu, C.; Zhu, W.; Cao, Z.; Ly, S. Reconstruction of Historical Land Use and Urban Flood Simulation in Xi’an, Shannxi, China. Remote Sens. 2022, 14, 6067. [Google Scholar] [CrossRef]
  57. Han, J.; Zhang, X.; Wang, J.; Zhai, J. Geographic Exploration of the Driving Forces of the NDVI Spatial Differentiation in the Upper Yellow River Basin from 2000 to 2020. Sustainability 2023, 15, 1922. [Google Scholar] [CrossRef]
  58. Luo, P.; Zheng, Y.; Wang, Y.; Zhang, S.; Yu, W.; Zhu, X.; Huo, A.; Wang, Z.; He, B.; Nover, D. Comparative Assessment of Sponge City Constructing in Public Awareness, Xi’an, China. Sustainability 2022, 14, 11653. [Google Scholar] [CrossRef]
  59. Hu, Z.; Song, X.; Qin, L.; Liu, H.; Wen, W. Spatio-temporal Variation Characteristics and Its Driving Factors of NDVI at County Scale for an Inland Arid Grassland During 2001–2020. Bull. Soil Water Conserv. 2022, 42, 213–221. [Google Scholar] [CrossRef]
  60. Tu, Y.; Jiang, L.; Liu, R.; Xiao, Z.; Min, J. Spatiotemporal changes of vegetation NDVI and its driving forces in China during 1982–2015. Trans. Chin. Soc. Agric. Eng. 2021, 37, 75–84. [Google Scholar] [CrossRef]
  61. Growing-season vegetation coverage patterns and driving factors in the China-Myanmar Economic Corridor based on Google Earth Engine and geographic detector. Ecol. Indic. 2022, 136, 108620. [CrossRef]
  62. Piao, S.; Yin, G.; Tan, J.; Cheng, L.; Huang, M.; Li, Y.; Liu, R.; Mao, J.; Myneni, R.B.; Peng, S. Detection and attribution of vegetation greening trend in China over the last 30 years. Glob. Chang. Biol. 2015, 21, 1601–1609. [Google Scholar] [CrossRef] [PubMed]
  63. Luo, P.; Xu, C.; Kang, S.; Huo, A.; Lyu, J.; Zhou, M.; Nover, D. Heavy metals in water and surface sediments of the Fenghe River Basin, China: Assessment and source analysis. Water Sci. Technol. 2021, 84, 3072–3090. [Google Scholar] [CrossRef] [PubMed]
Figure 1. Location map of Jialing River Basin.
Sustainability 15 13089 g001
Figure 2. Conceptual structural equation model of NDVI in the Jialing River Basin. Ellipses represent potential variables. Squares with different colors represent the observable variables that constitute different potential variables. Arrows between latent and observable variables indicate correlations between them. Arrows between potential variables indicate causal relationships.
Sustainability 15 13089 g002
Figure 3. Annual NDVI changes in the Jialing River Basin from 2000 to 2020. The green line represents the annual average of NDVI. The red line represents the best fit line.
Sustainability 15 13089 g003
Figure 4. NDVI significance trend change in the Jialing River Basin.
Sustainability 15 13089 g004
Figure 5. NDVI distribution pattern in the Jialing River Basin.
Sustainability 15 13089 g005
Figure 6. Proportion of the average vegetation coverage area from 2000 to 2020.
Sustainability 15 13089 g006
Figure 7. Conversion ratios of different vegetation area grades from 2000 to 2020.
Sustainability 15 13089 g007
Figure 8. Center of gravity shift and change track.
Sustainability 15 13089 g008
Figure 9. Indirect, direct, and total effects of different latent and observable variables on the NDVI in each year.
Sustainability 15 13089 g009
Figure 10. Indirect, direct, and total effects of different latent and observable variables on different levels of NDVI in each year.
Sustainability 15 13089 g010
Table 1. NDVI change trend types.
θ s l o p e Z s Change Type θ s l o p e Z s Change Type
>0≥2.58Very significant improvement<0<1.96Insignificant degradation
≥1.96Significant improvement≥1.96Significant degradation
<1.96Insignificant improvement≥2.58Very significant degradation
Table 2. Sample size and fitting results of PLE-SEM with different vegetation levels in different years.
ClassificationNumber of Valid SamplesSRMRd_ULSd_G
Low NDVI200098960.0730.5520.905
201099030.0720.5440.837
202098900.0780.6440.631
Medium NDVI200098960.0730.5570.909
201099030.0720.5460.837
202098900.0780.6450.631
High NDVI200098960.0730.5570.909
201099030.0720.5460.837
202098900.0780.6450.631
Disclaimer/Publisher’s Note: The statements, opinions and data contained in all publications are solely those of the individual author(s) and contributor(s) and not of MDPI and/or the editor(s). MDPI and/or the editor(s) disclaim responsibility for any injury to people or property resulting from any ideas, methods, instructions or products referred to in the content.

