Article

The Use of the Taguchi Method with Grey Relational Analysis for Nanofluid-Phase Change-Optimized Parameter Design at a Rooftop Solar Photovoltaic Thermal Composite Module for Small Households

1
Department of Materials Science and Engineering, National Taiwan University of Science and Technology, Taipei 10607, Taiwan
2
Green Energy & Environment Research Laboratories, Industrial Technology Research Institute, Hsinchu 310401, Taiwan
*
Author to whom correspondence should be addressed.
Sustainability 2023, 15(20), 15163; https://0-doi-org.brum.beds.ac.uk/10.3390/su152015163
Submission received: 26 July 2023 / Revised: 21 August 2023 / Accepted: 29 August 2023 / Published: 23 October 2023
(This article belongs to the Special Issue Sustainable Energy Saving Building Envelopes)

Abstract

:
This study aims to optimize the process parameters of the nanofluid-phase change-solar photovoltaic thermal (nanofluid-PCM-PV/T) composite module. In particular, the organic paraffin was selected as a phase change material, while water, CuO, and Al2O3 were selected as nanofluids. The TRNSYS 16.0 software was employed to model and analyze the composite module. The Taguchi method with the main effect analysis (MEA), analysis of variance (ANOVA), and the orthogonal table were established to investigate the impact of each control factor on the power generation and heat storage efficiency. Grey relational analysis (GRA) was adopted to obtain the parameters for multi-quality optimization. The result showed that the power generation efficiency in this study was 14.958%, and the heat storage efficiency was 64.764%. Meanwhile, in the conventional PV/T module, the former was 12.74%, and the latter was 34.06%, respectively. Verification results showed that the confidence intervals of both single-quality and multi-quality optimization parameter sets were within 95%. The errors of the results from both theoretical simulation and real testing were smaller than 5%. In the case of a generally small family of four members using electric/water heaters, the rooftop module in this study was more efficient than the typical rooftop PV/T by 25.04%. The former’s investment recovery period was lower than 0.81 years.

1. Introduction

Developing innovative technologies is imperative in reducing carbon footprint and switching to renewable energy to meet the challenges posed by growing energy demands and environmental concerns [1]. Our research is rooted in the recognition that conventional solar photovoltaic (PV) systems are effective and have untapped potential for improving energy conversion efficiency and thermal management. The gaps this study aims to address are the lack of comprehensive integration between photovoltaic and thermal systems and the need for enhanced thermal management strategies. This gap presents an excellent opportunity for innovation in the form of the proposed nanofluidic phase change solar photovoltaic thermal composite module [2]. Combining the advantages of the parameter optimization of nanofluids, phase change materials, and photovoltaic technologies improves power generation efficiency and effectively manages heat transfer and thermal energy storage. This premise underlines the importance of our research in advancing sustainable energy technologies.
The liquid PV/T module [3] is equipped with collector tubes. The waste heat of the solar panel is transferred to the collector tube through the collector plate, as shown in Figure 1. A working fluid flows in the collector tube, which can exchange heat with the collector tube by means of convection working fluid. After the working fluid absorbs heat and heats up, it stores heat energy in the form of thermal fluid. Such systems are more efficient due to heat removal from PV panels through circulating fluid/s and the utilization of this heat for other applications [4].
The PV/T system began in 1976 when Wolf [5] discovered that integrating a PV system with a heat collector system was feasible. In 2001, Huang et al. [6] developed a PV/T-combined horizontal water storage tank system and proposed a solar energy-saving calculation formula. The results showed that the total efficiency is higher than the traditional PV system and the traditional solar thermal system. Shan et al. [7] conducted research on tube-sheet PV/T composite modules in 2013, displaying the temperature of the inlet and outlet of the PV/T system. They found that the mass flow rate of the water loop had a significant impact on a system’s efficiency. The correlation coefficient between the heat conduction model and the actual situation reached 0.98. In 2019, Kuo et al. [8] optimized the design and actual verification of the traditional PV/T system. The results showed that the power generation efficiency of the system was 14.29%, and the heat storage efficiency was 44.96%. Compared to the traditional PV/T system, both efficiencies were improved.
With the continuous deepening of PV/T system research, phase change materials (PCM) have begun to attract attention due to their many advantages. PCM has high latent heat of phase change and can absorb or release a large amount of heat energy under low temperature and volume change during the phase change process. Because of its excellent heat storage capacity and high-energy density, it has a high potential in the application of solar energy [9]. Cooling of the PCM material was first proposed by Stultz and Wen in 1977 [10], where the solar panel was connected to a container containing PCM, and the heat generated inside was absorbed by the melting of the PCM during the operation of the panel. Therefore, the working temperature of the solar PV system was reduced, and the power generation efficiency of the system was improved. Yin et al. [11] added copper and graphite to the PCM material to reduce the thermal resistance of the PCM. The results showed that after adding the PCM material, the operating temperature of the PV/T system was significantly reduced, and the output power was increased by 23.52%. Carmona et al. [12] added paraffin as a PCM material to the PV/T system in 2021 and compared the new PCM-PV/T system with the traditional PV/T system. The results showed that the PV/T system with added paraffin could reduce the solar panel’s temperature by up to 17 °C. Compared with the traditional system, power generation efficiency can be improved by nearly 0.98%, and at the same time, 20.45% more energy can be utilized from solar energy. In 2021, Chaichan et al. [13] mixed organic paraffin with petrolatum to reduce the melting point of paraffin and added this mixture as a PCM material to the PV/T system. Experiments showed that PCM materials can effectively reduce the temperature of solar panels. It was observed that after adding PCM materials, the power generation efficiency of PCM-PV/T modules was increased by 13.7% and the heat storage efficiency was increased by 39%.
Although PCM is highly suitable for use in PV/T modules, the overall heat transfer rate of the module is not ideal after adding PCM because the thermal conductivity of most PCMs is not high enough. Therefore, adding a nanofluid with a higher heat transfer rate on this basis can improve the system’s heat transfer rate and working efficiency.
Nanofluid is a new type of heat transfer medium proposed by Choi et al. [14] in 1995. With the deepening of solar energy research, researchers found that changing the working fluid in the system to nanofluid can further improve the efficiency of the solar energy system. Tyagi et al. [15] theoretically analyzed the feasibility of applying nanofluids to solar collectors in 2009. Nanofluids absorb more than nine times more heat than pure water, and the use of nanofluids can increase a system’s heat storage efficiency by 10%. In 2014, Sardarabadi et al. [16] tested SiO2 nanofluids as the working fluid of PV/T systems and found that the system using SiO2 nanofluids was significantly more efficient than water, and the overall efficiency of the system could be improved by 7.9% at most. Alsalame et al. [17] evaluated the efficiency of PV/T systems in 2021. The results showed that the thermal energy collected by the system was significantly improved after using CuO nanofluid, and the total efficiency can reach up to 51.22%, which is higher than that of the ordinary PV/T system. Some works with novel content about nano modeling have recently been published. Among these, the hybrid nanofluid property from a mass-based model has been studied by [18,19]. According to this procedure, the volume fraction of the first and second nanoparticles was written in terms of both nanoparticles and base fluid masses.
By reviewing the previous literature, it can be found that the research on PV/T systems often focused on the development and research of new materials, and there are few improvements to the design parameters of PV/T composite modules. In order to improve the overall comprehensive output efficiency, this study chooses to build on the parameter design of the solar PV/T energy system and explores the relationship between the parameters. Therefore, it is necessary to analyze with parameter optimization theories, such as the Taguchi and GRA methods, which are better references when designing PV/T composite modules.
The Taguchi method uses orthogonal tables to plan experiments, which not only reduces the number of experiments, but also the influence of uncontrollable factors. Although the advantages of the Taguchi method are prominent, it can only be performed on the optimization of a single-quality characteristic. Thus, this study intends to combine GRA with the Taguchi method to conduct a multi-quality analysis.
In 2011, Kuo et al. [20] conducted an optimization study on solar flat panel collectors in which six control factors were selected to form a mixed orthogonal table for experiments. After using the Taguchi method to experiment on the optimization of a single-quality characteristic, the multi-quality optimization parameters were obtained by GRA. In 2021, Kazemian et al. [21] used the Taguchi method to design experiments for the PV/T system and determined the multi-quality optimization parameters of the system through GRA. The experimental results showed that the system’s overall efficiency could be increased.
The objective of this research is to optimize the multi-quality design of the nanofluid-PCM-PV/T system to improve power generation and heat storage efficiencies.

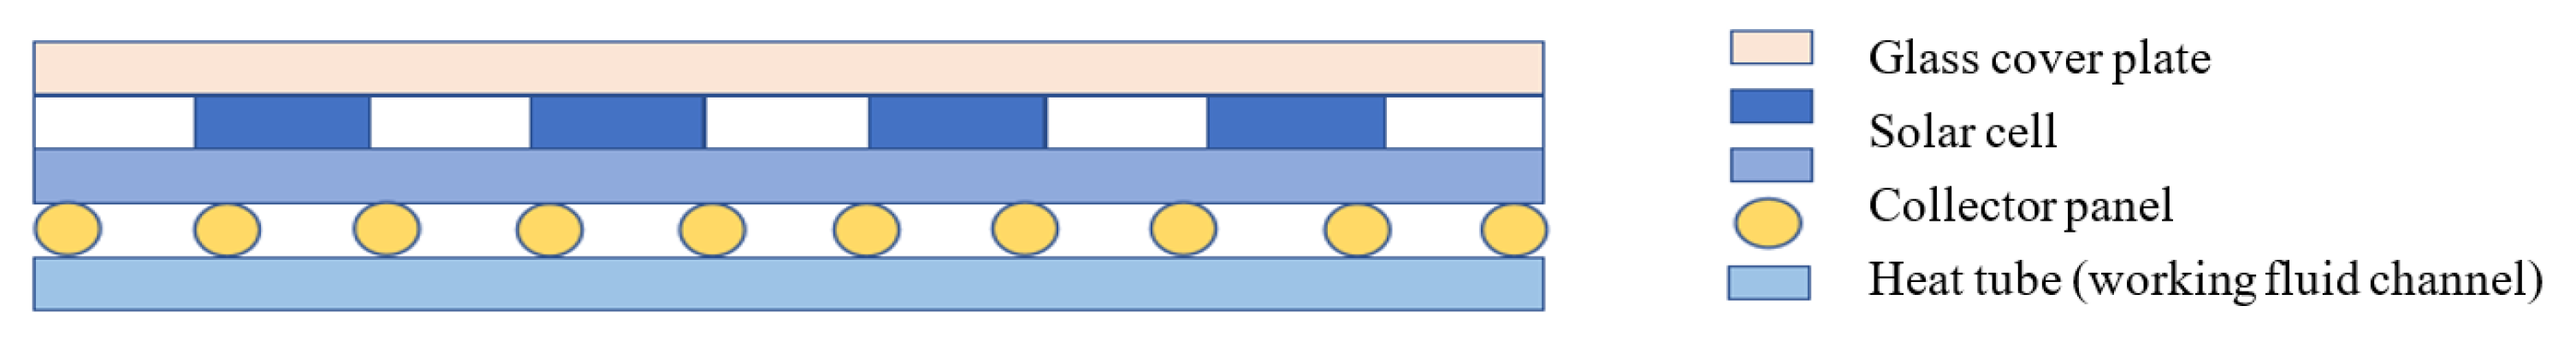
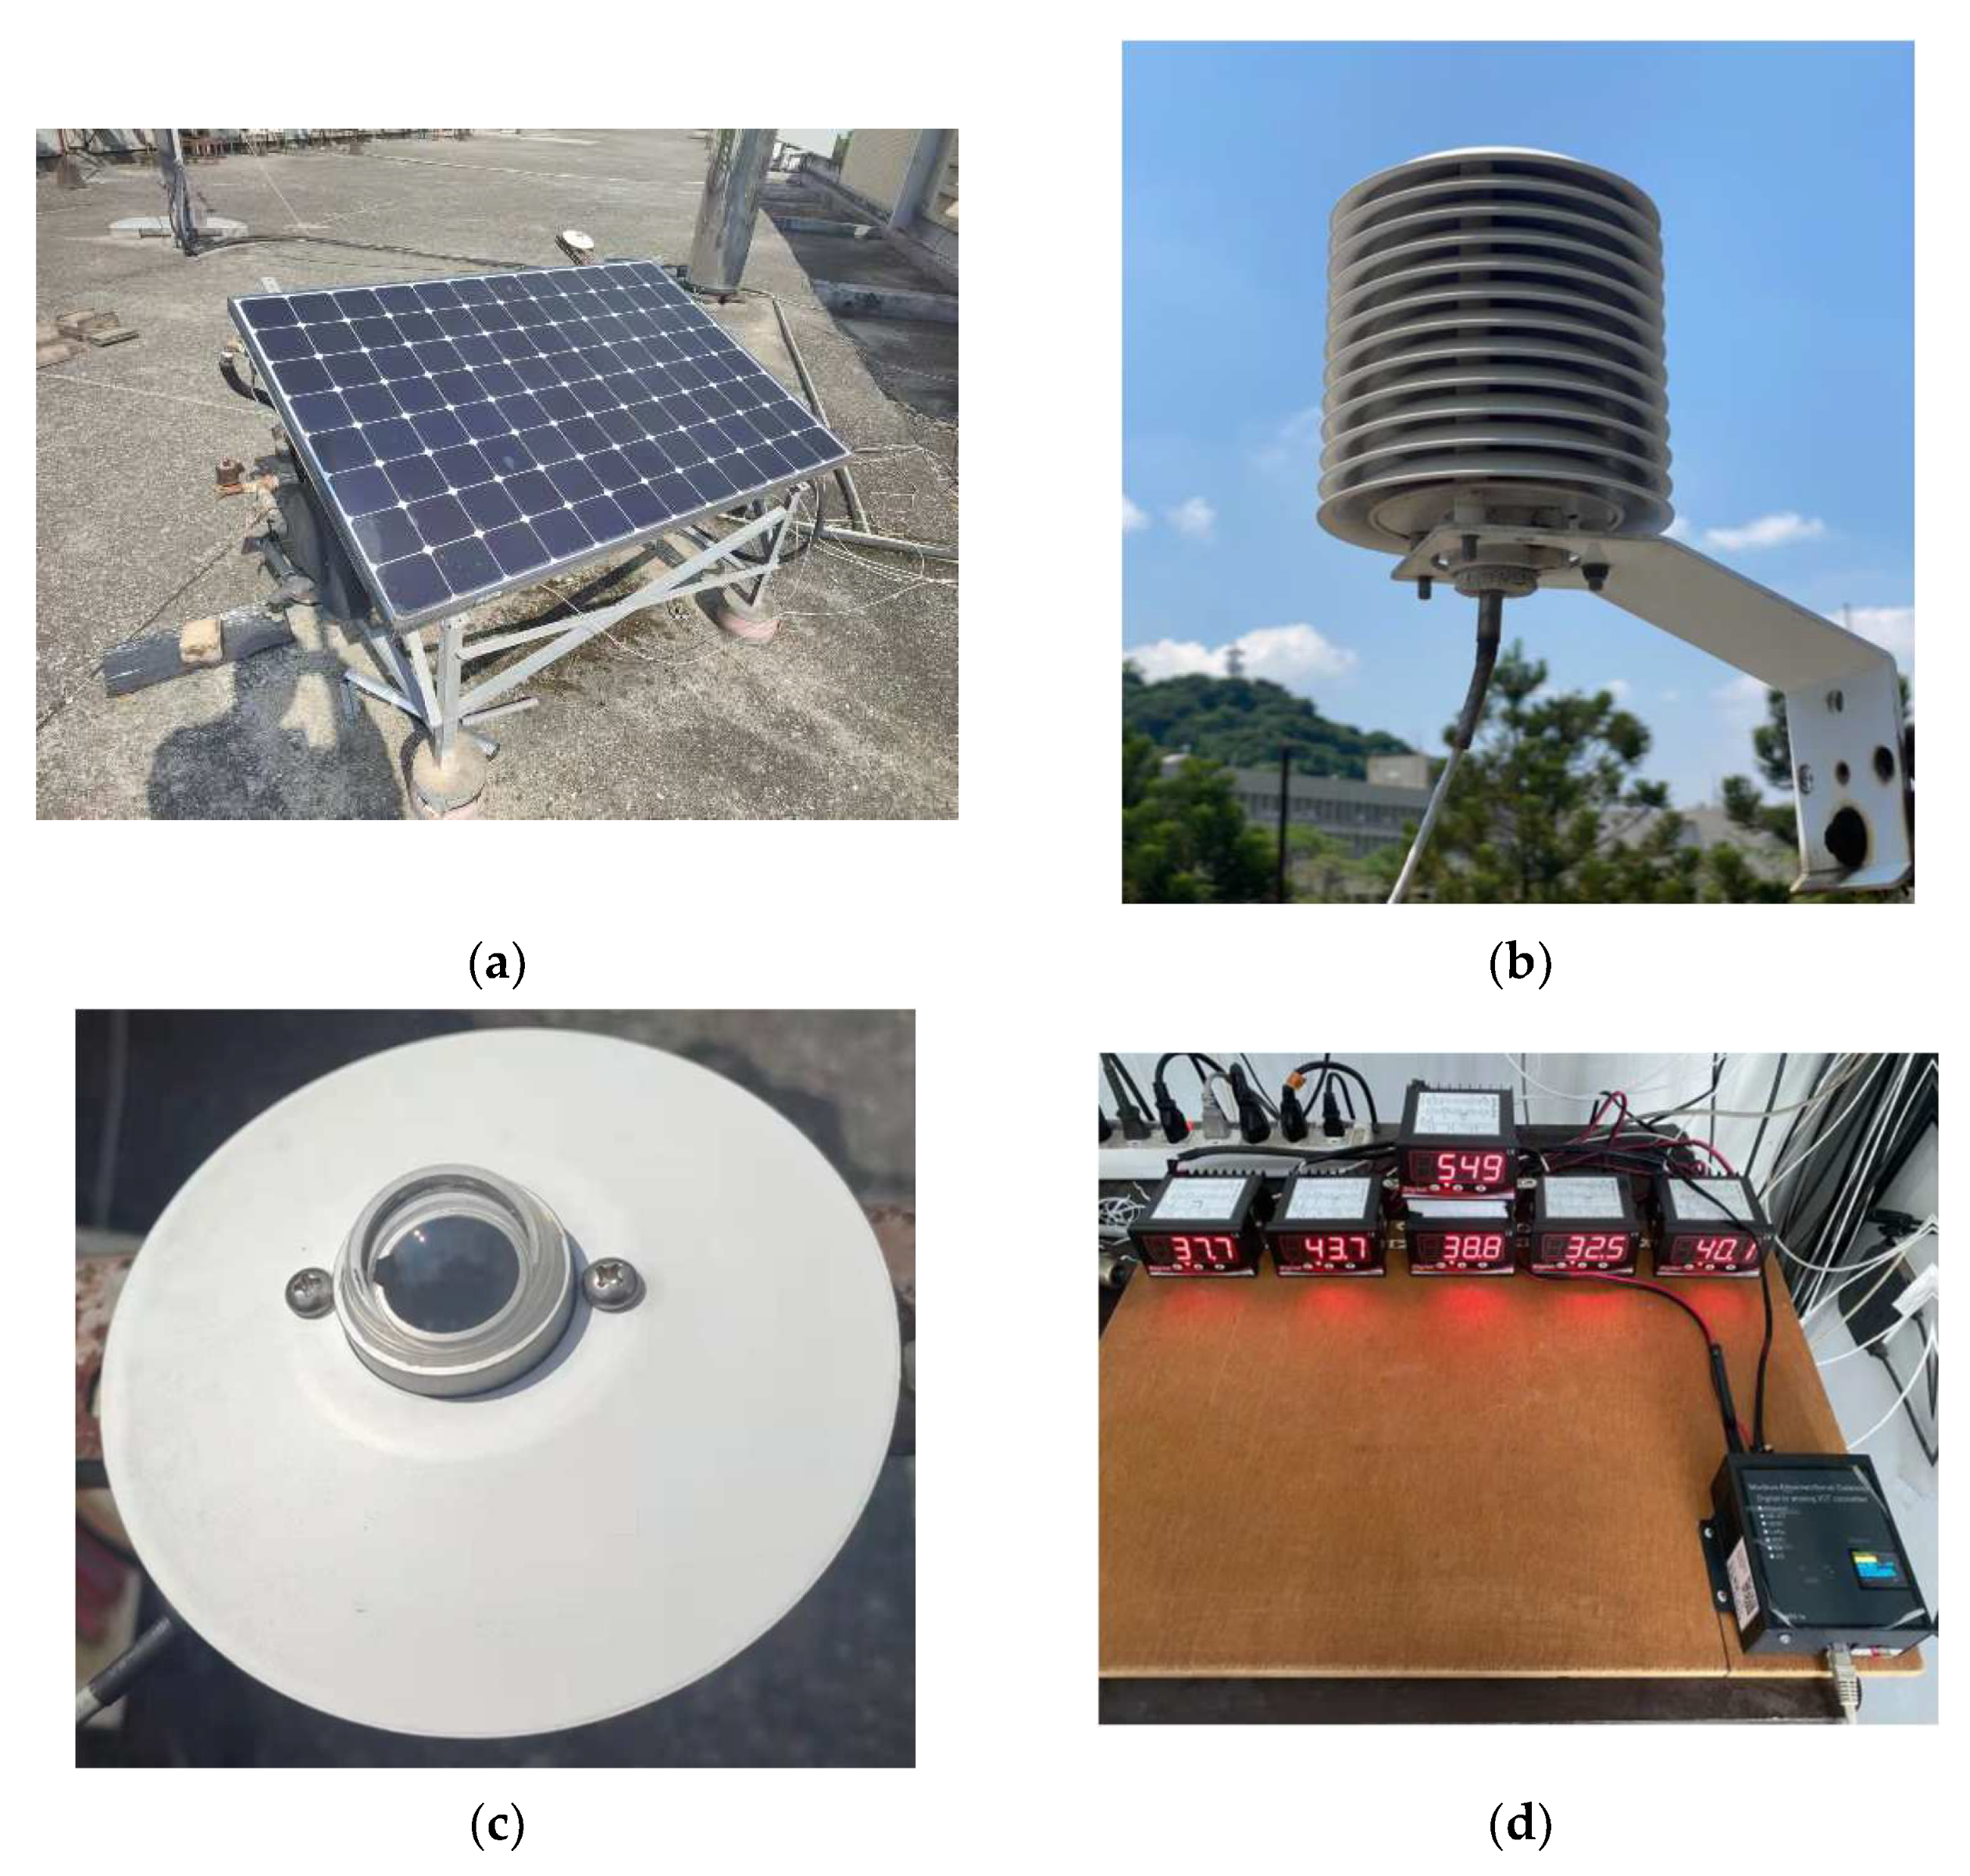
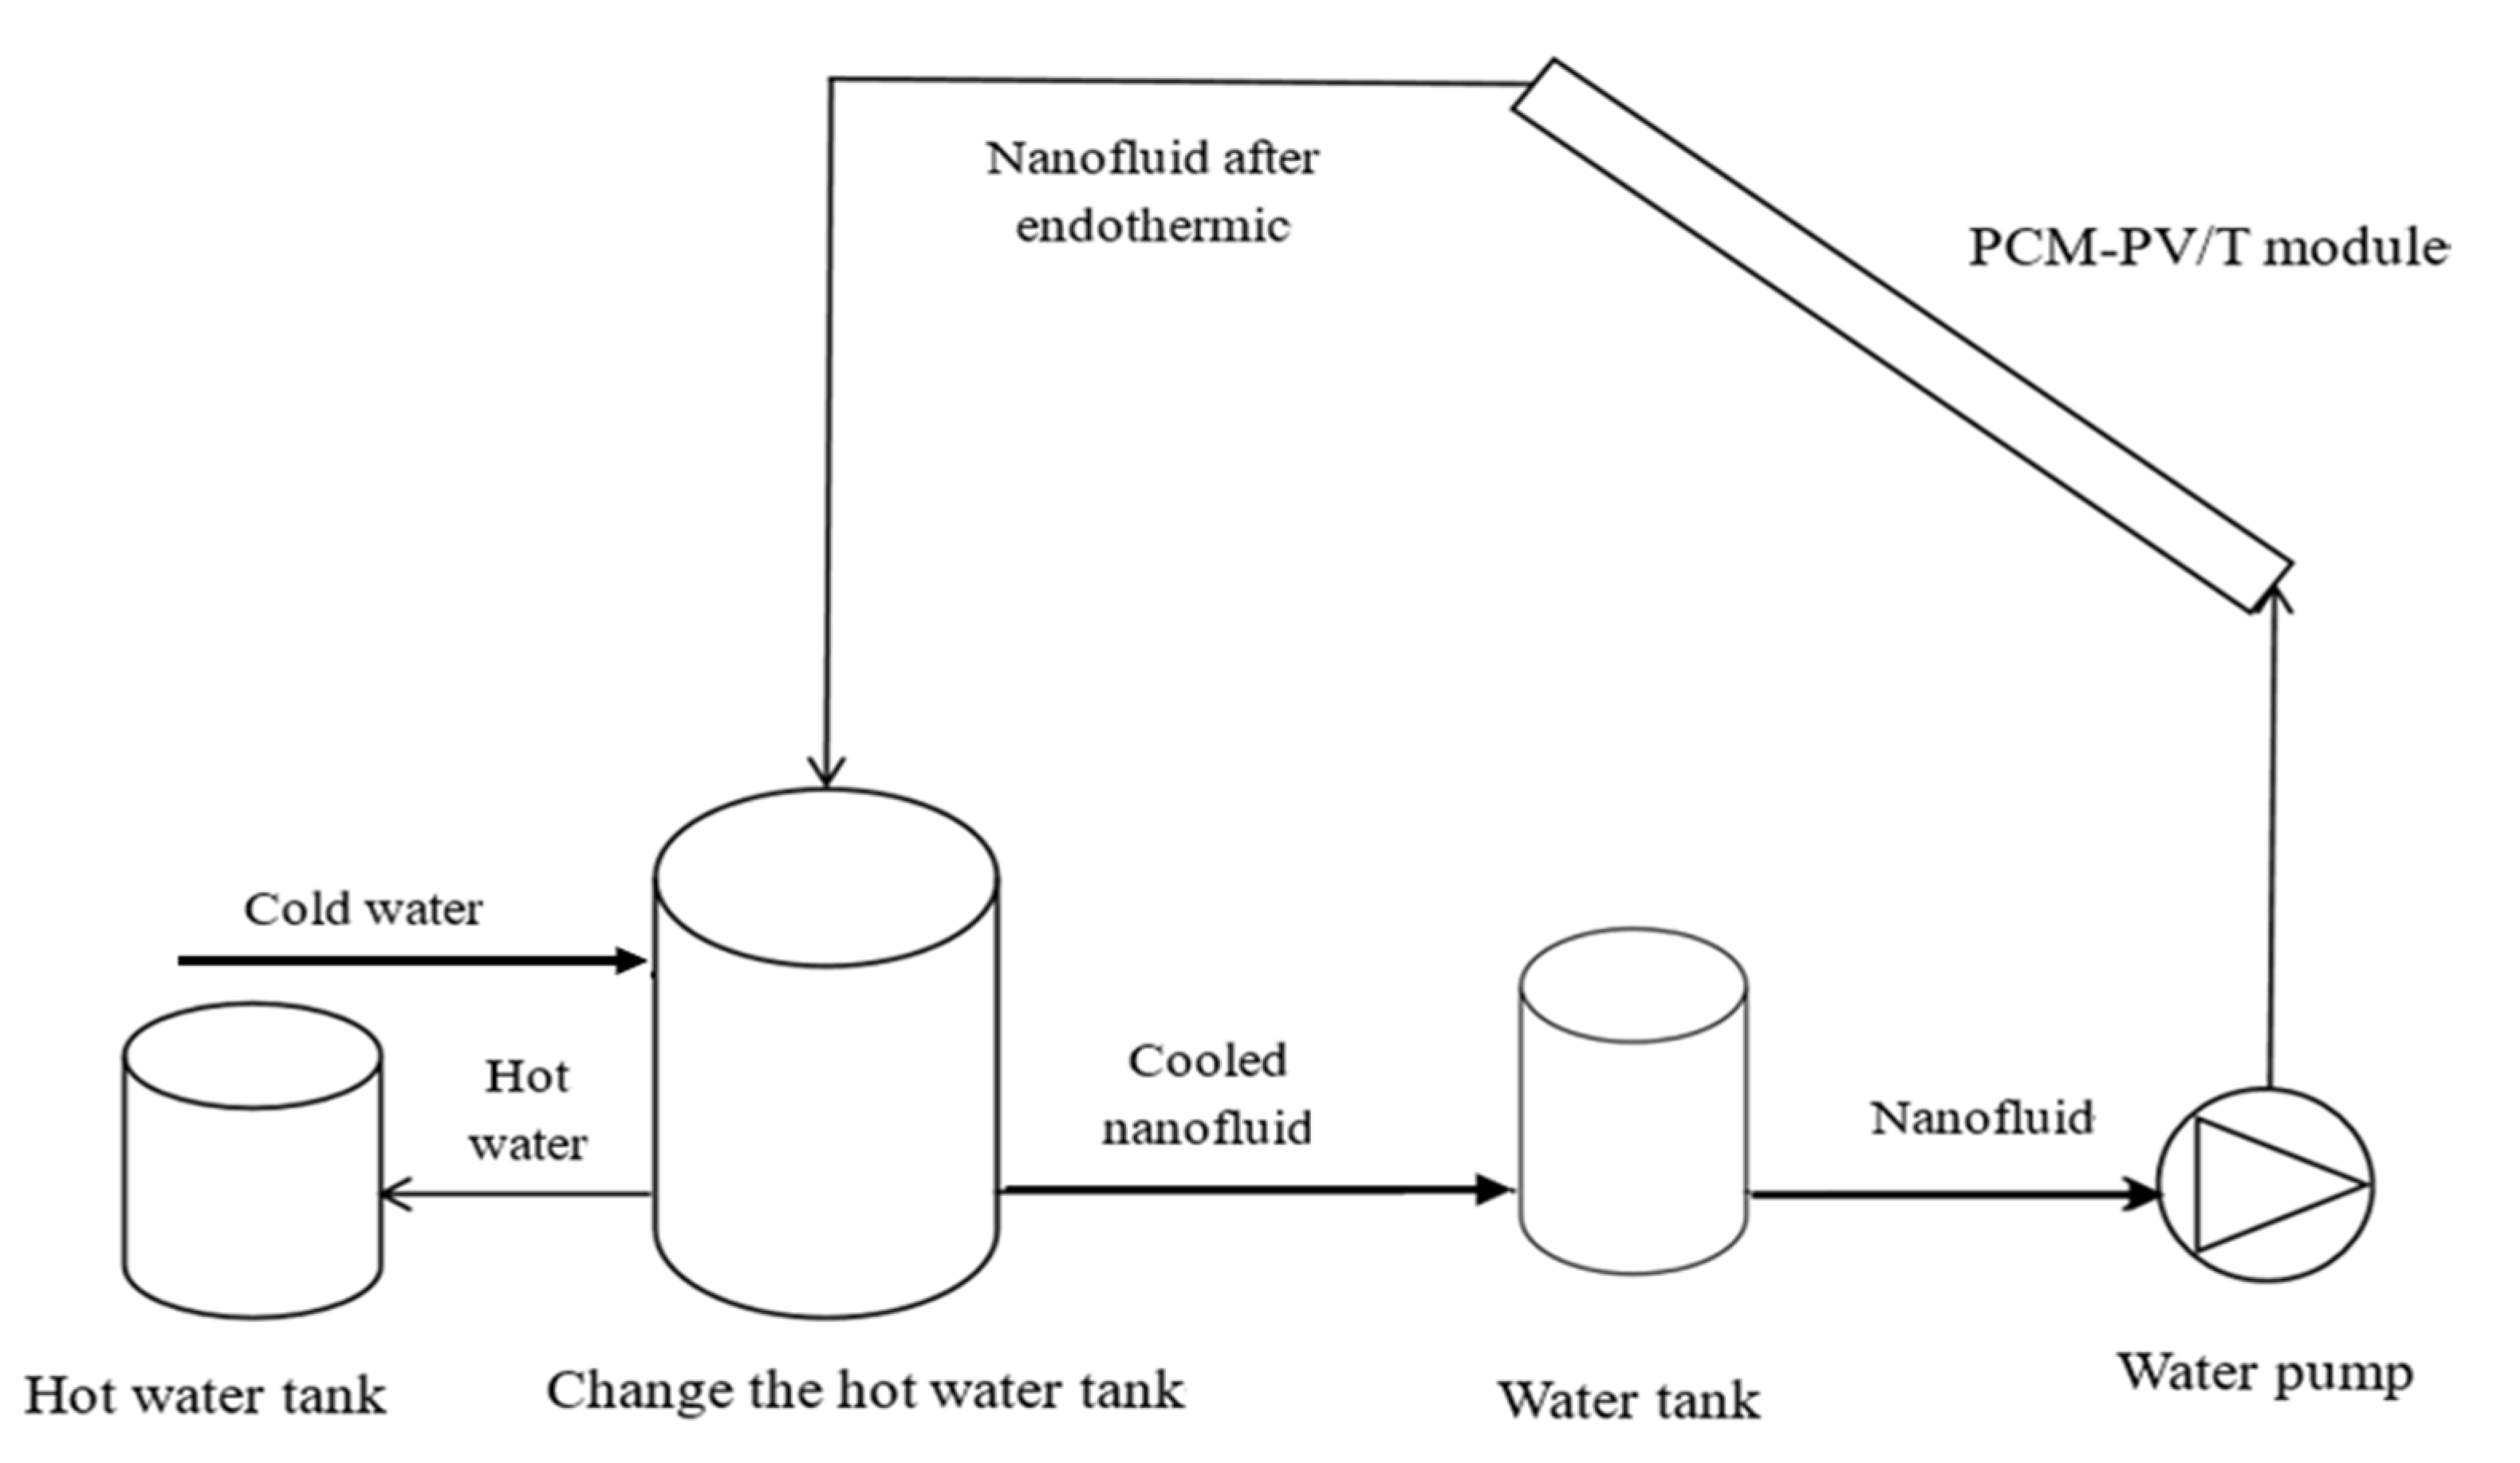
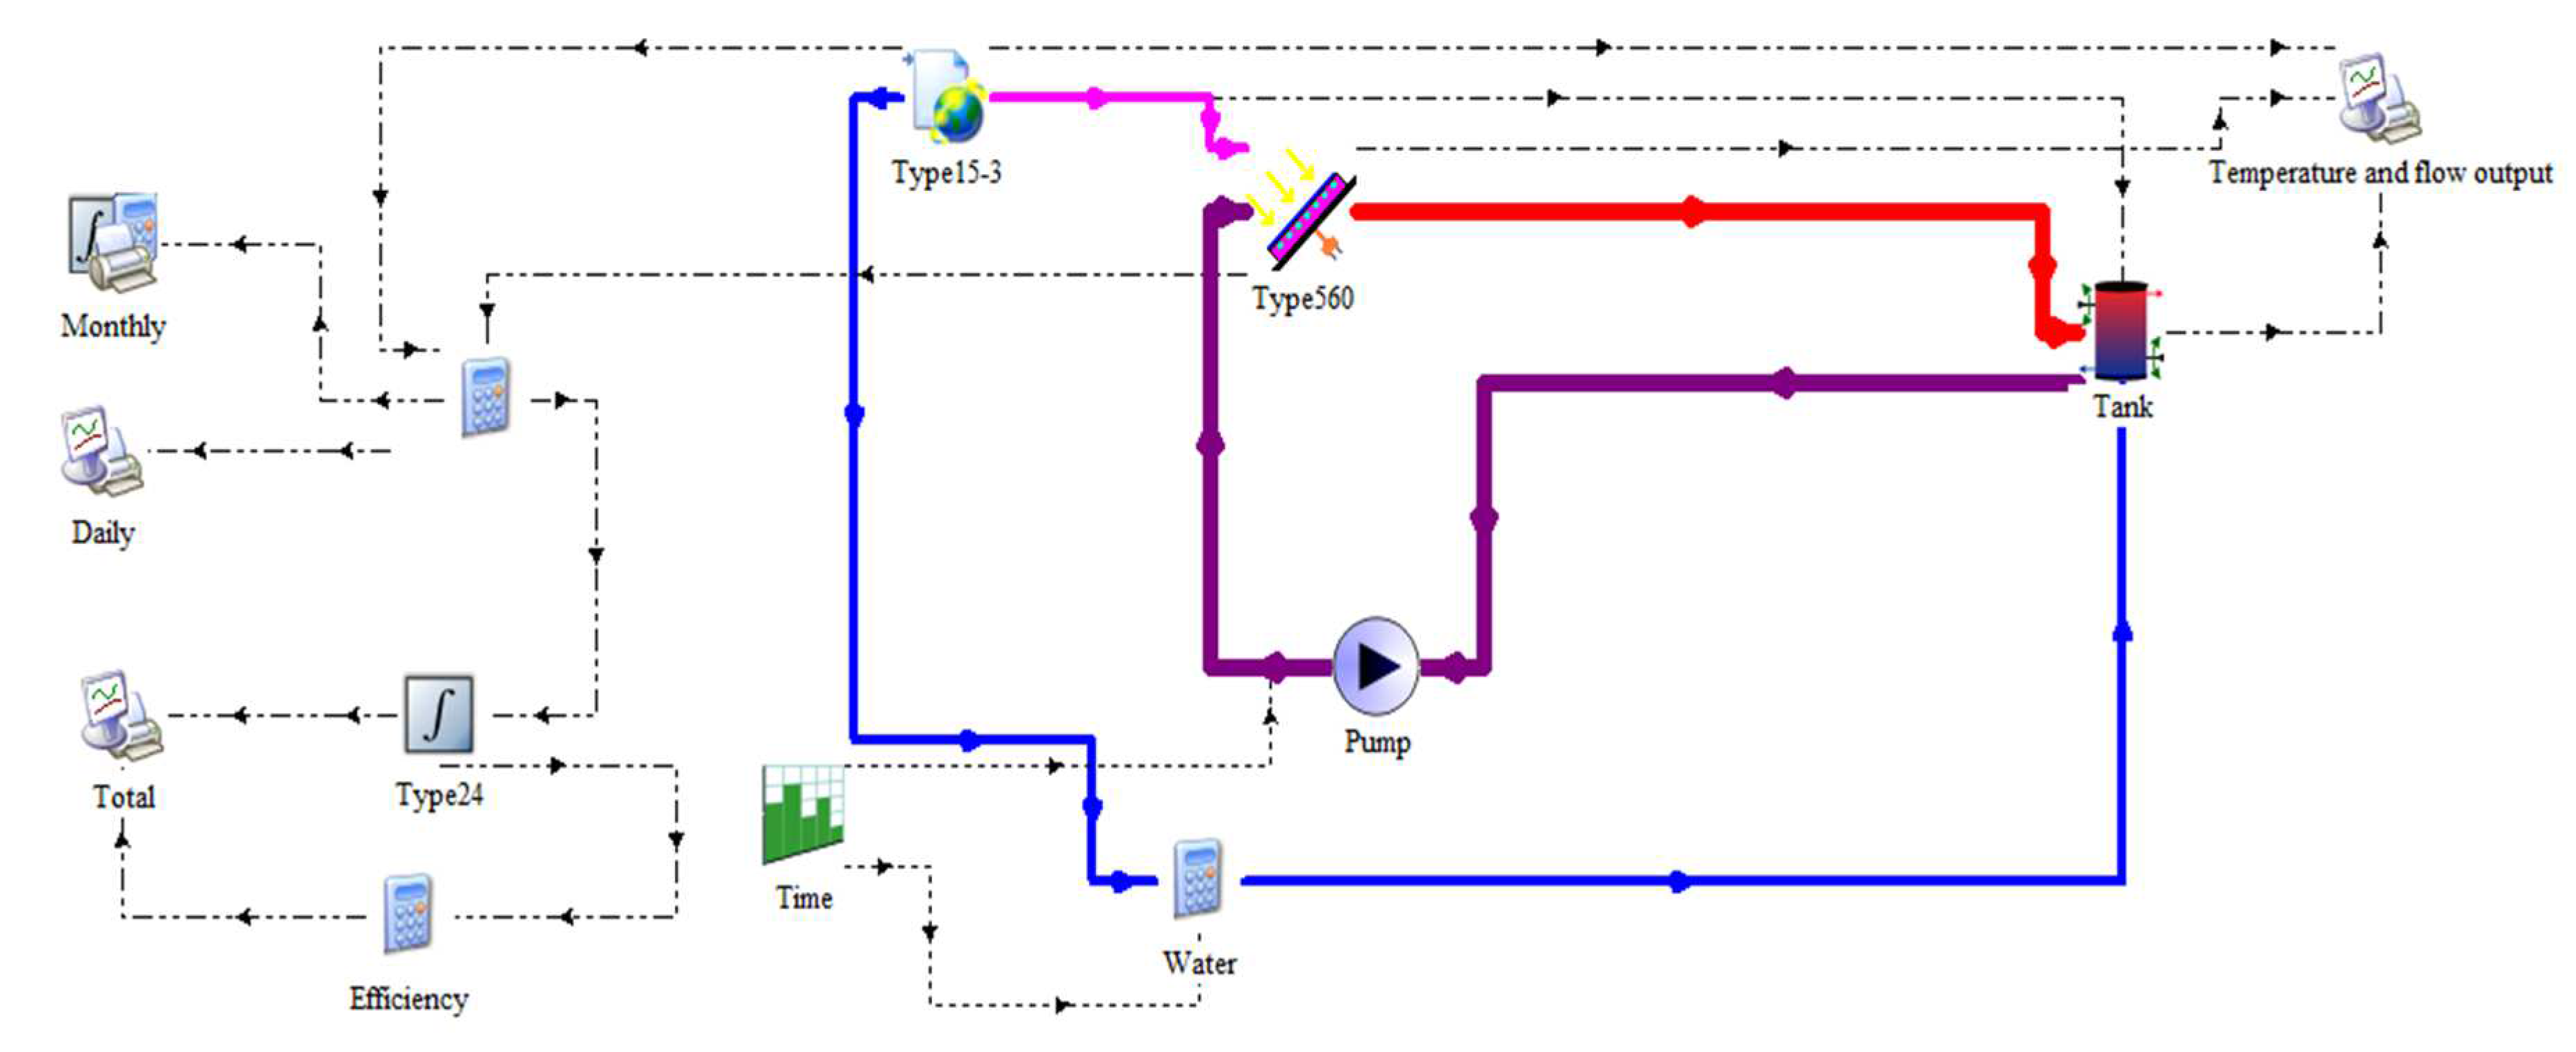
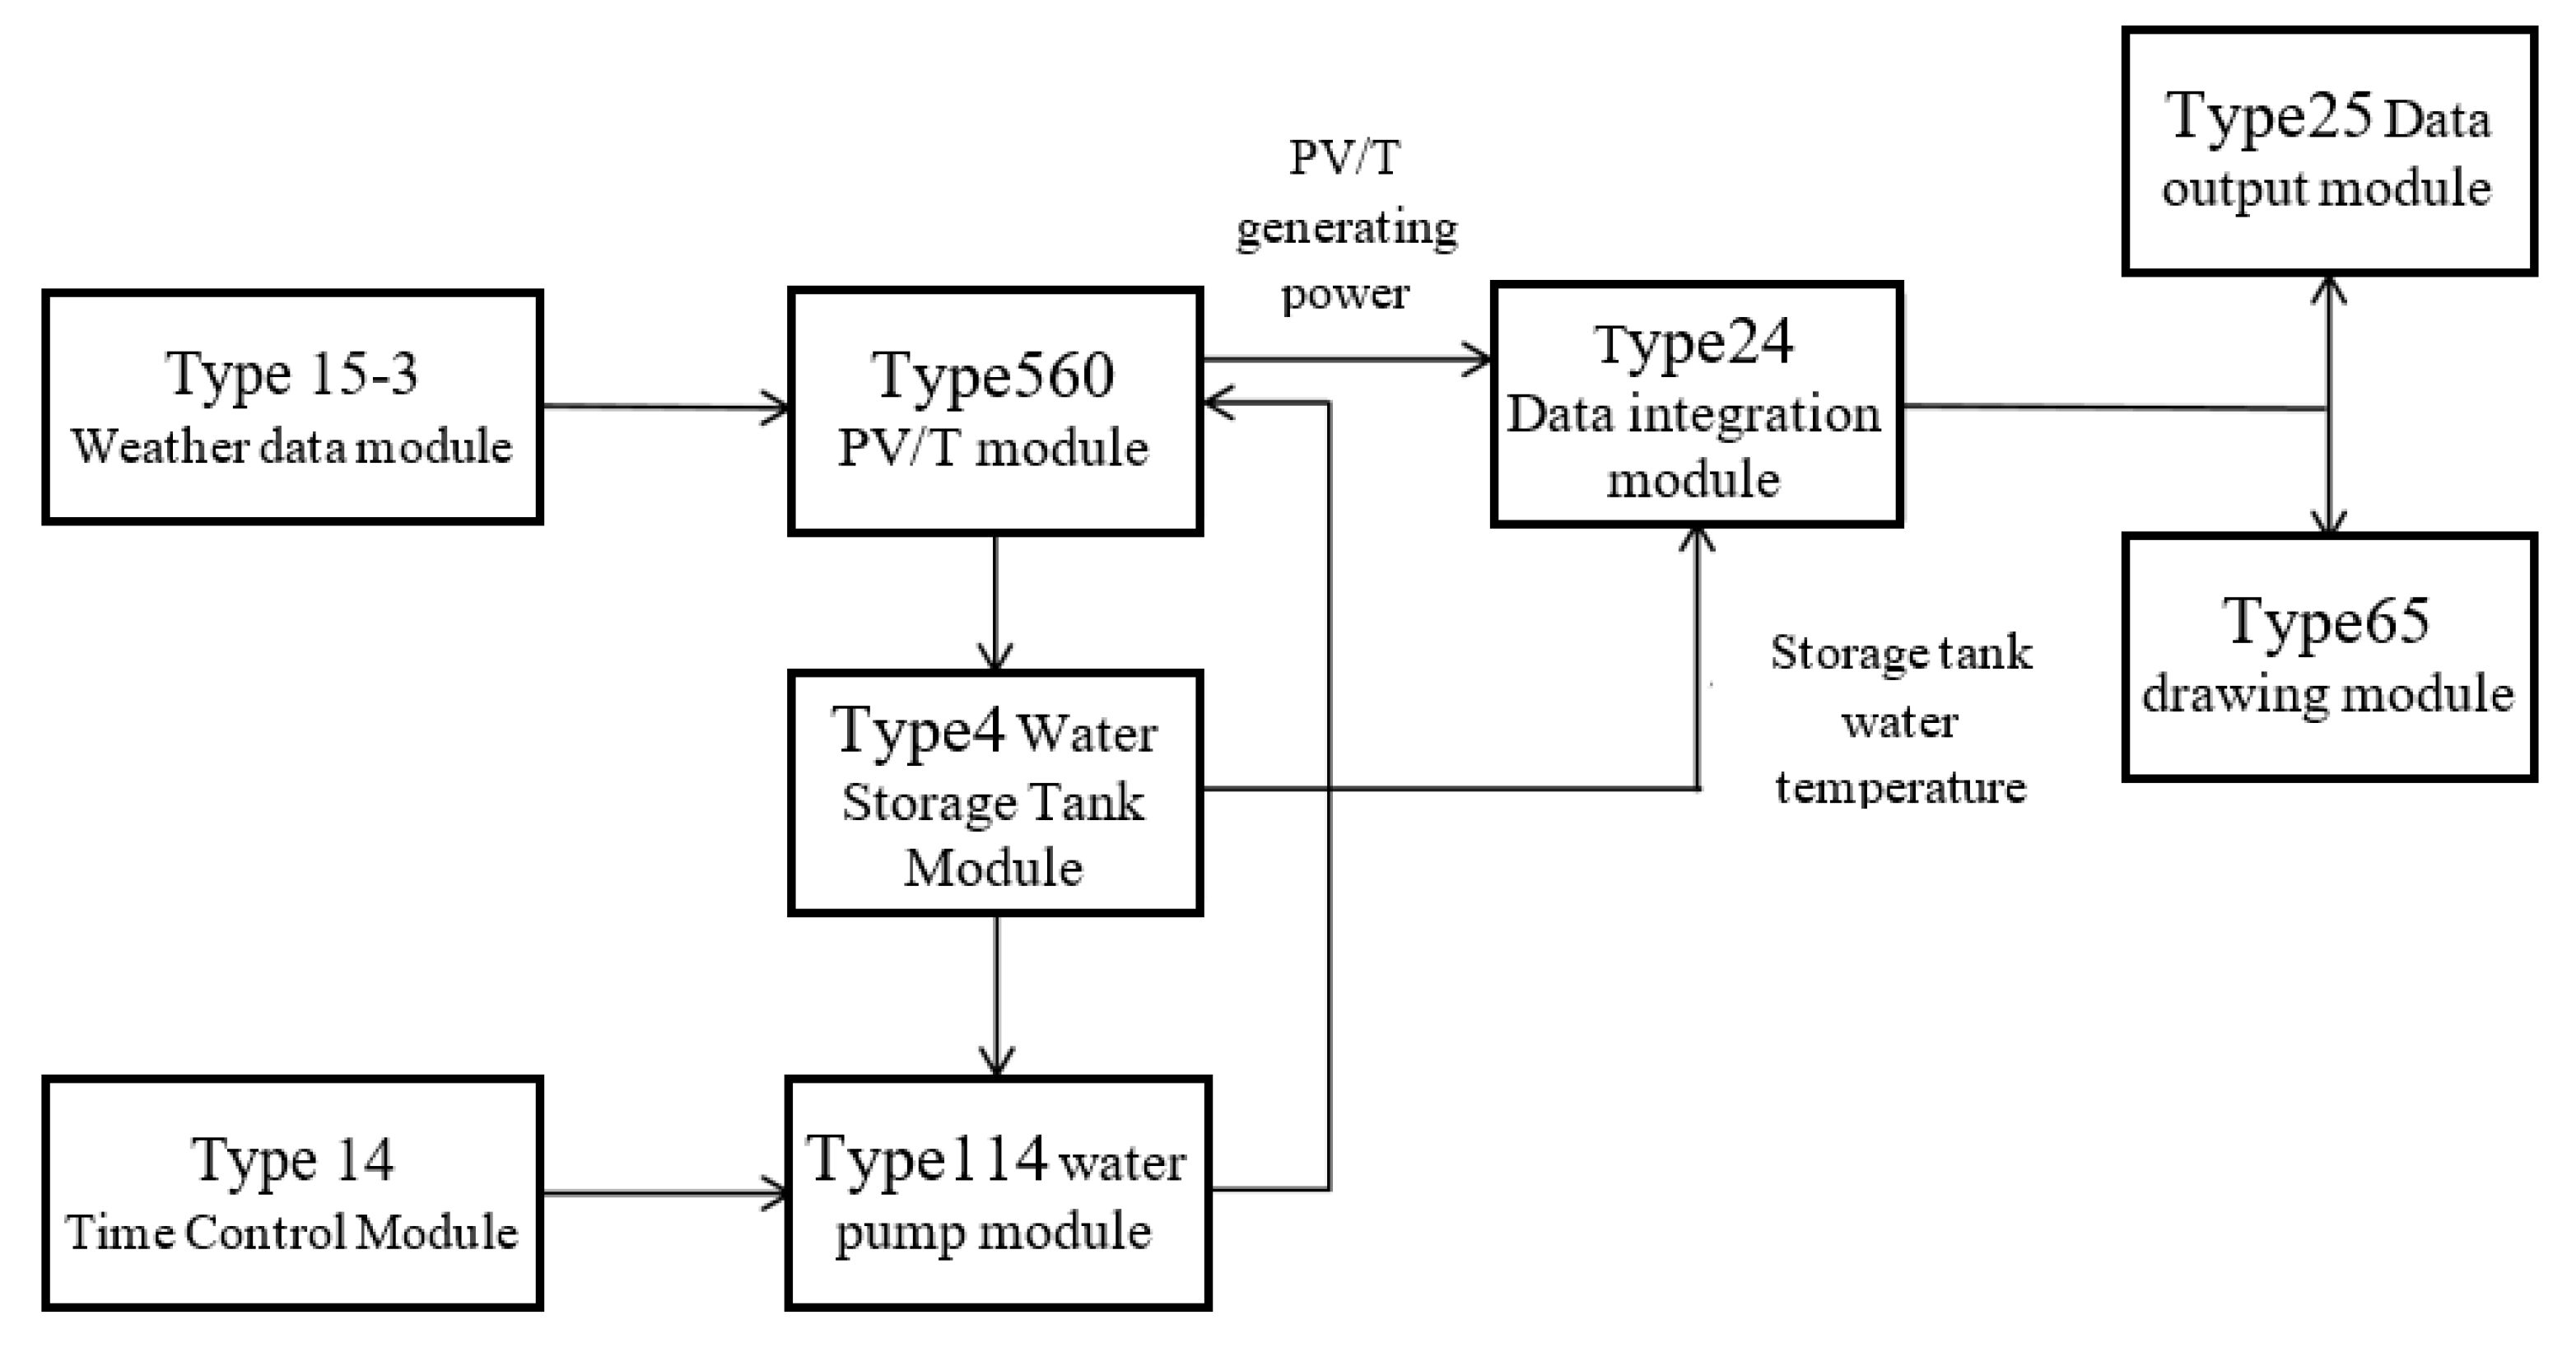
2. PV/T System Structure and PV/T Performance Testing Software

The PV/T module used in this research is shown in Figure 2. In this study, we considered standard photovoltaic solar panels readily available in the market. We specifically selected polysilicon solar panels as the research object. Such solar panels are widely available in the market. The detailed specification is listed in Table 1.
The working concept of the system after adding PCM and nanofluids is shown in Figure 3. The electronic load obtains the operating data of the PV/T module, including the voltage, current, power generated by the working of the module and the temperature of the water storage tank. The datalogger is used to record the data obtained during the experiment, including ambient temperature and sunlight intensity. After these data are collected, the PV/T module power generation efficiency and heat storage efficiency of the test are obtained through calculation.
In the actual test, this research also uses TRNSYS [22,23] to conduct modeling based on the physical module to analyze the working efficiency of the module. The block-based TRNSYS can divide a whole large system into several components, and each component can realize specific functions. Therefore, as long as specific modular components are added and conditions are input, this individual modular subsystem can be combined when modeling to simulate the specific system.
In this study, the TRNSYS system was applied to simulate the power generation and heat storage process of the nanofluid-PCM-PV/T composite module, and the composite module was designed to optimize the quality characteristics. In the experiment, the parameters of the module must be changed continuously to verify the influence of different parameter configurations on the module’s power generation efficiency and heat storage efficiency. If this modification is carried out with physical modules, it would require much effort, which is not conducive to the conduct of experiments. The biggest advantage of TRNSYS is that it can simulate the working conditions of the entire module in different environments by changing the different parameters of each component of the PV/T composite module, including the inclination angle of the solar panel, the material of the collector plate, and the working conditions of the entire module. The thermal conductivity and mass flow rate of the fluid are highly suitable for Taguchi experiments and helpful for the entire module in optimizing the design. The modeling and connection methods of this experiment are shown in Figure 4 and Figure 5.

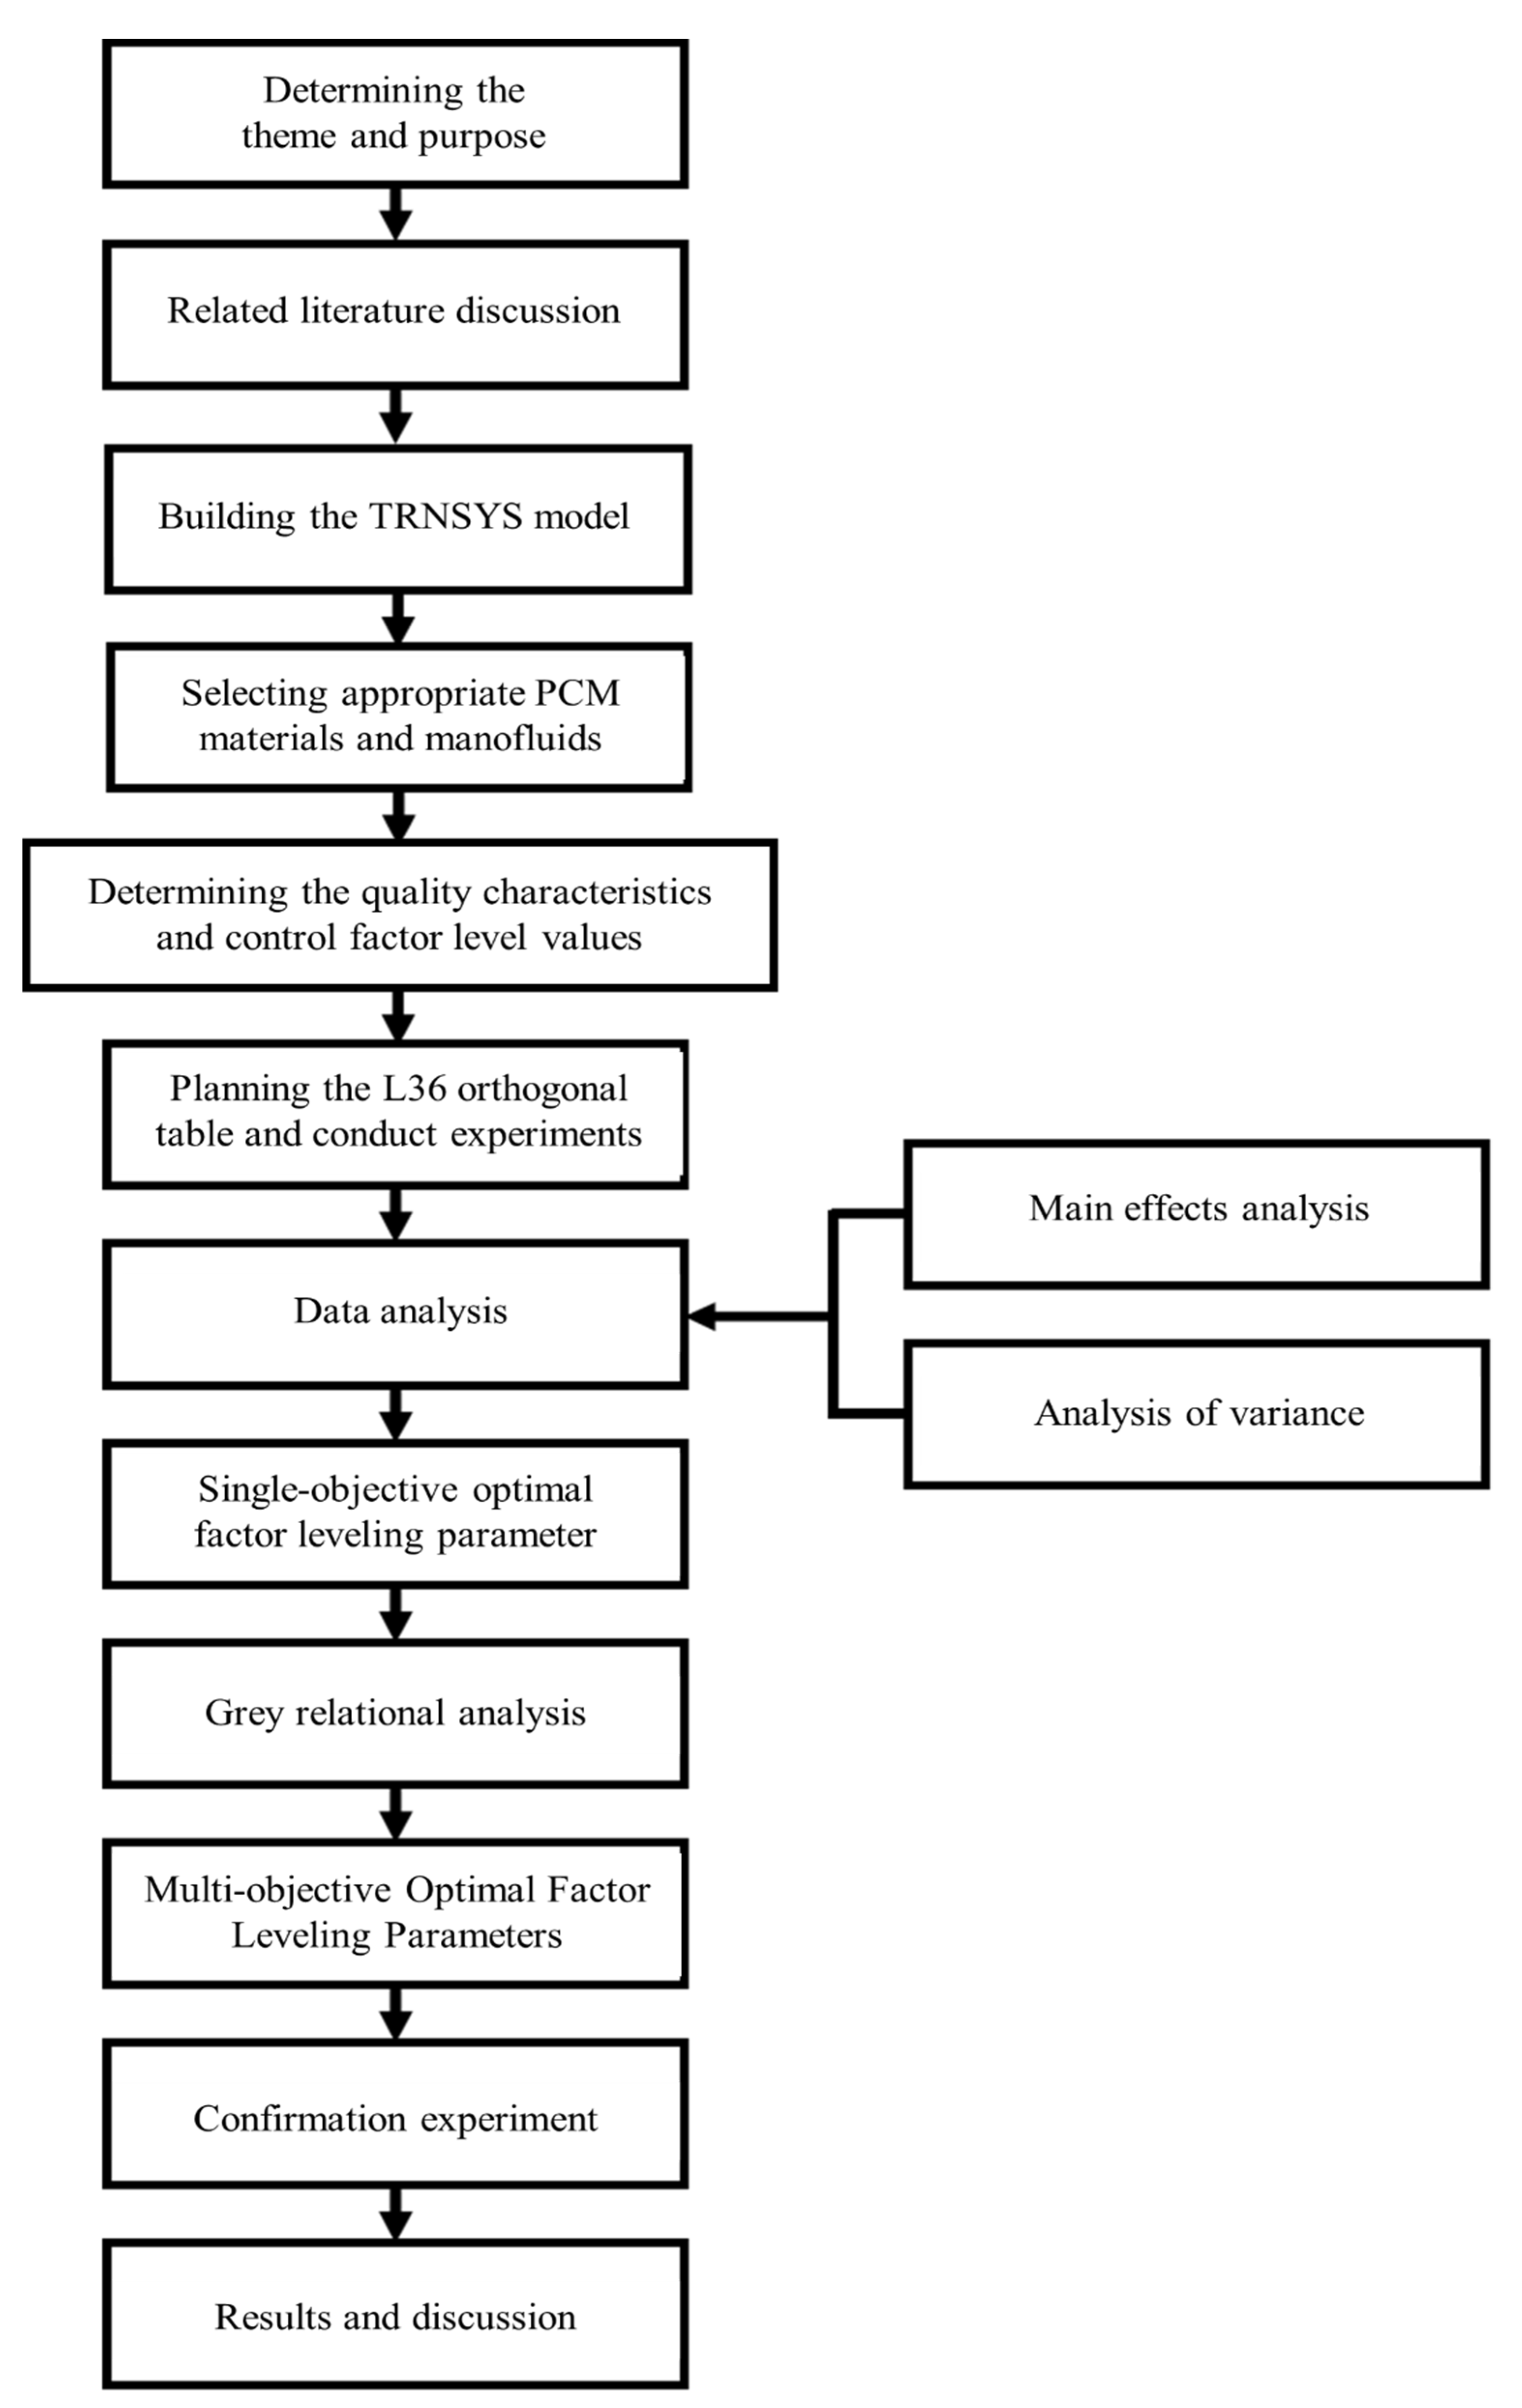
3. Research Methodology

In this study, the research flow chart is shown in Figure 6. Ten control parameters were selected. First, the orthogonal table of the Taguchi method was constructed for experiment planning. Then, TRNSYS was used to model and simulate the system, and the experiment was completed with the actual physical system. Afterwards, GRA was combined with the Taguchi method to solve multicriteria optimization problems in the nanofluid-PCM-PV/T process.

3.1. Taguchi Method

The Taguchi method [20,21] is used to design the parameters (control factor and its level value). Then, the MEA and ANOVA are employed to determine the degree of influence of product parameters on product quality characteristics.
The Signal-to-Noise Ratio (S/N ratio) is a metric used to assess the level of process and quality in manufacturing. Depending on the different forms of quality characteristics, the measurement methods for the S/N ratio can be categorized into four types: “larger-the-better”, “smaller-the-better”, “nominal-the-best”, and “theoretical nominal-the-best”.
Since this research aims to improve power generation and heat storage efficiencies, the “larger-the-better” is used for calculation when calculating the S/N ratio:
S / N LTB = 10 · log 10 MSD = 10 · log 10 1 n i = 1 n 1 y i 2
where MSD is the mean square deviation from the target value, y i is a quality measurement, and n is the total of the measurements.

3.2. MEA

The MEA describes the influence of a factor on the system effect at different levels. After calculating the S/N ratio of each group of experiments according to the experimental design requirements, it is necessary to calculate the average response value Fi of each factor at each level and then calculate the main effect change value ΔF of each factor at each level. Finally, these data must be turned into a main effect response table for the MEA.
Assuming that a factor has i level values in total, and each level value has m groups of S/N ratios, then the formula for the average response value Fi and ΔF of each level is:
F i = 1 m k = 1 m η i
where η i is the factor at this level S/N ratio and
Δ F = F i max -   F i min

3.3. ANOVA—That Is to Say, We Can Find the Degree of Impact on System Quality When the Level Value of the Control Factor Changes

ANOVA discusses the relationship between the experimental data and the target value. It can be found that when the level value of the control factor changes, the degree of impact on the system’s quality. Unlike the MEA, ANOVA pays more attention to exploring each control factor’s contribution to improving system quality and judges the importance of each factor by calculating the F distribution.
ANOVA includes degrees of freedom, the sum of squares, variance, F distribution value, and percent contribution.
  • Degrees of freedom ( DOF ): It is a measure of the amount of information obtained. Usually, the greater the degree of freedom, the more information can be obtained.
    (1).
    Total degrees of freedom ( DOF T ): It is the total number of experiments minus 1.
    DOF T = ( n × r )   -   1
    (2).
    Control factor degrees of freedom (DOF_factor): It is the number of levels of the factor minus 1.
    DOF factor = Level     1
    (3).
    Error degrees of freedom ( DOF e ): The size of the error degrees of freedom is the difference between the total degrees of freedom and the degrees of freedom of all control factors.
  • Total sum of squares ( SS T ):
    SS T = i = 1 n η i η i ¯ 2
    where   η i and η i ¯ are the S/N ratio and the average of the S/N ratio of each group of experiments, respectively.
  • Sum of squares of control factors ( SS f ): It is the variation of each control factor. Suppose a factor has k level values in total, and each level value has m groups of S/N ratios, the SSf is calculated as:
    SS f = m × i = 1 k η ki ¯ η i ¯ 2
    where   η ki ¯ is the average of the S/N ratio obtained from the experiment when the factor is at the level value k .
  • Error sum of squares ( SS e ): SS T minus SS f   of all factors.
  • Variance ( Var ): Because the size of the sum of squares is related to the experimental test value, the sum of squares is divided by its corresponding degree of freedom in order to eliminate the influence of the test value on the sum of squares. The result is called the mean square, which is the variance. It is calculated as
    Var f = SS f DOF f
    Var e = SS e DOF e
  • F-ratio: In the Taguchi experiment, the larger the F-ratio, the more important the factor’s influence on the system. It is considered that when the F-ratio is greater than 5, the factor has a significant impact on the system. On the contrary, when the F-ratio is less than 1, it is regarded that the control factor has a negligible impact on the system, which can be combined into an error term called the combined error.
    F = Var F Var e
  • Percent contribution ( p ): It is defined as the relative ability of a control factor to reduce the influence of variation and ensure that the control factors selected in the Taguchi design are all important factors.
    p = SS f SS T × 100 %

3.4. GRA

GRA [24,25,26] is a quantitative analysis that explores the similarity and dissimilarity among control factors [13]. It applies the grey relational grade (GRG) to find the correlation degree of factors.
The steps are as follows:
Step 1: Grey relational generation: pre-process the data series for GRA and generate grey relational data according to the quality characteristics. This study uses the larger-the-better characteristic for the grey relational generation.
X i k = X i k - min X i k max X i k - min X i k
Step 2: Calculate the absolute value of the difference sequence Δ 0 i k between the comparison sequence and the reference sequence. From the reference sequence, find the minimum value, Δ min , and maximum value, Δ max .
Step 3: Calculate the grey correlation coefficient of each analysis sequence.
γ 0 i k = Δ min + ξ Δ max Δ 0 i k + ξ Δ max
where ξ   is the identification coefficient, generally taking 0.5 [25].
Step 4: Calculate the GRG and arrange it from high to low as a criterion for evaluating the importance.
γ = 1 n k = 1 n γ 0 i k , i = 1 ,   2 , ,   m

4. Results and Discussion

In this study, the power generation efficiency and storage thermal efficiency were selected as the quality characteristics.
(1)
Power generation efficiency ( η e ):
η e = P GA
where P is the ratio of the sum of the output electric power, G is the total incident sunlight, and A is the solar PV module area.
(2)
Thermal storage efficiency ( η th ): the ratio of the thermal energy ( Q ) stored in the water storage tank during the test period to the product of GA
η th = Q GA = V ρ C p T f   -   T i GA
where T f and T i   are the final and the initial temperature of the water tank, respectively, C p is the specific heat capacity of water (4.18 kJ/kg·°C), V is the volume of the water tank, and ρ   is the density of the working fluid.
In this study, the control factors and their level values for the nanofluid-PCM-PV/T module are shown in Table 2. It includes the PCM material, working fluid type, working fluid mass flow rate, module tilt angle, number of collector tubes, collector tube diameter, azimuth angle, the volume of the storage tank (V) and the heat collection of the PV/T module plate area (A) ratio, V/A ratio, collector plate thickness, and collector plate material. There are 10 control factors; the PCM material has two level values, and the other nine control factors have three level values.
The reasons for selecting these parameters as control factors are as follows:
(1)
PCM material: The control factor has two levels, namely without PCM material and with paraffin. The purpose of categorizing the control factor is to explore whether the PCM materials can improve the power generation efficiency and heat storage efficiency of PV/T composite modules.
(2)
Types of working fluids: This study explores whether nanofluids affect the efficiency of PV/T systems. Therefore, in addition to water commonly used in traditional PV/T systems, two other nanofluids must be selected as other levels of the control factor to conduct experiments.
Our choice has been inspired by similar studies where researchers like Sohani et al. [27] and Faizal et al. [28] have discussed the application of nanoparticles in PV/T systems. From the work of Sohani et al. [29], Al2O3 stands out as a nano-material with remarkable attributes in terms of reliability, energy efficiency, economic viability, and environmental impact, boasting a relatively rapid initial capital return. On the other hand, the study by Faizal et al. [28] demonstrated that incorporating CuO, SiO2, TiO2, and Al2O3 nanofluids can lead to cost savings, efficiency enhancements, and reduced radiator dimensions. The application of CuO, in particular, has the potential to minimize solar collector surface area and thereby achieve the highest thermal efficiency. Nanofluid provides better hybrid PV/T performances relative to pure water. Hissouf et al. [30] presented the use of Cu-water and Al2O3-water as working fluids to reduce a cell’s temperature by 3.6°, referred to as pure water at 0.012 kg/s mass flow rate.
After considering the common utilization of metal oxide nanoparticles in PV/T modules, we discerned that CuO and Al2O3 exhibit superior thermal performance, offering higher heat transfer rates and better thermal properties coupled with elevated stability. These advantages prompted our selection of CuO and Al2O3 as our experimental materials. The fundamental physical properties of CuO and Al2O3 nanoparticles are presented in Table 3.
In this experiment, CuO and Al2O3 nanofluids were selected. The density and specific heat capacity used in this experiment are shown in Table 4.
(3)
Mass flow rate: Wu et al. [29] and Moradi et al. [31] found that mass flow rate affects thermal and electrical efficiency. Tiwari et al. [32] indicated that a high-mass flow rate can effectively increase the heat exchange rate. However, if the mass flow rate is too high, the cooling fluid will leave the collector tube before the heat exchange is completed, consequently reducing the PV/T module’s storage thermal efficiency. It was found that the optimum range mass flow rate is 0.05 kg/s m2~0.08 kg/s m2. Considering the efficiency of the heat exchange process and the heat loss in the fluid transport process, this study selected 0.05 kg/s·m2 as the intermediate value. After adding or reducing 0.025 kg/s·m2 on this basis, the parameter values of this control factor are 0.025 kg/s·m2, 0.05 kg/s·m2, and 0.075 kg/s·m2, respectively.
(4)
Module tilt angle: Chang [33] analyzed the optimal tilt angle of solar modules in different regions of Taiwan and proposed that the optimal installation tilt angle range of solar modules in Taiwan is 20~25°, while the best tilt angle in Taipei area is 23.25°. Therefore, this study chose to increase and decrease 3° on this basis and set the level values of the module tilt angle as 20.25°, 23.25°, and 26.25°.
(5)
Number of collector tubes: Considering the load, efficiency, heat dissipation, and operating cost of the experimental module, it was found that the PV/T module used in this study allows the maximum number of additional collector tubes to be 12. The original number of collector tubes in the group is 10; hence, 10, 11, and 12 were selected as the standard values of the control factor.
(6)
The diameter of the collector tube: When choosing the size of the collector tube, the commercialized size should be selected first because the collector tube of uncommon size often needs to be specially customized, which will increase the cost. Therefore, this study chose 12 mm, 16 mm, and 20 mm as the level values in the experiment.
(7)
Azimuth: It is necessary to select a suitable azimuth for the composite module to obtain the most incident sunlight. According to the Taiwan sunshine azimuth provided by the Central Meteorological Bureau of the Ministry of Transportation and Communications, the level values of this control factor are southeast, due south, and southwest, respectively.
(8)
V/A ratio: Appropriate V/A ratio can effectively increase a water tank’s temperature. The area of the PV/T module is 1.63 m2. The common 200-L water storage tank is selected as the middle value, while the other two levels are based on 200 L, with an increase or decrease of 50 L, corresponding to the V/A ratios of 93, 123, and 153, respectively.
(9)
Thickness of collector plate: Maleki et al. [34] found that the thickness of the collector plate can affect the efficiency of the system; when the thickness exceeds 1 mm, the efficiency of the system will decrease significantly. Therefore, the optimal thickness of the collector plate for the system is between 0.5 mm and 1 mm. In this study, 0.65 mm, 0.85 mm, and 1.05 mm were selected as the experimental level.
(10)
Collector plate material: Common solar collector plate materials include copper, aluminum, and alloys. Considering the cost and thermal efficiency, copper, aluminum, and stainless steel were selected as the control factors. Among them, aluminum has the lowest cost and the second highest thermal conductivity (240 W/m·K), which is the most common heat collector plate material. On the other hand, copper has the highest thermal conductivity (400 W/m·K), but the cost is also relatively high. The cost of stainless steel is between those of copper and aluminum. Although it has relatively low thermal conductivity (only 60 W/m·K), it is durable and has the longest service life among the three.
For single-quality optimization, the experiments used the Taguchi orthogonal table L36 (21 × 39) in the planning. The S/N ratio is calculated from the experimental values. Employing the MEA and ANOVA, the single-quality optimal parameter combination of PV/T system power generation efficiency and heat storage efficiency can be determined. The parameter combination of multi-quality optimal design can be obtained through the GRA method. Finally, confirmation experiments are required to verify multiple quality results and accuracy.

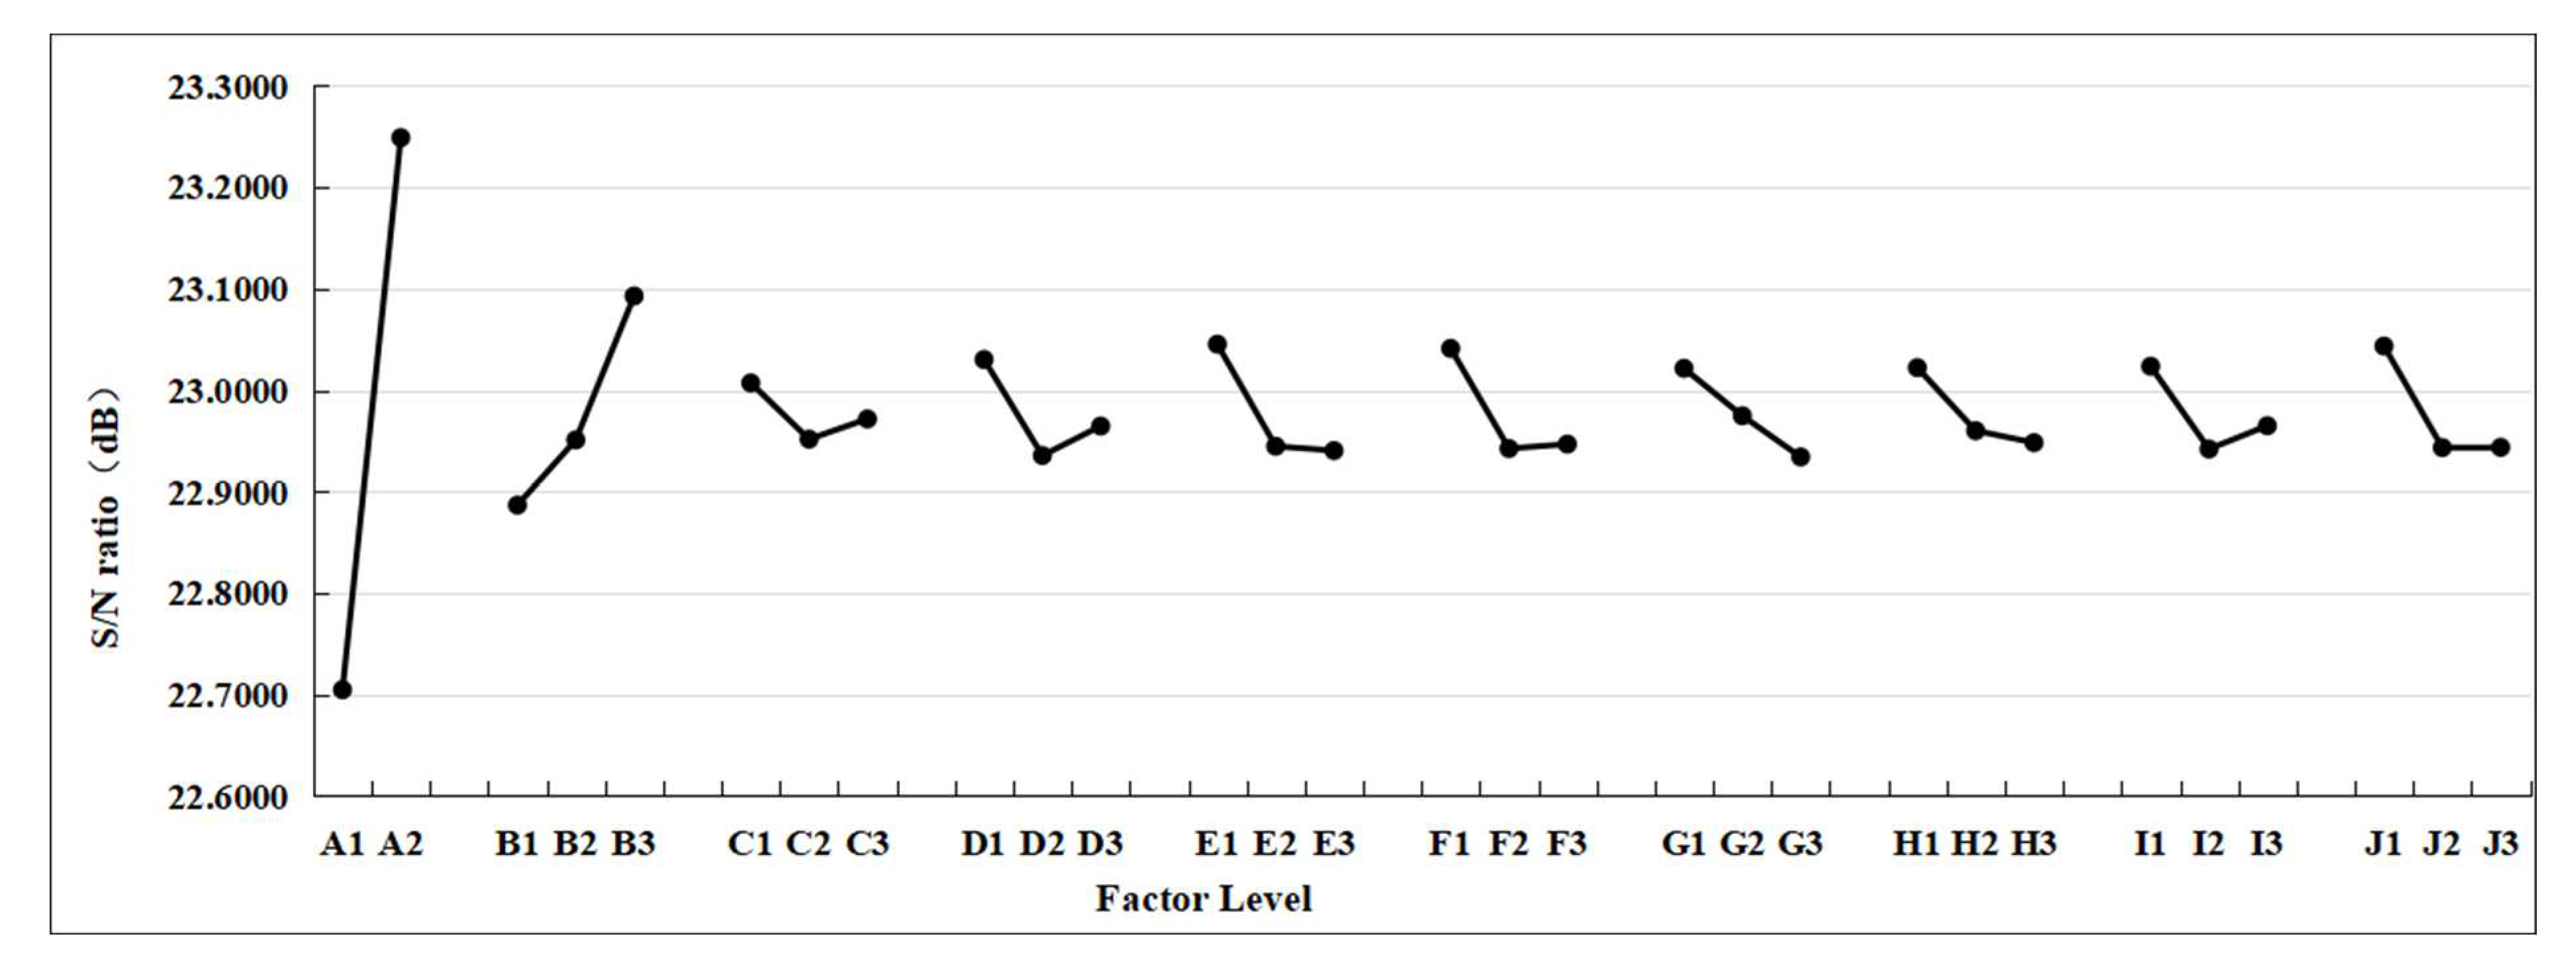
4.1. Power Generation Efficiency Optimization Analysis

The experimental results of the power generation efficiency of the nanofluid-PCM-PV/T module are shown in Table 5. The corresponding main effect response table and graph for power generation efficiency are shown in Table 6 and Figure 7, respectively.
From Figure 7, the results show that the optimum factor levels for the power generation efficiency are A2, B3, C3, D3, E1, F1, G2, H2, I3, and J1; that is, PCM materials are used, and the working fluid is CuO nanofluid. The mass flow rate of the working fluid is 0.075 kg/s·m2, the tilt angle of the module is 26.25°, the number of heat collector tubes is 10, the diameter of the collector tube is 12 mm, the azimuth angle is the south direction, the V/A ratio is 122, the thickness of the hot plate is 1.05 mm, and the material of the heat collecting plate is aluminum. Table 3 also shows that the main effect differences of the ten control factors are ranked as A, B, C, G, D, I, H, E, J, and F, which means that the control factor with the greatest impact on the power generation efficiency is whether using PCM materials. The second is the type of working fluid, followed by working fluid mass flow rate, azimuth angle, module tilt angle, collector plate thickness, V/A ratio, number of collector tubes, collector plate material, and collector tube diameter.
From the variance analysis in Table 7, it can be seen that the most significant control factor affecting power generation efficiency is the PCM material, and the second is the working fluid type. The contribution rankings of the remaining factors are working fluid mass flow rate, azimuth angle, module tilt angle, heat collector plate thickness, V/A ratio, number of collector tubes, collector plate material, and collector tube diameter. The F ratio of the number of collector tubes, the diameter of the collector tubes, and the material of the collector plate is less than 1. Hence, these three control factors were combined into the combined error.
In order to confirm the accuracy of the experimental results, it is necessary to carry out a confirmation experiment on the optimal configuration. The steps are as follows:
Step 1: Calculate the total average value of the S/N ratio of 36 groups of experiments.
Step 2: Calculate the S/N ratio of the best parameter combination.
Step 3: Calculate the confidence interval (CI) of the power generation efficiency.
CI S / N = F α ; 1 , v 2 × Var e × 1 neff + 1 r = 4.3 × 0.0013437 × 1 36 1 + 13 + 1 5 = 0.05833
Step 4: Calculate the 95% confidence interval value.
After calculation, the CI of the optimization experiment of nanofluid-PCM-PV/T power generation efficiency is 23.4326~23.5492 db. If it is confirmed that the S/N ratio obtained in the experiment falls within this interval, it proves that this experiment is highly accurate and has good performance and reproducibility.
After five confirmation experiments, as shown in Table 8, the S/N ratio of the confirmation experiment was calculated as 23.495 db, falling within the 95% confidence interval, indicating that the results of this experiment are reliable and have good reproducibility.

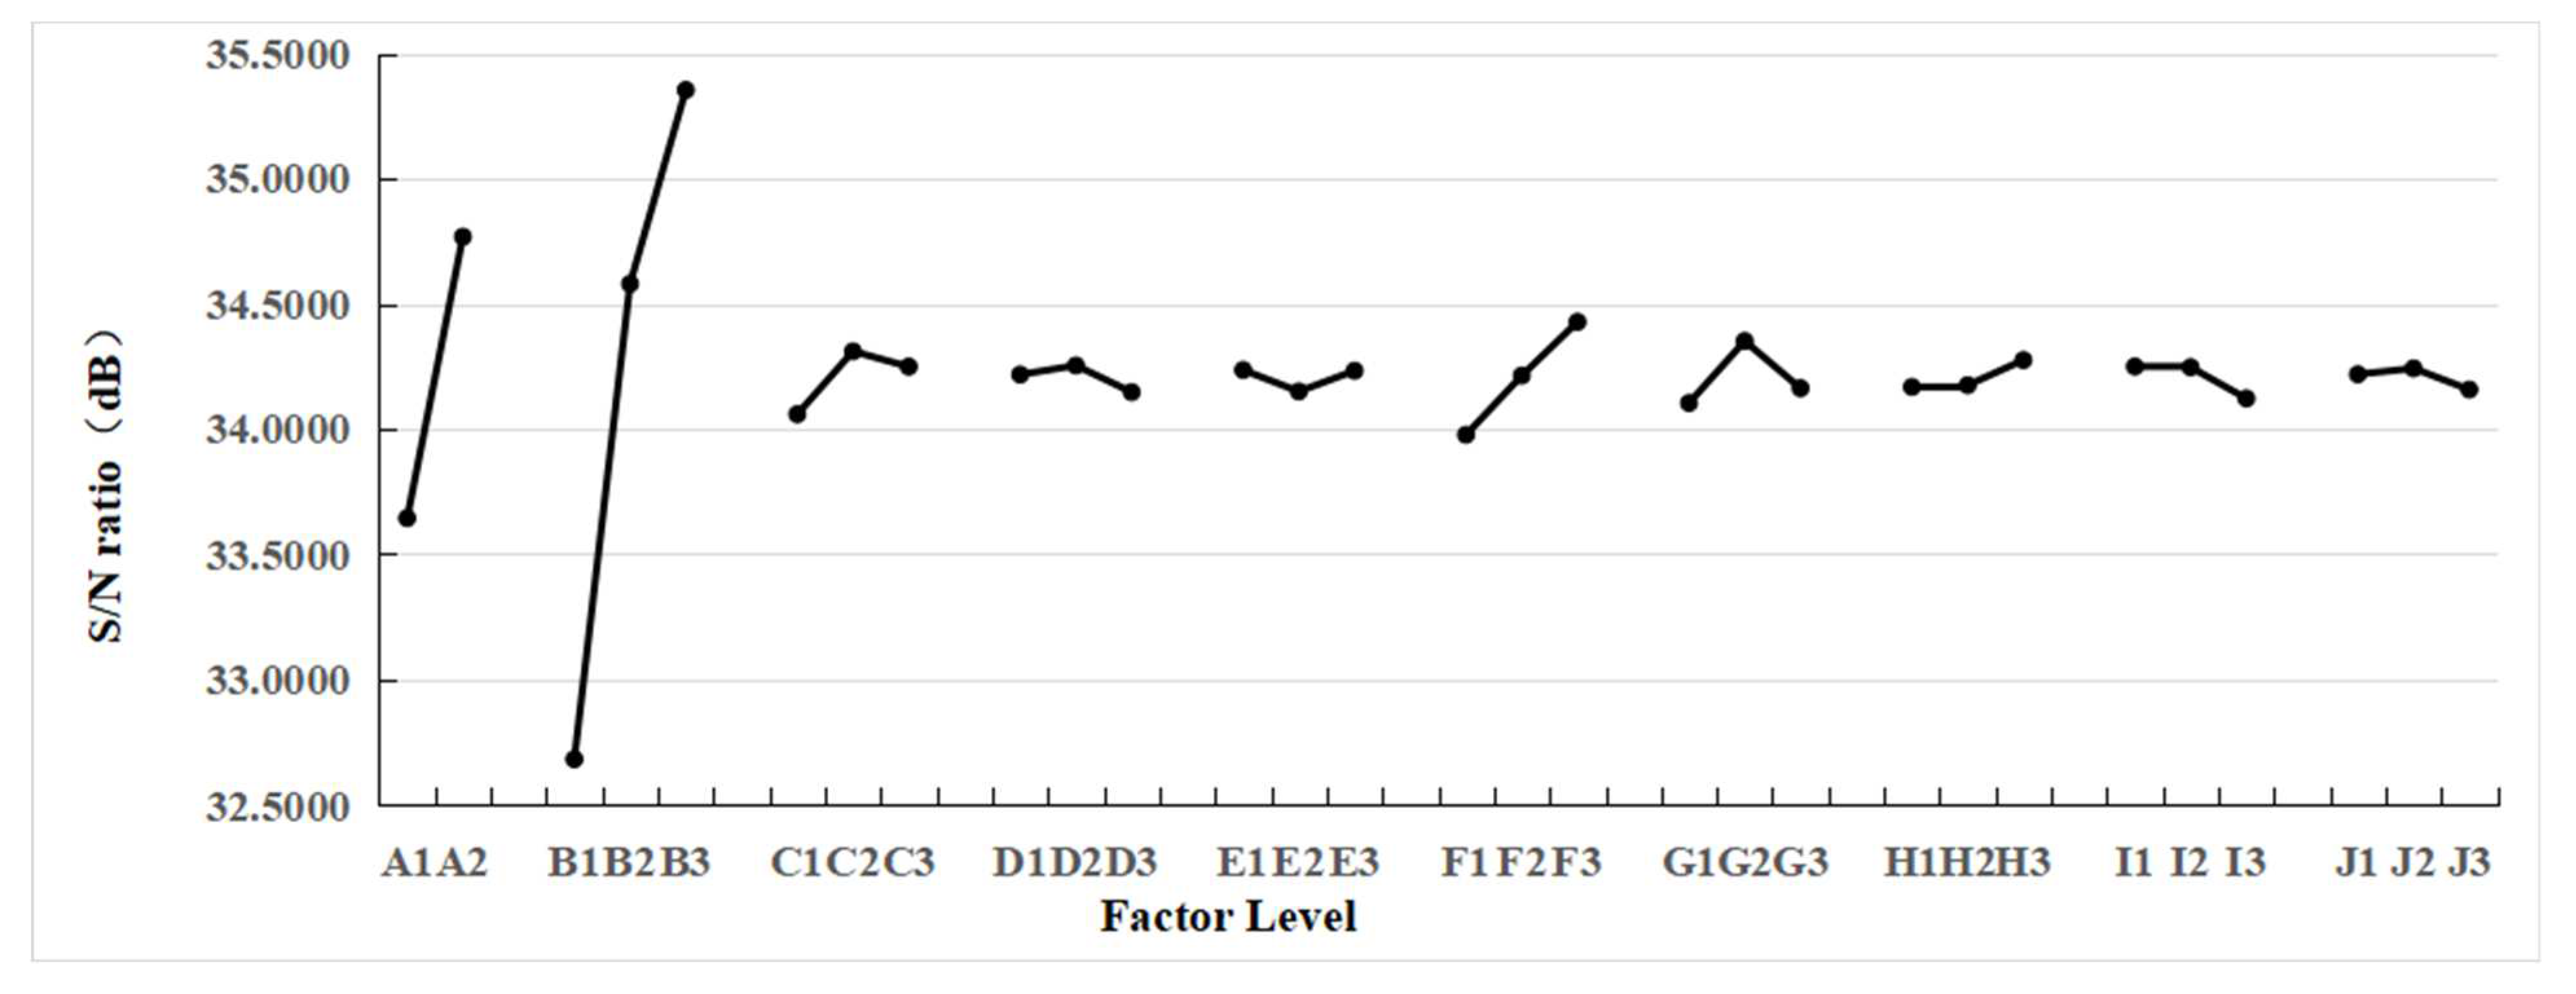
4.2. Thermal Storage Efficiency Optimization Analysis

The experimental results of the power generation efficiency of the nanofluid-PCM-PV/T composite module are shown in Table 9. The corresponding main effect response table and graph for heat storage efficiency are shown in Table 10 and Figure 8, respectively.
From Figure 8, it can be seen that the optimum factor levels of heat storage efficiency are A2, B3, C2, D2, E1, F3, G2, H3, I1, and J2; that is, PCM material is used, and the working fluid is CuO nanofluid. The mass flow rate of the working fluid is 0.05 kg/s·m2, the title angle of the module is 23.25°, the number of collector tubes is 10, the diameter of the collector tube is 20 mm, the azimuth is south, and the V/A ratio is 152. In addition, the thickness of the heat collecting plate is 0.65 mm, and the material of the heat collecting plate is copper.
The variance analysis In Table 11 shows that the most significant control factor affecting heat storage efficiency is the type of working fluid, and the second is PCM material. The contribution rankings of the remaining factors are collector tube diameter, working fluid mass flow rate, azimuth angle, collector plate thickness, V/A ratio, title angle, number of collector tubes, and collector plate material. The F ratio of the title angle, the number of collector tubes, and the collector plate material are less than 1. Hence, these three control factors were combined into the combined error.

4.3. Confirmation Experiment

The five confirmation experiments for heat storage efficiency are shown in Table 12.
The heat storage efficiency confidence interval is:
CI S / N = F α ; 1 , v 2 × Var e × 1 neff + 1 r = 4.3 × 0.037102 × 1 36 1 + 13 + 1 5 = 0.3065  
After calculation, the optimal experimental confidence interval of the heat storage efficiency of the PV/T composite module was 36.1951~36.8081 db. After five confirmation experiments, the S/N ratio of the confirmation experiment calculated from the obtained data was 36.2882 db, falling within the 95% confidence interval, indicating that the results of this experiment are reliable and have good reproducibility.

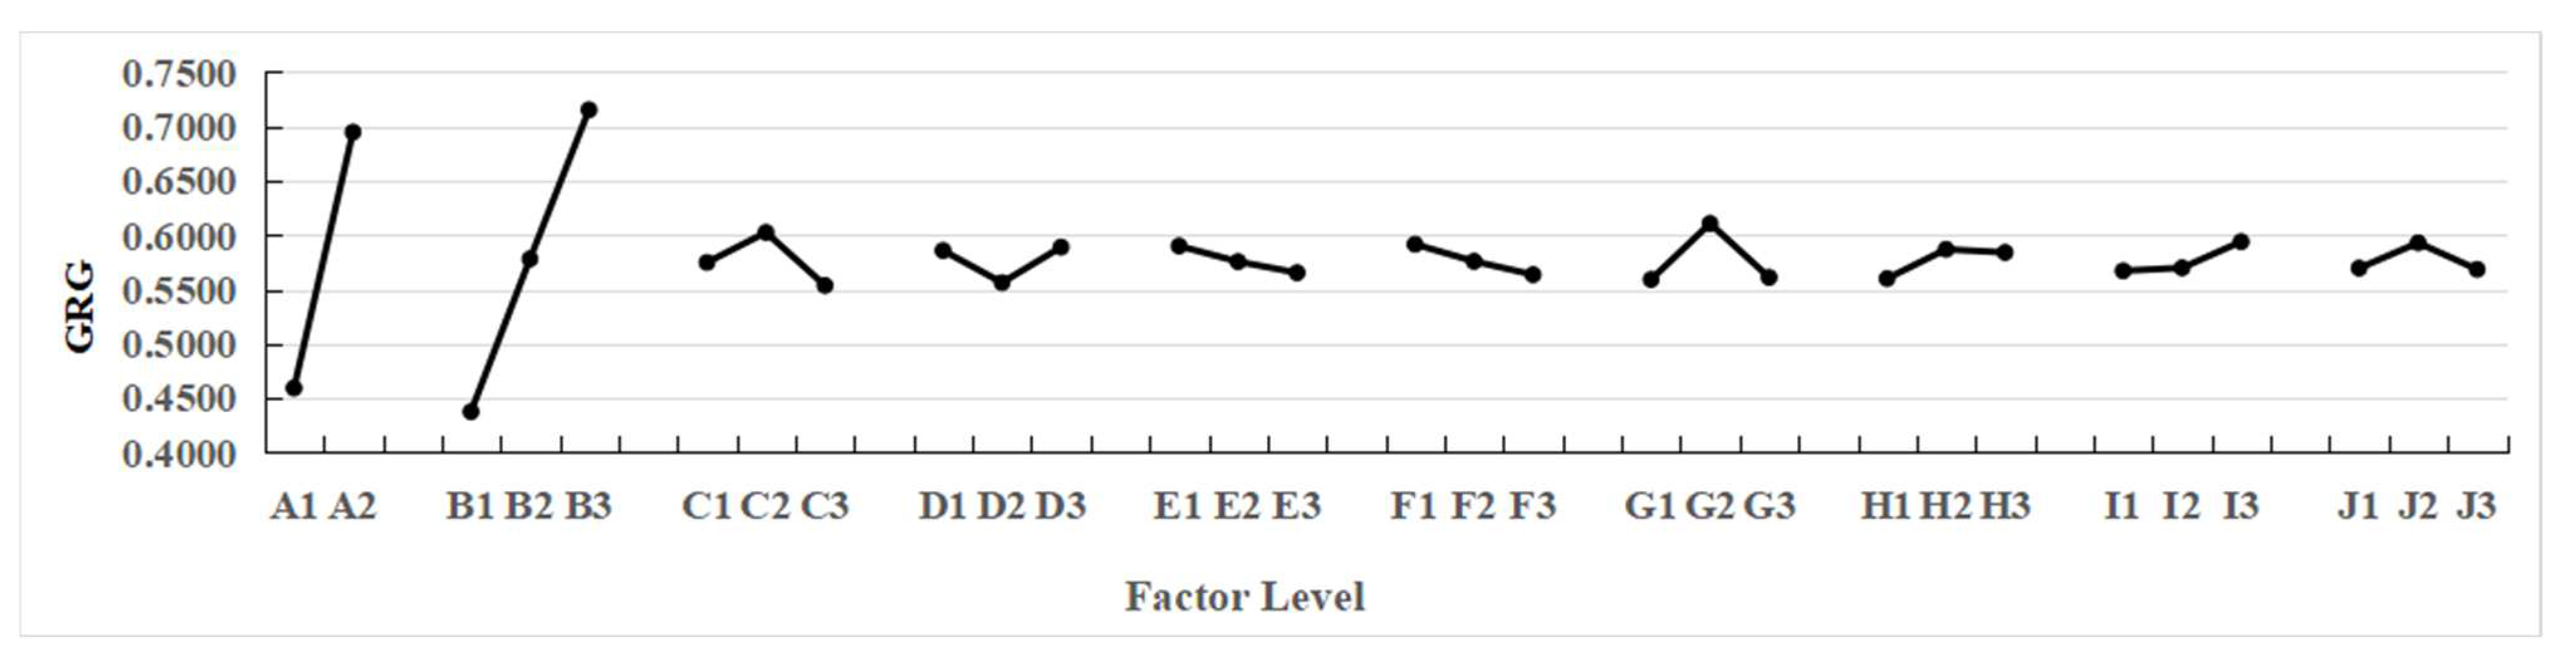
4.4. Multi-Quality Optimization Parameter Analysis

Based on the Taguchi method, this study uses the GRA method to determine the multi-quality optimization process parameters of nanofluid-phase change-PV/T composite modules.
From GRA, step 1 to step 4, as shown in Equations (12)–(14), the GRG of power generation efficiency and heat storage efficiency is shown in Table 13.
After obtaining the GRG, the MEA was used to get the response table and the response graph, as shown in Table 14 and Figure 9, respectively.
The factor response table and response graph show that the multi-quality optimal factor levels are A2, B3, C2, D3, E1, F1, G2, H2, I3, and J2; that is, the PCM material is used, the working fluid is CuO nanofluid, the mass flow rate of the working fluid is 0.05 kg/s m2, the title angle is 26.25°, and the number of collector tubes is 10. In addition, the diameter of the collector tube is 12 mm, the azimuth angle is south direction, the V/A ratio is 122, the thickness of the heat collecting plate is 1.05 mm, and the material of the heat collecting plate is aluminum. The control factor with the greatest impact on the composite module is the type of working fluid, and the second is whether to use PCM material, followed by azimuth angle, mass flow rate of working fluid, module tilt angle, heat collector tube diameter, V/A ratio, heat collector plate thickness, number of heat collector tubes, and heat collector plate material.

Confirmation Experiments

The nanofluid-PCM-PV/T module confirmation experiment for heat storage efficiency and power generation efficiency are shown in Table 15 and Table 16, respectively.
The results showed that the multi-quality optimization PV/T composite module’s power generation efficiency is 14.958%, and its heat storage efficiency is 64.764%.
According to the confirmation experiment calculation, the S/N ratio of power generation efficiency is 23.4975 db, and that of heat storage efficiency is 36.2267, both of which fall within the 95% confidence interval of single-quality optimization (the confidence interval of power generation efficiency is 23.43257~23.549233 db, and the confidence interval of heat storage efficiency is 36.1951~36.8081 db). This finding proves the accuracy and reproducibility of the optimal parameter results obtained by the grey relational analysis method.

4.5. Comparison of Results and Discussion

In order to verify the benefits of parameter design optimization for nanofluid-PCM-PV/T modules in this study, the optimization results were compared with those of traditional related PV/T modules, as shown in Table 17.
It can be found that the efficiency of PV/T modules was improved after adding PCM or nanofluid and with the continuous improvement of materials. Although the system’s power generation efficiency was improved, the improvement was small, which is also related to the material of the solar cell. In addition, the heat storage efficiency was greatly improved with the improvement of materials, so the overall efficiency of the module could be continuously improved.
According to Table 17, due to the low heat transfer efficiency of air, the power generation efficiency and heat storage efficiency of air-type PV/T are not high compared with other modules; its application fields are mainly dryers, and there are no extensive liquid-type PV/T modules. In contrast, the power generation efficiency of the traditional liquid PV/T module is 12.74%, the heat storage efficiency is 34.06%, and the overall efficiency is 46.8%. After the optimized design by Kuo et al. [8], the power generation efficiency is increased by 14.29%, the heat storage efficiency is increased by 44.96%, and the overall efficiency is achieved by 59.25%.
Based on traditional liquid-type modules, Chaichan’s [13] module added PCM, and Alsalame [17] used nanofluids. The efficiency of their modules has been improved compared to the original module.
In the modules used in this study, the power generation efficiency is increased by 14.958%, the heat storage efficiency is increased by 64.764%, and the overall efficiency is achieved by 79.722% after adding and optimizing PCM material and nanofluid. Compared with other existing modules in the literature, there is a significant improvement in the performance of the related air, liquid, PCM, and nanofluidic PV/T type modules.

4.6. Benefit Analysis of Power Generation Recovery

In this study, the comparison of the cost payback period of a 1 kW solar photovoltaic system, PV/T system, and optimized nanofluid-PCM-PV/T system is analyzed in the case of a generally typical family of four people using electric/water heaters, as shown in Table 18. The construction cost of a solar photovoltaic system with a capacity of 1 kW in Taiwan is USD 1782 (ground type) and USD 1716 (roof type), which are affected by the cost of the metal used in the construction type. Meanwhile, the PV/T system is due to initial cost increases of 68% (ground type) and 70% (roof type) by adding heat collector tubes, water storage tanks and controllers, and initial cost increases of 3.3% (ground type) and 3.4% by adding a nanofluid-PCM-PV/T system (roof type). In addition, the typical thermal collector is added in Table 17 because it only has a roof type, and its heat storage efficiency is 75%, which is 10.2% higher than the optimal PV/T heat storage efficiency of 64.8% in this study. Although conversion can increase by 243 MJ per year thermal energy, the typical thermal collector cannot generate additional electricity.
For the calculation of power generation of a 1 kW solar photovoltaic system, taking Taipei as an example, the annual average daily sunshine duration is 2.7 h, and the annual power generation of a traditional photovoltaic system can reach 350 (MJ/year) without considering shading. The PV/T system reduces the temperature of the solar module due to the increase in the thermal conductivity of the system and the power generation efficiency increase of 5%. In addition, the PV/T system provides more heat energy by 1218 (MJ/year). By incorporating a nanofluid-PCM-PV/T system, the power generation efficiency benefit brought by temperature reduction in the experiment test is further increased by 8.57%, and the heat energy provided in the experiment test reaches 1583 (MJ/year).
For the electricity sales calculation of the 1 kW solar photovoltaic system, Taipei was taken as an example, and the single purchase rate of various renewable energy electric energy in 2023 issued by the Bureau of Energy was referred to. Furthermore, the additional rate premium of power generation equipment was employed. The northern Taiwan base rate is additive and has a multiplicative of 15%.
The electricity purchased by the Taiwan Power Company is 2.373 USD/kWh for rooftop types and 1.617 USD/kWh for ground types. The cost can be recovered in the eighth year (rooftop type) and the twelfth year (ground type). At present, the warranty period of PV is 20 years, and the net profit of electricity sale of PV system power generation for this period can be USD 2898 (rooftop type) and USD 1362 (ground type). In addition to the electricity sales income of the PV/T system, the heat energy provided can be reused, and the compound income can recover the cost in the seventh year (rooftop type) and the eighth year (ground type). It shows that the net profit of the PV/T system power generation for 20 years is USD 6787 for roof types and USD 5178 for ground types. Considering the nanofluid-PCM-PV/T system, the compound revenue can be recovered in the sixth year (roof type) and the seventh year (ground type). It shows that the net profit of the nanofluid-PCM-PV/T system power generation for 20 years is USD 8563 for roof types and USD 6822 for ground types. Therefore, it has a better investment profit and energy conversion efficiency than typical PV and typical PV/T.
Our findings show that this composite module has excellent potential for improving the efficiency of power generation and heat storage for various applications, including electricity and hot water supply for households.
In the case of a small family of four members using electric/water heaters, this study is more efficient than the typical rooftop PV/T by 25.04%, whose investment recovery period is lower than 0.81 years, respectively. In addition, for 20 years of net profit of electricity, this rooftop nanofluid-PCM-PV/T module is larger than typical PV/T 26.16% and typical PV 195.47%.
Moreover, Taiwan is located at 23 degrees north latitude, with plenty of sunlight. The PV/T module used in this study has an area of 1.63 m2, and a common 200-L tank is selected. The highest heat storage efficiency in the actual test is 64.764%. Taking the solar collector system commonly used in households as the three collector panels, it is equivalent to the area of three solar panels, similar to the volume of the 1 kW solar photovoltaic system in this study. The planned collector tank is 300 L, which does not exceed two rainy days, and hot water is enough for general household use. However, if it rains for more than two days, the reality requires an additional heater.

5. Conclusions

In this study, the parameter optimization of the power generation efficiency and heat storage efficiency of the nanofluid-PCM-PV/T module was carried out, and the TRNSYS software was used to predict the performance of various control parameter combinations. In order to realize the optimal PV/T system parameter design, the Taguchi method and GRA were used for multi-quality optimization analysis. The final multi-quality optimization parameter configuration is as follows: PCM material is used, CuO nanofluid is selected as the working fluid, the mass flow rate of the working fluid is 0.05 kg/s·m2, the tilt angle of the module is 26.25°, the number of heat collecting tubes is 10 pieces, the diameter of the collector tube is 12 mm, the azimuth is in the south direction, the V/A ratio is 122, the thickness of the heat collecting plate is 1.05 mm, and the material of the heat collecting plate is aluminum. Finally, a confirmation experiment was carried out according to this configuration. It was found that the power generation efficiency of the nanofluid-PCM-PV/T composite module after optimization was 14.958%, the heat storage efficiency was 64.764%, and the overall efficiency was 79.722%. At the same time, under this configuration, the S/N ratio of power generation efficiency is 23.4975 db, and the S/N ratio of heat storage efficiency is 36.2267 db, both of which fall within the 95% confidence interval. This finding can prove that the optimal parameter results obtained by the grey correlation analysis method are accurate and reproducible. In addition, in the case of a general small family of four people using electric/water heaters, for 20 years net profit of electricity, this rooftop nanofluid-PCM-PV/T module is larger than typical PV/T 26.16% and typical PV 195.47%.
In the future, by adopting controllers based on fuzzy logic and event-triggering mechanisms [37], we can devise strategies to ensure the optimal operation of photovoltaic systems under intermittent solar radiation and varying load conditions. Simultaneously, combining self-adjusting control strategies with real-time communication mechanisms based on fuzzy logic can enhance the system’s ability to withstand disturbances and fluctuations. Furthermore, we recommend employing active cooling methods, such as fan systems, during module construction to enhance power generation efficiency, even if it might come at the cost of reducing heat storage efficiency.

Author Contributions

D.-K.L.: Conceptualization, Methodology, C.-C.H.: Data curation, Investigation, T.-W.L.: Formal analysis, Revised experiments, Methodology, C.-F.J.K.: Methodology, Supervision, Project administration, Writing & editing. All authors have read and agreed to the published version of the manuscript.

Funding

The research was supported by the Ministry of Science and Technology of the Repulic of China under the grant No: MOST 110-2622-E-011-012 and the APC was funded by Author voucher code (9f0a7bae3b82e071).

Institutional Review Board Statement

Not applicable.

Informed Consent Statement

Not applicable.

Data Availability Statement

Data are available upon request.

Acknowledgments

The financial support provided by Bureau of Energy, Ministry of Economic Affairs, Taiwan, R.O.C. (Contract No: 112-S0102) is gratefully acknowledged.

Conflicts of Interest

The authors declare no conflict of interest.

References

  1. Omer, A.M. Energy use and environmental impacts: A general review. J. Renew. Sustain. Energy 2009, 1, 053101. [Google Scholar] [CrossRef]
  2. Alsaqoor, S.; Alqatamin, A.; Alahmer, A.; Zhan Nan, Z.; Al-Husban, Y.; Jouhara, H. The impact of phase change material on photovoltaic thermal (PVT) systems: A numerical study. Int. J. Thermofluids 2023, 18, 100365. [Google Scholar] [CrossRef]
  3. Mojumder, J.C.; Ong, H.C.; Chong, W.T.; Izadyar, N.; Shamshirband, S. The intelligent forecasting of the performances in PV/T collectors based on soft computing method. Renew. Sustain. Energy Rev. 2017, 72, 1366–1378. [Google Scholar] [CrossRef]
  4. Allouhi, A.; Rehman, S.; Buker, M.S.; Said, Z. Recent technical approaches for improving energy efficiency and sustainability of PV and PV-T systems: A comprehensive review. Sustain. Energy Technol. Assess. 2023, 56, 103026. [Google Scholar] [CrossRef]
  5. Wolf, M. Performance analyses of combined heating and photovoltaic power systems for residences. Energy Convers. Manag. 1976, 16, 79–90. [Google Scholar] [CrossRef]
  6. Huang, B.J.; Lin, T.H.; Hung, W.C.; Sun, F.S. Performance evaluation of solar photovoltaic/thermal systems. Sol. Energy 2001, 70, 443–448. [Google Scholar] [CrossRef]
  7. Shan, F.; Cao, L.; Fang, G. Dynamic performances modeling of a photovoltaic–thermal collector with water heating in buildings. Energy Build. 2013, 66, 485–494. [Google Scholar] [CrossRef]
  8. Kuo, C.F.; Liu, J.M.; Umar, M.L.; Lan, W.L.; Huang, C.Y.; Syu, S.S. The photovoltaic-thermal system parameter optimization design and practical verification. Energy Convers. Manag. 2019, 180, 358–371. [Google Scholar] [CrossRef]
  9. Pandey, A.K.; Hossain, M.S.; Tyagi, V.V.; Abd Rahim, N.; Selvaraj, J.A.L.; Sari, A. Novel approaches and recent developments on potential applications of phase change materials in solar energy. Renew. Sustain. Energy Rev. 2018, 82, 281–323. [Google Scholar] [CrossRef]
  10. Stultz, J.; Wen, L. Thermal, performance testing and analysis of photovoltaic modules in natural sunlight. LSA Task Rep. 1977, 5101, 31. [Google Scholar]
  11. Yin, E.; Li, Q.; Li, D.; Xuan, Y. Experimental investigation on effects of thermal resistances on a photovoltaic-thermoelectric system integrated with phase change materials. Energy 2019, 169, 172–185. [Google Scholar] [CrossRef]
  12. Carmona, M.; Bastos, A.P.; García, J.D. Experimental evaluation of a hybrid photovoltaic and thermal solar energy collector with integrated phase change material (PVT-PCM) in comparison with a traditional photovoltaic (PV) module. Renew. Energy 2021, 172, 680–696. [Google Scholar] [CrossRef]
  13. Chaichana, M.T.; Kazemb, H.A.; Al-Waeli, A.H.A.; Sopianc, K. Controlling the melting and solidification points temperature of PCMs on the performance and economic return of the water-cooled photovoltaic thermal system. Sol. Energy 2021, 224, 1344–1357. [Google Scholar] [CrossRef]
  14. Choi, S.U.S.; Singer, D.A.; Wang, H.P. Developments and applications of non-Newtonian flows. ASME FED 1995, 66, 99–105. [Google Scholar]
  15. Tyagi, H.; Phelan, P.; Prasher, R. Predicted efficiency of a low temperature nanofluid-based direct absorption solar collector. J. Sol. Energy Eng. 2009, 131, 041004. [Google Scholar] [CrossRef]
  16. Sardarabadi, M.; Passandideh-Fard, M.; Heris, S.Z. Perimental investigation of the effects of silica/water nanofluid on PV/T (photovoltaic thermal units). Energy 2014, 66, 264–272. [Google Scholar] [CrossRef]
  17. Alsalame, H.A.M.; Lee, J.H.; Lee, G.H. Performance evaluation of a photovoltaic thermal (PVT) system using nanofluids. Energies 2021, 14, 301. [Google Scholar] [CrossRef]
  18. Izady, M.; Dinarvand, S.; Pop, I.; Chamkha, A.J. Flow of aqueous Fe2O3–CuO hybrid nanofluid over a permeable stretching/shrinking wedge: A development on Falkner–Skan problem. Chin. J. Phys. 2021, 74, 40. [Google Scholar] [CrossRef]
  19. Dinarvand, S.; Mousavi, S.M.; Yousefi, M.; Nademi Rostami, M. MHD flow of MgO-Ag/water hybrid nanofluid past a moving slim needle considering dual solutions: An applicable model for hot-wire anemometer analysis. Int. J. Numer. Method H 2022, 32, 488–510. [Google Scholar] [CrossRef]
  20. Kuo, C.F.J.; Su, T.L.; Jhang, P.R.; Huang, C.Y.; Chiu, C.H. Using the Taguchi method and grey relational analysis to optimize the flat-plate collector process with multiple quality characteristics in solar energy collector manufacturing. Energy 2011, 36, 3554–3562. [Google Scholar]
  21. Kazemian, A.; Paecheforosh, A.; Salari, A.; Ma, T. Optimization of a novel photovoltaic thermal module in series with a solar collector using Taguchi based grey relational analysis. Sol. Energy 2021, 215, 492–507. [Google Scholar] [CrossRef]
  22. Ziyaei, M.; Jalili, M.; Chitsaz, A.; Nazari, M.A. Dynamic simulation and life cycle cost analysis of a MSF desalination system driven by solar parabolic trough collectors using TRNSYS software: A comparative study in different world regions. Energy Convers. Manag. 2021, 243, 14412. [Google Scholar] [CrossRef]
  23. Zarrella, A.; Emmi, G.; Vivian, J.; Croci, L.; Besagni, G. The validation of a novel lumped parameter model for photovoltaic thermal hybrid solar collectors: A new TRNSYS type. Energy Convers. Manag. 2019, 188, 414–428. [Google Scholar] [CrossRef]
  24. Kuo, C.F.J.; Su, T.L.; Huang, C.Y.; Liu, H.C.; Barman, J.; Kar, I. Design and development of a symbiotic agrivoltaic system for the coexistence of sustainable solar electricity generation and agriculture. Sustainability 2023, 15, 6011. [Google Scholar] [CrossRef]
  25. Chen, S.H.; Kuo, C.F.J. Functional dyeable polypropylene fabric development and process parameter optimization. Part II: Development of graphene thermal insulation dyeable polypropylene fabric with process parameter optimization. Text. Res. J. 2023, 93, 00405175221147720. [Google Scholar] [CrossRef]
  26. Mondal, S.; Paul, C.P.; Kukreja, L.M.; Bandyopadhyay, A.; Pal, P.K. Application of Taguchi-based gray relational analysis for evaluating the optimal laser cladding parameters for AISI1040 steel plane surface. J. Adv. Manuf. Technol. 2013, 66, 91–96. [Google Scholar] [CrossRef]
  27. Sohani, A.; Shahverdian, M.H.; Sayyaadi, H.; Samiezadeh, S.; Doranehgard, M.H.; Nizetic, S.; Karimi, N. Selecting the best nanofluid type for A photovoltaic thermal (PV/T) system based on reliability, efficiency, energy, economic, and environmental criteria. J. Taiwan Inst. Chem. Eng. 2021, 124, 351–358. [Google Scholar] [CrossRef]
  28. Faizal, M.; Saidur, R.; Mekhilef, S.; Alim, M.A. Energy economic and environmental analysis of metal oxides nanofluid for flat-plate solar collector. Energy Convers. Manag. 2013, 76, 162–168. [Google Scholar] [CrossRef]
  29. Wu, S.Y.; Zhang, Q.L.; Xiao, L.; Guo, F.H. A heat pipe photovoltaic/thermal (PV/T) hybrid system and its performance evaluation. Energy Build. 2011, 43, 3558–3567. [Google Scholar] [CrossRef]
  30. Hissouf, M.; Feddaoui, M.; Najim, M.; Charef, A. Numerical study of a covered Photovoltaic-Thermal Collector (PVT) enhancement using nanofluids. Sol. Energy 2020, 199, 115–127. [Google Scholar] [CrossRef]
  31. Moradi, K.; Ebadian, M.A.; Lin, C.X. A review of PV/T technologies: Effects of control parameters. Int. J. Heat Mass Transf. 2013, 64, 483–500. [Google Scholar] [CrossRef]
  32. Tiwari, A.; Sodha, M.S. Performance evaluation of solar PV/T system: An experimental validation. Sol. Energy 2006, 80, 751–759. [Google Scholar] [CrossRef]
  33. Chang, Y.P. Optimal design discrete-value tilt angle of PV using sequential neural-network approximation and orthogonal array. Expert Syst. Appl. 2009, 36, 6010–6018. [Google Scholar] [CrossRef]
  34. Maleki, Y.; Pourfayaz, F.; Mehrpooya, M. Transient optimization of annual performance of a photovoltaic thermal system based on accurate estimation of coolant water temperature: A comparison with conventional methods. Case Stud. Therm. Eng. 2021, 28, 101395. [Google Scholar] [CrossRef]
  35. Ahn, J.G.; Yu, J.S.; Boafo, F.E.; Kim, J.H.; Kim, J.T. Simulation and performance analysis of air type pvt collector with interspaced baffle-PV cell design. Energies 2021, 14, 5372. [Google Scholar] [CrossRef]
  36. Hosseinzadeh, M.; Sadarabadi, M.; Fard, M.P. Energy and exergy analysis of nanofluid based photovoltaic thermal system integrated with phase change material. Energy 2018, 147, 636–647. [Google Scholar] [CrossRef]
  37. Vadivel, R.; Santhosh, T.K.; Unyong, B.; Zhu, Q.; Cao, J.; Gunasekaran, N. Stabilization of photovoltaic systems with fuzzy event-triggered communication. Int. J. Fuzzy Syst. 2023, 25, 1656–1673. [Google Scholar] [CrossRef]
Figure 1. Structure diagram of a liquid-type PV/T module.
Sustainability 15 15163 g001
Figure 2. PV/T equipment diagram: (a) PV/T module; (b) Ambient temperature sensor; (c) Heliograph. (d) Datalogger.
Sustainability 15 15163 g002
Figure 3. Working conceptual diagram of the nanofluid-PCM-PV/T module.
Sustainability 15 15163 g003
Figure 4. Simulation model diagram of the nanofluid-PCM-PV/T module.
Sustainability 15 15163 g004
Figure 5. Nanofluid-PCM-PV/T model workflow.
Sustainability 15 15163 g005
Figure 6. Research flow chart.
Sustainability 15 15163 g006
Figure 7. Main effect response graph for power generation efficiency.
Sustainability 15 15163 g007
Figure 8. Main effect response graph for heat storage efficiency.
Sustainability 15 15163 g008
Figure 9. The main effect response graph of the GRG.
Sustainability 15 15163 g009
Table 1. The detailed specification of the photovoltaic module.
Sun Forte-Mono 203, PM-096800
STC Output power (W)330
STC module efficiency (%)20.3%
STC open-circuit voltage Voc (V)64.9
STC short-circuit current I, (A)6.52
NOCT Battery working temperature (°C)45
PV temperature coefficient (%/K)−0.38
Voc temperature coefficient (%/K)−0.27
La temperature coefficient (%/K)0.06
Module size (m)1.559 × 1.046 × 046
Table 2. Control factors and their level values.
Control FactorABCDEFGHIJ
LevelPCM
Material
Working FluidWorking Fluid Mass Flow Rate (kg/s·m2)Tilt
Angle
No. of Collector TubesCollector Tube DiameterAzimuthV/A
Ratio
Collector Plate Thickness (mm)Collector Plate Material
1Nonewater0.02520.251012 mmsoutheast920.65aluminum
2paraffinAl2O30.0523.251116 mmsouth1220.85copper
3paraffinCuO0.07526.251220 mmsouthwest1521.05Stainless steel
Table 3. The physical properties table of nanoparticles used in this experiment.
MaterialSpecific Heat (kJ/kg·°C)Density (kg/m3)Diameter (nm)Color
CuO0.531631034~45black
Al2O30.765397030~60white
Table 4. Density and specific heat of nanofluid.
NanofluidDensity (kg/m3)Specific Heat (kJ/kg·°C)
CuO1210.483.419
Al2O31116.883.694
Table 5. Experimental results of power generation efficiency.
No.1
(%)
2
(%)
3
(%)
4
(%)
5
(%)
Average Value
(%)
S/N Ratio
Exp.
Group
113.2513.2713.2313.2713.3113.26622.4547
213.5813.5413.6413.5113.5413.56222.6463
313.8213.7613.8413.8413.8513.82222.8113
413.2713.2713.3213.3913.3413.31822.4886
513.5713.5913.5413.5913.5413.56622.6490
613.7613.7713.7413.7613.7913.76422.7749
713.3513.3113.3213.3413.3413.33222.4979
813.5613.5613.5913.5413.5713.56422.6477
913.8313.7813.8113.7713.813.79822.7963
1013.2913.3213.2813.3413.3113.30822.4822
1113.4413.5213.4813.4713.5413.49022.6001
1213.8913.8713.9113.8413.8913.88022.8478
1313.4313.4413.413.4613.4213.43022.5615
1413.6213.6413.613.6113.5713.60822.6758
1513.6913.6713.6713.6313.6513.66222.7103
1613.3913.4313.3713.3713.4113.39422.5382
1713.6413.6613.6213.6513.6413.64222.6975
1813.7213.7313.7513.7413.7413.73622.7572
1914.1514.1914.1814.2214.1414.17623.0310
2014.5814.614.5714.6214.5714.58823.2799
2114.7914.8414.8114.8614.7714.81423.4134
2214.2314.2414.2314.2314.2514.23623.0678
2314.6414.6214.6414.5914.6314.62423.3013
2414.6814.6214.6714.6414.7114.66423.3250
2514.3214.3314.3614.3714.3414.34423.1334
2614.5414.5214.514.5714.5314.53223.2465
2714.9615.0114.9615.0415.0815.01023.5275
2814.3114.2914.3314.2714.2914.29823.1055
2914.5314.5414.5914.5614.5314.55023.2572
3014.7614.7314.7914.7614.8114.77023.3876
3114.2814.3014.2714.2314.3214.28023.0945
3214.4314.4414.4714.4714.4214.44623.1949
3314.6314.6414.6814.6414.6614.65023.3167
3414.3514.3214.3714.3214.4214.35623.1406
3514.4714.5214.4914.4314.4814.47823.2141
3614.8714.8714.8214.8814.9114.87023.4462
Average 22.9478
Table 6. Main effect response table for power generation efficiency.
Control FactorABCDE
LevelPCM
Material
Working
Fluid
Working Fluid Flow Rate (kg/s)Tilt Angle (°)Number of Absorber Tubes
122.646522.799722.920222.943322.9584
223.249122.950922.951622.935522.9446
3--23.092822.971622.964622.9403
Difference0.60250.29320.051390.02910.01805
Sorting12358
Control FactorFGHIJ
LevelAbsorber DiameterAzimuthV/A RatioAbsorber Plate ThicknessAbsorbent Plate Material
122.954222.934622.935222.936622.9566
222.942422.974722.960022.941922.9433
322.946822.934122.948222.964922.9435
Difference0.01180.040620.024720.02820.01327
Sorting104869
Table 7. ANOVA for power generation efficiency.
ANOVADegrees of FreedomSum of SquareVariationF-RatioContributionp-ValueConfidence Level
Control
Factor
PCM material13.26743.26742076.136184.72%0100.00%
working fluid20.51590.2579163.906413.38%0100.00%
Working fluid mass
flow rate kg/s·m2
20.016110.00815.11970.42%0.01998.10%
Tilt angle (°)20.00540.00271.72790.14%0.20979.10%
Number of collector tubes20.00210.00110.67840.06%0.52147.90%
Collector tube diameter20.00090.00040.27410.02%0.76423.60%
Azimuth20.013030.00654.14040.34%0.03696.40%
V/A ratio20.00370.00181.16530.10%0.33766.30%
Thickness of collector plate (mm)20.00540.00271.72040.14%0.21178.90%
Heat collector plate material20.00140.00070.43920.04%0.65234.80%
Residual error160.02520.0016
Combined error220.02960.0013
Total353.8565
Table 8. The nanofluid-PCM-PV/T power generation efficiency confirmation test.
Confirmation
Test
12345Average ValueS/N Ratio
Control Factor
A2, B3, C3, D3, G2, H2, I314.9615.0314.8714.9414.9714.95423.495
Table 9. Experimental results of heat storage efficiency.
Exp. No1
(%)
2
(%)
3
(%)
4
(%)
5
(%)
Average Value
(%)
S/N Ratio
Group
138.6338.7738.2038.8438.6338.614031.7345
253.4853.4653.4453.5353.4853.478034.5635
356.9256.7657.0256.9156.9256.906035.1031
440.7240.4240.6140.5440.7240.602032.1708
551.2751.1451.1451.0851.2751.180034.1820
653.8453.7653.9153.8653.8453.842034.6224
739.9240.1240.0440.2439.9240.048032.0515
850.8351.2351.0650.9650.8350.982034.1482
954.2154.1854.2554.2454.2154.218034.6829
1036.2536.6736.7337.1436.2536.608031.2704
1150.3950.4450.3650.4850.3950.412034.0507
1257.7757.9758.0757.8457.7757.884035.2511
1342.1342.3241.8242.2142.1342.122032.4900
1449.4749.4449.2349.3949.4749.400033.8745
1554.7454.7654.7954.8054.7454.766034.7702
1639.2438.8839.0638.4239.2438.968031.8134
1749.6349.7149.5449.8849.6349.678033.9232
1855.4955.6655.4855.5155.4955.526034.8899
1947.8448.0747.7947.7647.8447.860033.5994
2056.1856.3156.0456.1956.1856.180034.9916
2163.6862.9762.8462.7962.6862.992035.9853
2247.5747.5447.4947.5447.5747.542033.5415
2356.2756.3956.3256.4056.2756.330035.0148
2460.2760.4460.9460.0360.2760.390035.6190
2546.3946.4446.3646.4346.3946.402033.3307
2657.2357.3757.1757.2057.2357.240035.1540
2762.7962.4662.6663.0162.7962.742035.9511
2845.0745.0444.9945.0245.0745.038033.0716
2957.8457.7457.7357.7757.8457.784035.2361
3063.1863.0363.4162.5363.1863.066035.9956
3145.3245.2345.3745.4045.3245.328033.1273
3256.1956.3656.2356.5156.1956.296035.0095
3359.8760.0260.9660.0859.8760.160035.5856
3450.0250.2750.1850.0850.0250.114033.9991
3555.0455.1255.0255.1455.0455.072034.8186
3661.6961.6661.9761.4461.6961.690035.8042
Average value 34.2063
Table 10. Main effect response table for heat storage efficiency.
Control
Factor
ABCDE
LevelPCM MaterialWorking FluidWorking Fluid Flow Rate (kg/s)Tilt Angle (°)Number of Absorber Tubes
133.644032.683434.059234.217534.2359
234.768634.580634.310434.254034.1501
3 35.355034.249434.147434.2329
Difference1.12442.67170.25130.10650.0858
Sorting21489
Control
Factor
FGHIJ
LevelAbsorber DiameterAzimuthV/A RatioAbsorber Plate ThicknessAbsorbent Plate Material
133.977034.103934.168134.249934.2187
234.213734.351834.175334.246834.2425
334.428234.163234.275534.122334.1577
Difference0.45120.24780.10740.12760.0848
Sorting357610
Table 11. Variance analysis for heat storage efficiency.
ANOVADegrees of FreedomSum of SquareVariationF-RatioContributionp-ValueConfidence Level
Control
Factor
PCM material111.382411.3824283.232019.03%0100.00%
Working fluid245.348122.6741564.207275.84%0100.00%
Working fluid quality flow rate (kg/s m2)20.41220.20615.12820.69%0.01998.10%
Tilt angle (°)20.07040.03520.87560.12%0.43656.40%
Number of collector tubes20.05690.02850.70840.10%0.50749.30%
Collector tube diameter21.22260.611315.21162.04%0100.00%
Azimuth20.40240.20125.00610.67%0.0298.00%
V/A ratio20.08640.04321.07540.14%0.36563.50%
Thickness of collector plate (mm)20.12720.06361.58290.21%0.23676.40%
Heat collector plate material20.04590.02300.57140.08%0.57642.40%
Residual error160.6430.0402
Merge error220.81620.0371
Total3559.7976
Table 12. Confirmation experiment for heat storage efficiency.
Confirmation
Test
12345Average ValueS/N Ratio
Control Factor
A2, B3, C2, F3, G2, H3, I164.7665.3965.3265.1965.4765.22636.2882
Table 13. Grey correlation grade of power generation efficiency and heat storage efficiency.
ItemPower Generation EfficiencyHeat Storage EfficiencyGRG
Grey
Relational
Data
X0111
X10.33330.35670.3450
X20.37840.62260.5005
X30.42820.72580.5770
X40.34050.38180.3612
X50.37910.56570.4724
X60.41610.63240.5243
X70.34250.37460.3586
X80.37870.56120.4670
X90.42310.64280.5330
X100.33910.33330.3362
X110.36640.54850.4575
X120.44100.76040.6007
X130.35700.40260.3798
X140.38640.52690.4567
X150.39620.65850.5274
X160.35150.36100.3563
X170.39260.53270.4626
X180.41050.68120.5458
X190.51930.49650.5079
X200.68420.70180.6930
X210.82460.99560.9101
X220.53850.49050.5144
X230.70340.70660.7050
X240.72600.86250.7942
X250.57640.47000.5232
X260.65620.73730.6968
X2710.98150.9907
X280.55970.44690.5033
X290.66490.75670.7108
X300.793110.8965
X310.55330.45170.5025
X320.61730.70550.6614
X330.71790.85210.7850
X340.58090.54200.5615
X350.63120.66750.6493
X360.86830.92500.8967
Table 14. The main effect response table of the GRG.
Control
Factor
ABCDE
LevelPCM MaterialWorking FluidWorking Fluid Flow Rate (kg/s)Tilt Angle (°)Number of Absorber Tubes
10.45920.43750.57470.58570.5899
20.69460.57800.60230.55610.5755
3 0.71510.55360.58880.5653
Difference0.23540.27760.04870.03260.0246
Sorting21459
Control
Factor
FGHIJ
LevelAbsorber DiameterAzimuthV/A CompareAbsorber Plate ThicknessAbsorbent Plate Material
10.59140.55910.55990.56700.5695
20.57580.61050.58680.56980.5928
30.56350.56100.58390.59380.5684
Difference0.02790.05150.02690.02680.0244
Sorting637810
Table 15. The confirmation experiment for heat storage efficiency.
Confirmation
Test
12345Average ValueS/N Ratio
Control
Factor
A2, B3, C2, D3, E1, F1, G2, H2, I3, J264.7464.8164.8664.6964.7264.764036.2267
Table 16. The confirmation experiment for heat storage efficiency.
Confirmation
Test
12345Average ValueS/N Ratio
Control
Factor
A2, B3, C2, D3, E1, F1, G2, H2, I3, J214.9814.9614.9414.9414.9714.95823.4975
Table 17. Comparison between the results of this study and the literature.
ComparisonPower Generation Efficiency (%)Heat Storage Efficiency (%)Overall Efficiency (%)
Literature
Air type PV/T module tested by Ahn in 2021 [35]6.437.143.5
Traditional liquid PV/T module [8]12.7434.0646.80
Liquid PV/T module optimized by Kuo in 2019 [8]14.2944.9659.25
PCM-PV/T module tested by Chaichan in 2021 [13]13.73952.7
Nanofluidic-PV/T module tested by Yin in 2019 [11]13.4436.6650.1
Nanofluidic-PV/T module tested by Alsalame in 2021 [17]12.4935.9648.45
Nanofluidic-PCM-PV/T module tested by Hosseinzadeh in 2018 [36]14.0551.6665.71
Module optimized for this study14.95864.76479.722
Table 18. Benefit analysis of power generation recovery.
CategoryTypical PVTypical Thermal CollectorTypical PV/TThis Study Optimized Nanofluid-PCM-PV/T
Benefit AnalysisGround TypeRooftop TypeRooftop TypeGround TypeRooftop TypeGround TypeRooftop Type
PV system capacity (kW)11Collector plate1111
Implementation cost (USD)1782171620002994292830943028
Electric energy (MJ/Year)350350NA367367399399
Heat energy (MJ/year)NANA18261218121815831583
Selling electricity and thermal (USD/year)157231365.2409486496580
Cost recovery (year)11.347.445.487.336.036.245.22
20 years net profit of electricity (USD)1362289853045178678768228563
Disclaimer/Publisher’s Note: The statements, opinions and data contained in all publications are solely those of the individual author(s) and contributor(s) and not of MDPI and/or the editor(s). MDPI and/or the editor(s) disclaim responsibility for any injury to people or property resulting from any ideas, methods, instructions or products referred to in the content.

