1. Introduction
China has nearly 20% of the global population with a much smaller than average area of cropland per capita, so maintaining China’s ability to feed itself is extremely important. This prompted the government to reconsider the sustainability of China’s food supply [
1]. In recent years, the government used expanded croplands to compensate for croplands losses at the provincial scale. The terrain conditions obviously differ widely between cropland lost and cropland gained in China. In this paper, the word “cropland loss” is used to indicate any land removed from agricultural production. Cropland gain refers to cropland that has been occupied for other uses. The croplands gains are tracked at the province level in an attempt to guarantee a continuous supply of cropland and an adequate amount of food. The terrain differences in production potential between croplands losses and expanded croplands have led to the differences in agricultural production potential. Therefore, evaluating the differences in agricultural production potential between croplands losses and gains using terrain factors is very important [
2,
3].
In recent years, scientists have conducted many studies of the effect of cropland transformation on agricultural productivity [
4,
5,
6,
7]. Weinhold estimated the decrease in cropland productivity due to deforestation in Amazon area by using LUCC model and Generalized Least Square (GLS) formula [
8]. Ramankutty
et al. reviewed the major changes in global distribution of croplands during the 20th century, and found that the global food production system was becoming increasingly vulnerable [
9]. Deng
et al. examined the changes of the area of cultivated land and its potential agricultural productivity in China, and concluded that conversion of cultivated land has not hurt China’s national food security between 1986 and 2000 [
10]. Yang
et al. discussed the effect of croplands losses and gains on potential productivity from 2000 to 2008 in China, and found that cropland loss was mainly distributed in the Huang-Huai-Hai Plain, and the middle and lower reaches of the Yangtze River with better climatic and natural conditions [
11]. Wang
et al. demonstrated that better croplands losses and worse croplands gains had an important effect on total light-temperature potential productivity at country level from 1990 to 2010 [
12]. Cai
et al. analyzed the spatiotemporal patterns of the transformation of cropland into urbanized land using data derived from Landsat TM/ETM+ images and discussed how this conversion has affected agricultural productivity [
13]. Importantly, the impact of topographical characteristics of cropland transformation on agricultural potential productivity may have been ignored. Li
et al. found that topographical conditions of croplands losses were much better than croplands gains in China from 2000 to 2010, but that study did not investigate how extent it impacts on agricultural potential productivity [
14]. Although topographical conditions of croplands losses were much better than croplands gains, it may not impact the agricultural potential productivity.
Using topographical data, land use/land cover change data, and agricultural production potential data from 2000 to 2010, we analyzed the topographical characteristics of production potential of China’s croplands losses and gains while considering slope and elevation as the main topographical parameters. Three important issues are addressed: (1) the change of production potential of croplands losses and gains from 2000 to 2010; (2) the relationship between agricultural production potential of croplands losses and gains and topographical factors; (3) the impacts of this cropland transformation on land resources and the security of China’s food supply.
3. Results
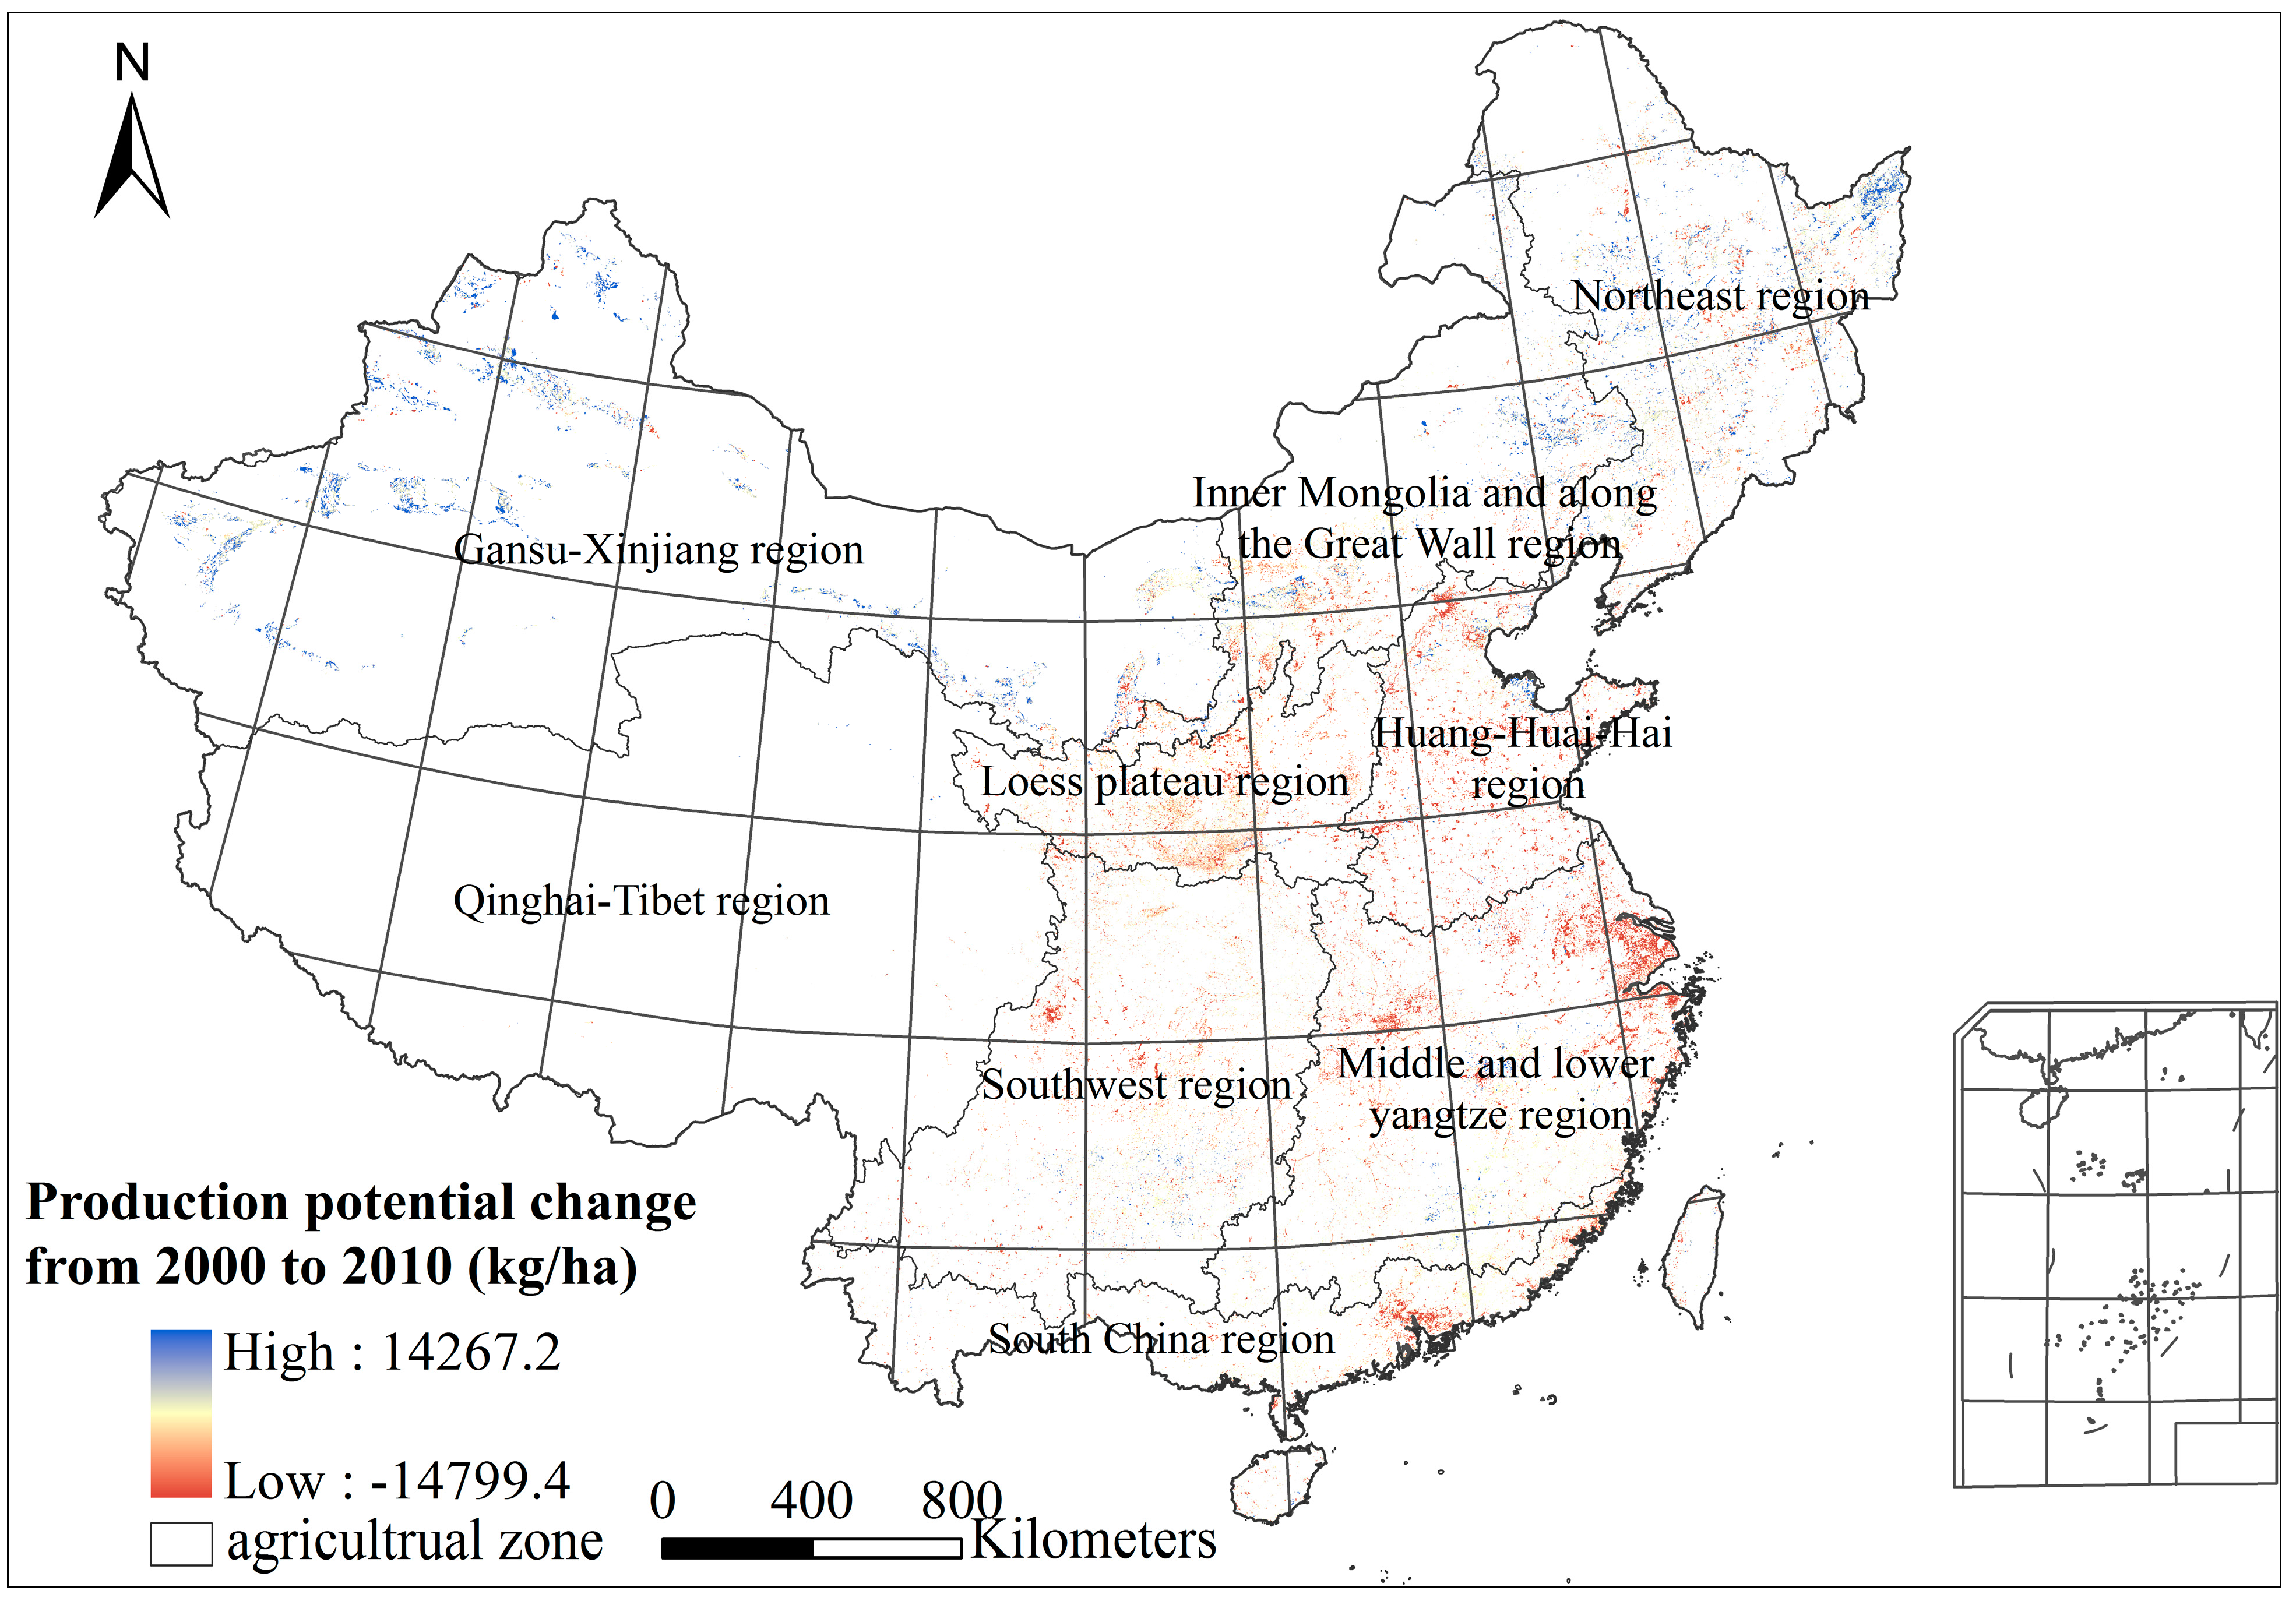
3.1. Temporal and Spatial Distribution of Production Potential of Cropland Loss and Gain
From 2000 to 2010, the loss of production potential in China caused by the cropland loss was estimated to be 2401.98 × 104 t, and the increase of production potential caused by cropland gain was 1087.12 × 104 t, which accounted for about 45.26% of that of cropland loss. The net loss in productivity in China caused by the cropland change was 1314.88 × 104 t.
The greatest loss of production potential caused by cropland loss was observed in the middle and lower Yangtze region, and the greatest increase of production potential caused by the cropland gain was observed in the Gansu Xinjiang region (
Table 3). In the northeast region and Gansu Xinjiang region, the change of production potential caused by the cropland gain was more than that caused by the cropland loss, and the net production potential increase in these two regions was 609.29 × 10
4 t. In the other seven regions, a net loss of production potential was observed; the greatest net loss was 823.66 × 10
4 t in the middle and lower Yangtze region.
Table 3.
Production potential change of cropland loss and gain in China from 2000 to 2010 (× 104 t).
Table 3.
Production potential change of cropland loss and gain in China from 2000 to 2010 (× 104 t).
| Region | Production Potential Loss | Production Potential Gain | Net Change |
|---|
| Northeast region | 165.54 | 251.93 | 86.39 |
| Inner Mongolia and along the Great Wall region | 126.78 | 102.76 | −24.03 |
| Huang-Huai-Hai region | 561.27 | 38.49 | −522.78 |
| Loess plateau region | 191.15 | 6.70 | −184.45 |
| Middle and lower Yangtze region | 878.90 | 55.24 | −823.66 |
| Southwest region | 215.38 | 23.98 | −191.40 |
| Gansu-Xinjiang region | 74.28 | 597.19 | 522.90 |
| Qinghai-Tibet region | 4.78 | 2.48 | −2.30 |
| South China region | 183.90 | 8.35 | −175.55 |
3.2. The Relationship between Slope and Production Potential of Cropland Loss and Gain
The optimal slope for agricultural cultivation was 0–5°, so this amount of slope was important in the assessment of the agricultural production potential of cropland.
At slopes of 0–5°, the loss of production potential caused by the cropland loss was 1989.68 × 10
4 t, and the increase of production potential caused by the cropland gain was 994.91 × 10
4 t, which accounts for about half of the loss of occupied cropland. The net loss of production potential caused by cropland transformation on slopes of 0–5° was 994.77 × 10
4 t (
Table 4).
Table 4.
Change in production potential associated with the slopes of cropland loss and gain in China from 2000 to 2010 (× 104 t).
Table 4.
Change in production potential associated with the slopes of cropland loss and gain in China from 2000 to 2010 (× 104 t).
| Region | Cropland Loss | Cropland Gain |
|---|
| 0–5° | 5–15° | 15–25° | above 25° | 0–5° | 5–15° | 15–25° | above 25° |
|---|
| Northeast region | 122.58 | 40.35 | 2.57 | 0.00 | 219.86 | 30.30 | 1.75 | 0.00 |
| Inner Mongolia and along the Great Wall region | 86.16 | 38.92 | 1.67 | 0.00 | 90.80 | 11.61 | 0.35 | 0.00 |
| Huang-Huai-Hai region | 548.89 | 10.97 | 1.31 | 0.00 | 38.21 | 0.28 | 0.00 | 0.00 |
| Loess plateau region | 90.23 | 55.66 | 43.52 | 4.35 | 5.52 | 0.89 | 0.29 | 0.00 |
| Middle and lower Yangtze region | 818.79 | 48.01 | 11.38 | 1.14 | 37.59 | 12.48 | 4.84 | 0.32 |
| Southwest region | 90.38 | 61.03 | 52.29 | 5.23 | 3.57 | 14.85 | 5.28 | 0.27 |
| Gansu-Xinjiang region | 71.31 | 2.78 | 0.19 | 0.00 | 591.86 | 5.16 | 0.17 | 0.00 |
| Qinghai-Tibet region | 0.57 | 0.63 | 2.02 | 0.20 | 2.20 | 0.21 | 0.06 | 0.01 |
| South China region | 160.77 | 17.57 | 4.98 | 0.50 | 5.30 | 2.07 | 0.86 | 0.12 |
A net increase of production potential was found on slopes of 0–5° in the northeast region, Inner Mongolia and along the Great Wall region, Gansu Xinjiang region, and Qinghai Tibet region. For the other regions, the loss of production potential caused by the cropland loss was more than the increase of production potential caused by the reclamation of cropland. The net loss in production potential caused by cropland conversion on 0–5° slopes was more than 780 × 104 t in the Middle and lower Yangtze region, and 510.68 × 10⁴ t in the Huang Huai Hai region.
On other slopes, the loss of production potential caused by the cropland loss was more than increase in production potential created by cropland reclamation, except on the slopes of 5–15° in the Gansu Xinjiang region. The net loss in production potential on other slopes was less than net loss of production potential on the 0–5° slopes. Net losses in production potential on the slopes of 5–15°, 15–25°, and above 25° were 198.07 × 10⁴ t, 106.33× 10⁴ t, 10.70 × 10⁴ t, respectively.
As a result, the loss of production potential caused by cropland loss was much more than increase in production potential of cropland gain, and the net change was negatively correlated with slope; the steeper the slope, the smaller the net change. This showed that the loss of good quality cropland would lead to a significant loss of production potential.
The average production potential per km
2 of cropland loss was more than that of cropland gain on the each level of slope (
Table 5). The greatest difference per km
2 between cropland loss and cropland gain was 550.15 t on 0–5°slopes; the second largest difference per km
2 was 277.33 t on 15–25° slopes. The differences on 5–15° slopes and greater than 25° were relative smaller, or 220.01 t and 79.59 t, respectively.
In Gansu-Xinjiang region, the average production potential per km2 of cropland loss was less than that of cropland gain on 0–5°, 5–15° and 15–25° slopes. In South China region, the average production potential per km2 of cropland loss was less than that of cropland gain on 0–5°, 5–15° and >25° slopes, and the value of cropland loss was more than that of cropland gain on 15–25° slopes. In the other seven regions, the average production potential per km2 of cropland loss was more than that of cropland gain on 0–5°, 5–15° and 15–25° slopes. The biggest values of average production potential per km2 of cropland loss was 1819.34 t in the Middle and lower Yangtze region, and 1781.14 t in the Huang-Huai-Hai region. The greatest differences in average production potential per km2 between cropland loss and gain was also in these two regions on slopes 5–15°: 1076.08 t in the Huang-Huai-Hai region and 1036.35 t in the Middle and lower Yangtze region.
Table 5.
Average production potential per unit area associated with the slope of cropland loss and gain in China from 2000 to 2010 (t·km−2).
Table 5.
Average production potential per unit area associated with the slope of cropland loss and gain in China from 2000 to 2010 (t·km−2).
| Region | Cropland Loss | Cropland Gain |
|---|
| 0–5° | 5–15° | 15–25° | above 25° | 0–5° | 5–15° | 15–25° | above 25° |
|---|
| Northeast region | 1198.17 | 1153.24 | 1282.14 | - | 1003.47 | 761.65 | 721.74 | - |
| Inner Mongolia and along the Great Wall region | 473.28 | 605.20 | 601.70 | - | 460.99 | 453.47 | 588.63 | - |
| Huang-Huai-Hai region | 1781.14 | 1365.02 | 1154.23 | - | 705.06 | 1243.21 | - | - |
| Loess plateau region | 1452.35 | 817.76 | 721.48 | 1436.22 | 416.00 | 406.15 | 232.83 | - |
| Middle and lower Yangtze region | 1819.34 | 1545.52 | 990.31 | 880.30 | 1271.71 | 1212.97 | 742.16 | 348.97 |
| Southwest region | 1549.34 | 983.11 | 666.75 | 155.07 | 1143.92 | 681.72 | 272.38 | 76.52 |
| Gansu-Xinjiang region | 879.57 | 642.85 | 692.65 | - | 941.37 | 909.31 | 717.89 | - |
| Qinghai-Tibet region | 295.15 | 319.16 | 396.27 | 19.54 | 261.82 | 203.64 | 172.70 | 38.42 |
| South China region | 970.90 | 914.65 | 408.75 | 174.89 | 1200.01 | 1152.32 | 396.67 | 292.73 |
| Total | 1409.50 | 938.35 | 690.41 | 222.69 | 859.35 | 718.34 | 413.08 | 143.10 |
3.3. The Relationship between Elevation and Production Potential of Cropland Loss and Gain
The loss of production potential caused by the cropland loss below elevations of 100 m was 1472.39 × 10
4 t, which was significantly greater than that at other elevations (
Table 6). The increase in production potential caused by the cropland gain below elevations of 100 m was only 166.41 × 10
4 t. The loss of production potential at low elevations caused by cropland loss was about 784.75 × 10
4 t in the Middle and lower Yangtze region and 498.1 × 10
4 t in the Huang Huai Hai region, accounting for 32.84%, 20.85% of the total productivity loss, respectively, while the gain of production potential was only 73.42 × 10
4 t in these two regions. That is, most of the loss of production potential in China was in favorable terrain conditions at elevations <100 m, while cropland was rarely gain at this range of elevation.
Table 6.
Production potential change associated with the elevation of cropland loss and gain in China from 2000 to 2010 (× 104 t).
Table 6.
Production potential change associated with the elevation of cropland loss and gain in China from 2000 to 2010 (× 104 t).
| Region | Cropland Loss | Cropland Gain |
|---|
| <100 m | 100–200 m | 200–800 m | >800 m | <100 m | 100–200 m | 200–800 m | >800 m |
|---|
| Northeast region | 35.68 | 45.24 | 84.10 | 0.44 | 85.15 | 97.19 | 67.91 | 1.76 |
| Inner Mongolia and along the Great Wall region | 0.11 | 7.75 | 26.25 | 92.79 | 0.02 | 11.60 | 46.23 | 44.85 |
| Huang-Huai-Hai region | 498.10 | 54.61 | 8.18 | 0.00 | 37.64 | 0.62 | 0.09 | 0.00 |
| Loess plateau region | 0.00 | 7.17 | 72.52 | 111.41 | 0.00 | 0.20 | 4.32 | 2.18 |
| Middle and lower Yangtze region | 784.75 | 61.61 | 31.00 | 1.17 | 35.78 | 5.61 | 13.48 | 0.39 |
| Southwest region | 1.57 | 7.41 | 121.46 | 84.87 | 0.04 | 0.08 | 6.46 | 17.39 |
| Gansu-Xinjiang region | 0.23 | 0.00 | 8.75 | 65.16 | 2.97 | 0.18 | 216.79 | 377.20 |
| Qinghai-Tibet region | 0.00 | 0.00 | 0.01 | 4.74 | 0.00 | 0.00 | 0.00 | 2.48 |
| South China region | 151.95 | 8.82 | 3.33 | 8.11 | 4.81 | 0.53 | 0.50 | 0.81 |
Compared with elevations below 100 m, the loss of production potential was lower at elevations of 100–200 m. A loss of only 192.61 × 10⁴ t in production potential was observed in lost cropland and was mainly distributed in the Middle and lower Yangtze region and Huang Huai Hai region, and the increase in production potential of cropland gain was less than production potential loss in this level of elevation. In the 200–800 m elevation range, the loss and gain of production potential was nearly equal, about 355 × 104 t. The loss of production potential caused by cropland loss at elevations >800 m was more than that at elevations of 100–200 m, 200–800 m, but less than that at elevations <100 m. The increase in production potential caused by cropland gain at elevations >800 m was more than that at the other elevations. About 377.2 × 10⁴ t of production potential had been gained in the Gansu Xinjiang region, accounting for 34.76% of the total increase in production potential in China.
The average production potential per km
2 of cropland loss was more than that of cropland gain at the elevations of <100 m, 100–200 m and 200–800 m (
Table 7). The differences per km
2 between cropland loss and cropland gain at elevations <100 m and 100–200 m were both nearly 517 t. The difference at elevations of 200–800 m was 397.36 t. The average production potential per km
2 of cropland loss was less than that of cropland gain at the elevations of >800 m, and the difference per km
2 between cropland loss and cropland gain was 143.16 t.
In the Inner Mongolia and along the Great Wall region, Huang-Huai-Hai region, Loess plateau region, Middle and lower Yangtze region, Southwest region and Qinghai-Tibet region, the average production potential per km2 of cropland loss was more than that of cropland gain at all four elevations. The biggest values of average production potential per km2 of cropland loss was 1805.98 t in the Middle and lower Yangtze region, and 1775.99 t in the Huang-Huai-Hai region at elevations <100 m. The greatest differences in average production potential per km2 between cropland loss and gain was 1603.05 t in the Gansu-Xinjiang region at elevations <100 m.
Table 7.
Average production potential per unit area associated with the elevation of cropland loss and gain in China from 2000 to 2010 (t·km−2).
Table 7.
Average production potential per unit area associated with the elevation of cropland loss and gain in China from 2000 to 2010 (t·km−2).
| Region | Cropland Loss | Cropland Gain |
|---|
| <100 m | 100–200 m | 200–800 m | >800 m | <100 m | 100–200 m | 200–800 m | >800 m |
|---|
| Northeast region | 1289.80 | 1199.43 | 1155.38 | 352.95 | 1451.88 | 931.36 | 704.35 | 918.13 |
| Inner Mongolia and along the Great Wall region | 1182.24 | 576.69 | 635.22 | 476.68 | 442.92 | 479.62 | 482.75 | 434.99 |
| Huang-Huai-Hai region | 1775.99 | 1769.82 | 1499.89 | - | 709.74 | 575.99 | 1393.78 | - |
| Loess plateau region | - | 1387.96 | 1652.46 | 771.48 | - | 585.73 | 442.60 | 328.08 |
| Middle and lower Yangtze region | 1805.98 | 1720.45 | 1332.51 | 817.41 | 1198.14 | 1283.36 | 1000.45 | 489.50 |
| Southwest region | 1311.03 | 795.43 | 1254.30 | 677.80 | 443.70 | 365.09 | 365.92 | 583.07 |
| Gansu-Xinjiang region | 2215.71 | - | 854.14 | 868.16 | 612.66 | 504.76 | 1023.06 | 903.50 |
| Qinghai-Tibet region | - | - | 1379.78 | 248.14 | - | - | - | 246.97 |
| South China region | 935.65 | 1128.36 | 922.24 | 499.41 | 1281.99 | 985.50 | 767.39 | 392.08 |
| Total | 1624.34 | 1374.47 | 1195.63 | 638.57 | 1107.34 | 856.53 | 798.27 | 781.73 |
4. Discussion
In steep slope areas, soils had low fertility and poor water holding capacity, road density was small, transportation costs of food were high, and farmers had relatively lower agricultural input, which may cause agricultural productivity to decline as slope increases. Additionally, in high elevation areas, transportation costs of food were high, little human activity, and farming in these areas required higher labor costs. As a result, agricultural productivity was low in high elevation areas.
Previous researchers have documented the presence of some relationships between agricultural productivity and terrain conditions. Zhou proved that agricultural output of per unit area declined with an increase in elevation, and a similar relationship existed between slope and cropland in the Three Gorges Reservoir area [
18]. Wei
et al. found that high quality cropland distributed in the areas below 400 m and on slopes less than 15° in Wengyuan County, Guangdong Province [
19]. Li
et al. documented a significant negative correlation between slope gradient and energy input-output ratios in Wugou Village, Henan province [
25]. The Three Gorges Reservoir area was in the Southwest region. Wengyuan County was in the Middle and lower Yangtze region. Wugou Village was in the Loess plateau region. Those results support our results, showing that terrain affects agricultural productivity. As noted above, optimal terrain conditions for agricultural cultivation were found on 0–5° slopes and at low elevations. Steeper slopes or higher elevations will limit agricultural productivity. In China, we found croplands losses had a higher value of average productivity per unit area in areas with lower slope and elevation. Meanwhile, we found croplands gains with a lower average productivity per unit area in areas with higher slopes and elevations. Most croplands losses were in areas with greater agriculture potential productivity, and croplands gains tended to be created in areas with lower agriculture potential productivity during the first decade of the 21st century.
The losses of agricultural potential productivity were serious in the middle and lower Yangtze region (878.90 × 10⁴ t) and the Huang-Huai-Hai region (561.27 × 10⁴ t). In the middle and lower Yangtze, 690.69 × 10⁴ t losses of agricultural potential productivity due to urbanization, the losses were 484.90 × 10⁴ t in the Huang-Huai-Hai region, accounting for 78.59% and 86.39% of the total losses of agricultural potential productivity in the region, respectively. These two regions have large plain areas and favorable conditions for agriculture. Terrain conditions of cropland losses in these two regions were quite good. In the middle and lower Yangtze and Huang-Huai-Hai region, the losses of agricultural potential productivity due to urbanization were 651.21 × 10⁴ t, 475.89 × 10⁴ t on the slopes of 0–5°, and 626.13 × 10⁴ t, 440.42 × 10⁴ t at the elevations <100 m, respectively.
Northeast region is an important base of agricultural production in China with large areas of plain and fertile land. The gains of production potential was 251.93 × 10⁴ t in this area. Production potential gains were mainly from woodland 85.98 × 10⁴ t (34.13%), unused land 85.04 × 10⁴ t (33.76%) and grassland 75.06 × 10⁴ t (29.79%). 69.96% of production potential from woodland was on the slopes of 0–5°, and 32.1% at the elevations <100 m. 99.18% of production potential from unused land was on the slopes of 0–5°, and 50.13% at the elevations <100 m. 69.08% of production potential from grassland was on the slopes of 0–5°, and 50.04% at the elevations 100–200 m. Terrain conditions of croplands gains in this region was very well, that made contributions to the sustainability of China’s food supply. In the Gansu-Xinjiang region, the gains of production potential was 597.19 × 10⁴ t, that was mainly from grassland (60.86%). Solar radiation energy of Gansu-Xinjiang region is abundant, and rainfall is very little in this area. Limited by water resources, the production potential maybe increased the most in China, but the actual agricultural production may not increase so much. This area mainly planted economic crops, such as cotton and sugar, because the cost of transport grain crops to other regions was high.
Based on data from the 2011 China Statistical Yearbook, nearly 70% of all food production was in the major grain-producing areas in China, including Anhui, Hebei, Heilongjiang, Henan, Hunan, Jiangsu, Jiangxi, Jilin, Shandong, and Sichuan. Most of these provinces were in the Huang-Huai-Hai region, Middle and lower Yangtze region and Northeast region, while the results showed that the net loss of production potential was 1346.44 × 104 t in the Huang-Huai-Hai region and Middle and lower Yangtze region, accounting for 2.17% of the entire production potential in these two regions in 2000.
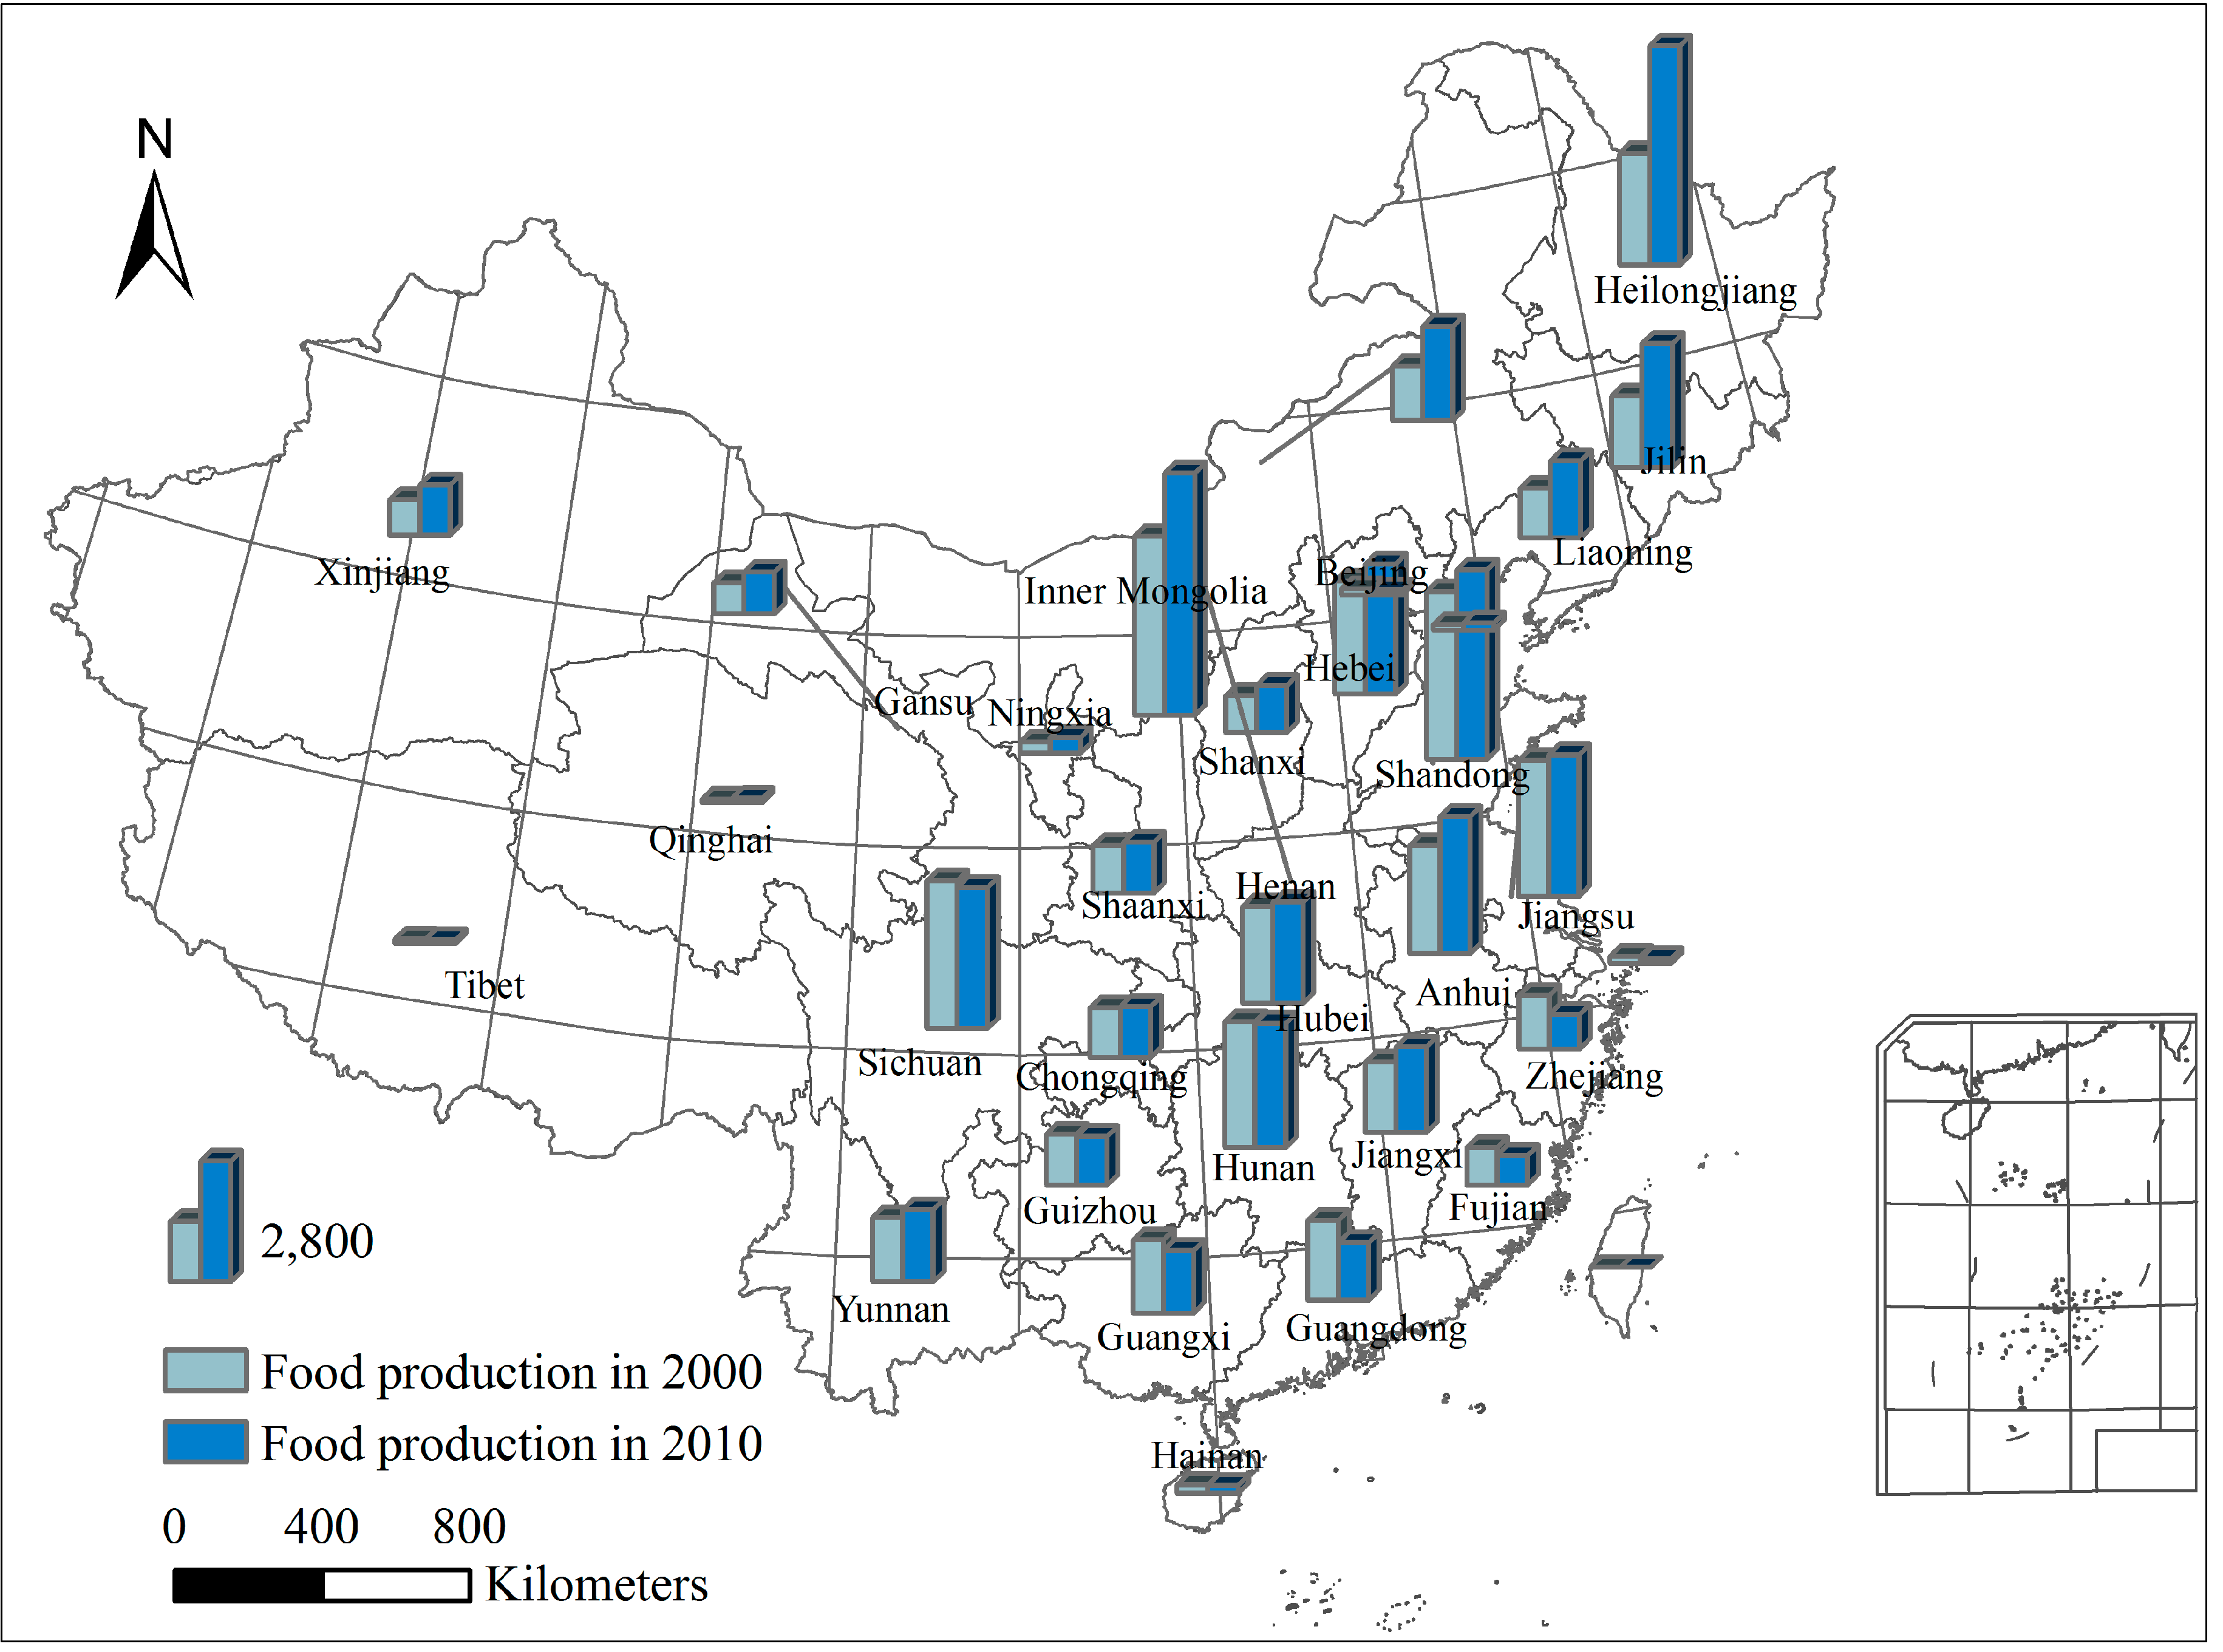
Over the past decade, as technology advanced, the use of chemical fertilizers and pesticides has increased, cropland management improved, and efficiency in farming has been greatly improved. However, the food production decreased in 11 provinces, covering nearly 35.5% of all provinces of China (
Figure 2). One of the possible reasons for the decrease in agricultural production was that provinces with croplands losses could produce more food, while croplands gains could produce less food. If China continues to lose high quality cropland, food production will inevitably decline in the near future. Therefore, efforts to cropland gain should focus not only on total area but also on the quality of agricultural potential production in different types of terrain.
Figure 2.
Food production in China’s provinces in 2000 and 2010.
Figure 2.
Food production in China’s provinces in 2000 and 2010.
5. Conclusions
The techniques used in this study calculated the agricultural potential productivity of China in 2000 and 2010, and analyzed the impact of topographical characteristics of croplands losses and gains on agricultural potential productivity in nine agricultural zones from 2000 to 2010. Our results may provide valuable insights that could help improve China’s land use policies to meet national and regional food security.
The results showed: (1) From 2000 to 2010, the net loss of production potential in China caused by the cropland transformation was 1314.88 × 104 t, which account for 1.05% of the total production potential in 2000. The production potential of cropland loss was much greater than that of cropland gain in most regions. The greatest loss of production potential caused by cropland loss was in the middle and lower Yangtze region (878.90 × 10⁴ t) and the Huang-Huai-Hai region (561.27 × 10⁴ t); (2) Topographical characteristics of croplands losses and gains actually impacted the agricultural potential productivity in China, the losses of agricultural potential productivity were serious in regions with good terrain conditions, where the slope was lower than 5° and the elevation was below 100 m, especially in the middle and lower Yangtze region and the Huang-Huai-Hai region. During the first decade of the 21st century, during the process of cropland transformation policy implementation, a large number of high-quality cropland resources were lost. Simultaneously, the terrain conditions of expanded cropland were poor. This combination is expected to negatively affect the stability of China’s food supply.
China’s current national land use policy calls for the replacement of croplands losses with expanded croplands by tracking land use at the provincial level. Based on our analysis, this selection of expanded cropland areas should focus not only on the total area involved but also on the quality of the expanded land, such as the different terrain conditions of the croplands. The conditions of the expanded cropland should be investigated and assessed. This should include a periodic census of the area and an assessment of changes in agricultural productivity of both croplands losses and gains, to make sure that the replacement of croplands losses with expanded land will not result in a loss in national agricultural productivity during the process of cropland transformation. Simultaneously, when policy makers make the planning to control of the use of a land, should also consider the terrain conditions of cropland, to ensure the agricultural productivity.


