Article

Meeting the Electrical Energy Needs of a Residential Building with a Wind-Photovoltaic Hybrid System

by
Mohammad Hosein Mohammadnezami
1,
Mehdi Ali Ehyaei
1,
Marc A. Rosen
2 and
Mohammad Hossein Ahmadi
1,*
1
Department of Mechanical Engineering, Pardis Branch, Islamic Azad University, Pardis New City, Iran
2
Faculty of Engineering and Applied Science, University of Ontario Institute of Technology, 2000 Simcoe Street North, Oshawa, ON L1H 7K4, Canada
*
Author to whom correspondence should be addressed.
Sustainability 2015, 7(3), 2554-2569; https://0-doi-org.brum.beds.ac.uk/10.3390/su7032554
Submission received: 11 December 2014 / Revised: 2 February 2015 / Accepted: 11 February 2015 / Published: 3 March 2015
(This article belongs to the Section Energy Sustainability)

Abstract

:
A complete hybrid system including a photovoltaic cell, a wind turbine, and battery is modeled to determine the best approach for sizing the system to meet the electrical energy needs of a residential building. In evaluating system performance, the city of Tehran is used as a case study. Matlab software is used for analyzing the data and optimizing the system for the given application. Further, the cost of the system design is investigated, and shows that the electrical cost of the hybrid system in Tehran is 0.62 US$/kWh, which is 78% less expensive than a wind turbine system and 34% less expensive than a photovoltaic system.

1. Introduction

Since the oil crises of the 1970s, solar and wind power have become increasingly significant, attractive and cost-effective. In recent years, the hybrid PV/wind system has become a viable alternative to satisfy environmental protection requirements and electricity demands. With the complementary characteristics of solar and wind energy resources for certain locations, hybrid PV/wind systems with storage units sometimes are advantageous options for supplying small electrical loads at remote locations that lack utility grid power.
Today, hybrid PV/wind systems are able to offer a high reliability of power supply, but some concerns remain regarding their applications. Due to the stochastic behavior of both solar and wind energy, some major challenges in the design of a HPWS (hybrid photovoltaic and wind turbine system) are the reliability of the supply of power to consumers under varying atmospheric conditions and at reasonable costs. To use solar and wind energy resources more efficiently and economically, the optimum size of a hybrid PV/wind system with batteries is an important consideration.
Various optimization techniques for hybrid PV/wind system sizing have been reported [1,2]. A novel description of the production/consumption phenomenon has been developed and this information has been used to propose a new sizing procedure [2]. Using this procedure, the authors obtain the optimum battery capacity, with the optimum number of PV modules and wind turbines, subject to minimum costs. The authors also determine energy balances and conversion efficiencies for the components of a system, and propose potential improvements to increase efficiency and the surplus energy produced by the wind/solar generator. Energy and exergy analyses have been performed to allow extrapolation of the results to real stand-alone applications providing an uninterrupted power supply to receptors isolated from the grid [3]. An optimal sizing method has been presented, and used to optimize configurations of a hybrid solar-wind system employing battery banks based on a genetic algorithm (GA) to attain the global optimum with relative computational simplicity, and to calculate the optimum system configuration that can achieve the required loss of power supply probability (LPSP) for customers with a minimum annualized cost of system [4]. A simulation has been presented for analyzing the probability of power supply failure in hybrid photovoltaic-wind power generation systems incorporating a storage battery bank and the reliability of the systems. They also presented a case study of hybrid solar-wind power supply for telecommunication systems, which has been analyzed [5]. An exergy analysis has been conducted of the operation of a test-bed hybrid wind/solar generator with hydrogen support [6]. With PV modeling, the effect of using a multi-axis sun–tracking system on electrical generation has been determined and its performance evaluated for the city of Monastir, Tunisia. This investigation considered the effect of azimuth and tilt angles on the output of the photovoltaic panels [7]. The component design and cost of a PV system required to satisfy given energy requirements have been determined and the payback period calculated for the suggested stand-alone PV system [8]. The possibility of improving wind-energy capture under low wind speed conditions in built-up areas has been determined [9]. That work describes the design of a small wind generator for domestic use and the methodology of applying physical tests conducted in a boundary layer wind tunnel and computer modeling using a CFD code [9]. An exergy analysis of atypical wind turbine model (Bargey Excel-S) in two cities of Iran showed that, with regard to the annual average wind data, by varying the cut in, the annual average production is increased by about 20% and the entropy generation is decreased about 77% (2009) [10]. The component design and cost of a PV system to supply the desired energy and the payback period for the suggested stand-alone PV system have been evaluated [11]. Sizing algorithms have been developed for PV modules, wind generators and batteries [12]. The accumulation of energy obtained from renewable sources and stored as hydrogen, for satisfying the electrical supply of several islands, has been determined [13]. An hourly management method has been developed for determining the energy generated in grid-connected wind farms using hydrogen storage and an hourly management method proposed for energy generated in grid-connected wind farms by storing electrical energy in batteries [14].
The objective of this research is to determine an optimum hybrid system for meeting the electrical energy needs of a residential building. The hybrid system includes a wind turbine and PV power generation system as well as a battery for energy storage. With the method proposed and explained in this paper, the optimum capacity of the wind turbine, the photovoltaic cell and the battery is determined based on a minimum electricity cost.

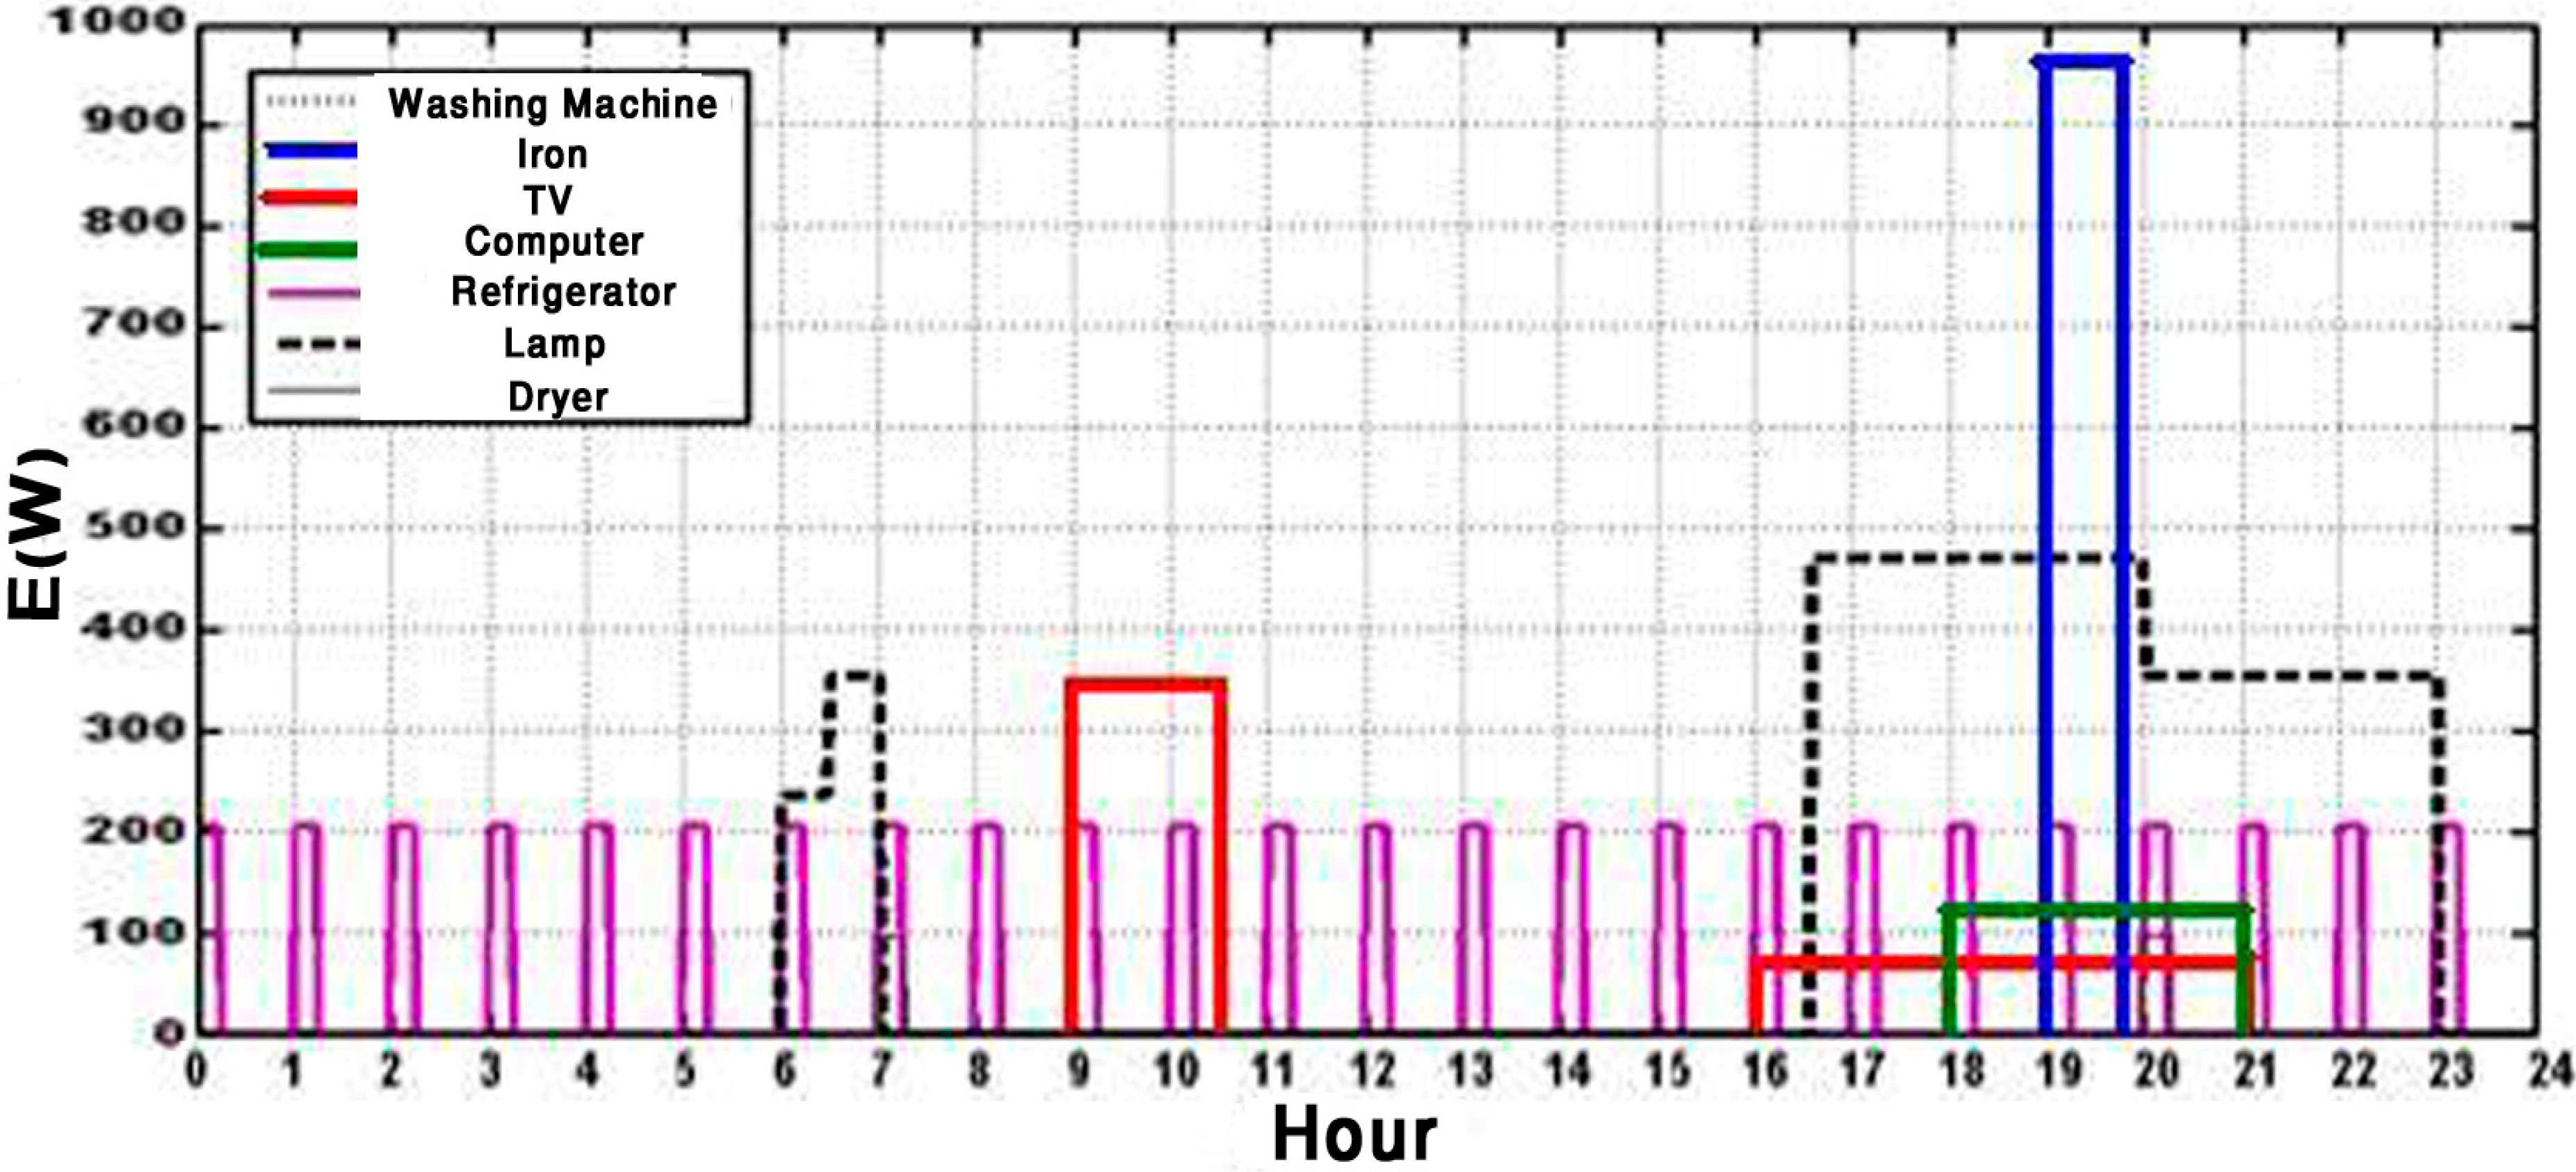
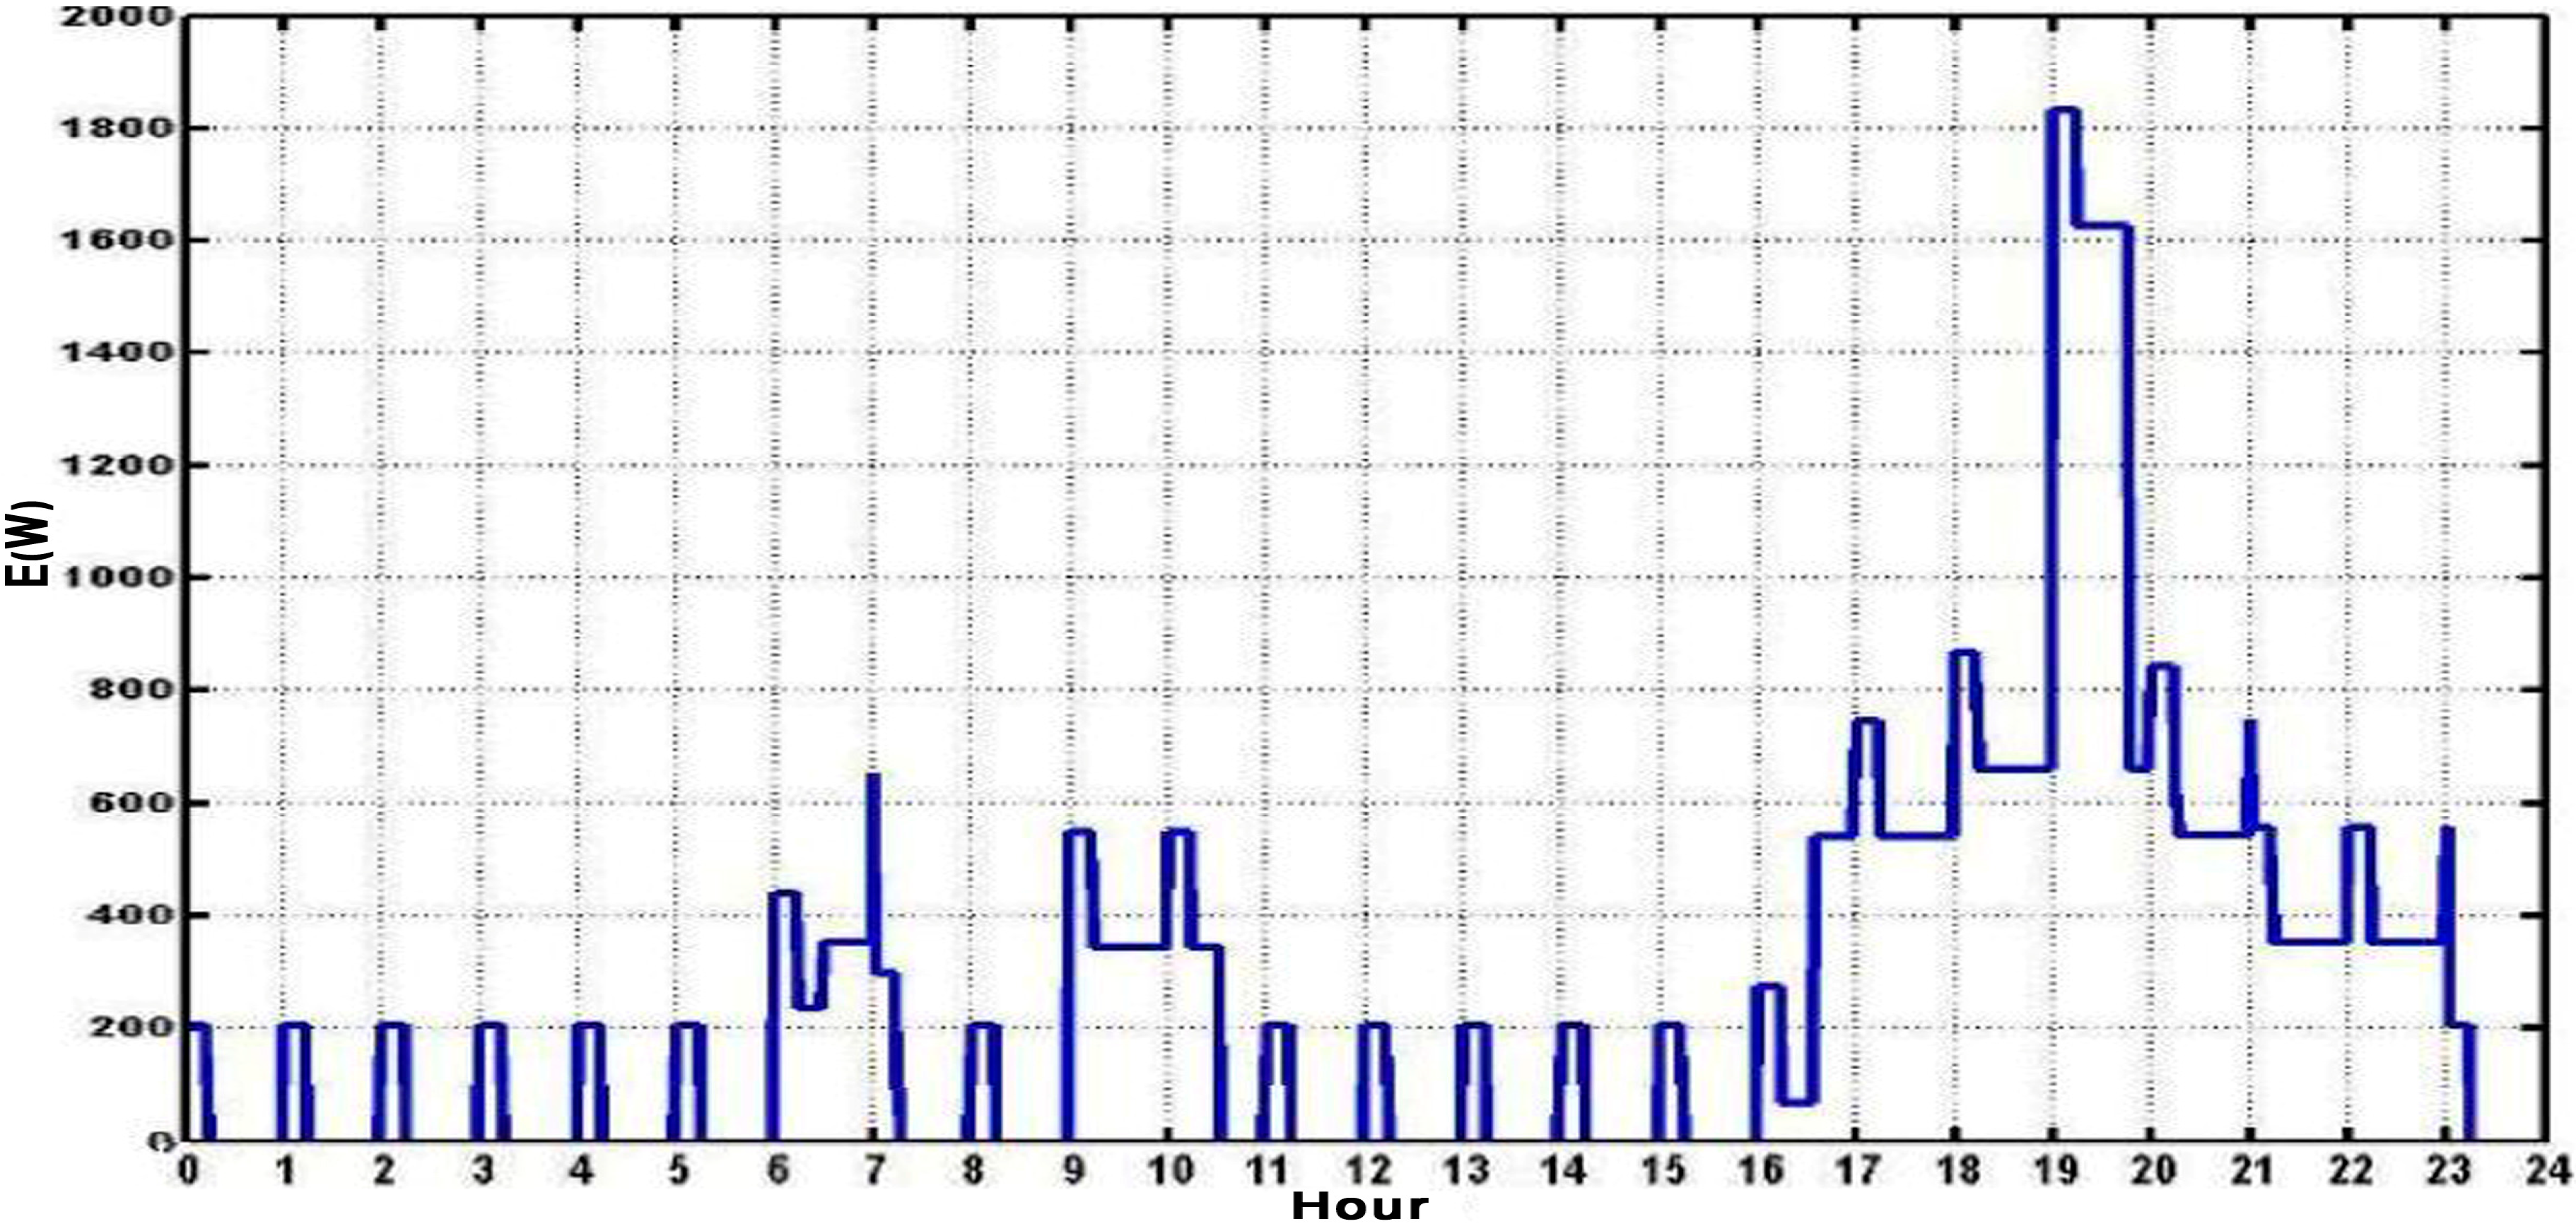
2. Description of Building

The residential building considered in this study is located in Tehran (Province of Iran) and has an average occupancy (four adults). The building has a total floor area of about 200 m2, a height of 3 m, a length of 20 m (aligned in an east-west direction), and a width of 10 m (in a north-south direction). The areas of the windows account for 30% of the area of the south and north walls and 20% of the area of the east and west walls of the building. The external and internal walls are 22 and 12 cm thick, respectively, and are all made of brick with gypsum plaster on the interior walls. The roof is 22 cm thick, and made of brick and roofing materials. No thermal insulation or other energy saving measures is employed in the walls or the roof.
To calculate the electrical load of the building, it is assumed that the 15th day of each month is representative of all the days of the month based on monthly average measurements in this building. These data are registered for 8760 h in the year 2012. To estimate the electrical energy needs of the residential building, we measure the electrical utilization and period of use for each electrical appliance and light. These data are shown in Figure 1 for in 15 January, while Figure 2 displays the total electrical consumption on that day. The electrical loads of the residential building on the 15th of every month are given in Table 1.
Figure 1. Electrical usage and period of use for electrical appliances and lights on January 15.
Sustainability 07 02554 g001
Figure 2. Total electrical consumption of the residential building on January 15.
Sustainability 07 02554 g002
Table 1. Electrical loads (in kW) of the residential building on the 15th of every month.
HourJan.Feb.Mar.Apr.MayJun.Jul.Aug.Sep.Oct.Nov.Dec.
10.0510.0510.0550.0550.0640.0680.070.070.0670.06150.0560.067
20.0510.0510.0550.0550.0640.0680.070.070.0670.06150.0560.067
30.0510.0510.0550.0550.0640.0680.070.070.0670.06150.0560.067
40.0510.0510.0550.0550.0640.0680.070.070.0670.06150.0560.067
50.0510.0510.0550.0550.0640.0680.070.070.0670.06150.0560.067
60.0510.0510.0550.0550.0640.0680.070.070.0670.06150.0560.067
70.410,410.0550.0550.0640.0680.070.070.0670.06150.0560.067
80.210.210.210.210.2170.2210.2170.2230.220.2150.210.204
90.210.210.210.210.2170.2210.2170.2230.220.2150.210.204
100.180.180.1890.1890.1930.1970.20.1990.1960.1910.1850.181
110.180.180.1890.1890.1930.1970.20.1990.1960.1910.1850.181
120.180.180.1890.1890.1930.1970.20.1990.1960.1910.1850.181
130.050.050.060.060.0640.0680.070.070.0670.06150.0560.067
140.050.050.060.060.0640.0680.070.070.0670.06150.0560.067
150.050.050.060.060.0640.0680.070.070.0670.06150.0560.067
160.0510.0510.0550.0550.0640.0680.0710.070.0670.0610.0560.067
170.7140.2420.2460.250.2540.2580.2610.260.2570.2520.7180.714
180.7140.7140.7180.7230.2540.2580.2610.7320.7290.7240.7180.714
190.8050.8060.8070.8140.8170.8220.8170.8230.820.8150.8090.805
200.8050.8060.8070.8140.8170.8220.8170.8230.820.8150.8090.805
210.710.710.7140.7190.7230.7270.730.7290.7260.7210.7150.711
220.520.520.5240.530.5330.5380.540.5390.5360.530.5240.52
230.4050.4050.4090.4140.8140.4220.4240.4170.4210.4160.410.406
240.0510.0510.0550.060.0640.0580.0710.070.0670.0620.0560.052

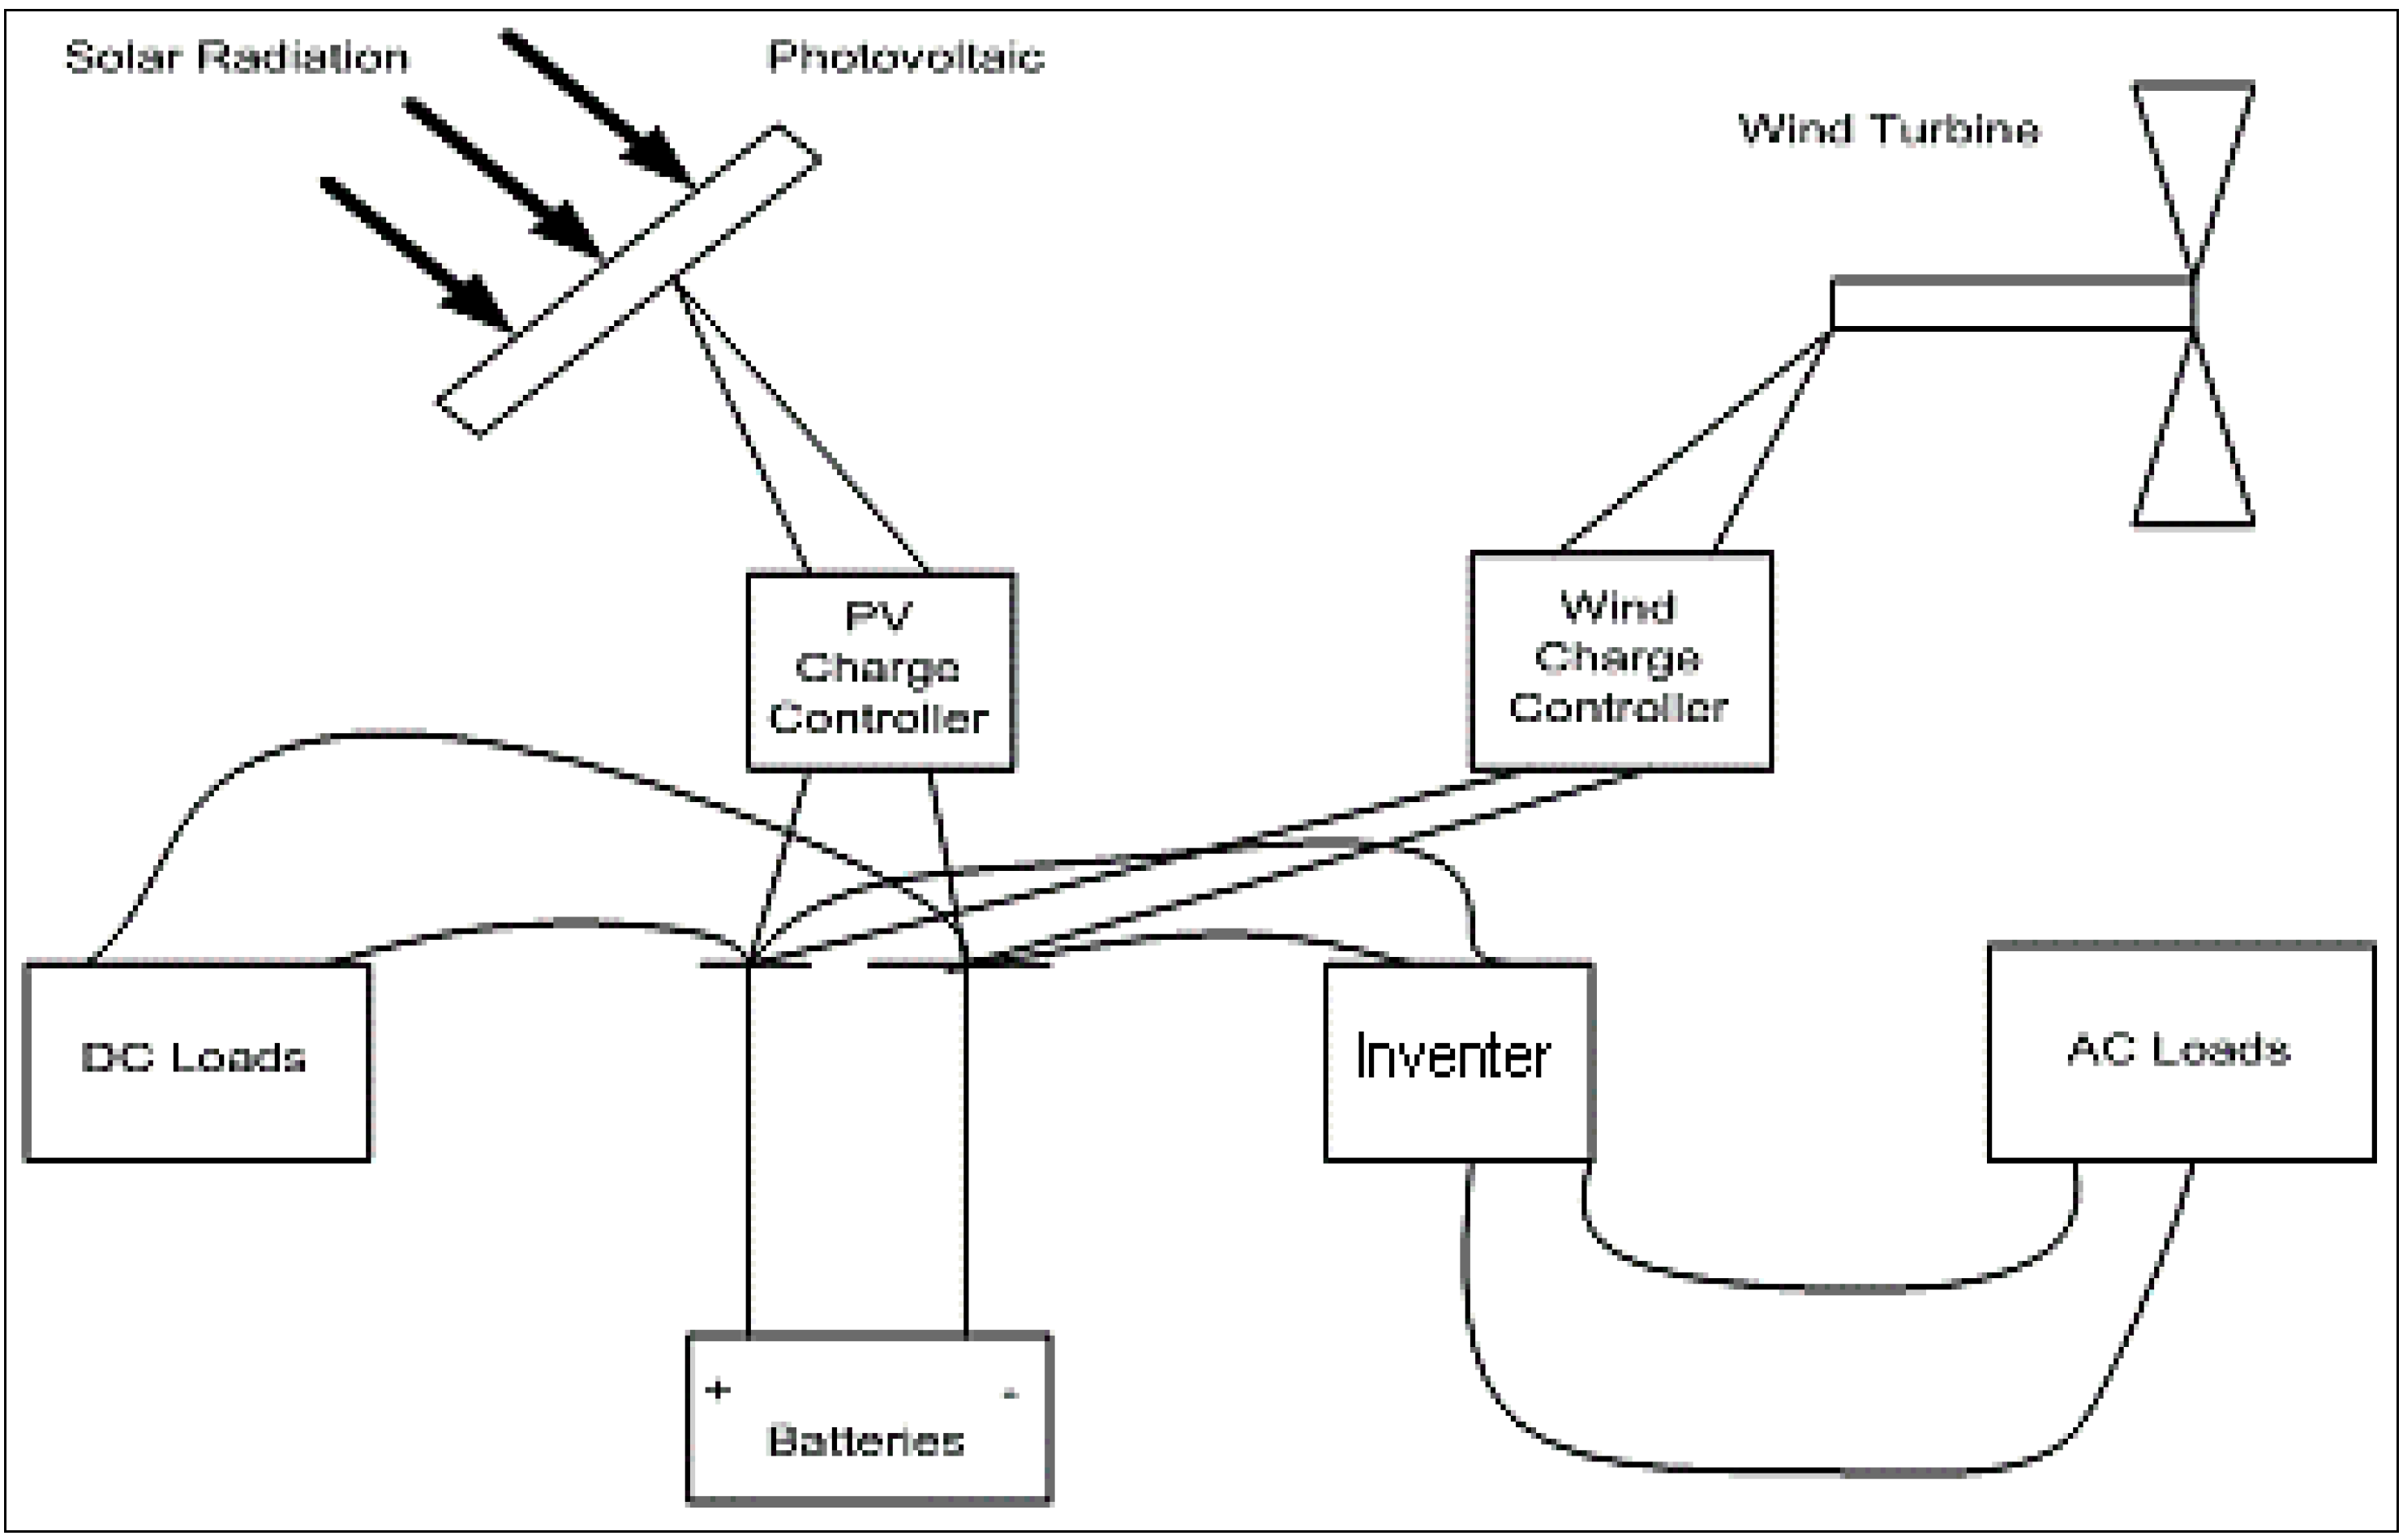
3. Mathematical Models of the Systems

Modeling the energy generated from wind turbines and PV modules together with the energy storage provided by a battery is a critical step for optimization. Data on the operating performances of the system components, which are important in building energy use modeling, are given in Figure 3. There are a number of mathematical models in the literature for both PV modules and wind generators, and many of these models have considered a variety of physical factors for improving accuracy. But as the aim of this study is to illustrate a novel insight into the WPHS (wind photovoltaic cell hybrid system) modeling and to introduce an efficient sizing strategy, complicated component models are avoided and basic mathematical models are for clarity to characterize the system.
Figure 3. General diagram of a hybrid (wind-PV) system [2].
Sustainability 07 02554 g003

3.1. Basic Mathematical Model of PV Modules

The electrical power generated from a PV module can be evaluated as follows:
Ppv = AηGt
where A is the solar cell array area (m2), Gt is the solar radiation incident on the solar cell in its current location (W/m2) and η is the solar cell efficiency. Basic energy models are selected in this study to illustrate the new methodology for WPHS sizing clearly, but the ideas proposed here remain valid and applicable if more precise energy models are used for characterizing the system.
The parameter β, which is used subsequently in Equations (5) and (8), is given as [15]:
β = 360 ( n 1 ) 365
where n is the ordinal date (n = 1 for January 1 and n = 365 for December 31). In terms of ordinal date (n), the declination is expressed as follows [14,15,16]:
δ = 23.45   sin ( 360 284 + n 365 )
Also the solar time ts is expressed as follows:
t s = t c + λ 15 z c + E
Here, Zc is the time zone east of GMT, tc is local time, and
E = (3.82 × 10⁻⁶)(75 + (1868) cosβ − (32,077) sinβ − (14,619) cos(2β) − (40,890) sin(2β))
The hour angle can be written as follows:
w = (ts − 12) × 15°
The zenith angle is expressed in terms of latitude ϕ, declination δ and hour angle was follows [17]:
cosθz = cosϕcosδcosw + sinϕsinδ
The angle of incidence can be expressed as [17]:
cosθ = sinφsinδcosβ − cosφsinδ sinβcosγ + cosφcosδcosβcosw + sinφcosδ sinβcosγcosw + cosδ sinβ sinγsinw
where φ is the latitude, β the mean anomaly, γ the longitude and w the hour angle.
The normal extraterrestrial radiation Gon(W/m2) can be expressed with an accuracy adequate for most engineering calculations as follows [14,15,16]:
G on = G sc ( 1 + 0.033   cos ( 360 n 365 ) )
where Gsc is solar constant (1367 W/m2) and n is ordinal date. The horizontal extraterrestrial radiation can be calculated in terms of the zenith angle θz (degree) as follows:
Goh = Goncosθz
The average extraterrestrial horizontal radiation over a time step can be calculated as [17]:
G oh = ( 12 π ) G on [ cosφcosδ   ( sin w 2 sin w 1 ) + π w 2 w 1 180 sinφsinδ ]
Here, w1 and w2 are the hour angles at the beginning and end of the time step, respectively.
The mean monthly global radiation G ¯ (W/m2) is expressed as follows:
G ¯ = G ¯ b + G ¯ d
where G ¯ b (W/m2) is the mean direct radiation and G ¯ d (W/m2) is the mean diffuse radiation.
The clearness index factor K is defined as the ratio of a particular global radiation to the horizontal extraterrestrial radiation:
k = G ¯ G oh ¯
where Goh (W/m2) is the horizontal extraterrestrial radiation.
From [14,16] we have:
G ¯ d G ¯ = { 0.98 K   ( for   K < 0.2 ) 0.61092 + 3.6259   K 10.17 K 2 + 6.388 K 3 )   ( for   0.22 < K < 0.8 ) 0.672 0.474 K   ( for   K > 0.8 )
The beam radiation on a tilted surface Gbt (W/m2) is expressible as:
Gbt = GbRb
where the geometric factor Rb is given by:
R b = cosθ cos θ z
The Hay–Davies–KlucherRiendl (HDKR) model estimates the absorbed beam, diffuse and ground reflected solar radiation. According to the HDKR model the diffuse component of radiation incident on a tilted surface can be expressed as follows [17]:
G dt = G d   ( R b A i ) + ( 1 A i )   ( 1 + cosβ 2 ) [ 1 + f   sin 3   ( β 2 ) ]
where β is photovoltaic panel slope (degree).
A correction factor for the diffuse radiation that includes the influence of cloudiness is expressed by:
F = G b G
The anisotropy index is given by:
A i = G b G 0
where G0 (W/m2) is the extraterrestrial radiation.
All models assume that the ground reflected component Gr (W/m2) is isotropic as follows [2,4]:
G r = G   ρ   ( 1 cosβ 2 )
where ρ is the albedo coefficient of the ground.
The global radiation on a tilted surface is expressible as
Gt = Gbt + Gdt + Gr
where Gbt (W/m2) is the beam radiation and Gdt (W/m2) is diffuse component radiation, both incident on a tilted surface.
In this study, the HDKR model is applied assuming that the global radiation on tilted surface is as follows:
G t = ( G b + G d A i )   R b + G d ( 1 A i )   R b   [ 1 + f   sin 3   ( β 2 ) ] + G ρ g R b
Here, f is correction factor of diffuse radiation and Rb is a geometric factor.
The energy balance for a unit area of the module, which is cooled by losses to the surroundings, can be written as:
ταGt = ηcGt + UL(Tc − Ta)
where τ is the solar transmittance of the PV array, α the solar absorptance of the PV array, Gt the global radiation striking the PV array, ηC the electrical conversion efficiency of the PV array, UL the coefficient of heat transfer to the surroundings and Ta the ambient temperature.
Accordingly, the PV cell temperature can be expressed as follows [14,15,16]:
T c = T a + G T ( ατ UL ) ( 1 η c ατ )
To estimate the value of ατ UL , we report the nominal operating cell temperature (NOCT), which is defined as the cell temperature that results in an incident radiation of 0.8 kW/m2, an ambient temperature of 20 °C, no load operation (η = 0) and an average speed of 1 m/s. Substituting these values into the above equation and solving for ( ατ UL ):
( ατ UL ) = T c , NOCT T a , NOCT G T , NOCT
where Tc,NOCT is the nominal operating cell temperature, Ta,NOCT the nominal ambient temperature and GT,NOCT the nominal global radiation on a tilted surface.
Therefore we have:
T c = T a + ( T c , NOCT T a , NOCT ) ( G T G T , NOCT ) ( 1 η mp τα )
and
ηmp = ηmp,stc [1 + αp (Tc − Tc,stc)]
The PV array output power is given by:
P PV = Y PV f PV ( G T G T , stc ) [ 1 + α p ( T c T c , stc ) ]
Here, YPV is the rated capacity of the PV array, fPV is its power output under standard test conditions, GT,stc is the PV de rating factor (used to account for such factors as shading, snow cover, aging, etc.), αp is the incident radiation at standard test conditions, Tc is the temperature coefficient of power (which indicates how strongly the PV array power output depends on the cell temperature), and Tc,stc is the PV cell temperature in the current time step.
Operating and design parameters for standard PV technologies are shown in Table 2. In this study we use the Mono-Si model.
Table 2. Parameters needed to determine the variation of panel output with temperature.
PV Module Typeηr (%)NOCT (°C)ρp (1/°C)
Mono-Si13450.4
Poly-Si11450.4
a-Si5500.11
CdTe7460.24
CIS7.5470.46

3.2. Basic Mathematical Model of Wind Generator

Different types of wind generators have different power output performance curves. Consequently, the model used to describe their performance should also differ. A typical model for a wind turbine is described below [18,19,20]:
P e , a v e = P e r { exp ( ( u c c ) k ) exp ( ( u r c ) k ) ( u r c ) k ( u c c ) k exp ( ( u f c ) k ) }
where Pe,ave is the average output power of the wind generator at wind speed V (m/s), Per is the nominal power (kW), uc is the startup rotating speed (m/s), ur is the nominal speed (m/s), uf is the final rotating speed (m/s), and c and k are the coefficients of correlation.
A Bergey Excel-S type of wind turbine is considered, for which characteristics are shown in Table 3.
Table 3. Bergey Excel-S wind turbine characteristics.
Wind turbine charateriticsValues
Cut-in wind speed (m/s)3.1
Rate wind speed (m/s)13.8
Rated power (kW)10
Furling wind speed (m/s)15.6
Type3 blade up wind
Swept area (m2)38.47
Gear boxNon-direct drive
Temperature range (°C)−40 to 60
GeneratorParameters magnet alternator
Tower height (m)24
Wind speed data in Tehran during various months are shown in Table 4.
Table 4. Number of observations (mi) of specific wind speed ui by month in Tehran.
ui (m/s)Jan.Feb.Mar.Apr.MayJun.Jul.Aug.Sep.Oct.Nov.Dec.Annual
1–359628279717698106119966460752
4–625366561536773514237318437
7–1015222032272775610142161
11–16022712321022229
>160000000000000
The electricity cost for a hybrid PV/wind system can be calculated as [21,22]:
C = Cp + CT + CB
where C is the unit total cost (US$/kWh), Cp is the unit electricity cost for the photovoltaic system (US$/kWh), CT is the unit electricity cost for the wind turbine system (US$/kWh) and CB is the unit battery cost (US$/kWh).
The unit electricity cost for the hybrid system can be calculated as [21,22]:
Cp = CI + Co
where CI is the unit installation cost (US$/kWh) and Co is the unit maintenance cost (US$/kWh).
The unit installation cost can be determined as:
C I = C I C f n d
where C is the primary installation cost (US$), I is the initial cost profit, Cf is the average annual electrical use (kWh/day) and nd is a number of days in a year.
The initial cost profit can be calculated as follows:
I = i ( 1 + i ) L ( 1 + i ) L + 1 1
and
C f = P e , ave P er
Here, i is interest rate, L is number of years and Pe,ave is the power generated by the PV system in a year (kWh) and Per is equal to 4 kW.
The unit maintenance cost can be calculated as:
Co = 3% CI
With the same procedure we can calculate CT (US$/kWh) but with Per for a wind turbine equal to 10.
The cost of usage battery can be calculated as follows:
C B C I C f n d
Here, C is the initial installation cost (US$), I is the initial cost profit, and nd is the number of days in a year.
The initial cost profit can be calculated as:
I = i ( 1 + i ) L ( 1 + i ) L + 1 1
Using the above equations, the electrical cost of our system is calculated to be 0.6225 US$/kWh for one unit Bergey Excel-S wind turbine and a 26.6 m2 Mono-Si photovoltaic panel square.

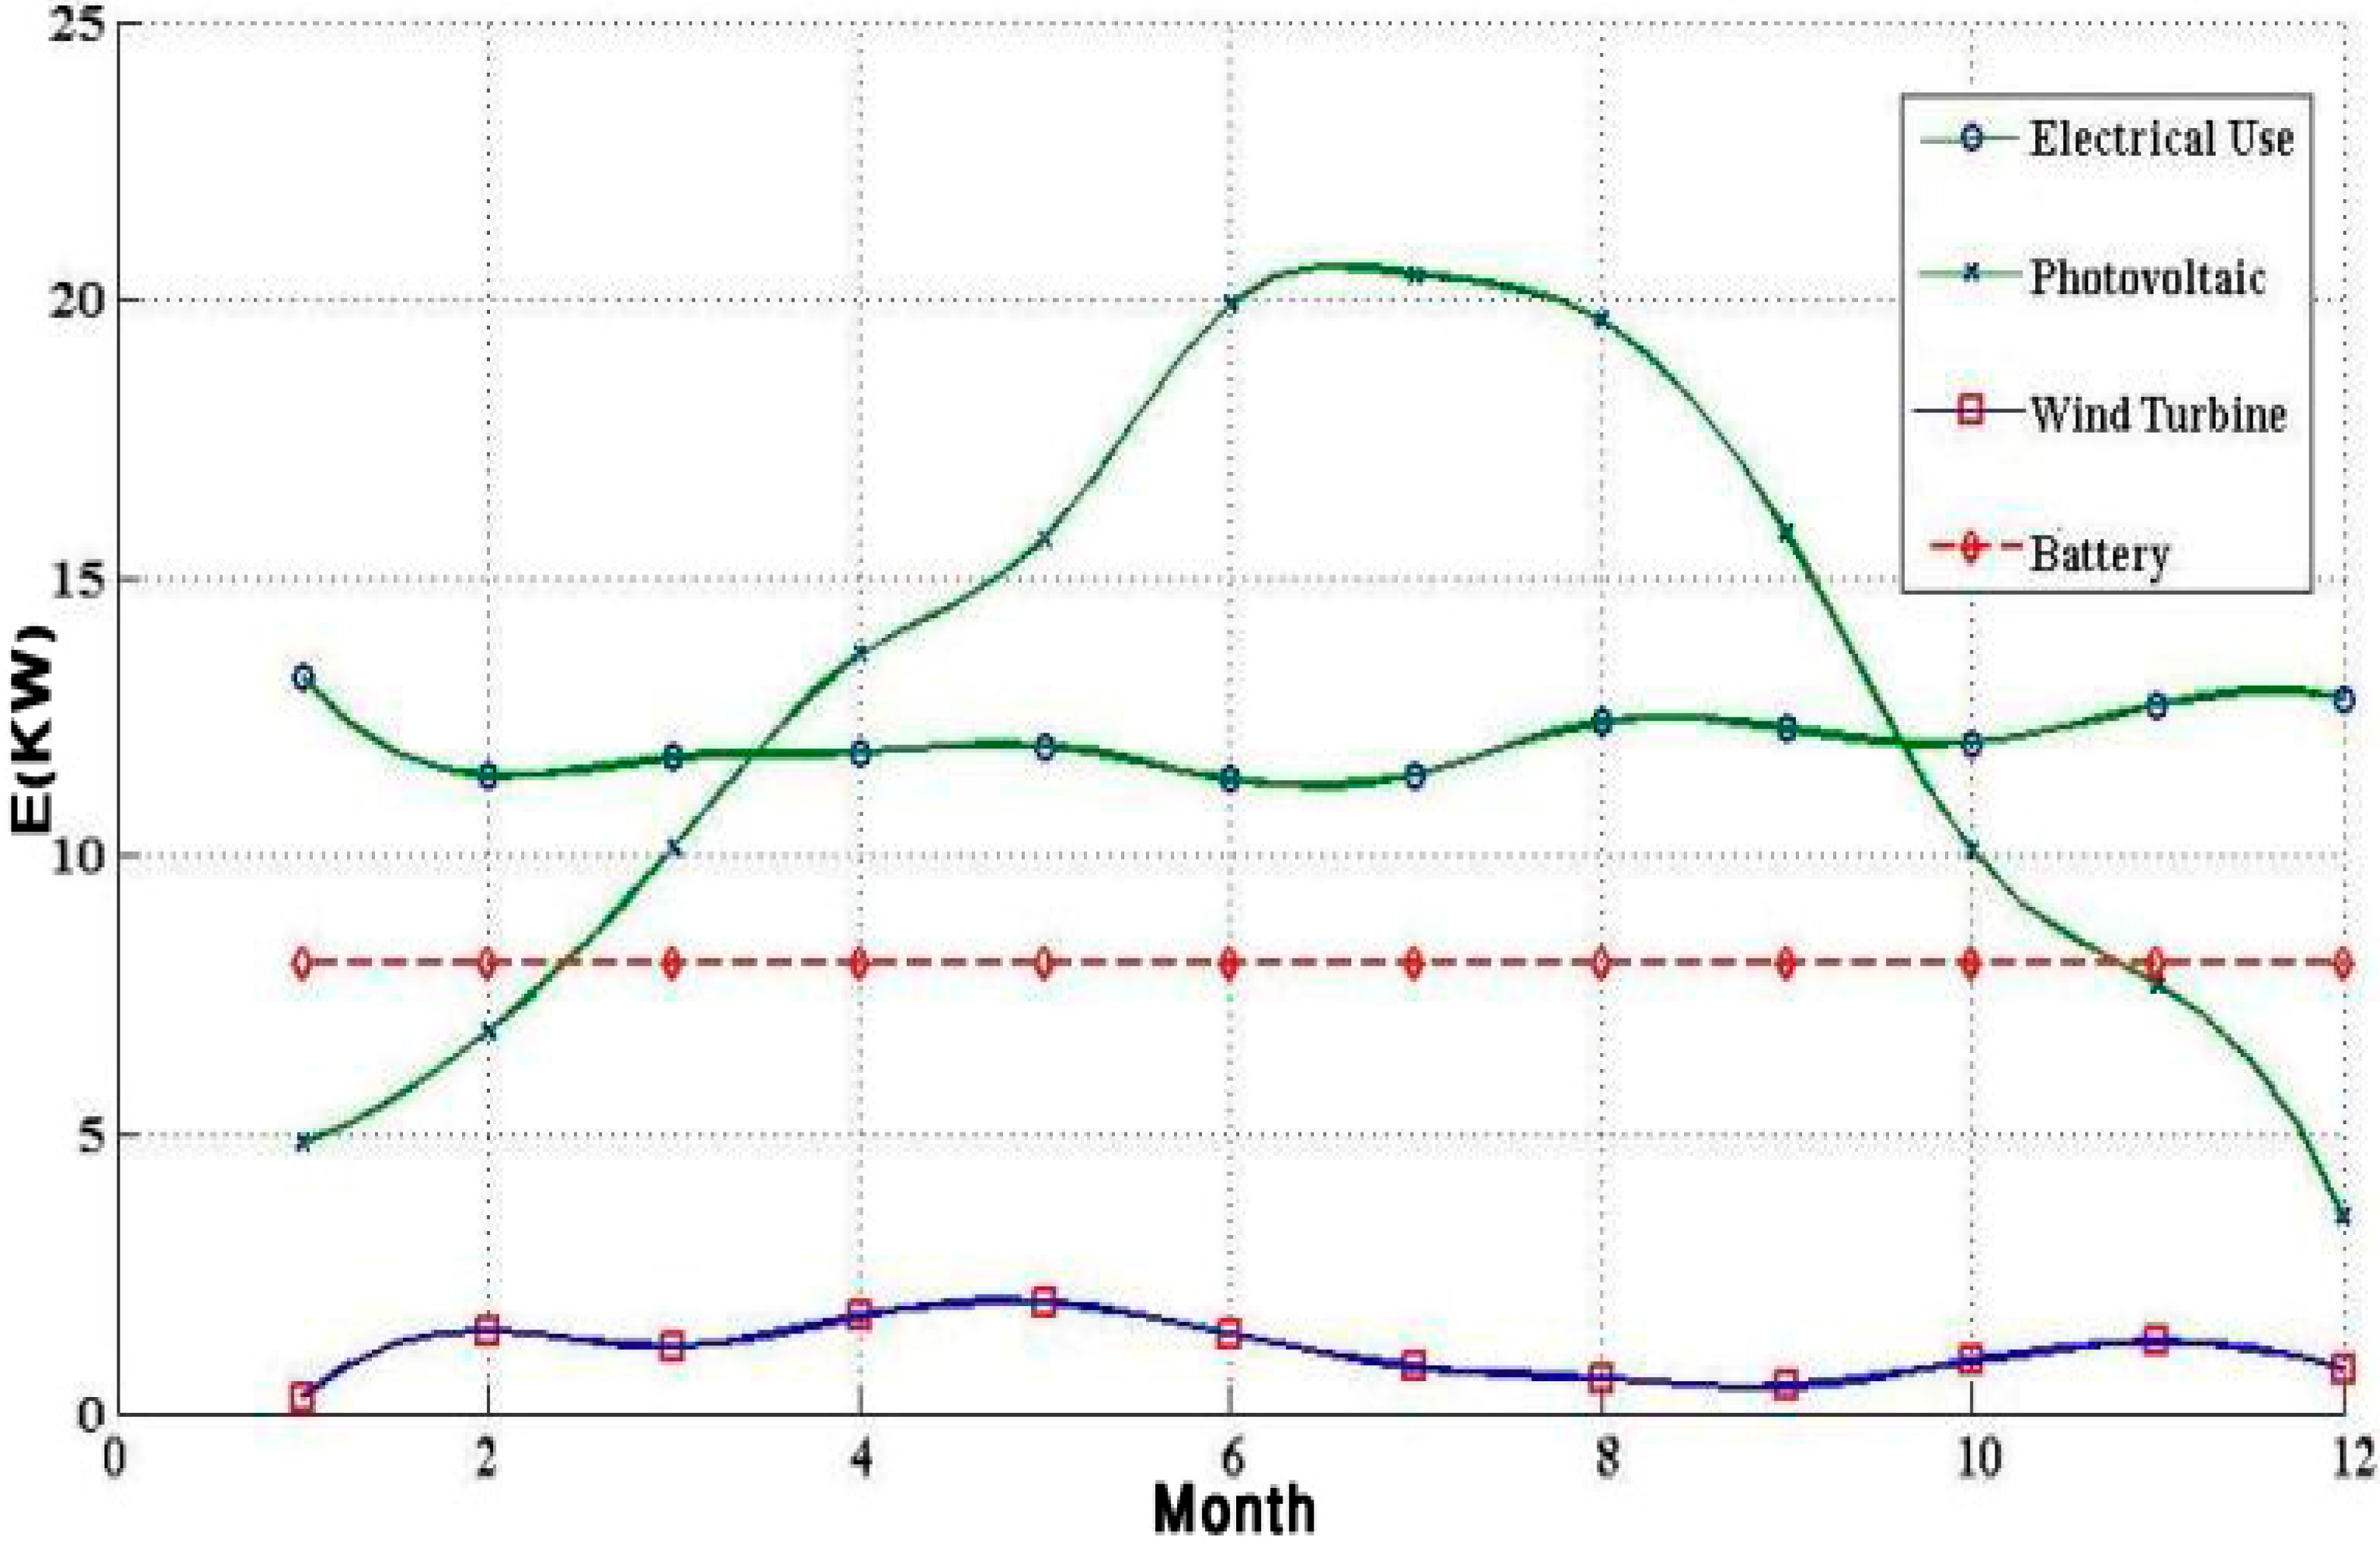
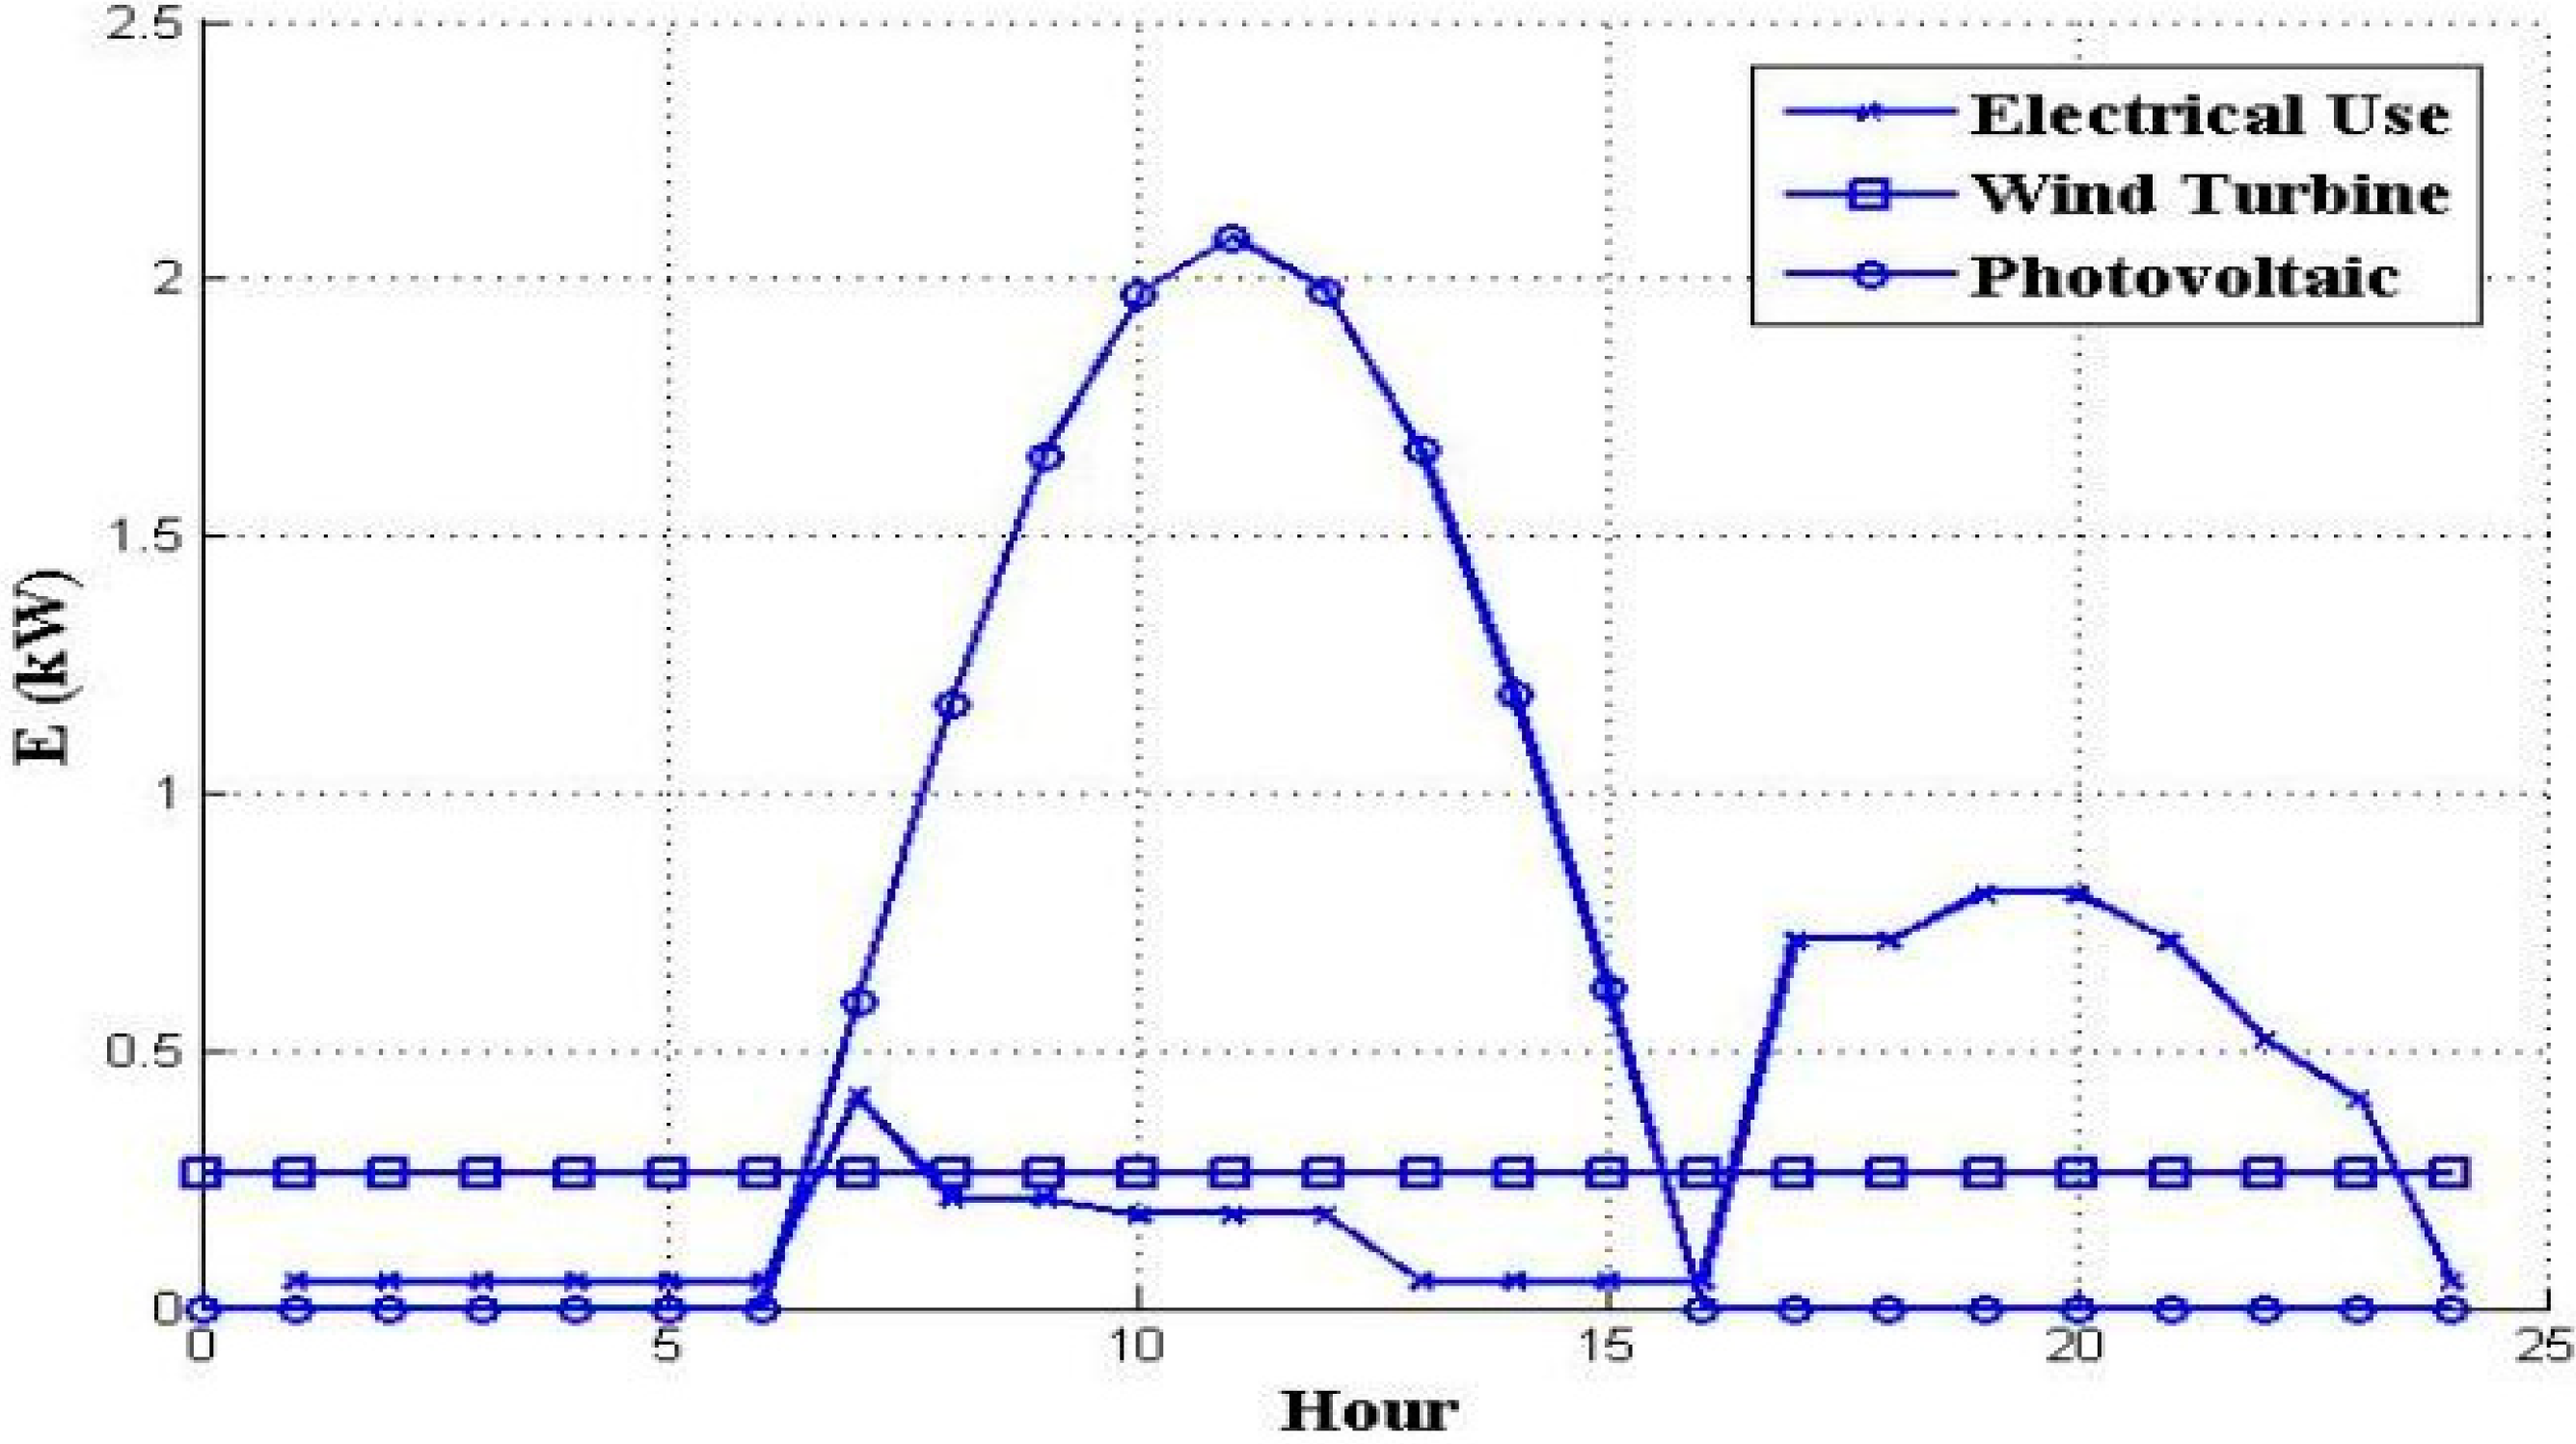
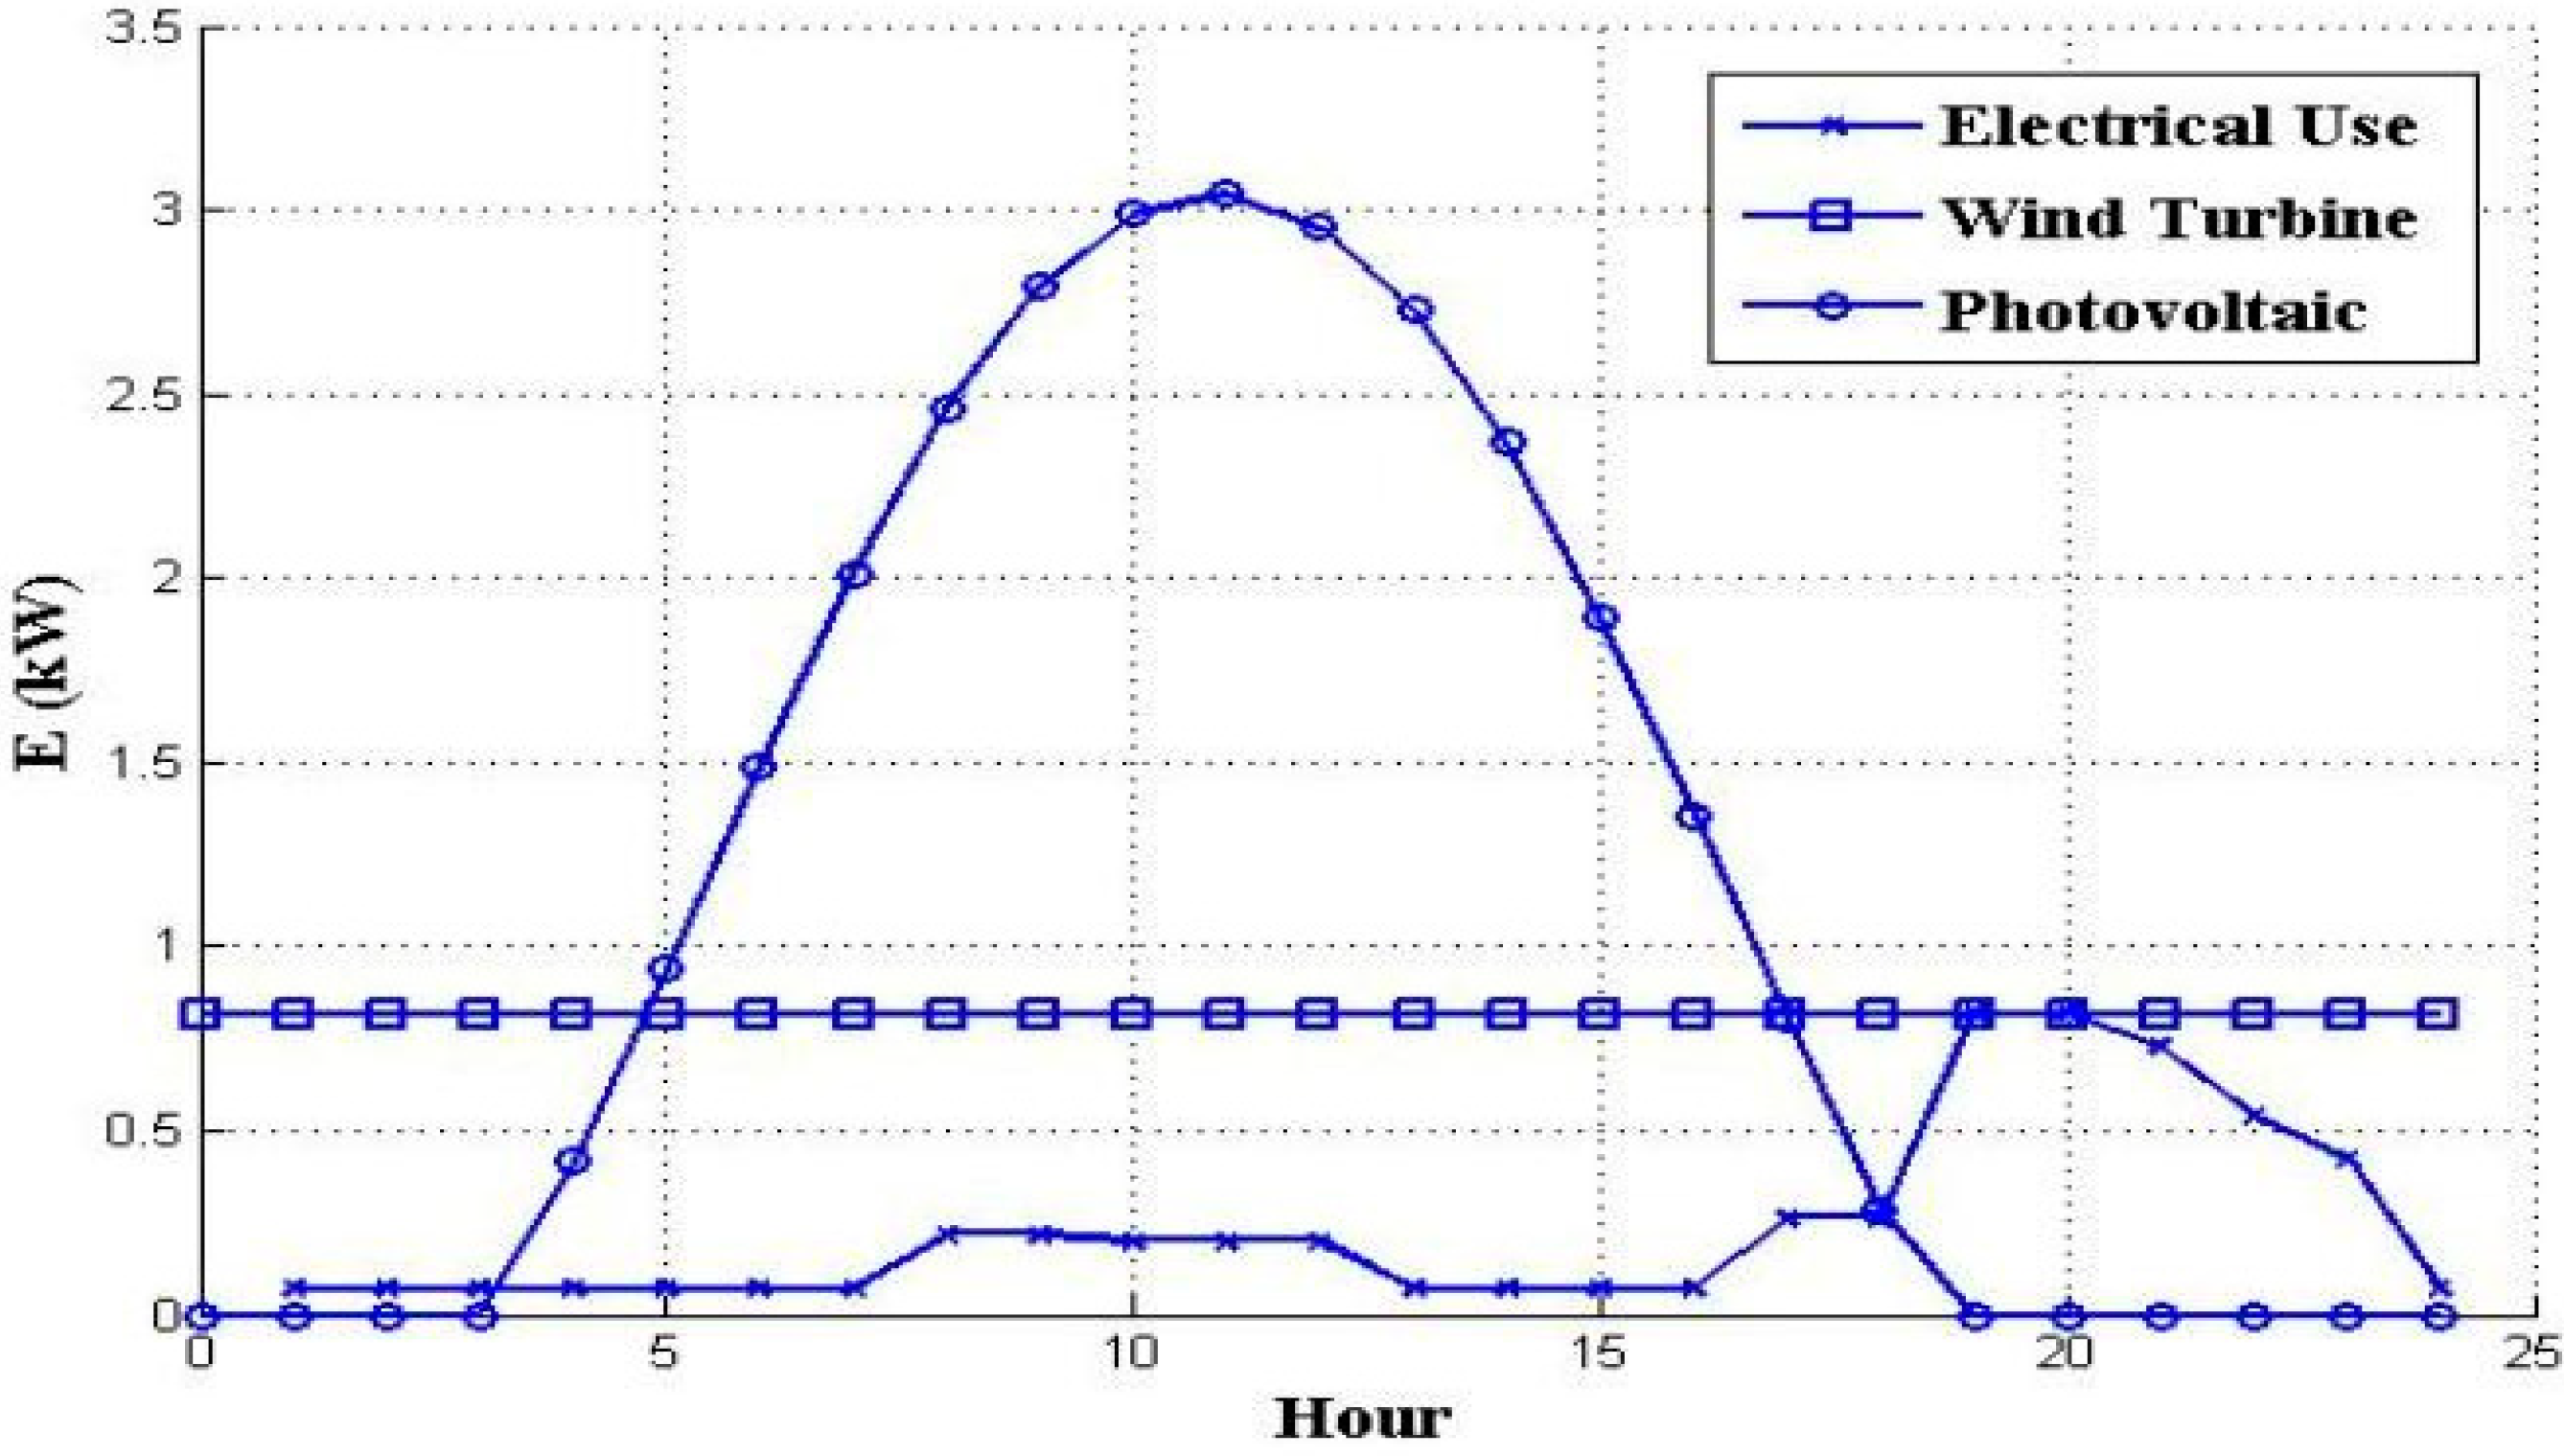
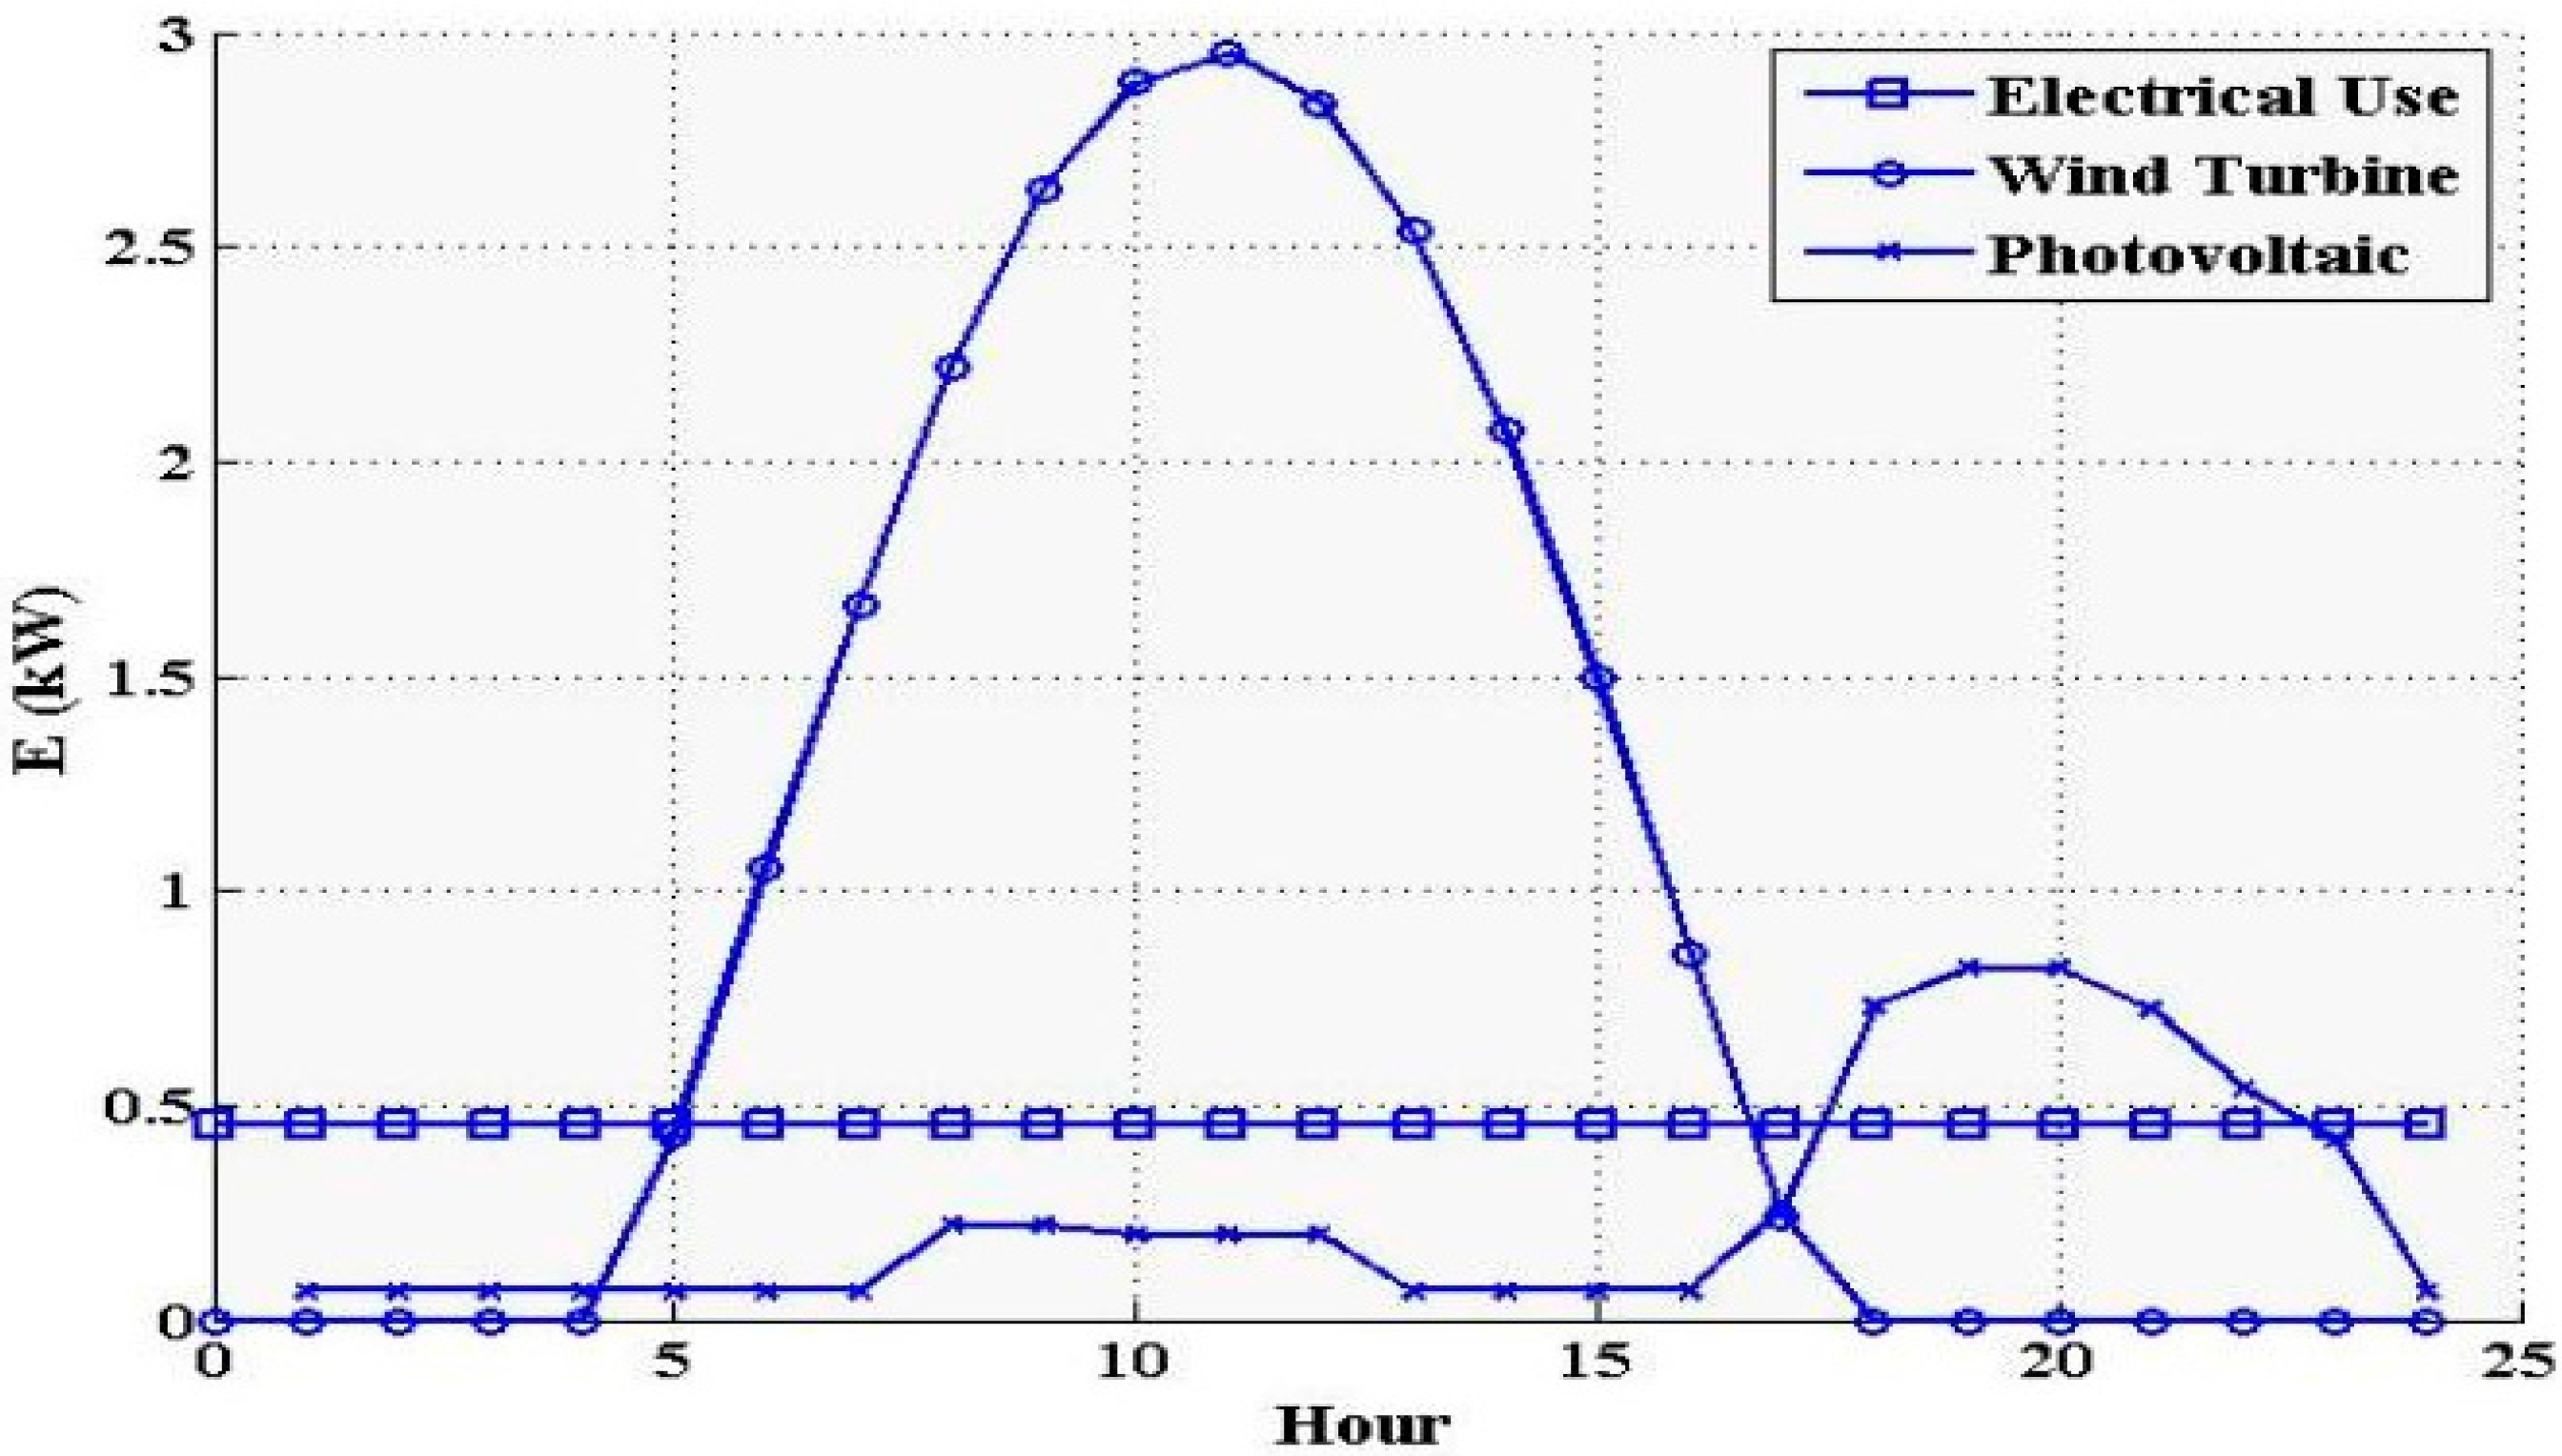
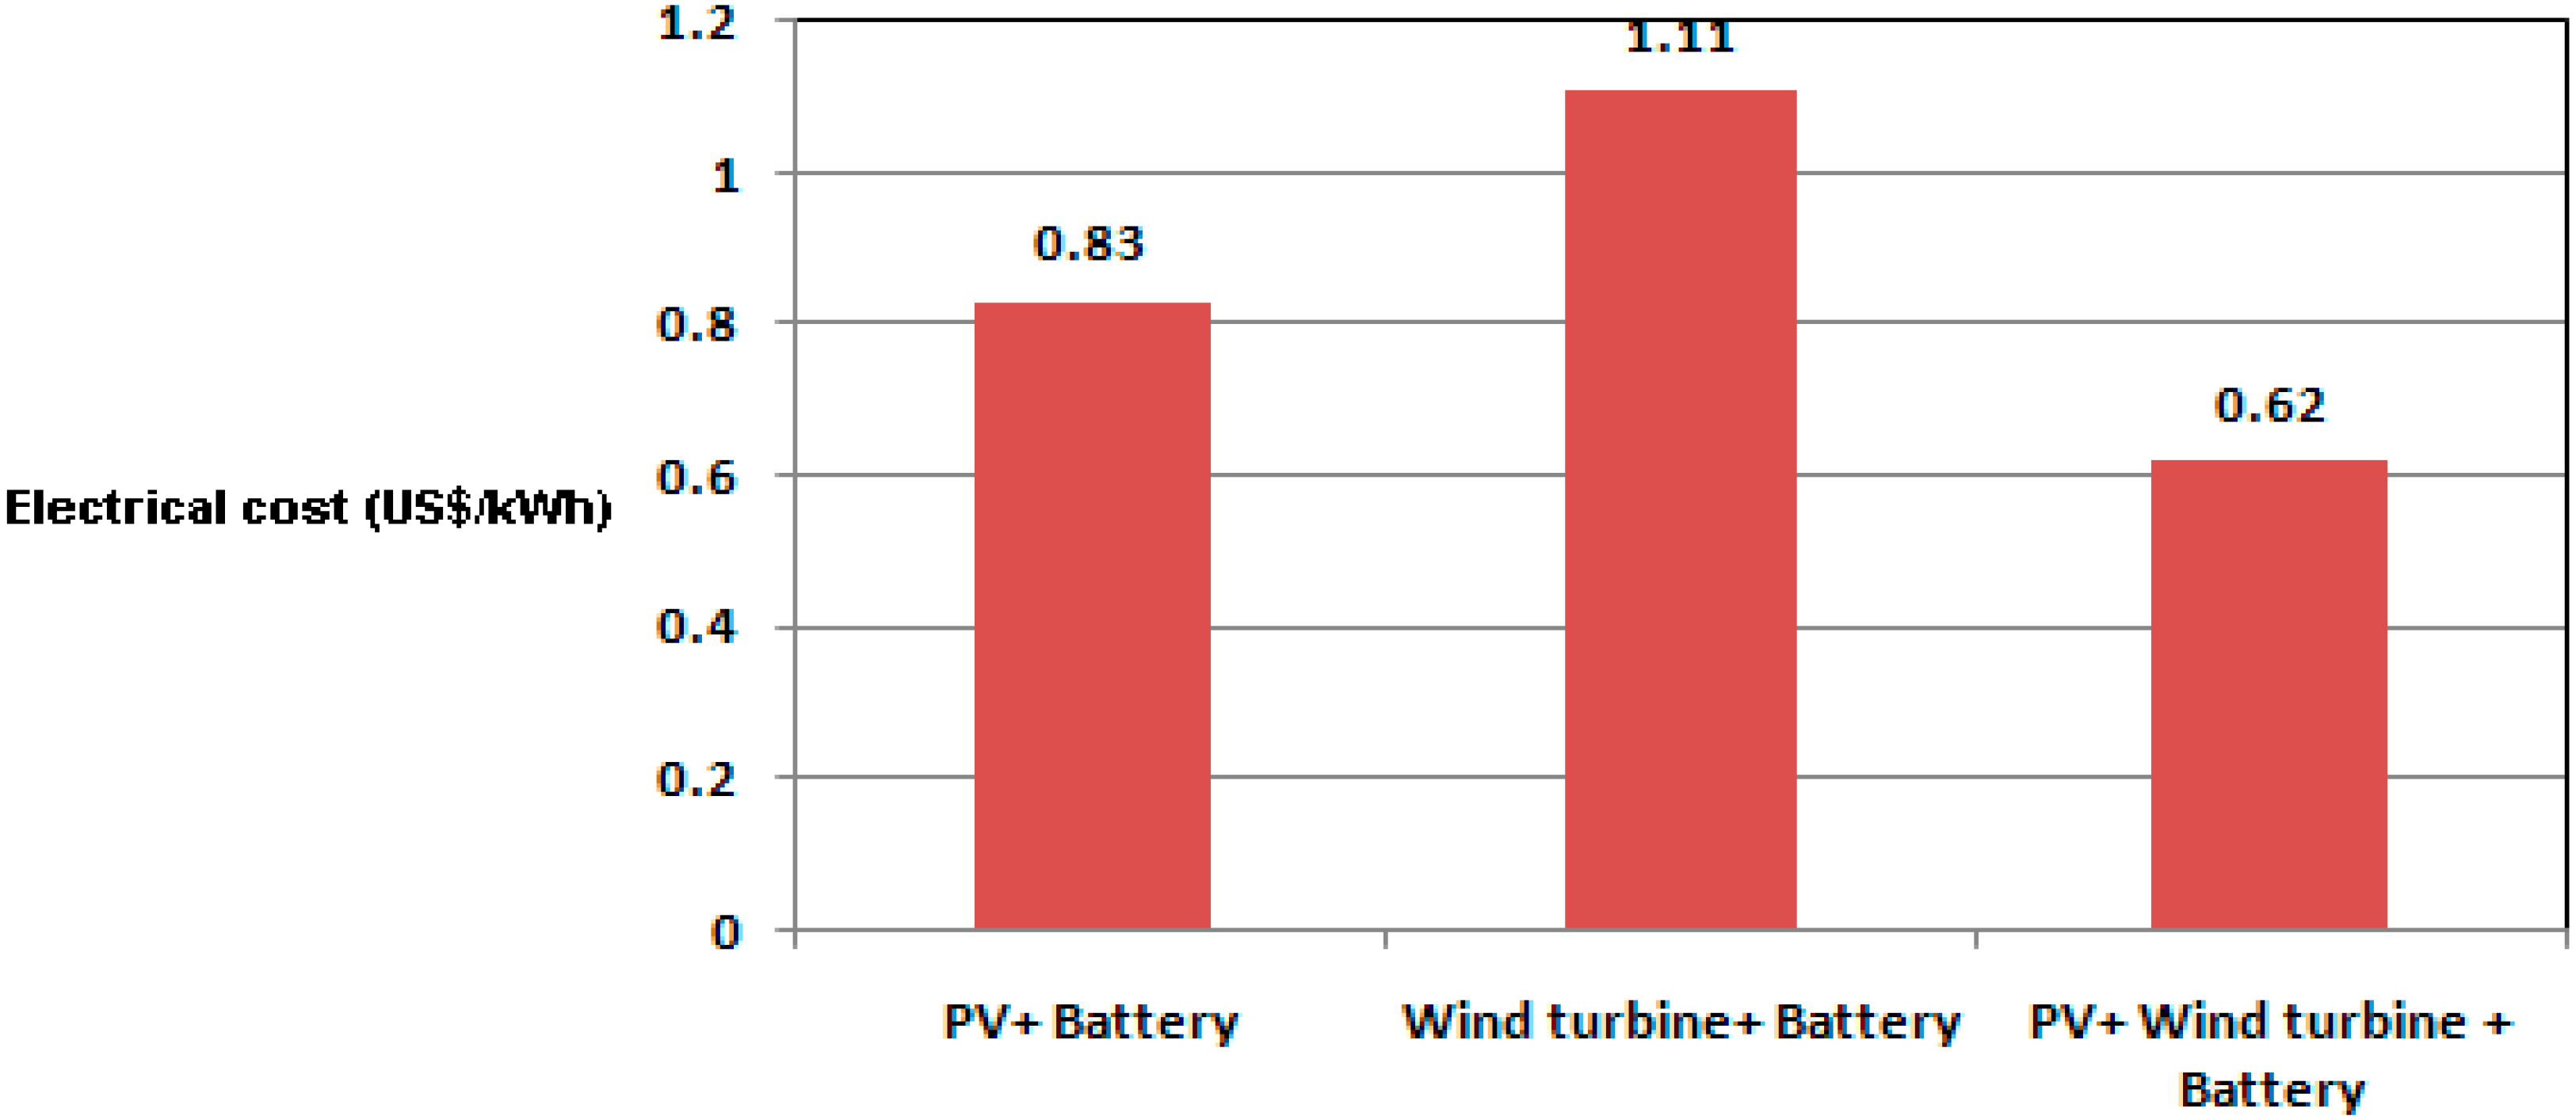
4. Optimization Procedure

The main aim of this research is the optimization of the photovoltaic-wind turbine hybrid system to meet all electrical power needs over the total number of hours of a year.
The function that we minimize is electricity cost; these costs are affected by the system capacity (PV area, wind turbine and battery capacity). The battery is the most expensive part of the system.
On the other side of the optimization procedure we have the energy function. This equation demonstrates that the sum of the photovoltaic and wind turbine power generation and battery storage capacity should be equal to the electrical power needed of any hour in a day of the year (Equation (38)). We used a searching algorithm for optimization for selecting the optimum wind turbine unit number and the photovoltaic area, and we modified the wind turbine model with a different rated power, PV area and battery storage type and capacity, by noting that the sum of the power generation should meet the electrical power needs of the residential building (Equation (38)). Also we recognize from Equation (30) that the electricity cost should be at the minimum level.
In this study, data for the 15th of every month is taken as representative of that month for designing the system. Calculations for the hybrid system are done for the peak time of usage to ensure adequate energy production for the building needs for the entire day. The hybrid system needs to satisfy the following equation:
E = W PV h + W wind h + E bat
Here, E is the electrical energy need of the building, W wind PV is photovoltaic power supply, W wind is the wind turbine power supply and Ebat is the electrical capacity of the battery.
First the electrical power supply of the wind turbine is calculated. The type of wind turbine considered is a Bergey Excel-S. The electrical power supply of the wind turbine can be calculated using Equation (29). Next the capacity is determined for the battery, which supplies the electrical requirements of the building at night. Finally the size of the photovoltaic system is calculated; to do this the power generation for a 1 m2 photovoltaic system is obtained from Equation (28) and then with Equation (38) the total size of the photovoltaic system is found. All calculations are carried out with the Matlab code.
The results are illustrated in Figure 4, Figure 5, Figure 6 and Figure 7. The surface are required of the photovoltaic system is found to be 26.58 m2 and the capacity of battery is 8.087 kW in Tehran. The electrical usage for the 15th of every month is shown in Figure 4, as is the electrical energy produced by the PV and wind turbine, and the battery capacity in Tehran.
Figure 4. Annual electrical production of the system (PV, wind turbine, battery) and usage.
Sustainability 07 02554 g004
Figure 5. Electrical output of the PV, wind turbine and battery, and electrical usage, on 15 January 2012 in Tehran.
Sustainability 07 02554 g005
Figure 6. Electrical output of the PV, wind turbine and battery, and electrical usage, on 15 July 2012 in Tehran.
Sustainability 07 02554 g006
Figure 7. Electrical output of the PV, wind turbine and battery, and electrical usage, on 15 August 2012 in Tehran.
Sustainability 07 02554 g007
It can be seen in the figures that the capacity of the battery is constant over the whole year, but the electricity produced by the wind turbine and PV modules changes from month to month. In summer days, the photovoltaic system produces more electrical energy than needed but on winter days the production and usage rates are the same.
As shown in Figure 5, Figure 6 and Figure 7 the electrical output of the wind turbine and photovoltaic cell covers 24 h of the day for three of the months. In all of them our system can supply the electrical needs.
The electrical costs of the wind turbine and photovoltaic systems are calculated and compared with the hybrid system. If the wind turbine system with battery storage supplies all the needs of the building located in Tehran the unit electrical cost of system will be 1.11 US$/kWh. If the photovoltaic system with battery storage meets all the needs of the building the unit electrical cost located in Tehran will be 0.83 US$/kWh.
A comparison of the results for the hybrid system and the wind turbine system, and also the photovoltaic system, for supplying the electrical need of the building demonstrates that the unit electrical cost of the hybrid system is 0.62 US$/kWh, which is 78% lower than for the wind turbine system and 34% lower than for the photovoltaic system.
Table 5 provides a comparison of different options to supply electrical needs of residential buildings in Tehran.
Table 5. Comparison of various options for supplying electrical needs.
OptionPV ModelPV Area (m2)Wind Turbine ModelWind Turbine UnitsBattery Capacity (kWh)Electrical Cost (US$/kWh)
PV + BatteryMono-Si32--12.90.83
Wind turbine + Battery--Bergey Excel-S128.11.11
PV + Wind turbine + BatteryMono-Si26.6Bergey Excel-S18.90.62
Figure 8 shows electricity costs for the three options in Table 5.
Figure 8. Electricity cost for PV + battery, wind turbine + battery and PV + wind turbine + battery systems.
Sustainability 07 02554 g008

5. Conclusions

The utilization of a photovoltaic-wind turbine hybrid system to supply the electrical needs of residential buildings over a year was successfully investigated. A residential building in Tehran was used as a case study. Using local weather data, location and dimensions of the building, the power need to be generated by the system was calculated. With this data and the electrical requirements of the building, the optimum size of the system and battery capacity that could supply the electrical need was calculated. The computer code used in this research is able to calculate the size of the photovoltaic-wind turbine hybrid system and battery capacity. This code is developed so it could be used for any location to design the most appropriate photovoltaic-wind turbine hybrid system. For other locations by using this algorithm with meteorological information (e.g., wind speed, solar irradiation, temperature), the optimum size of system can be obtained.

Author Contributions

These research was defined as master of science thesis that it was performed by Mohammad Hosein Nezami and under supervision of Mehdi Aliehyaei of Islamic Azad University, Pardis branch. Marc A. Rosen and Mohammad Hossein Ahmadi had collaboration in this research.

Nomenclature

Ppv
Photovoltaic output power (kW)
A
Surface area of PV panel (m2)
H
Electrical conversion efficiency
Gt
Global radiation (W/m2)
B
Mean anomaly (degree)
δ
Sun declination (degree)
w
Hour angle(degree)
θ
Angle of incidence (degree)
β
Slope angle (degree)
Goh
Horizontal extraterrestrial radiation (W/m2)
Gon
Normal extraterrestrial radiation (W/m2)
G ¯
Global radiation on horizontal panel (W/m2)
K
Clearness index factor
Gbt
Beam radiation on tilted surface (W/m2)
F
Correction factor
Ta
Environment temperature (°C)
TC
Cell temperature (°C)
Uc
Cut-in wind turbine speed (m/s)
Ur
Rated wind turbine speed (m/s)
Per
Rated power (kW)
Pe,ave
Average wind turbine electrical power output (kW)
C
Unit electricity cost (US$/kWh)
Cp
Unit electricity cost for photovoltaic system (US$/kWh)
CI
Unit installation cost (US$/kWh)
Co
Unit maintenance cost (US$/kWh)
Cf
Average annual electrical use (kWh/day)

Conflicts of Interest

The authors declare no conflict of interest.

References

  1. Duffie, J.A.; Beckman, W.A. Solar Engineering of Thermal Processes, 3rd Ed. ed; John Wiely: New York, NY, USA, 2006. [Google Scholar]
  2. Hocaoglu, F.O.; Gerek, O.N. A novel hybrid (wind-photovoltaic) system sizing procedure. Sol. Energy 2009, 83, 2019–2028. [Google Scholar] [CrossRef]
  3. Calderon, M.; Calderon, A.J. Weather data and energy balance of a hybrid photovoltaic-wind system with hydrogen storage. Int. J. Hydrog. Energy 2010, 35, 7706–7715. [Google Scholar] [CrossRef]
  4. Yang, H.; Zhou, W. Optimal sizing method for stand-alone hybrid solar-wind system with LPSP technology using genetic algorithm. Sol. Energy 2008, 82, 354–367. [Google Scholar] [CrossRef]
  5. Yang, H.X.; Lu, L.; Burnett, J. Weather data and probability analysis of hybrid photovoltaic-wind power generation systems in Hong Kong. Renew. Energy 2003, 28, 1813–1824. [Google Scholar] [CrossRef]
  6. Calderon, M.; Calderon, A.J.; Ramiro, A.; Gonzalez, J.F.; Gonzalez, I. Evaluation of a hybrid photovoltaic-wind system with hydrogen storage performance using exergy analysis. Int. J. Hydrog. Energy 2011, 36, 5751–5762. [Google Scholar] [CrossRef]
  7. Maatallah, T.; Alimi, S.E. Performance modeling and investigation of fixed, single and dual-axis tracking photovoltaic panel in Monastir city, Tunisia. Renew. Sustain. Energy Rev. 2011, 15, 4053–4066. [Google Scholar] [CrossRef]
  8. Brunelli, D.; Dondi, D. Photovoltaic scavenging systems: Modeling and optimization. Microelectron. J. 2009, 40, 1337–1344. [Google Scholar] [CrossRef]
  9. Wang, F.; Bai, L. The methodology for aerodynamic study on a small domestic wind turbine with scoop. J. Wind Eng. Ind. Aerodyn. 2008, 96, 1–24. [Google Scholar] [CrossRef] [Green Version]
  10. Ahmadi, A.; Ehyaei, M.A. Exergy analysis of wind turbine. Int. J. Exergy 2009, 6, 1–16. [Google Scholar] [CrossRef]
  11. Bojic, M.; Nikolic, N. Toward a positive-net-energy residential building in Serbian conditions. Appl. Energy 2011, 88, 2407–2419. [Google Scholar] [CrossRef]
  12. Mavromatakis, F.; Makrides, G. Modeling the photovoltaic potential of a site. Renew. Energy 2010, 35, 1387–1390. [Google Scholar] [CrossRef]
  13. Lopez, R.D.; Agustin, J.L.B. Design and economical analysis of hybrid PV-wind system connected to the grid for the intermittent production of hydrogen. Energy Policy 2009, 37, 3082–3095. [Google Scholar] [CrossRef]
  14. Park, K.E.; Kang, G.H. Analysis of thermal and electrical performance of semi-transparent photovoltaic (PV) module. Energy 2010, 35, 2681–2687. [Google Scholar] [CrossRef]
  15. Abdollahpour, A.; Ahmadi, M.H.; Mohammadi, A.H. Thermodynamic model to study a solar collector for its application to Stirling engines. Energy Convers. Manag. 2014, 79, 666–673. [Google Scholar] [CrossRef]
  16. Eltawil, M.A.; Zhao, Z. Grid-connected photovoltaic power system: Technical and potential problems: A review. Renew. Sustain. Energy Rev. 2010, 14, 112–129. [Google Scholar] [CrossRef]
  17. Li, Y.; Lence, B.J. An integrated model for estimating energy cost of a tidal current turbine farm. Energy Convers. Manag. 2011, 52, 1677–1687. [Google Scholar] [CrossRef]
  18. Kaldellis, J.K.; Zafirakis, D. The wind energy revolution: A short review of a long history. Renew. Energy 2011, 36, 1887–1901. [Google Scholar] [CrossRef]
  19. Li, Z.; Boyle, F. Domestic application of micro wind turbines in Ireland: Investigation of their economic viability. Renew. Energy 2011, 124, 1–11. [Google Scholar]
  20. Chong, W.T.; Naghavi, M.S. Techno-economic analysis of a wind-solar hybrid renewable energy system with rainwater collection feature for urban high-rise application. Appl. Energy 2011, 88, 4067–4077. [Google Scholar] [CrossRef]
  21. Martinez, J.; Medina, A. A state space model for the dynamic operation representation of small-scale wind-photovoltaic hybrid system. Renew. Energy 2010, 35, 1159–1168. [Google Scholar] [CrossRef]
  22. Shakya, B.D.; Aye, L. Technical feasibility and financial analysis of hybrid wind-photovoltaic system with hydrogen storage for Cooma. Int. J. Hydrog. Energy 2004, 30, 9–20. [Google Scholar] [CrossRef]

