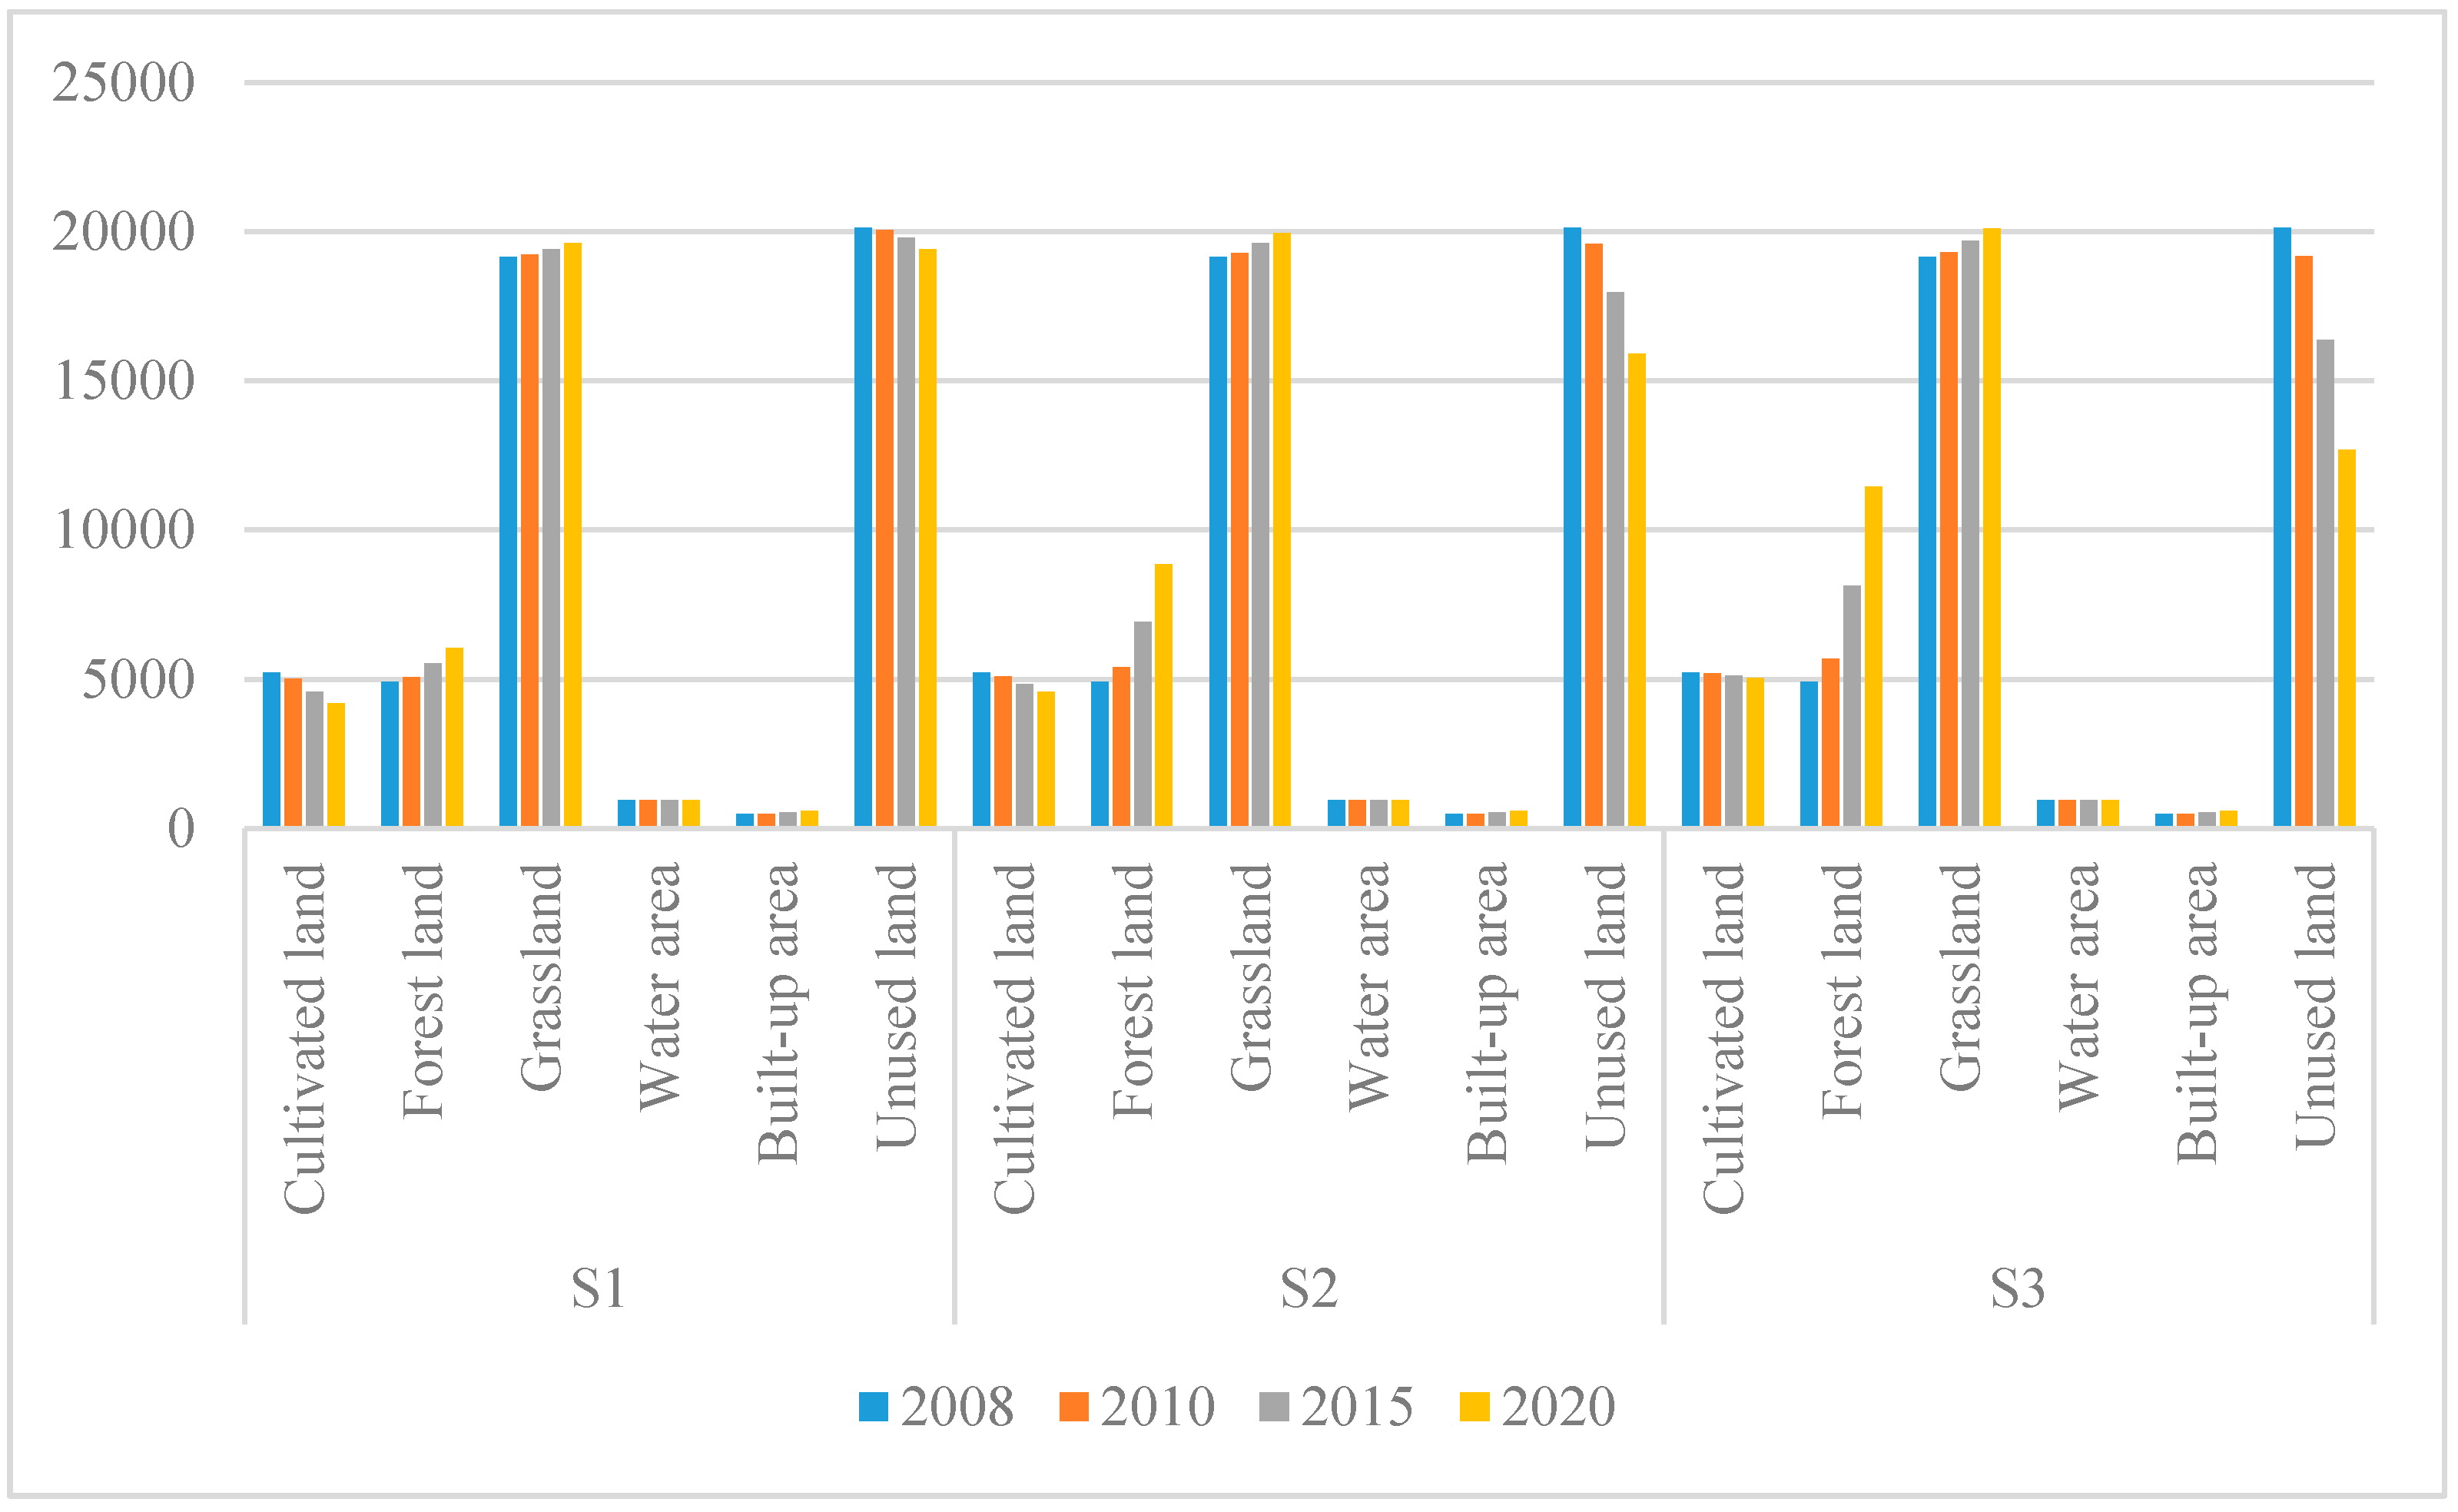
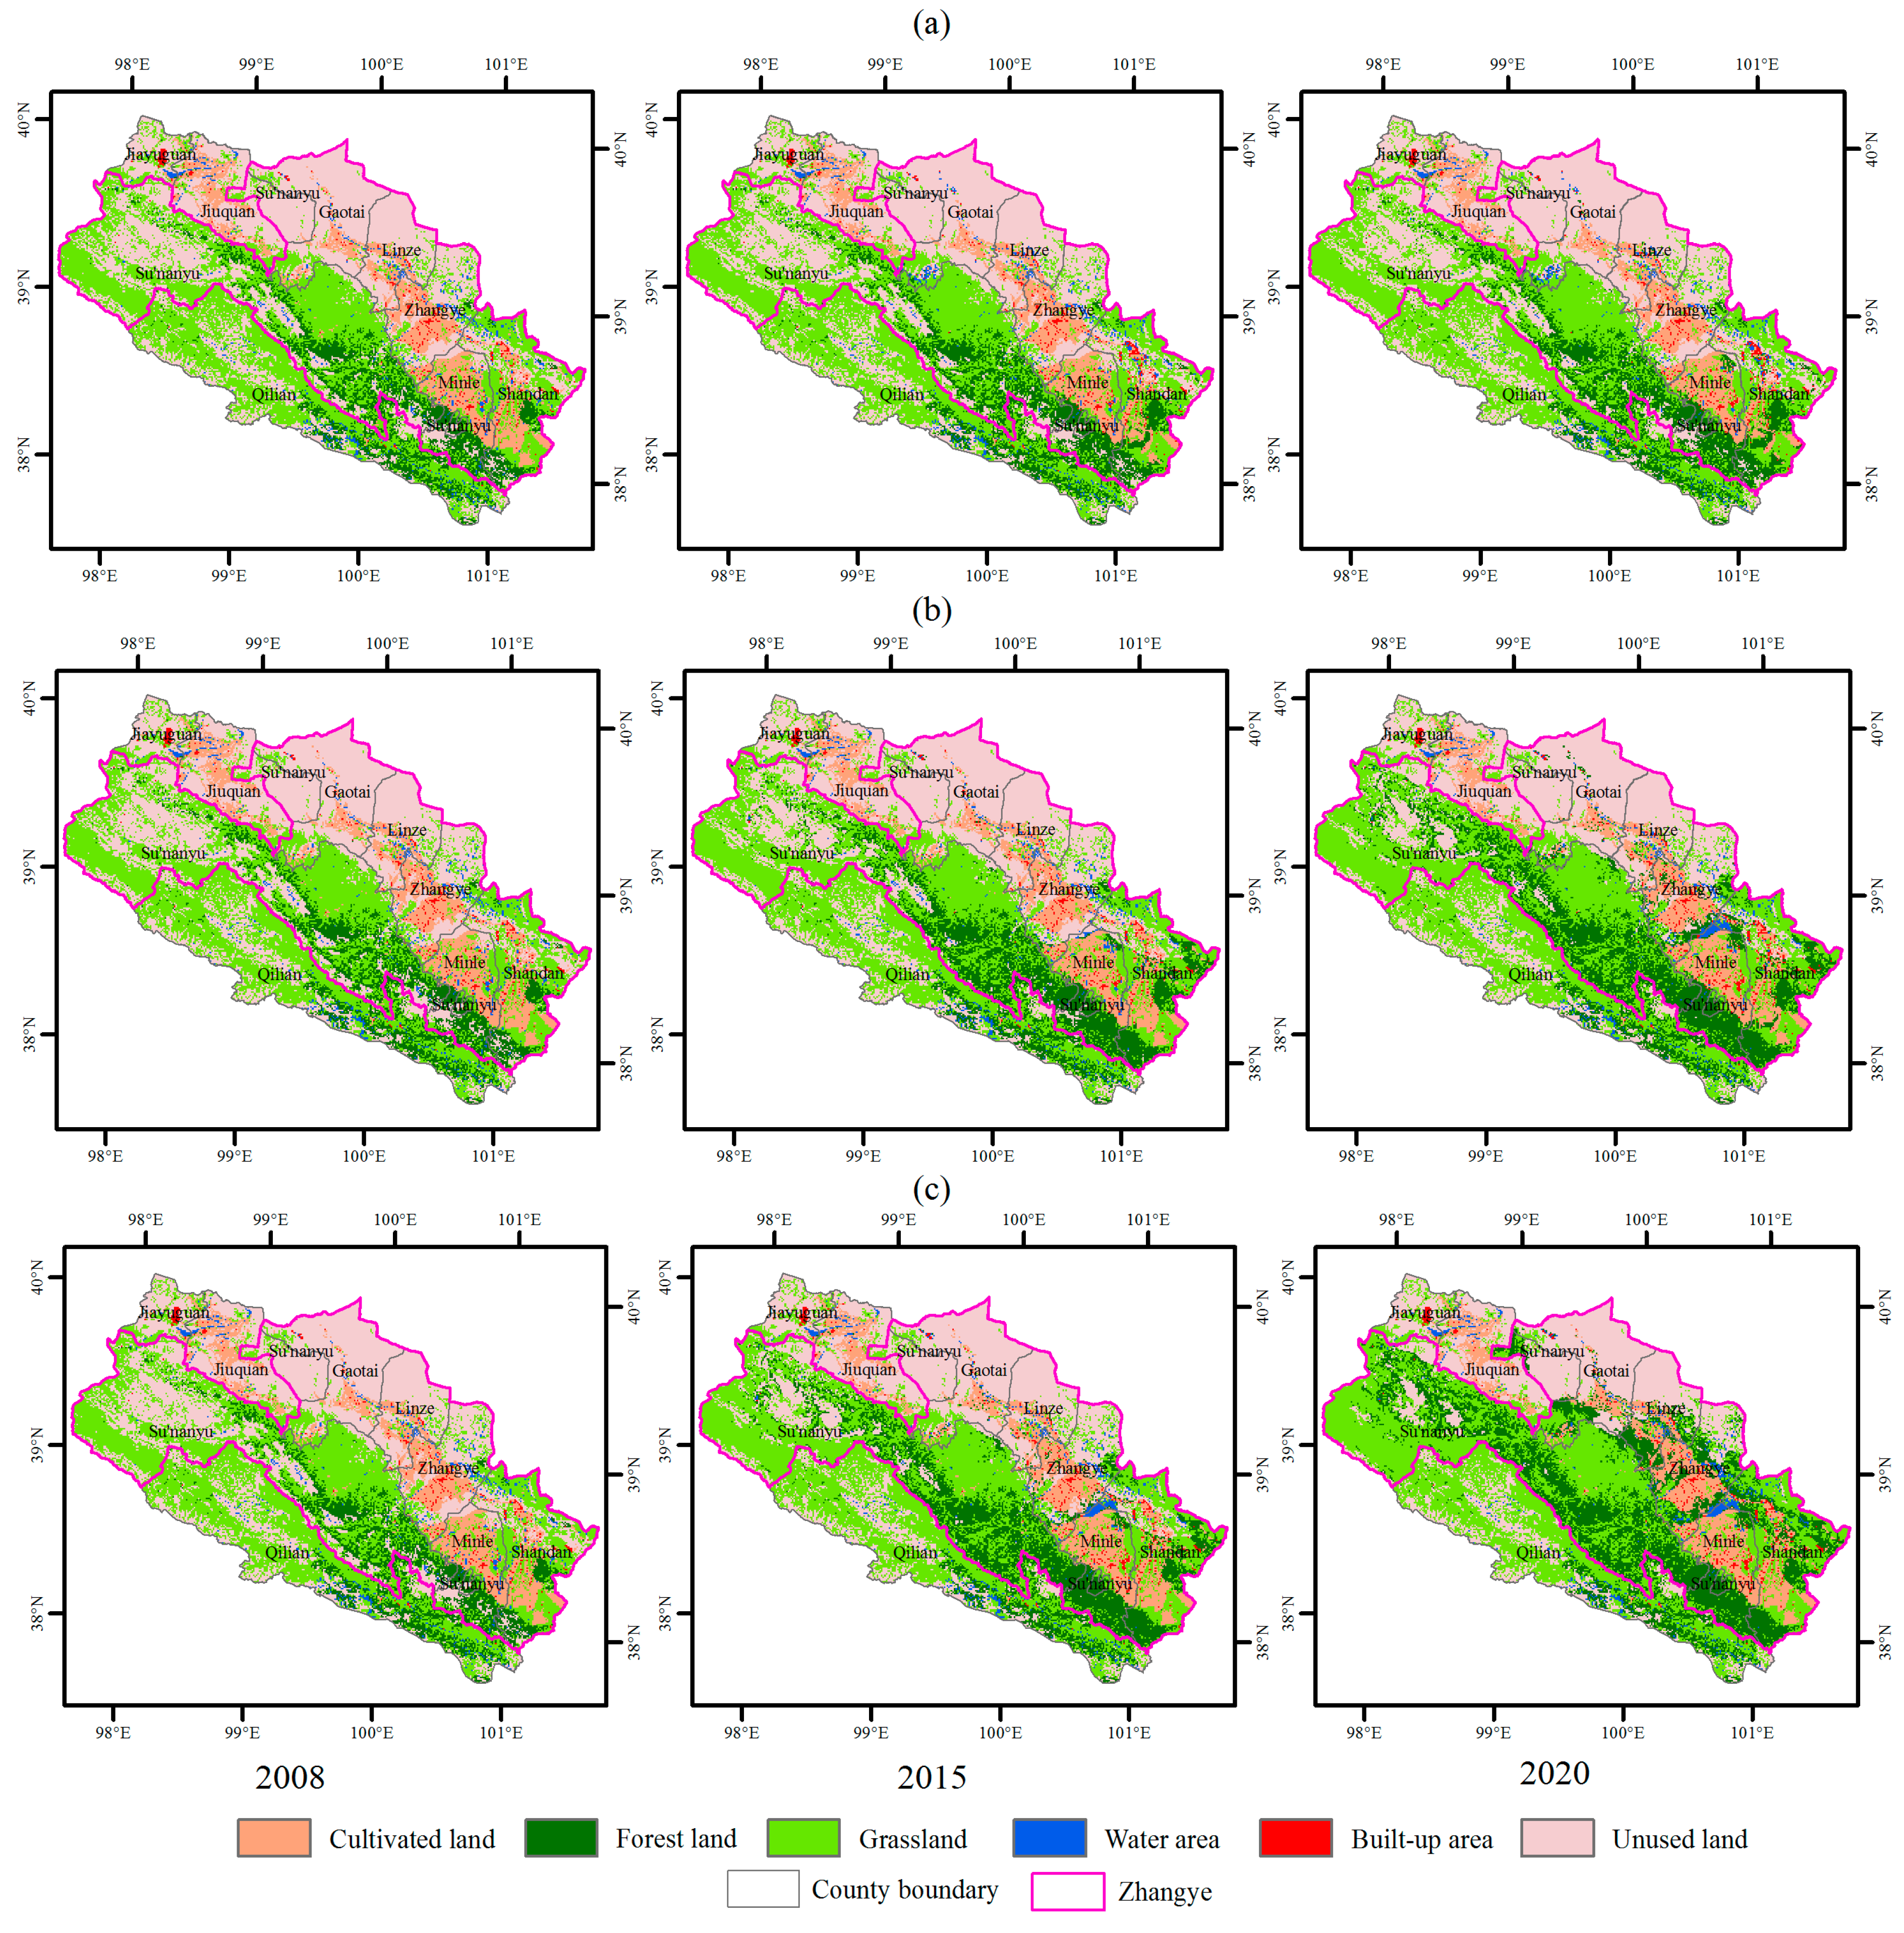
In this study, three different land use change scenarios under low-level water utilization ratio scenario (S1), middle-level water utilization ratio (S2) and high-level water utilization ratio (S3) conditions were established to assess the impacts of the land use/cover change on hydrological processes.
3.2. SWAT Model Calibration and Validation
The purpose of the model calibration is to better parameterize a model to a given set of local conditions, thus to improve the simulation accuracy. Model validation is to check whether the model can predict flow for another range of time periods or conditions than those for which the model was calibrated. Many hydrological models contain parameters that cannot be determined directly from field measurements. To improve the SWAT model performance, model calibration and validation are used to adjust and validate such parameters to optimize the agreement between observed and simulated values [
57,
58]. In the SWAT model, the input parameters are process based and must be held within a realistic uncertainty range, and the first step in the calibration and validation process in SWAT is the determination of the most sensitive parameters for a given basin or subbasin [
59]. The most sensitive parameters were identified in the calibration process with the built-in sensitivity analysis tool in SWAT [
60]. The calibration of the SWAT model is time consuming, so in this study SWAT-CUP SUFI-2 (Sequential Uncertainly Fitting Ver. 2) was used to evaluate the SWAT model by performing calibration and uncertainly analysis. SUFI-2 is a semi-automated inverse modeling procedure for combined calibration-uncertainly analysis [
61], based on which sensitive initial and default parameters related to hydrology varied simultaneously until an optimal solution was met. The most sensitive parameters with their best ranges and best-fitted values used for the SWAT model simulation are shown in
Table 6. Finally, these best-fitted values were used to adjust the initial model inputs for the future simulation.
In this study, the SWAT model was calibrated for streamflow at the sub-basin level for the period 2005–2007 based on the daily observed streamflow from Yingluoxia hydrological station in the upper reach of the Heihe River Basin, where human activities are not intensive With the first two years (2005–2006) used as a warm-up period which were not considered in the calibration analysis, the data of year 2007 were actually applied to calibrate the model. Validation of the model was conducted using data of the year 2008. The model performance was evaluated using goodness-of-fit statistics such as the Nash and Sutcliffe model efficiency coefficient (E
ns) and the coefficient of determination (
R2) [
62].
Figure 5 shows the calibration and validation results. During the calibration period, the Nash-Sutcliffe coefficient (E
ns) was 0.88 and the values of
R2 between the simulated and observed daily streamflows was 0.87. During the validation period, the E
ns was 0.87 and the value of
R2 was 0.89. The simulated streamflow was considered to be accurate for values of E
ns > 0.75 [
63]. These results suggest that the calibrated model can accurately simulate the streamflow in the Heihe River Basin and confirm that the calibrated model with the set of optimized parameters can be used to examine the responses of hydrological processes to land use/cover change in the upper and middle reaches of the Heihe River Basin.
Table 6.
List of calibration parameters and the optimized values.
Table 6.
List of calibration parameters and the optimized values.
| Parameters | Descriptions | Ranges | Fitted Values |
|---|
| CN2 | SCS curve number | −20%~20% | +6.32% |
| Sol_k | Saturated hydrological conductivity | −20%~20% | +11.56% |
| Escno | Evaporation compensation factor | 0~1.0 | 0.83 |
| SFTMP | Snowfall temperature | −2.0~2.0 °C | 0.9 °C |
| Sol_z | Depth from soil surface to bottom of layer | −20%~20% | +3.65% |
| Sol_Awc | Available soil water content | −20%~20% | −0.35% |
| GWQMN | Threshold depth of water in the shallow aquifer required for return flow to occur | 0~500 mm | 306.5 |
| ALPHA_BF | Baseflow alpha factor | 0.00~1.00 | 0.07 |
Figure 5.
Scatter plot of observed and simulated flow for the calibration and validation periods.
Figure 5.
Scatter plot of observed and simulated flow for the calibration and validation periods.
3.3. Effects of Land-Use Changes on Hydrological Processes
The influence of land use/cover change on the hydrological processes is a key factor in the rational allocation of water resources in the study area. It has been widely reported that land use/cover change can affect the quantity of water resources. The data of Zhengyixia hydrological station located at the outlet of middle reach (
Figure 1) were used to examine the impact of land use/cover changes on hydrological processes. We choose surface runoff and water yield to analyze the impacts of land use/cover change. The monthly average values of the surface runoff, water yield and precipitation were calculated (
Figure 6). The results showed that the impacts of land use/cover change on the surface runoff and water yield varied with the precipitation and seasons, and the changing trend of surface runoff and water yield were similar to that of the precipitation.
Figure 6.
Multi-year averaged monthly precipitation, surface runoff and water yield in the upper and middle reaches of the Heihe River Basin.
Figure 6.
Multi-year averaged monthly precipitation, surface runoff and water yield in the upper and middle reaches of the Heihe River Basin.
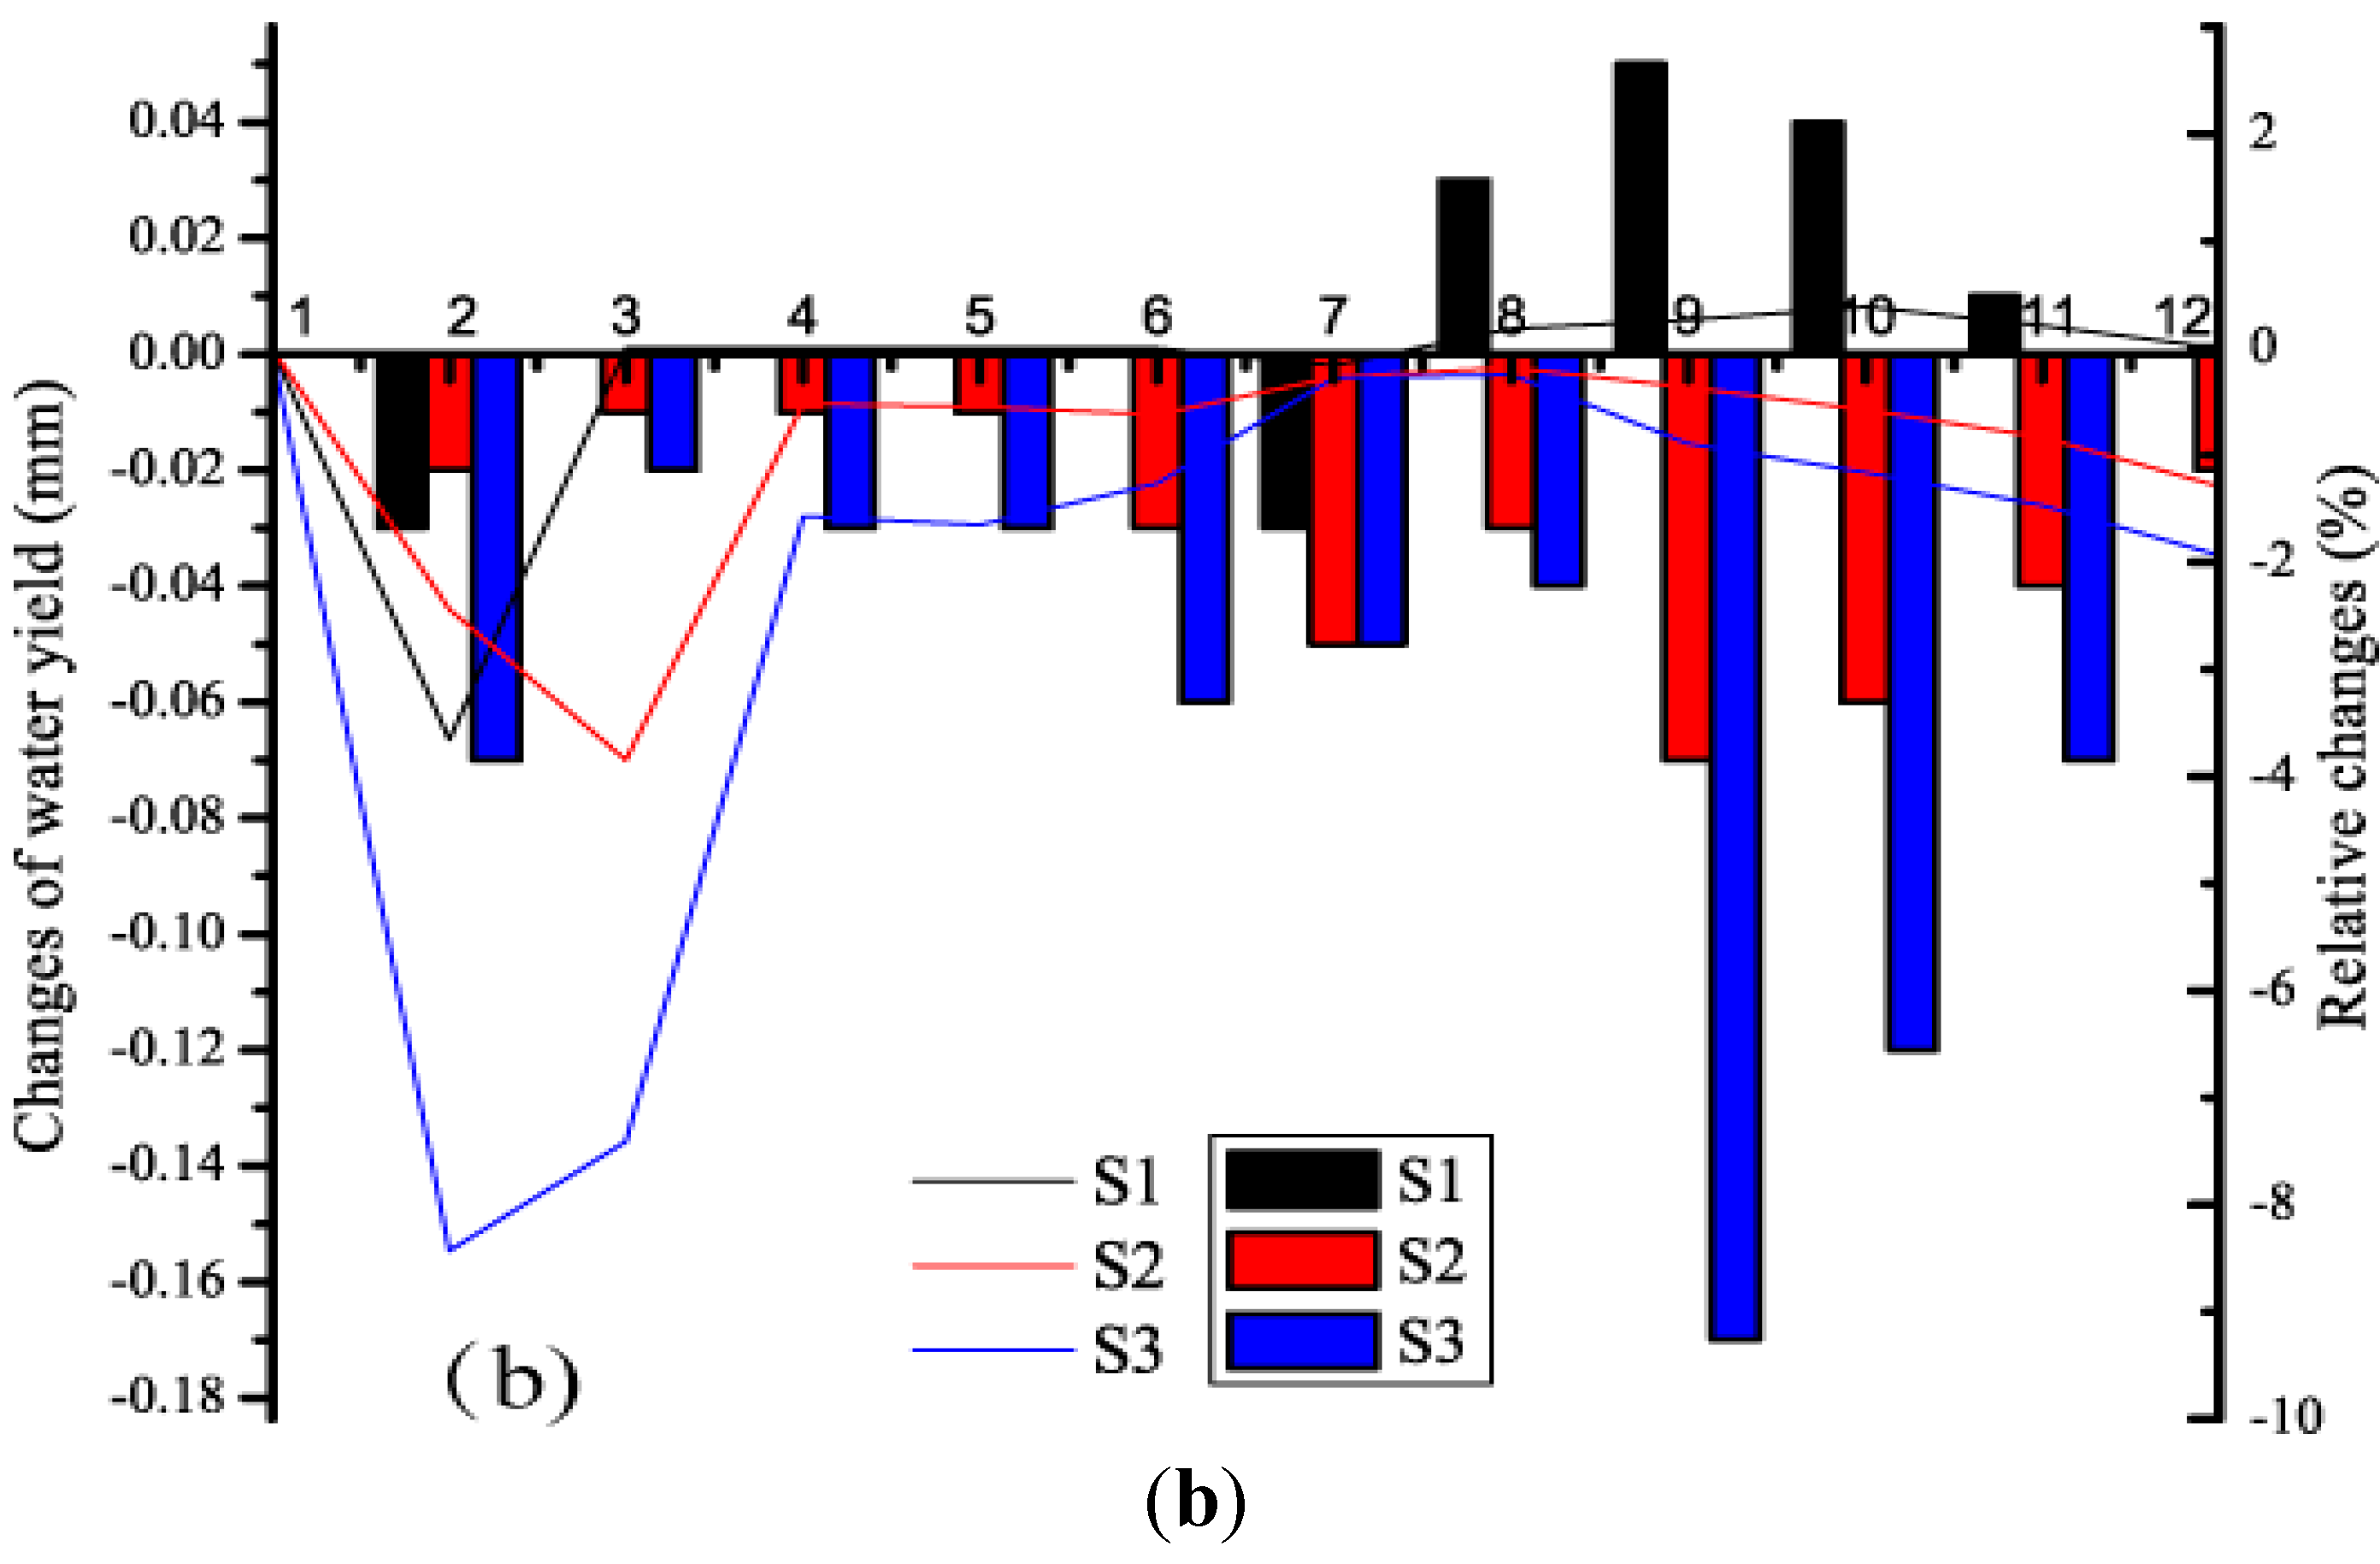
The simulated surface runoff and water yield of the year 2020 under the three scenarios were compared to the corresponding values in the baseline year 2008.
Figure 7 shows the changes in monthly surface runoff and water yield under different land use/cover change scenarios. Surface runoff is one of the major pathways contributing to the water yield. The monthly quick-response surface runoff showed a decreasing trend, with the relative changes ranging from −55.5% to −1.6% (
Figure 7a) under the three scenarios. The water yield would increase in May and June, and decrease in all other months in scenarios S2 and S3, while the water yield will increase during August-November in scenario S1 (
Figure 7b). The overall changing trend of the surface runoff is consistent with the water yield in scenarios S2 and S3, both revealing a decreasing trend due to land use/cover change.
Figure 7.
Changes in monthly surface runoff (a) and water yield (b) under S1, S2 and S3 scenarios for the year 2020 relative to 2008.
Figure 7.
Changes in monthly surface runoff (a) and water yield (b) under S1, S2 and S3 scenarios for the year 2020 relative to 2008.
The major causes of the decrease in surface runoff are the expansions of forest land and grassland. There is broad agreement amongst researchers that the stream flow change is likely to be caused by different kinds of forestry activities, such as afforestation that may lead to lower runoff generation and reduction of water yield. Sahin and Hall analyzed empirical data from 145 sites around the world and found a decrease in annual runoff resulting from increase of scrub cover, and an increase in runoff for reduction of deciduous hardwood cover [
64]. As it has been identified, the order of runoff rate of different land use types was as follows: Unused land > Cultivated land > Grassland > Forest land [
65], Since in this study forest land and grassland land were mainly converted from unused land, which inevitably led to the reduction of surface runoff, and the more intensive forest land and grassland expansion are, the more the reduction and fluctuation of surface runoff are. As shown in
Figure 7a, surface runoff reduced most significantly under the S3 scenario, especially in July, August and September, when the precipitation is much more intensive, the impacts of land use/cover change on the absolute runoff amount changes will be more significantly.
As to the water yield, the scenario S1, with less grassland and forest land expansion compared to scenarios S2 and S3, even if the surface runoff is decreasing, the water yield during August-November still shows an increasing trend. Different land use types have different characteristics of the soil water infiltration, the infiltration rate of forest land is larger than grassland and unused land [
66]. As both surface runoff and base flow are the major two parts contributing to water yield, with unused land being converted to grassland and forest land, the infiltration will increase and further lead to the increase of base flow.. The impacts of vegetation coverage on the base flow is complex. On the one hand, infiltration rates increased strongly with the increase of vegetative coverage, leading to more generation of base flow [
67]. On the other hand, vegetation evaporation and transpiration will consume a large amount of water, and vegetation coverage change will alter and improve the water storage capacity of soil, which is not conducive to supplement the base flow [
68]. In addition, vegetation roots, especially the larger deep-rooted vegetation that increased absorption may make base flow absorbed by vegetation, and consequently the water yield declines [
69]. The smaller the rainfall and rainfall intensity are, the greater the capacity of vegetation to intercept precipitation is. During July-October the rainfall is much larger than it is in other months, leading to a lower capacity of vegetation to intercept precipitation. Under S1 scenario, the vegetation coverage density is much lower than that under S2 and S3 scenario, resulting in less decrease of surface runoff and less absorption of vegetation, and the positive effect on base flow overwhelmed the negative effect on surface runoff, finally resulting in an increase in the water yield during August-November under S1 scenario (
Figure 7b). While under the S2 and S3 scenario, with much higher vegetation coverage, the negative impacts on surface runoff overwhelmed the positive impacts on base flow, finally leading to the increase of water yield. In particular, during the winter season (October-December), the decrease of water yield is even larger than the decrease in surface runoff, which means that the base flow during the winter season has also been negatively affected by the forest and grassland expansion in the basin.
This study was carried out in the upper and middle reaches of the Heihe River Basin, which is a typical inland river basin in the semi-arid and arid region of China, the results of this study can provide information for water resource and land use management in the river basins that with the similar conditions, such as the catchment on the Loess Plateau [
70] and the catchment in the semiarid zone on the southern High Plains, United States [
71]. It is widely acknowledged that land use and climate are the two major factors directly affecting the hydrological processes, while in this study we only took the land use impacts into consideration. It is a particular challenge to distinguish the effects of land use/cover changes from that of concurrent climate variability [
72]. Since the land use/cover change interacts with climate change, it is important to use land use/cover change scenarios that are consistent with the specific assumptions under climate change scenarios when aiming to investigate the combined impacts of land use and climate, and the further separation of their effects in order to detect the individual impacts of land use and climate changes on the hydrological processes is of great importance for land use planning and water resources management [
14]. There are also some studies that investigated the combined impacts of land use and climate on water availability, and further separate the impacts through changing one factor and controlling others constant [
15,
70,
73], the results of these studies showed that climate change was more significant than land use/cover change in determining the hydrological response in the basin. In the Heihe River Basin, several studies have also been conducted to investigate the impacts of land use and climate change, which also showed that the climate variability influenced the surface hydrology more significantly than the land use/cover change [
70,
74]. In this study, the land use/cover change scenarios were designed based on the water availability, if we also take the climate change into consideration, then the water availability for socioeconomic development and ecological conservation will accordingly change and further affect the land use patterns, also along with the changes in precipitation and temperature, the l impacts land use/cover change on the surface runoff and water yield may be totally offset by the impacts of climate changes as the climate variability plays an important role in the land use planning and water resources management. More studies should be conducted to quantify the extent to which land use/cover change and climate variability influence the hydrological processes with consistent water utilization rate, land use and climate scenarios in the future.


