Article

Compilation of an Embodied CO2 Emission Inventory for China Using 135-Sector Input-Output Tables

Department of Urban Engineering, The University of Tokyo, 7-3-1 Hongo, Bunkyo-ku, Tokyo 113-8656, Japan
*
Author to whom correspondence should be addressed.
Sustainability 2015, 7(7), 8223-8239; https://0-doi-org.brum.beds.ac.uk/10.3390/su7078223
Submission received: 27 April 2015 / Revised: 16 June 2015 / Accepted: 17 June 2015 / Published: 25 June 2015
(This article belongs to the Section Economic and Business Aspects of Sustainability)

Abstract

:
A high-quality carbon dioxide (CO2) inventory is the cornerstone of climate change mitigation. Most of the previously reported embodied CO2 inventories in China have no more than 42 sectors, and this limitation may introduce apparent inaccuracy into the analysis at the sector level. To improve the quality of input-output (IO)-based CO2 inventories for China, we propose a practical energy allocation approach to link the energy statistics to the 135-sector IO tables for China and compiled a detailed embodied CO2 intensity and inventory for 2007 using a single-region IO model. Interpretation of embodied CO2 intensities by fuel category, direct requirement, and total requirement in the sectors were conducted to identify, from different perspectives, the significant contributors. The total embodied CO2 emissions in 2007 was estimated to be 7.1 Gt and was separated into the industrial sector and final demand sector. Although the total CO2 estimations by the 42-sector and 135-sector analyses are equivalent, the allocations in certain groups of sectors differ significantly. Our compilation methodologies address indirect environmental impacts from industrial sectors, including the public utility and tertiary sectors. This method of interpretation could be utilized for better communication with stakeholders.

1. Introduction

Mitigation of climate change requires a comprehensive understanding of anthropogenic greenhouse gases (GHG) including carbon dioxide (CO2) emissions. A systematic framework to evaluate both direct and indirect environmental impacts of goods and services through the supply chain is very helpful for business partners and policy makers. Environmental input-output analysis (EIOA) is one of useful instruments for this purpose [1]. Embodied CO2 emissions and other environmental impacts from the total requirements of any production can be estimated by a single-region IO model or multi-region IO models [2,3,4]. Proper allocation of embodied CO2 emissions in industrial sectors to reveal hidden impacts through the supply chain can be compared to process-based life cycle assessment (LCA) or utilized in hybrid IO analysis [5,6].
China has been the largest emitter of energy-related CO2 since 2006 [7]. Compelling studies have attempted to address embodied GHG emissions in bilateral or global trade [8,9,10]. China’s economy has shown rapid but disproportionate growth. More sophisticated tools such as structural decomposition analysis or multiregional IO models were adopted in the analysis of temporal variations, spatial differences, and inter-regional carbon spillover within China [11,12,13]. One notable technical issue in studies of China’s EIOA relates to aggregation and disaggregation of sectors. China releases input-output tables (IOTs) every five years, but the sector classification in the IOTs is not stable across the years [12]. Another issue is that the number of sectors in the energy statistics of China is different from that in the IOTs. Different adjustment approaches lead to different aggregated sectors in the IOT, and evidence shows that different aggregation may distort the emissions at the sector level [14]. Although the information on China’s IOTs is insufficient [1,15], better aggregation or disaggregation in industrial sectors could provide more reliable EIOA results.
In this study, we compiled an embodied CO2 inventory for 2007 (latest available data) with the majority of the sector information included. The data are useful to analyze indirect environmental impacts from entire life cycle of industrial sectors including public utility and tertiary industry sectors. Our concern in this study is not the embodied emissions in bilateral trade or virtual carbon flows in the world but focuses on sectoral direct and indirect CO2 emissions from China’s economy. To map on to fewer sectors in the energy statistics, we did not aggregate the sectors in the IOT but conducted a careful disaggregation process to allocate energy consumption into each IO sector. Interpretations of the embodied CO2 intensities were conducted for different aspects to investigate the significant sources. Comparisons between this study and previous results as well as future policy implications are addressed in this article.

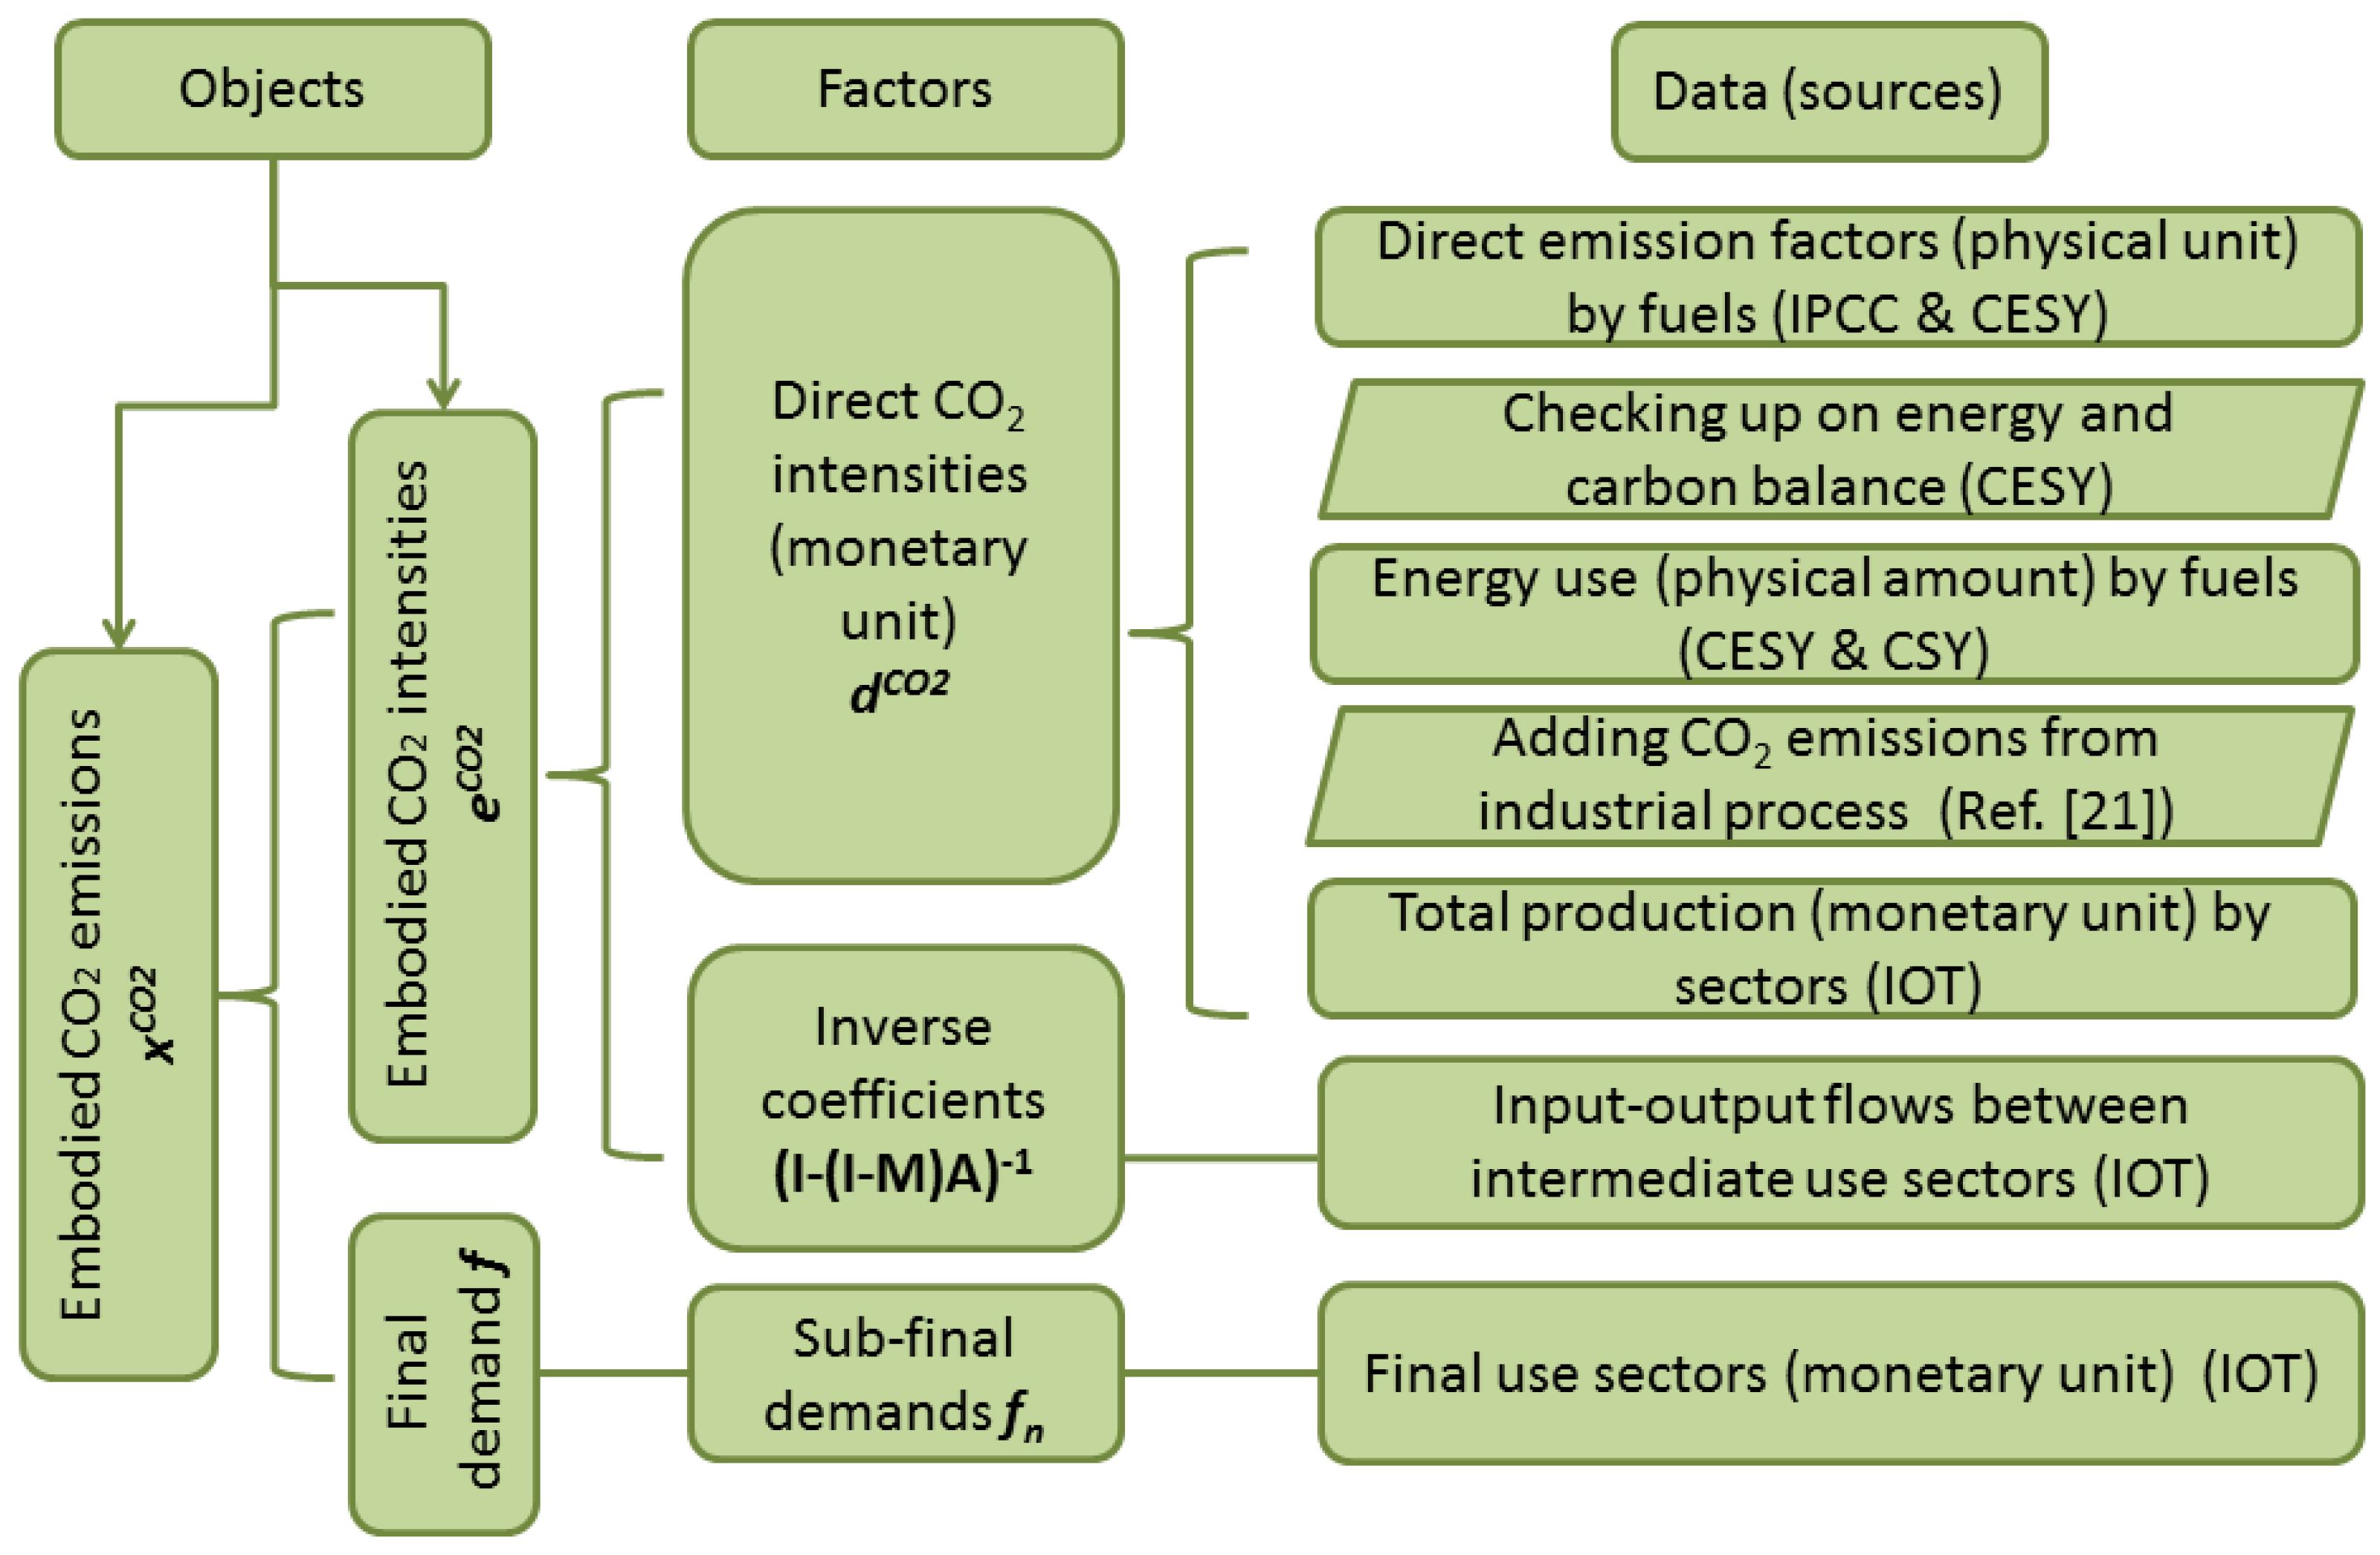
2. Material and Methods

2.1. Data Preparation

In this study, CO2 emissions from fuel combustion in all industries and the industrial process of cement production were taken into account. Direct energy consumption by households was also included owing to its significant contribution [16]. To compile the inventory of embodied CO2 emissions in China, we adopted energy statistics for 2007 from the energy balance sheet and table of final energy consumption in industrial sectors that are found in the China Energy Statistical Yearbook (CESY) [17] and from the table of energy consumption in primary industry (farming, forestry, animal husbandry, and fishery), construction, tertiary industry, and household use that is in the China Statistical Yearbook (CSY) [18]. Besides electricity and heat consumption, direct final consumptions of 16 types of fuels are recorded in the CESY, whereas there are only eight types of fuels in the CSY. Details are listed in Table S1.
The book of 2007 IOTs for China [19] released two IOTs calculated at producers’ prices in 2007. One is 42-commodity by 42-commodity (details listed in code I in Table S2), and the other is 135-commodity by 135-commodity (details listed in code II in Table S2). The latter was utilized as the formal database for the calculations in this study. Based on the values of carbon content in fuels in the IPCC guidelines for GHG inventories [20], an assumption of 100% oxidation, and the corresponding heat values (given as the standard coal equivalent in CESY [17]), the IOT, energy consumption, and industrial emission in cement production were integrated to compile a database of the embodied CO2 emission inventory for China in 2007.

2.2. Direct CO2 Intensities by IO Sector
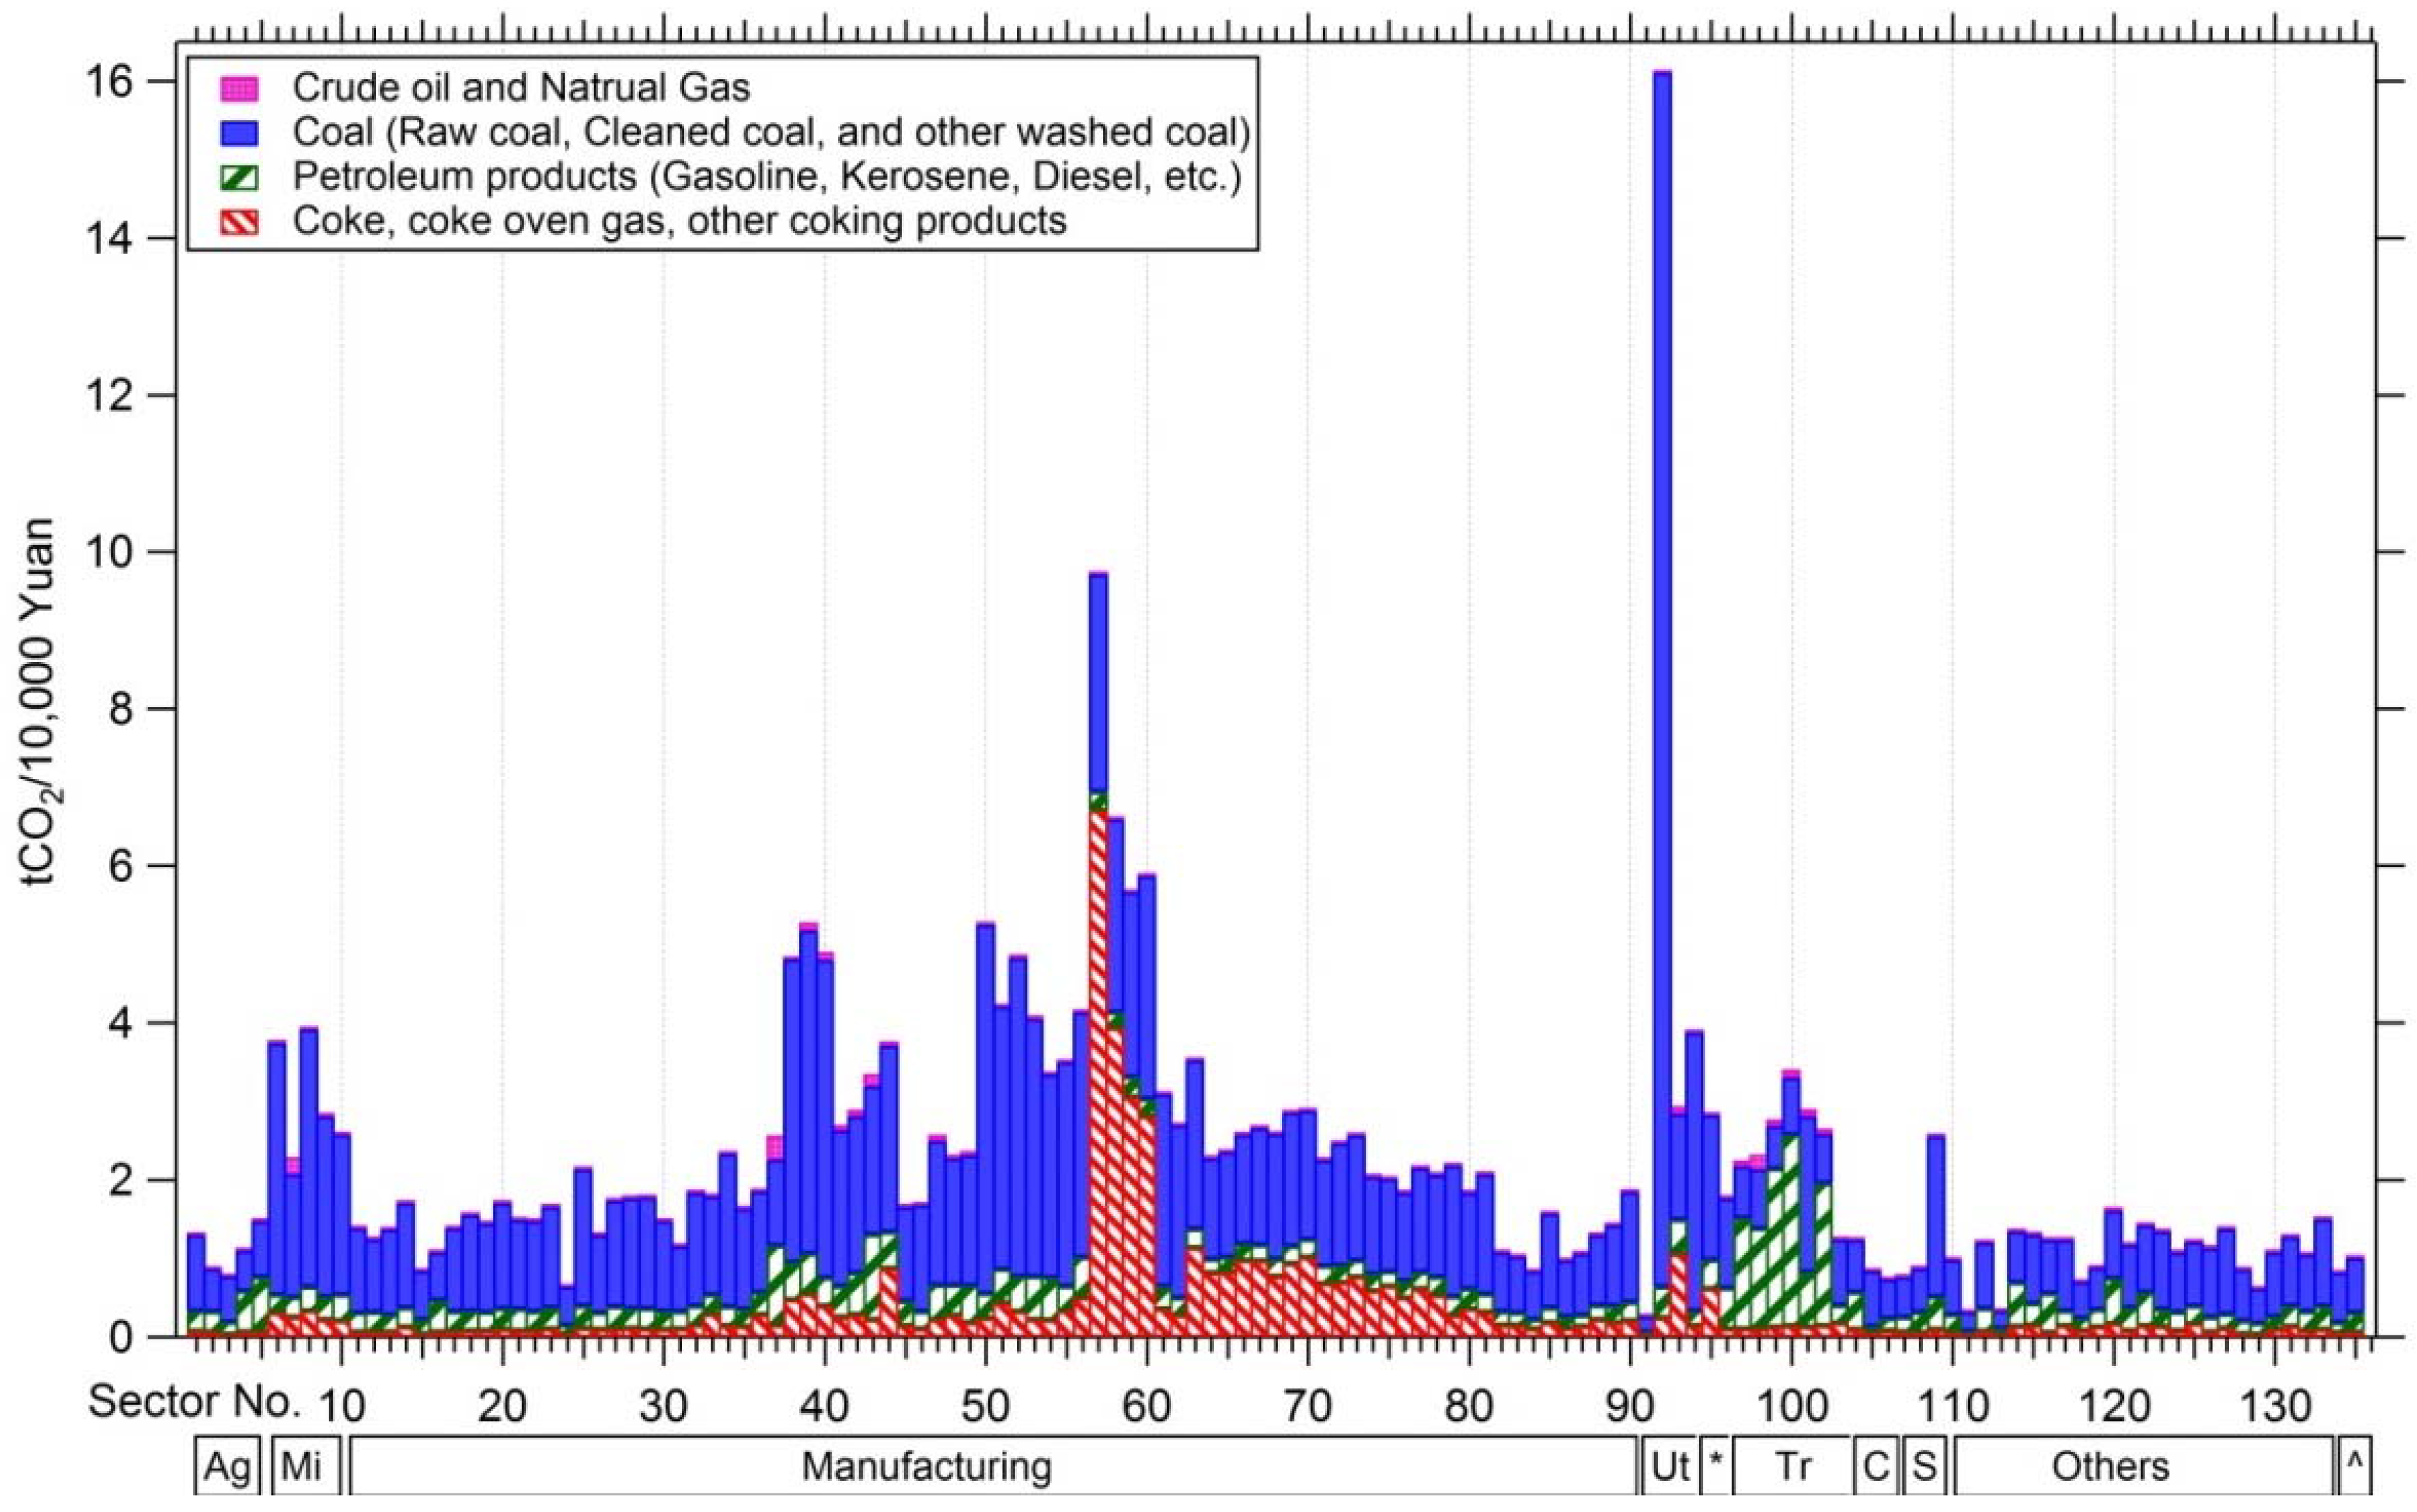
CO2 emission factors (EF) for combustion were estimated by fuel as Equation (1):
E F k = C k × O k × L H V k × 44 / 12
where Ck is the carbon content of fuel k on a basis of its lower heating value (LHV) (also known as net calorific value); k = 1, 2, …, 16 represents different types of fuels; Ok is the oxidation rate in combustion, where the default oxidation rate is 100% due to the prudence principle of carbon accounting; and LHVk is the LHV per unit of fuel k.
Besides CO2 emissions of industrial processes, direct CO2 emission intensities by sector can be written as Equation (2):
d j C O 2 = ( k E F k × e n e r g y k , j + n o n _ e n e r g y j ) x j = k d k , j C O 2 + d n e , j C O 2
where EFk is the CO2 emission factor for combustion of a unit amount of fuel k; e n e r g y k , j is direct energy consumption of fuel k by sector j in IOT; n o n _ e n e r g y j is the CO2 emission of industrial processes in sector j;   x j is the total output of sector j; d k , j C O 2 is the direct CO2 intensity of fuel k in sector j; d n e , j C O 2 is the direct CO2 intensity of non-energy sources in sector j; The most significant non-energy emitter from industrial processes is cement production (coke as a reducing agent in the steel industry is reported in the category of energy use in this study). We adopted the industrial emissions of the cement industry in China from a recent detailed study [21].
To accurately determine the allocation of direct emitters in fuel combustion, not only the final use of energy in industrial sectors, but also energy inputs or losses during energy transformation processes, were included in the calculations of CO2 intensities. Energy inputs for the generation of electricity and heat were completely allocated to energy consumption in the sector production and supply of electric power and heat power (No. 92 in IOT), as the consumption of purchased electricity or heat in other sectors will not emit CO2 directly. Energy loss in coal washing was allocated to energy consumption in the sector mining and washing of coal (No. 2 in IOT). We also checked the energy and carbon balances in the coal, coke, and crude oil balance sheets in CESY to estimate the efficiency and loss rate of energy transformation in coking, petroleum refineries, and gas production. We allocated the energy losses in these processes to energy consumption in sectors entitled coking (No. 38 in IOT), processing of petroleum and nuclear fuel (No. 37 in IOT), and production and distribution of gas (No. 93 in IOT), respectively. All these adjustments are fuel-specific.
Since the sector resolution of energy statistics is less than the 135 sectors in the IOT, our original procedure was to allocate the various types of fuel consumption to different industrial sectors based on direct input coefficients from corresponding fuel processing sectors to other industrial sectors. Provided there is a sector j in the energy statistics that corresponds to the summation of sectors ja and jb in the IOT. The consumption of fuel k in sector ja can be estimated by Equations (3) and (4):
e n e r g y k , j a = e n e r g y k , j × z p , j a / ( z p , j a +   z p , j b )
e n e r g y k , j = e n e r g y k , j a +   e n e r g y k , j b
where sector p produces the fuel(s) k; zp,ja and zp,jb are direct inputs in monetary units from sector p to sectors ja and jb, respectively. All sectors related to energy processing are listed in Table 1. A similar allocation principal could be found in [22], though they directly allocate CO2 emissions to different sectors.
Table 1. Fuel extraction and processing sectors in IOTs for China (2007).
No.Sectors (p) in IOTDesignated Fuels (k) in Energy Statistics
006Mining and Washing of CoalRaw coal, cleaned coal, and other washed coal
007Extraction of Petroleum and Natural GasCrude oil and natural gas
037Processing of Petroleum and Nuclear FuelAll petroleum products such as gasoline, diesel, etc.
038CokingCoke, coke oven gas, and other coking products

2.3. Environmental IO Model

We mainly followed the instructions for the embodied energy and emission intensity data (3EID) for Japan [23] to compile this embodied CO2 inventory for China (Figure 1).
Figure 1. Framework for the compilation of an embodied CO2 inventory for China.
Sustainability 07 08223 g001
Following the basic framework of an environmental IOT [2], embodied CO2 emissions can be written as Equation (5):
x CO 2 =   [ d CO 2   ( I A ) 1 ]   f
where xCO2’ is the vector of embodied CO2 emissions induced by final demand; dCO2 = [djCO2] is the vector of direct CO2 emission intensities in sector j, defined in Equation (2); I is the identity matrix; A is the matrix of direct input coefficients; A = [aij]; (IA)−1 is the Leontief inverse matrix; and f is the vector of final demands with a breakdown of domestic final consumption (urban, rural, and governmental) fc, gross capital formation (fixed investment and storages) fk, and exports fx.
In this study, we adopted the assumption of all competitive imports [24]. This assumption is not accurate [25], but we do not have sufficient details of the import structure in China or embodied intensities by sector for other trade partners. Moreover, our concern is sectoral allocation of CO2 emissions in domestic production rather than emissions embodied in net import or export. The competitive import model requires estimation of import ratio by sector. Import ratios were estimated as Equation (6):
m i = x i m / ( j a i j x j + f i c + f i k )
where x i m is the import value in sector i; and j a i j x j represents the total intermediate use of sector i. Exports are excluded in the final demands in the denominator, since imported goods could not be exported directly in the IO model [24].
The Equation (6) and underlying assumption of competitive imports may introduce two kinds of biases. First, the carbon intensities in imports may differ from the carbon intensities of domestic products in China, probably lower than China’s value if it is imported from developed countries [25]. The equivalent value (based on the same carbon intensity) of import goods for intermediate use may be smaller than the face value of imports. Second, there is only one value of import ratio in one sector, assuming that the intermediate use of imported goods and domestic goods of one sector by all industries share the same ratio, which is not always true. Both limitations can be overcome by separated information of domestic intermediate inputs and imported intermediate inputs by sector with corresponding emission intensities. This cannot be done in a single-region IO model but has been accomplished in some multi-region databases such as the OECD ICIO database, the World Input-Output Database (WIOD), and the Eora multi-region IO database (EORA) [26,27,28]. However, the treatments of sector aggregation in these models are not exactly the same as our framework, therefore competitive imports assumption was kept with limitations in this study.
Providing Equations (5) and (6), embodied CO2 emissions induced by final demands of domestic products (excluding embodied emissions in imports) as a production-perspective inventory, can then be rewritten as [24]
x CO 2 = [ d CO 2   ( I ( I   M ^ )   A ) −1 ] × f * = [ d CO 2   B ] × [ ( I   M ^ ) ( f c + f k ) + f x ]
and
e CO 2 = d CO 2 B
where xCO2 is the vector of embodied CO2 emissions excluding imports; eCO2 = [ejCO2] is the vector of embodied CO2 intensities; M ^ is a diagonal matrix of import ratios [ m i ], given à = (I M ^ )A = [ãij]; B = (IÃ)−1 = [bij]; and the final demand of domestic products is f* = (I M ^ )(fc + fk) + fx.
If we transform the vector of d CO 2 into the diagonal matrix d ^ CO 2 = [diiCO2] in Equation (8), we can perform a breakdown of embodied CO2 intensities in sector j by direct input from sector i ( e i j C O 2 ) , as follows:
e j C O 2 = i e i j C O 2 = i d i i C O 2 × b i j
On the other hand, the indirect CO2 intensity in sector i is the embodied CO2 intensity subtracted from the direct CO2 intensity, and these three components have the relationship:
e j C O 2 = d j CO 2 +   i e i C O 2 × a ˜ i j
This breakdown of embodied intensities is useful to analyze the contributions of the supply chain because it interprets the indirect emissions of sector i as a summation of the indirect emissions of all sectors in the direct input to sector j. Detailed explanation can be found in a previous study of 3EID in Japan [23].
The embodied CO2 intensities could also be decomposed by fuel category (including non-energy sources) by combining Equations (2) and (8):
e k CO 2 = d k CO 2 B = [ d k , j C O 2 ] B
e n e CO 2 = d n e CO 2 B = [ d n e , j C O 2 ] B

3. Results and Discussion

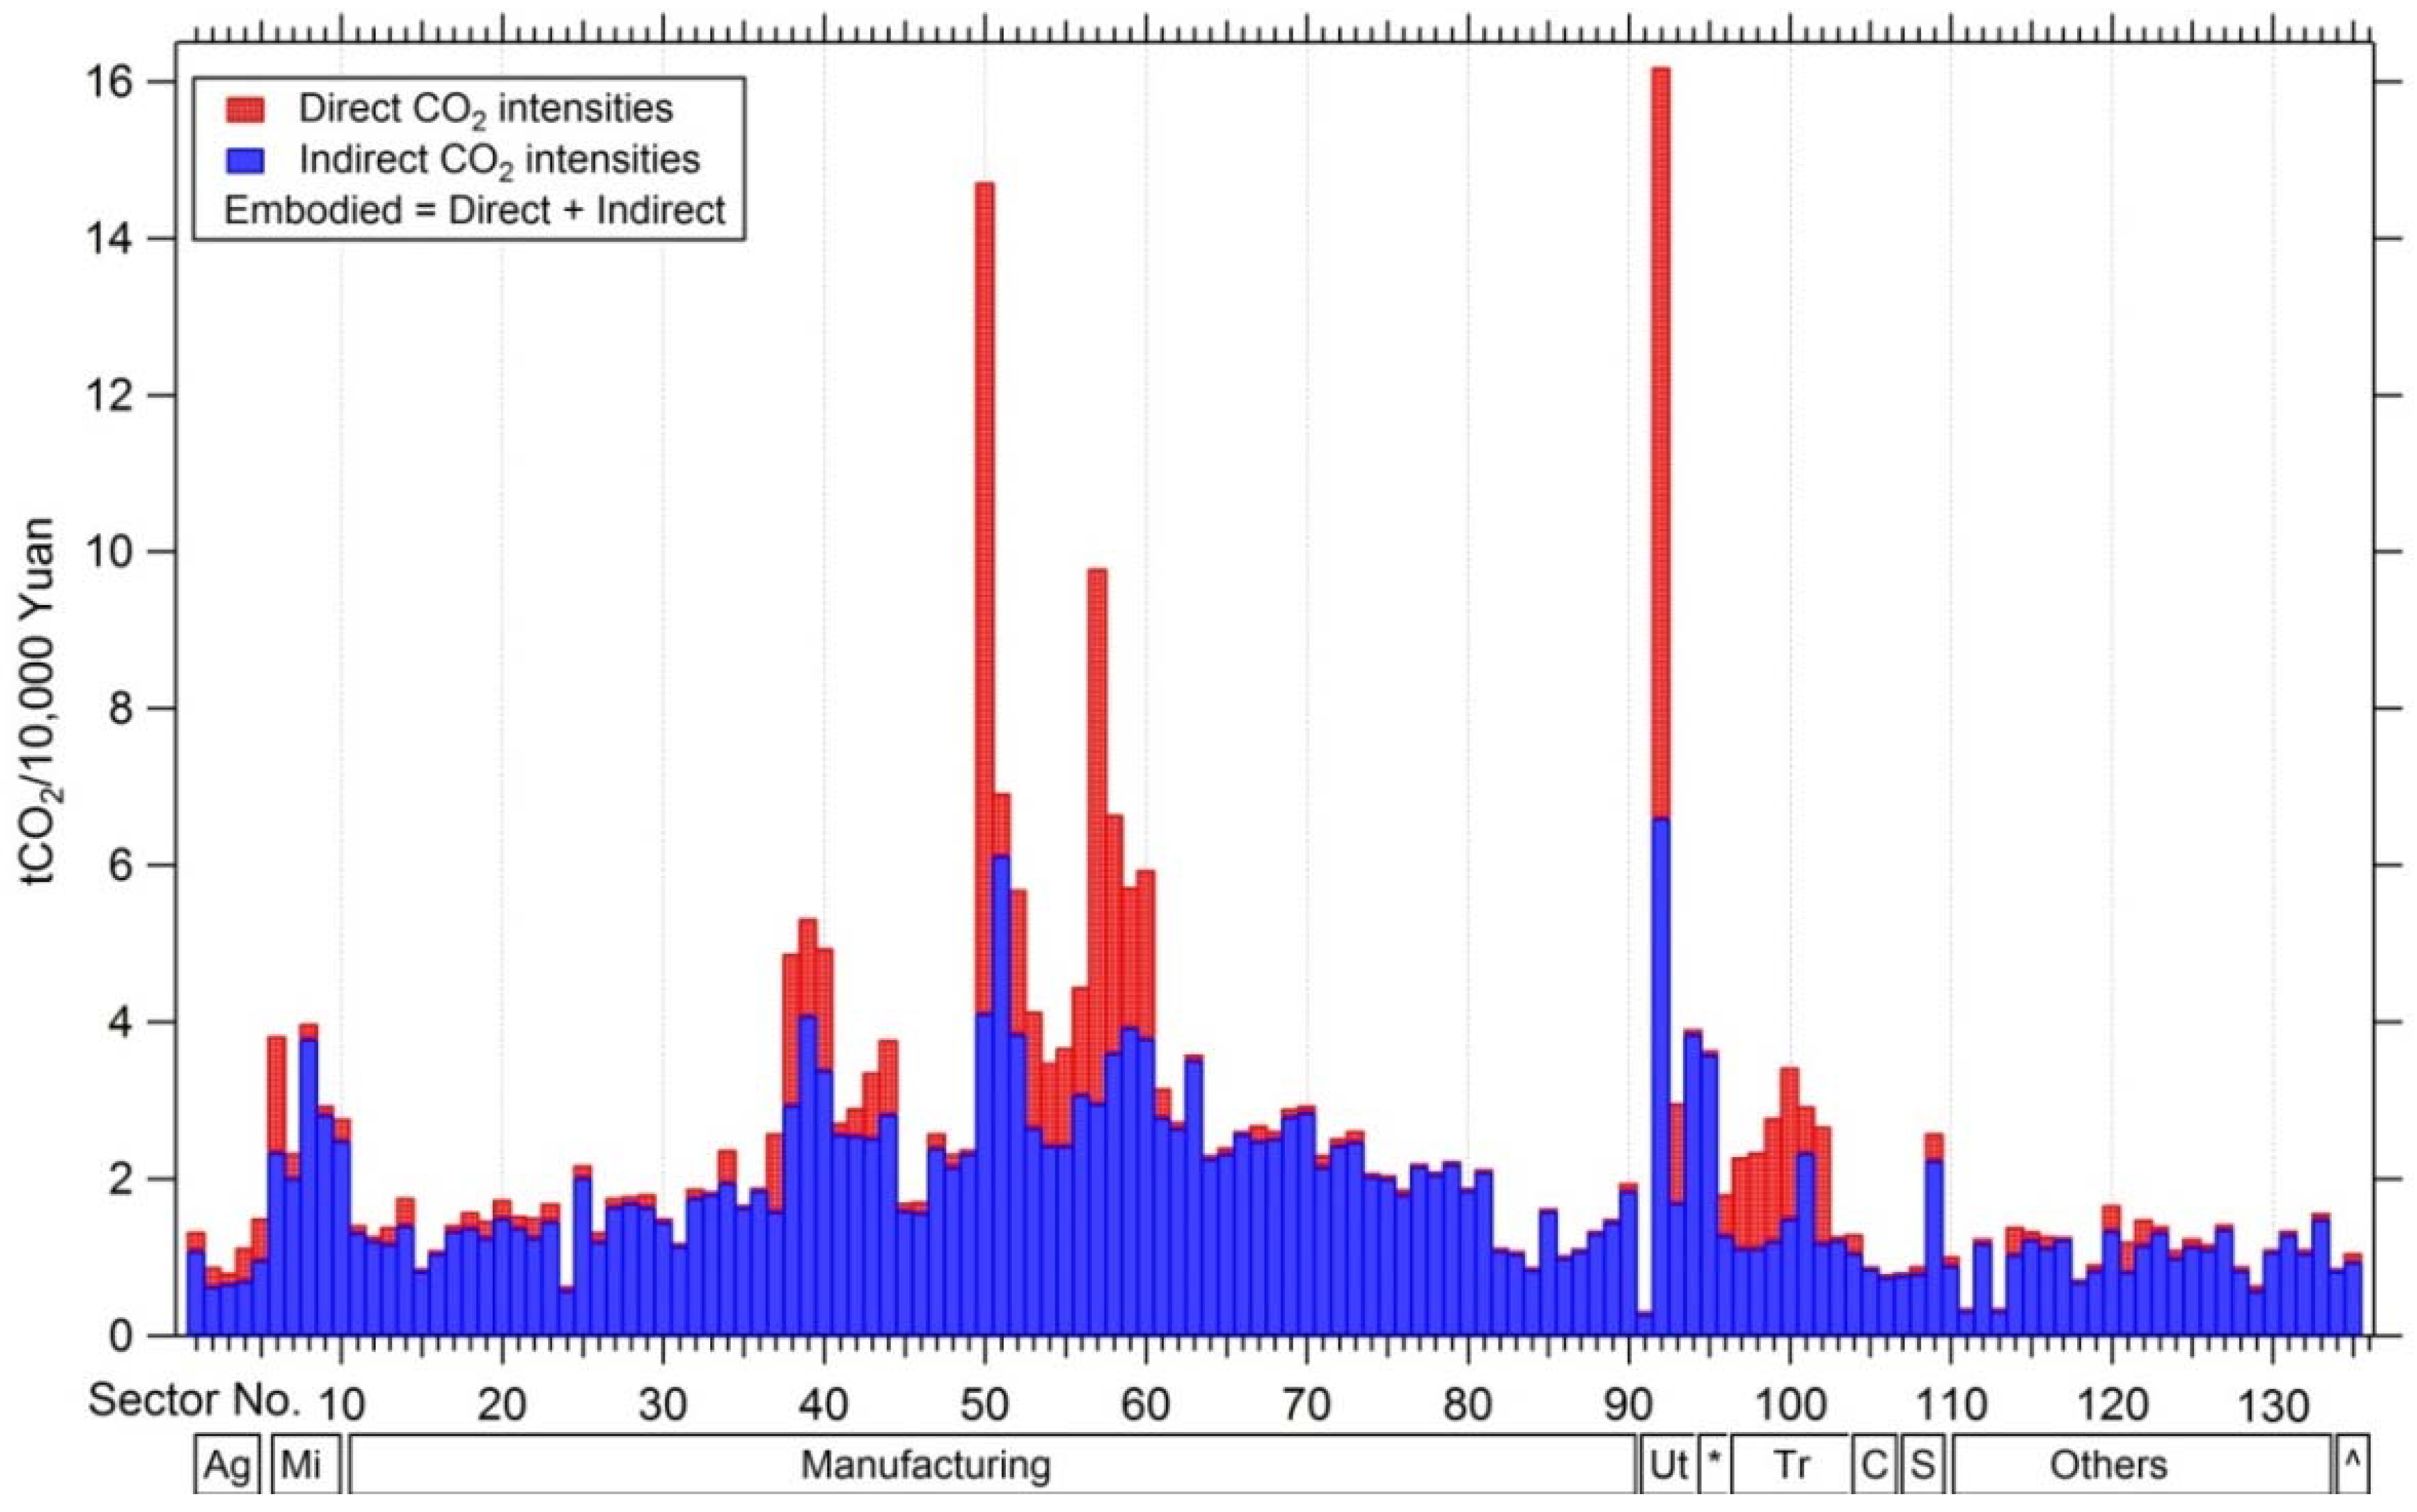
3.1. Embodied CO2 Emission Intensities

The embodied CO2 intensity is the sum of the direct and indirect CO2 intensities. As shown in Figure 2, large differences exist between the embodied CO2 intensities of the 135 sectors in the Chinese IOT in 2007 (Table S3). The production and supply of electrical power and heat power sector(No. 92) was estimated to have the highest intensity (16.2 t CO2/10,000 Yuan), followed by the manufacture of cement, lime, and plaster sector(No. 50) and the iron-smelting sector(No. 57) (14.7 t CO2/10,000 Yuan and 9.8 t CO2/10,000 Yuan, respectively). Besides these three sectors, direct contributions to the embodied intensity in the transportation services sectors (railway, road, urban public transit, water, air, and other cargo services) are larger than 50%. The embodied CO2 intensities in other sectors are dominated by indirect intensities from the supply chain. The indirect CO2 intensity of the production and distribution of water sector (No. 94) shows a very high contribution (98%), suggesting that the estimation of CO2 emissions in such sectors should take indirect emissions into account because the total CO2 emissions will consequently increase more than they would from direct emissions alone due to the growth of demand in such sectors.
Figure 2. Direct and indirect CO2 intensities by sector (sector groups include Ag: Agriculture, Mi: Mining, Manufacturing, Ut: Utilities, *: Construction, Tr: Transport services, C: Computer services, S: Sales & Hotel, Other services, and ^: Administration).
Sustainability 07 08223 g002
Figure 3. Embodied CO2 intensities broken down by sector and fuel category (sector groups include Ag: Agriculture, Mi: Mining, Manufacturing, Ut: Utilities, *: Construction, Tr: Transport services, C: Computer services, S: Sales & Hotel, Other services, and ^: Administration).
Sustainability 07 08223 g003
Figure 3 shows the breakdown of embodied CO2 intensities by fuel category (Table S4). Combustion of coal dominates the embodied intensities in most sectors. The contributions of coke and other coking products are significant in the sectors related to smelting and rolling of metals, and the contribution of petroleum products is significant in the transport services sectors.
Indirect emissions from electricity and heat in other industrial sectors are found to be the main contributors because the energy structure and electricity generation system in China are coal-dominated [12]. Previous studies have emphasized the interpretation of the total contributions of electricity and heat to embodied CO2 intensities, but there are at least three tiers (Tables S4–S6) to interpreting the indirect emissions from electricity and heat (subscript 92) to the designated sector j. The narrowest (tier 1) is the ratio of d 92 × a ˜ 92 , j / e j . This emission is directly generated in sector No. 92 (in the IOT) and contributes to the embodied intensity of sector j and is embodied in the direct requirement of electricity and heat by sector j. The second (tier 2) is the ratio of e 92 × a ˜ 92 , j / e j . This contribution is a direct and upstream emission contribution in sector No. 92 to the embodied intensity of sector j and is embodied in the direct requirement of electricity and heat by sector j. The broadest (tier 3) is the ratio of e 92 , j / e j . This contribution is the direct and upstream emission contribution in sector No. 92 to the embodied intensity of sector j and is embodied in the total requirement of electricity and heat by sector j. As shown in Figure 4, the average tier 1 contribution (±its standard deviation) is 10% ± 8%, the average tier 2 contribution is 18% ± 13%, and the average tier 3 contribution is 49% ± 13%. Therefore, generally speaking, half of the embodied CO2 intensity in a sector is ultimately impacted by CO2 emissions in the electricity and heat generation sector.
Figure 4. Relative contributions from electricity and heat in different tiers to embodied CO2 intensities of all sectors (sector groups include Ag: Agriculture, Mi: Mining, Manufacturing, Ut: Utilities, *: Construction, Tr: Transport services, C: Computer services, S: Sales & Hotel, Other services, and ^: Administration).
Sustainability 07 08223 g004

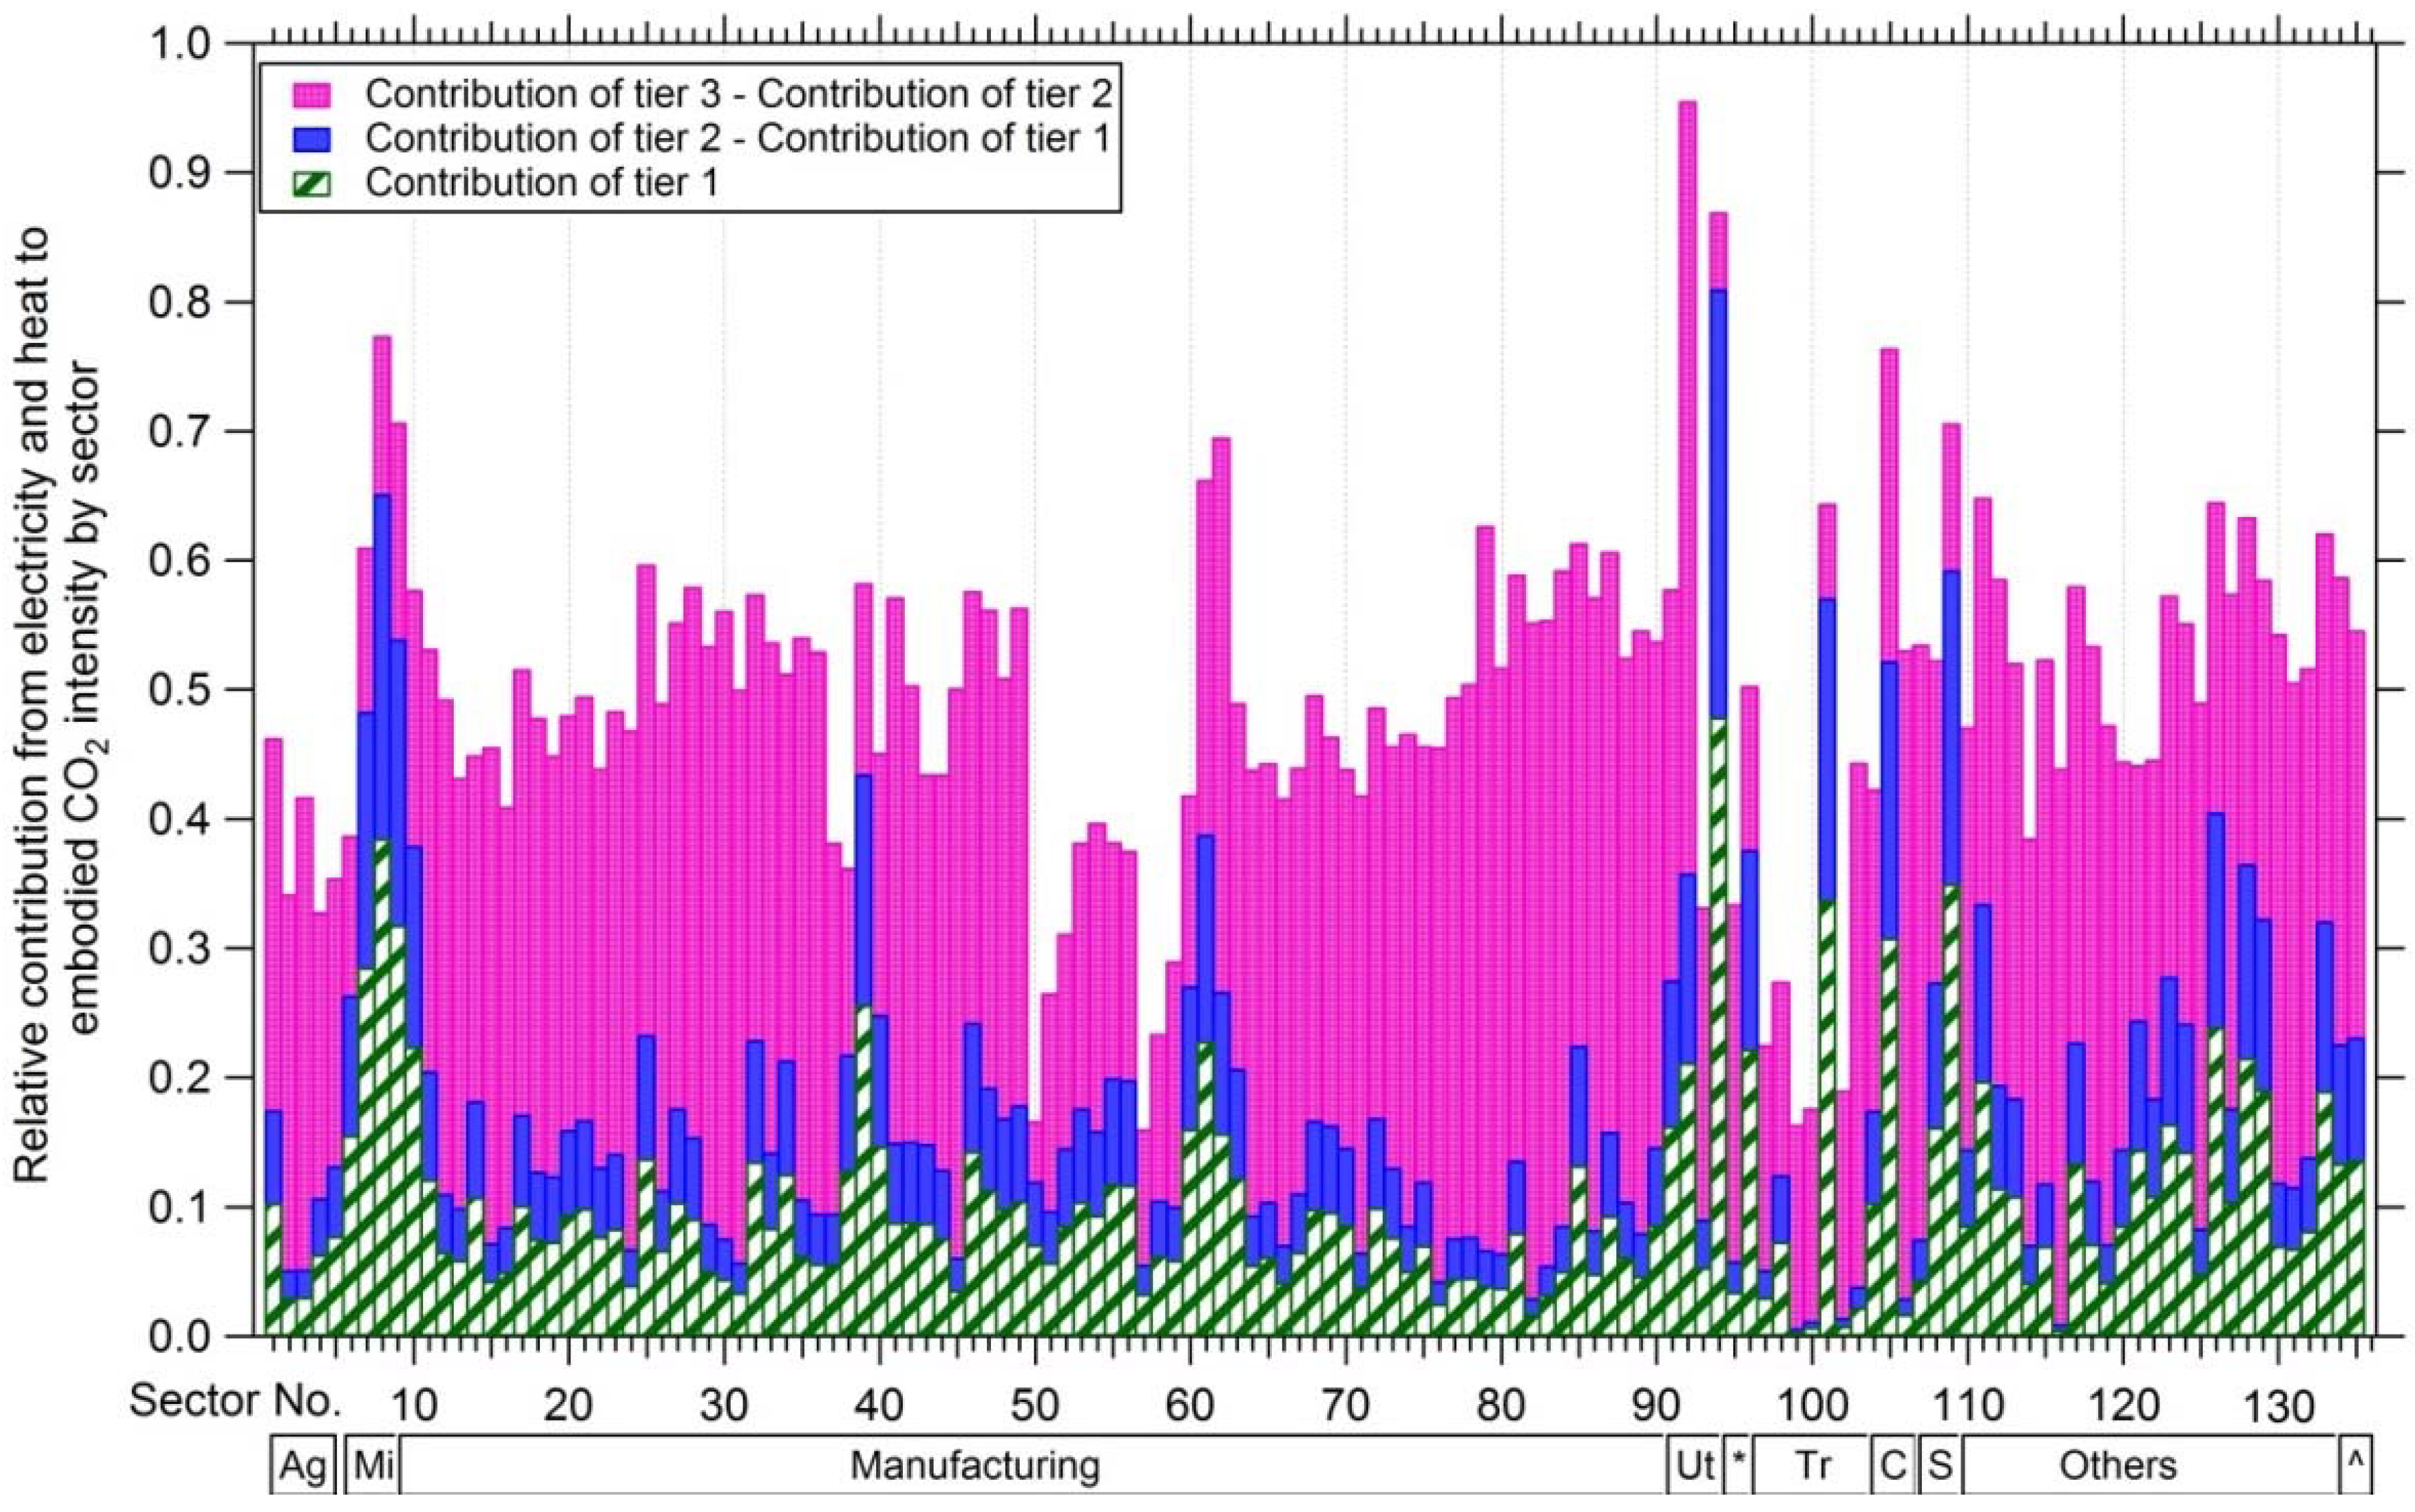
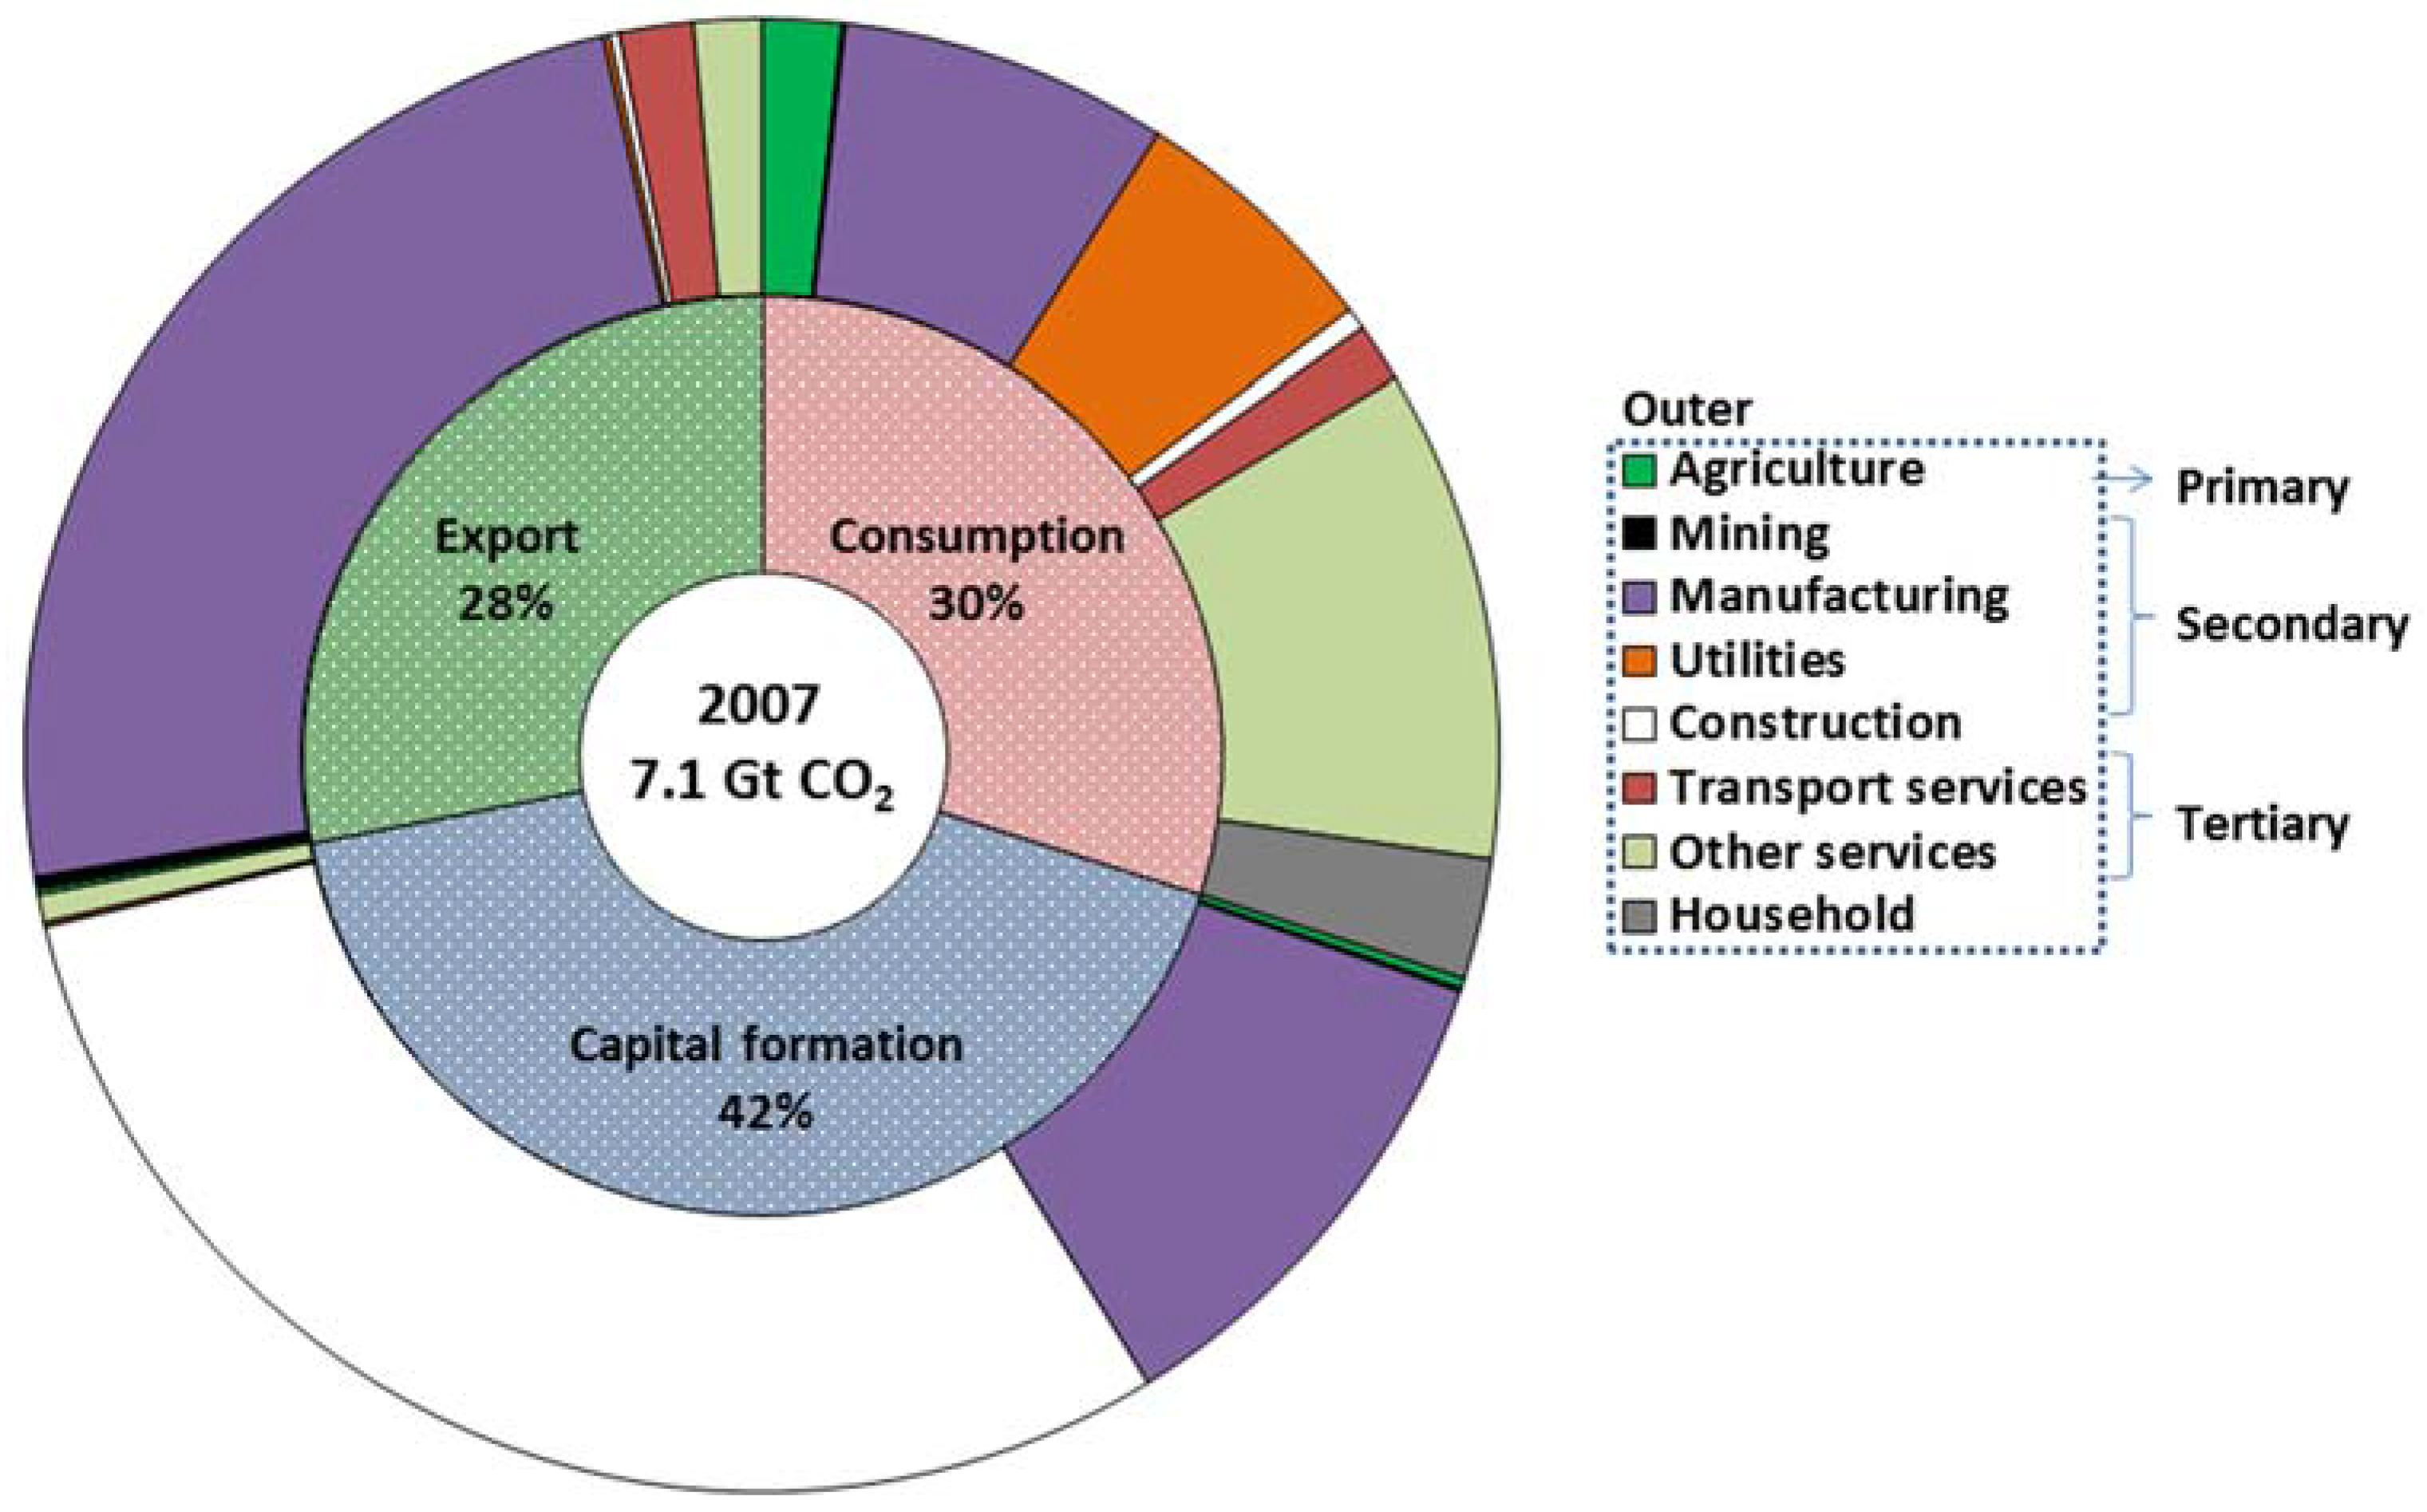
3.2. Composition of Embodied CO2 Emissions

The composition of embodied CO2 emissions is summarized in Figure 5. In 2007, China emitted 2.1 Gt of CO2 (30%) due to domestic consumption, 3.0 Gt (42%) due to capital formation, and 2.0 Gt (28%) due to exports. These results are very different from those in Japan where emissions induced by household consumption dominate [29]. However, previous studies in China also demonstrated that capital formation was responsible for half of the growth in CO2 emissions during 1992 and 2002 [12]. It is reasonable that the contribution of exports to the embodied CO2 emissions has increased since then because the amount of exports from China grew steadily during these years and the emission intensities from exports were found to be higher than those from imports [25]. Figure 5 shows the composition of our embodied CO2 inventory for the final demand categories (inner) and corresponding industrial sectors (outer). Emissions due to direct energy consumption in households were calculated using EFk in Equation (1) and were also taken into account as an additional sector belonging to the first inner sectorial area of emissions induced by domestic final consumption. These emissions were found to have a significant contribution (~3%) to the total CO2 emissions in China. The sectors regarding construction and manufacture of equipment dominate the embodied emissions induced by gross capital formation, and the manufacture of various industrial products dominates the embodied emissions induced by China’s exports. Detailed results of CO2 emissions by sector are shown in Tables S7 and S8.
Figure 5. Composition of embodied CO2 emissions for China (2007).
Sustainability 07 08223 g005

3.3. Comparison with CO2 Estimates in Previous Studies

The estimation of direct CO2 emissions by sector in this study is compared with previous results in Table 2. The CO2 emissions only related to energy combustion in some databases are significantly lower than other estimations including emissions from industrial processes. Our estimation is close to the estimation by the Carbon Dioxide Information Analysis Center (CDIAC) [30], and lower than the total summation of provincial energy statistics but higher than other estimations based on national statistics [31]. There are also direct CO2 estimations in the environmental accounts in some multi-region IO databases, e.g., the WIOD and the EORA database. CO2 estimation in WIOD only revealed the emission related to energy combustion [27], whereas the CO2 estimation in EORA covered energy combustion, industrial processes, and even other sources like change of land use and waste disposal [32]. Besides the apparent difference of system boundaries, the main reasons for the discrepancies between this study and other estimations are two-fold. One reason is the oxidation rate used; our study assumed a 100% maximum oxidation rate, but other studies [31,33,34] used 80%–95%, according to China’s local guidelines (with certain variability) [35]. The other reason is the deduction of the non-energy use of fuels, which was estimated at 216 Mt CO2 and all of which was considered as a CO2 source in this study. The significant contributors here are non-energy use of coal and “other petroleum products”. Some portion of the non-energy use in other petroleum products includes lubricants (which should be deducted), but the main component of the non-energy use of coal is the raw material used in the production of synthetic ammonia and other chemicals [36]. Coal acts as a reducing agent, rather than an energy source in this case, but the carbon will be oxidized and ultimately discharged as CO2. Even though we do not consider the details of the non-energy use of fuel, an additional difficulty is how to allocate this deduction of non-energy use into IO sectors. There are not sufficient data to support this allocation. Hence, we retained a component of total CO2 emissions to provide an upper limit reference.
The total embodied CO2 emissions should theoretically equal the total direct CO2 emissions from industrial sectors because our estimation only considers the emissions induced by final demands of domestic products and does not include the emissions embodied in imports but does include the emissions embodied in exports. In other words, it is a production-perspective inventory. The estimated embodied CO2 emission for China in 2007 is 7.1 Gt, which is 0.3 Gt larger than the direct CO2 emissions. The main reason for this discrepancy is the distortion by the sector Others in final demands. The CO2 induced by the final demand of Others was estimated at −0.3 Gt [33] and was thought to be an error with no meaning [12].
Table 2. Comparison of China’s direct CO2 emissions in 2007 from different sources.
SourcesCO2 Emissions (Mt)NoteReference
Chen and Zhang6390Local oxidation rate[33]
CDIAC6791Including cement production[30]
EORA7382Including all industrial processes[37]
Guan et al.6359Local oxidation rate[31]
7334Provincial summation
IEA6032Only energy-related[38]
Liu et al.7204Provincial summation[34]
WIOD5542Only energy-related[27]
This study6810Including cement production

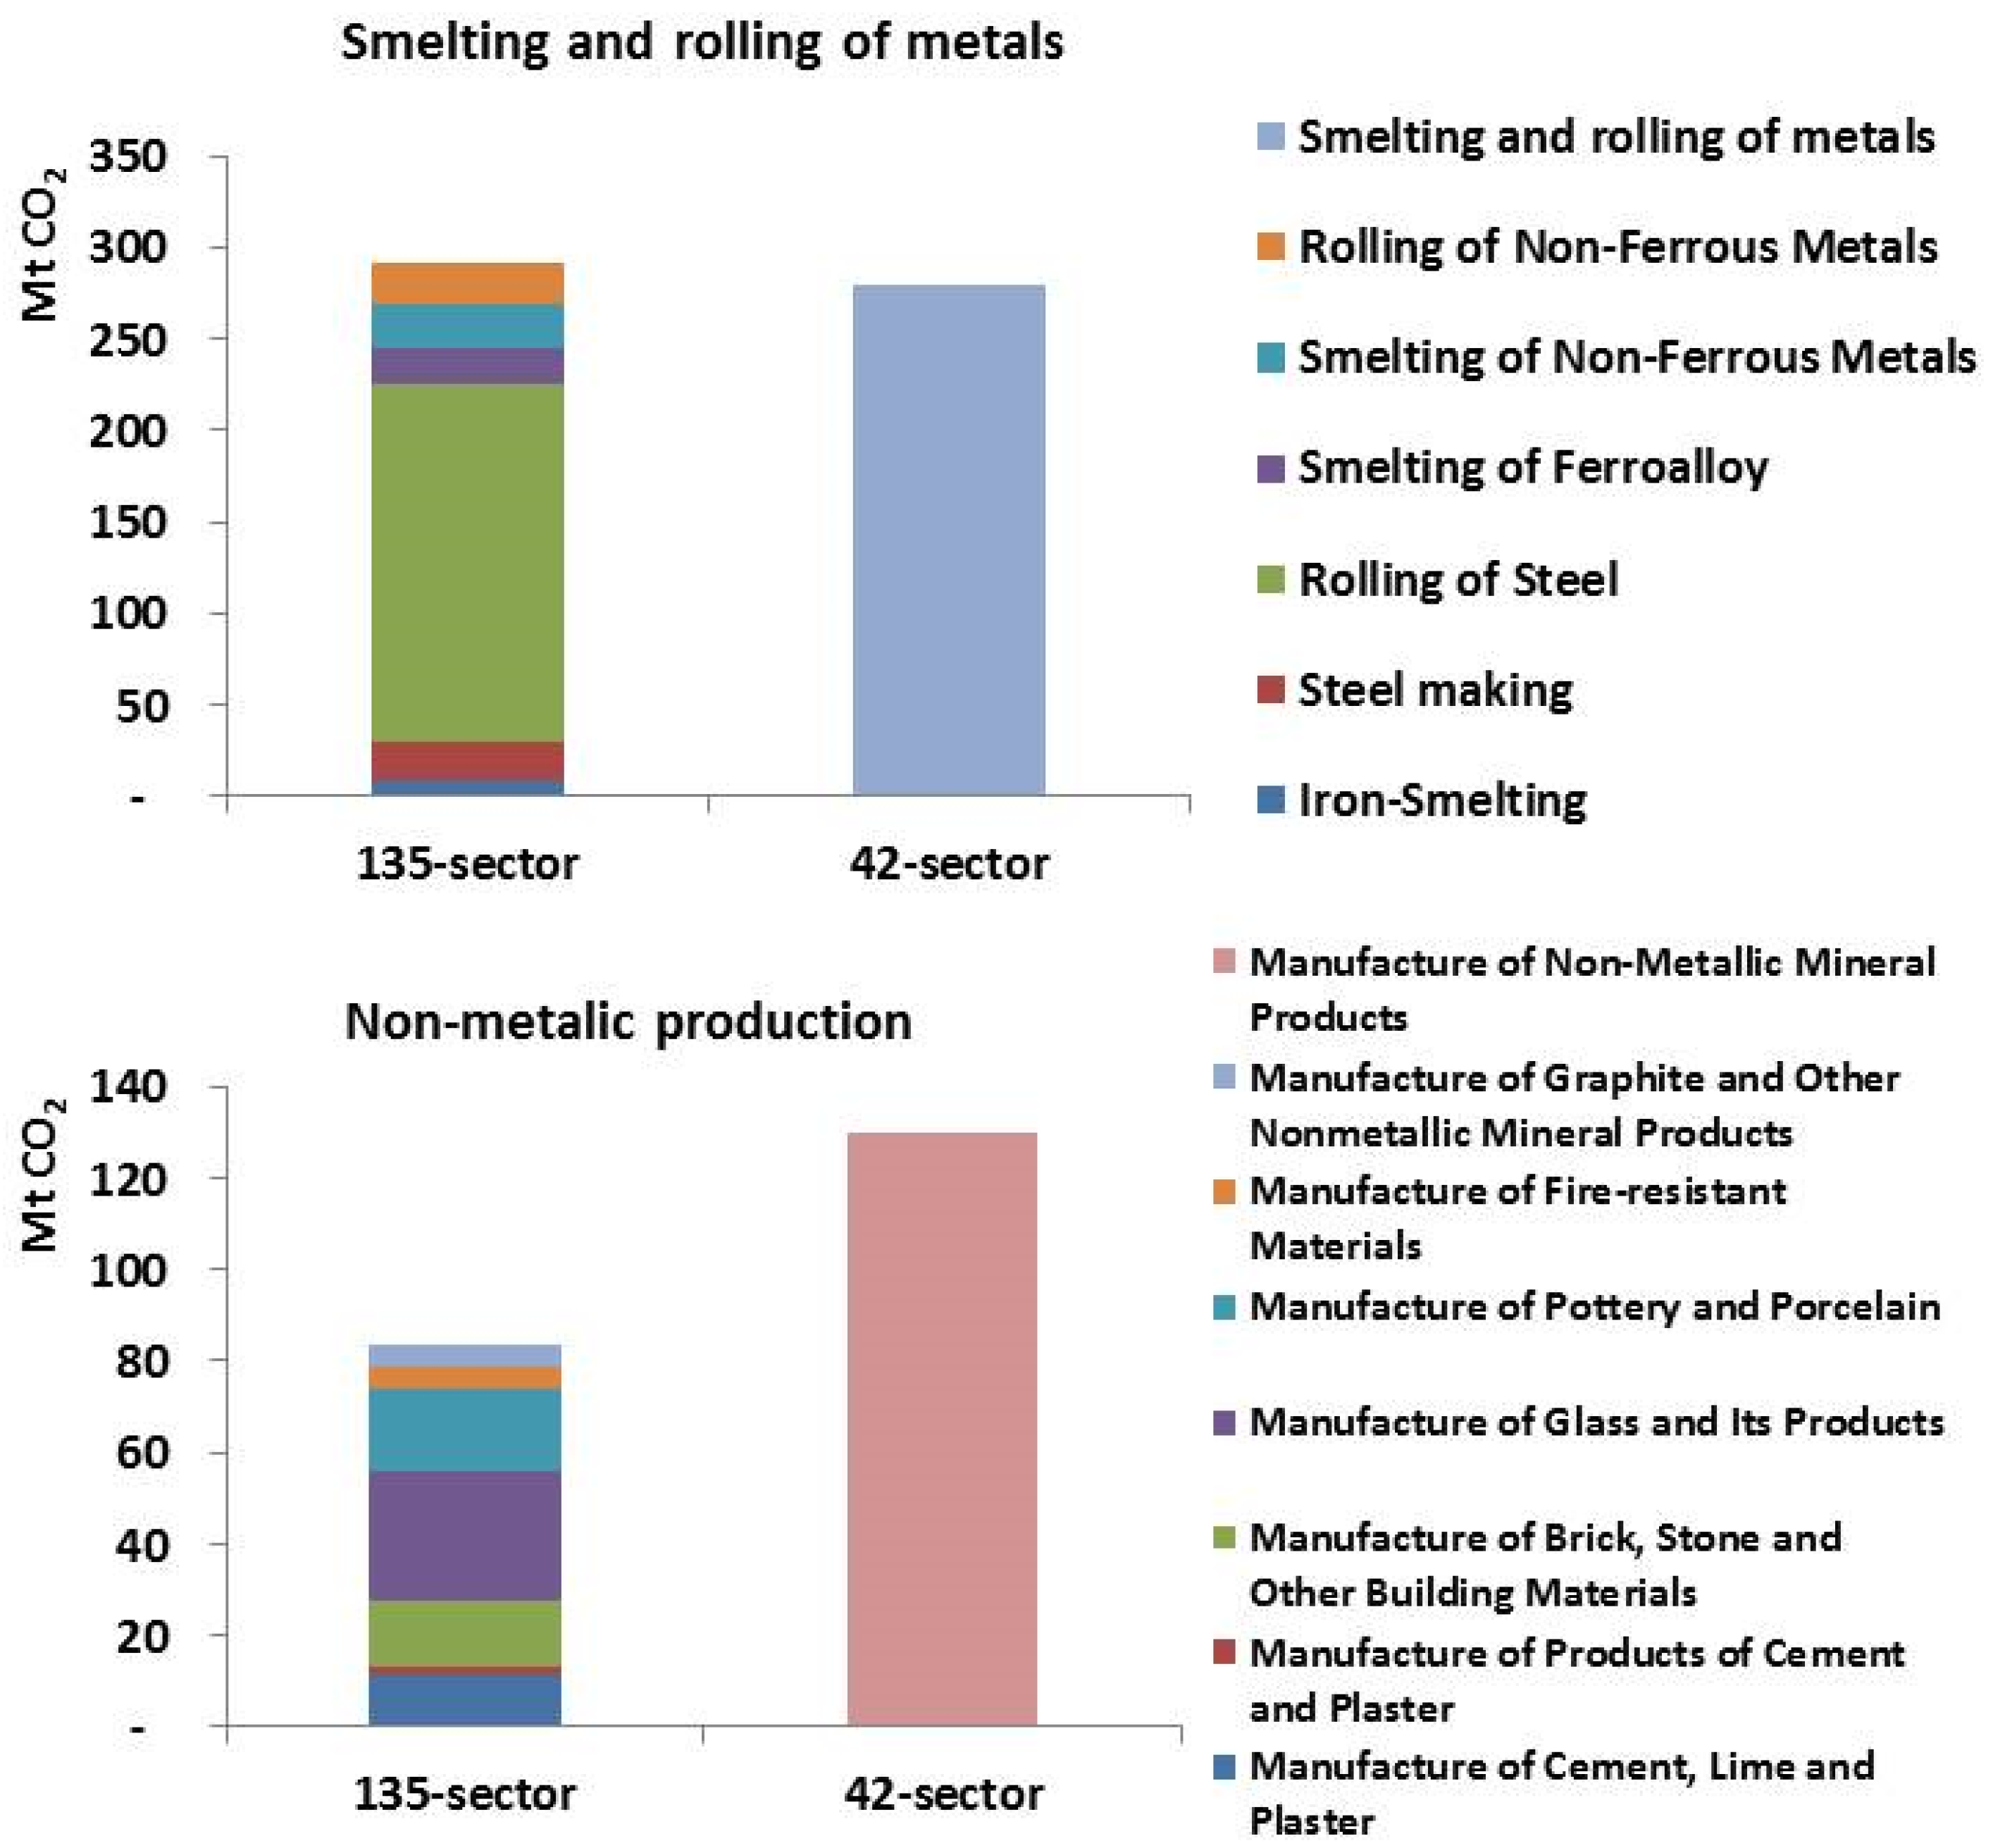
3.4. Comparison of Modeling Results for Different Sector Resolutions

We used the same methodology to compile a 42-sector embodied CO2 intensity and inventory for China in 2007. The only difference is that some sectors in the energy statistics needed to be summed to correspond to the 42 sectors in the IOT. The differences between 135-sector resolution and 42-sector resolution in the embodied CO2 emissions by domestic final consumption, gross capital formation, and exports were estimated at 4%, 6%, and 4%, respectively. However, the biases in embodied CO2 intensities and the emissions in the corresponding sectors are sometimes larger than these values. For instance, there is only one sector in the 42-sector IOT relating to iron and steel production, smelting and rolling of metals (No. 14 in code I system), which has an average embodied CO2 intensity of 4.8 t CO2/10,000 Yuan; however, there are five sectors (Nos. 57–61 in code II system) in the 135-sector IOT relating to such production, and the embodied CO2 intensities of these sectors range from 3.2 t CO2/10,000 Yuan to 9.8 t CO2/10,000 Yuan. The embodied CO2 emissions for the smelting and rolling of metals in the 42-sector resolution was estimated at 279 Mt CO2, while the summation of the embodied CO2 emissions from sector No. 57 to sector No. 62 in the 135-sector resolution yielded 292 Mt CO2 (1.05 times that of the 42-sector result; Figure 6, upper). On the other hand, the evaluation of embodied CO2 emissions in the manufacture of non-metallic mineral products sector (including manufacture of cement and cement products) in the 42-sector resolution, and the results of its subsectors in the 135-sector resolution, revealed significant overestimation by the 42-sector resolution; the embodied CO2 emissions in the manufacture of non-metallic mineral products sector were estimated at 129 Mt CO2, but the summation of emissions from its subsectors (sector No. 56 to sector No. 60) in the 135-sector resolution was determined to be 84 Mt CO2, which is 65% of the previous estimation (Figure 6, lower). Therefore, the aggregation of sectors can clearly distort the allocation of the embodied emissions, especially in sectors with large emissions. Caution should be exercised in directly using embodied CO2 intensities derived with low sector resolution to link with other process-based data or to input into a hybrid-LCA model.
Figure 6. Comparison of embodied CO2 emissions in sector(s) corresponding to smelting and rolling of metals (upper) and non-metallic production (lower) by 135-sector and 42-sector resolution.
Sustainability 07 08223 g006
Similar evidence could be found in the comparison of this work with previous studies. The embodied CO2 intensities in 2007 in the manufacture of non-metallic mineral products sector and the smelting and pressing of metals and manufacture of metal products sector by 28-sector resolution were estimated at 3.0 t CO2/10,000 Yuan and 4.0 t CO2/10,000 Yuan, respectively [8]. These values are almost 30% lower than our estimations, even when we exclude non-energy direct emissions from cement production. In another earlier study with fewer sectors, these embodied CO2 intensities, including non-energy emissions, were estimated at 8.5 t CO2/10,000 Yuan and 5.5 t CO2/10,000 Yuan [33], which are about 20% higher than our 42-sector resolution estimates of 7.1 t CO2/10,000 Yuan and 4.8 t CO2/10,000 Yuan. The differences are thought to be derived from the different direct emission factors and from the import deduction, in addition to the number of sectors.
Su et al. [14] mentioned that if the variations of emission intensities within groups are not negligible, the distortion of emissions at sector level will be significant via theoretical derivation, but they found that the differences of allocated energy-related CO2 emissions between 42-sector and 122-sector resolutions were less than 10% in most groups based on the 2002 Chinese IOT. Based on the 2007 Chinese IOT, this study supports their opinions from both sides. Overall, embodied CO2 emissions estimated by 42-sector and 135-sector resolutions were close to each other. However, the CO2 emissions from industrial process of cement production were also included in this study, so that the emission intensity of cement production is significantly larger than the emission intensities of other non-metallic production, leading to larger bias in this group between 42-sector and 135-sector resolutions. The evaluations of effects of aggregation/disaggregation based on the multiregional IO database were also reported in recent studies [39,40,41]. They emphasized that embodied CO2 intensities are sensitive to IO details and low sector resolution will likely result in inaccurate estimations for some sectors. Therefore, our work on the 135-sector IOT is a good practice in the case of China, though it could be further improved by introducing physical energy consumption data via hybrid IO model [1,14].

3.5. Policy Implications of an Embodied CO2 Emission Inventory for China

Many studies have emphasized the territorial differences between the different systems’ boundaries and the importance to policy decisions of compiling an embodied CO2 emission inventory that covers a variety of countries and regions [4,10,25]. We consider that it is also very useful to discuss the linkage of embodied emissions (and other environmental burdens) among industrial sectors in the supply chain and to interpret the results of embodied emissions in different ways (since decision-makers on environmental policy could evaluate both direct and indirect effects from different aspects, e.g., fuel category or embodiment in direct requirement and total requirements). For example, if decision-makers want to impel cleaner production of iron and steel, the breakdown information of energy consumption in the supply chain is required to find significant contributors by energy carrier, say, reduction of CO2 in coke and coking products is more pointed. If they want to evaluate indirect emissions in the supply chain of iron and steel production industry, emission intensity by direct input coefficient is useful to compare with process-based emission factors. If they want to find out crucial factors of CO2 induced by final use, emission intensity by total input coefficient is more relevant. Our compilation methods also have the advantage of revealing more environmental information in tertiary industry sectors. As China becomes a more developed country, the growth of household final consumption, including increasing service requirements, will play a more important role in CO2 emissions in China. As presented in Figure 2, the contributions of direct emissions to embodied CO2 emissions are generally small in tertiary industry sectors (excluding transport services), which indicates that direct emissions in such sectors have little meaning for environmental decision-making. Tracing the embodied emissions in public and private services may be significant for the future mitigation of CO2 emissions in China.

3.6. Study Limitations and Recommendation for Future Work

There remain five limitations in this study. First, the non-energy use of fuels in the final consumption was not excluded in this inventory because some non-energy uses lock in the carbon, such as lubricants in the petroleum products sector (addressed in Section 3.3). Second, sector resolution, especially in construction, is very limited due to the IOT. Since a significant amount of China’s CO2 emissions are generated by capital formation (as shown in Figure 5), it is important to investigate potential methods of saving energy in construction activities and of suppressing unnecessary investment in some construction subsectors. The publication of more detailed information for specific sectors, such as construction sector IOTs, which are actually available in Japan, would be highly useful. Third, certain allocations of fuel consumption may introduce bias, for instance, all the petroleum products were allocated based on the direct input from sector No. 37 to other sectors in the IOT. This allocation method assumes that all the sectors consume petroleum products of the same composition; however, passenger transport services consume relatively more gasoline, whereas services that support agricultural industries consume relatively more diesel for off-road vehicles. To improve this kind of bias, more sectorial information, for example, detailed market surveys of energy consumption, is required. Fourth, proportionality assumption in IOT is not always true, for there are different prices of sold primary energy carriers and electricity between industries and end users [1]. Different levels of taxes or subsides can hamper the disaggregation of energy consumption by sector. However, the sufficient record of exact prices and quantities of energy trading among different users in China is not available. The fifth point is the weakness of import assumption in this study. It is not so critical when allocating CO2 emissions from a domestic production perspective. But it may be too weak when addressing embodied CO2 emissions in a global supply chain or constructing consumption-based inventory for China. Information about international imports of primary energy carriers by China or worldwide input-output database is needed to make more accurate estimations on such case. The limitations listed here from the second to the fifth point are the common problems in dealing with Chinese IOT. With respect to better quality of EIOA, we recommend the relevant authorities collect and release more information regularly, like the downstream of non-energy use of fossil fuel, physical inputs of energy or key materials, new IOT with separated domestic intermediate inputs and imported intermediate inputs.
In this study, only CO2 inventory for China was compiled but compilation of non-CO2 (e.g., N2O and CH4) inventory for China is further recommended. CO2 from fossil fuel combustion and industrial processes dominated total GHG in China, and China’s voluntary abatement target is only to reduce carbon intensity per GDP by 40%–45% [42]. Hence this study itself could support the relevant policy analysis. Non-CO2 GHG emissions have more significance in industrial processes, waste treatment and other sources, which requires higher quality of data to reduce the uncertainty. The best way is to treat CO2 and non-CO2 GHG emissions separately in a detailed assessment and then make an integrated comparison with time-series analysis.

4. Conclusions

In this study, a 135-sector embodied CO2 inventory for China in 2007 was constructed to reveal as much embodied information for industrial sectors as possible. Our disaggregation process to allocate energy input to each IO sector was proven reasonable by comparison with previous studies. The 42-sector embodied CO2 inventory was equivalent to the 135-sector inventory only in terms of the total embodied emissions, but the allocation of CO2 emissions in some sectors was found to be distorted significantly. The embodied CO2 emissions induced by final demands of domestic products for China in 2007 were estimated at 7.1 Gt CO2, whereas the contributions from gross capital formation, domestic consumption, and exports were estimated at 42%, 30%, and 28%, respectively.
We interpreted the embodied CO2 intensities by fuel category, and by embodiment in direct and total requirements, and verified that China’s indirect CO2 intensities were still dominated by coal-based generation of electricity and heat power in 2007, especially in terms of embodiment in total requirements. Generally speaking, conversion of energy sources depends on social-economic realities and the limitations of resource availability [43,44]. It requires great efforts to lower dependence on coal in the energy consumption of China [45]. To further reduce CO2 emissions, improvement of end-use energy efficiency in electricity-intensive industries would be a significant benefit.

Supplementary Files

Supplementary File 1Supplementary File 2

Acknowledgments

The authors gratefully appreciate the reviewers for their constructive comments and suggestions. This research was supported by Grants-in-Aid for Scientific Research (A) from the Japan Society for the Promotion of Science (No. 24246150 and No. 15H01750).

Author Contributions

Qian Zhang designed research, collected and analyzed the data, and wrote the paper. Jun Nakatani and Yuichi Moriguchi participated jointly in the interpretation of results, literature review, and manuscript preparation. All authors read and approved the final manuscript.

Conflicts of Interest

The authors declare no conflict of interest.

References

  1. Lindner, S.; Guan, D. A hybrid‐unit energy Input‐Output model to evaluate embodied energy and life cycle emissions for China’s economy. J. Ind. Ecol. 2014, 18, 201–211. [Google Scholar] [CrossRef]
  2. Miller, R.E.; Blair, P.D. Input-Output Analysis: Foundations and Extensions; Cambridge University Press: Cambridge, UK, 2009. [Google Scholar]
  3. Wiedmann, T.; Lenzen, M.; Turner, K.; Barrett, J. Examining the global environmental impact of regional consumption activities—Part 2: Review of input–output models for the assessment of environmental impacts embodied in trade. Ecol. Econ. 2007, 61, 15–26. [Google Scholar] [CrossRef]
  4. Peters, G.P. From production-based to consumption-based national emission inventories. Ecol. Econ. 2008, 65, 13–23. [Google Scholar] [CrossRef]
  5. Majeau-Bettez, G.; Wood, R.; Hertwich, E.G.; Strømman, A.H. When do allocations and constructs respect material, energy, financial, and production balances in LCA and EEIO? J. Ind. Ecol. 2015, in press. [Google Scholar] [CrossRef] [Green Version]
  6. Majeau-Bettez, G.; Strømman, A.H.; Hertwich, E.G. Evaluation of process-and input–output-based life cycle inventory data with regard to truncation and aggregation issues. Environ. Sci. Technol. 2011, 45, 10170–10177. [Google Scholar] [CrossRef] [PubMed]
  7. Guan, D.; Peters, G.P.; Weber, C.L.; Hubacek, K. Journey to world top emitter: An analysis of the driving forces of China’s recent CO2 emissions surge. Geophys. Res. Lett. 2009, 36, L04709. [Google Scholar] [CrossRef]
  8. Du, H.; Guo, J.; Mao, G.; Smith, A.M.; Wang, X.; Wang, Y. CO2 emissions embodied in China–US trade: Input–output analysis based on the emergy/dollar ratio. Energy Policy 2011, 39, 5980–5987. [Google Scholar] [CrossRef]
  9. Pan, J.; Phillips, J.; Chen, Y. China’s balance of emissions embodied in trade: Approaches to measurement and allocating international responsibility. Oxf. Rev. Econ. Policy 2008, 24, 354–376. [Google Scholar] [CrossRef]
  10. Peters, G.P.; Minx, J.C.; Weber, C.L.; Edenhofer, O. Growth in emission transfers via international trade from 1990 to 2008. Proc. Natl. Acad. Sci. USA 2011, 108, 8903–8908. [Google Scholar] [CrossRef] [PubMed]
  11. Meng, B.; Xue, J.; Feng, K.; Guan, D.; Fu, X. China’s inter-regional spillover of carbon emissions and domestic supply chains. Energy Policy 2013, 61, 1305–1321. [Google Scholar] [CrossRef]
  12. Peters, G.P.; Weber, C.L.; Guan, D.; Hubacek, K. China’s growing CO2 emissions a race between increasing consumption and efficiency gains. Environ. Sci. Technol. 2007, 41, 5939–5944. [Google Scholar] [CrossRef] [PubMed]
  13. Tian, X.; Chang, M.; Tanikawa, H.; Shi, F.; Imura, H. Regional disparity in carbon dioxide emissions. J. Ind. Ecol. 2012, 16, 612–622. [Google Scholar] [CrossRef]
  14. Su, B.; Huang, H.; Ang, B.; Zhou, P. Input–output analysis of CO2 emissions embodied in trade: The effects of sector aggregation. Energy Econ. 2010, 32, 166–175. [Google Scholar] [CrossRef]
  15. Lindner, S.; Legault, J.; Guan, D. Disaggregating input–output models with incomplete information. Econ. Syst. Res. 2012, 24, 329–347. [Google Scholar] [CrossRef]
  16. Zhang, Y.; Wang, H.; Liang, S.; Xu, M.; Liu, W.; Li, S.; Zhang, R.; Nielsen, C.P.; Bi, J. Temporal and spatial variations in consumption-based carbon dioxide emissions in China. Renew. Sustain. Energy Rev. 2014, 40, 60–68. [Google Scholar] [CrossRef]
  17. NBS. Chinese Energy Statistics Yearbook-2007; China Statistics Press: Beijing, China, 2008.
  18. NBS. China Statistical Yearbook 2008. Available online: http://www.stats.gov.cn/tjsj/ndsj/2008/indexeh.htm (accessed on 13 April 2015).
  19. NBS. 2007 Input-Output Tables of China; China Statistics Press: Beijing, China, 2009.
  20. IPCC. 2006 IPCC Guidelines for National Greenhouse Gas Inventories; Eggleston, H.S., Buendia, L., Miwa, K., Ngara, T., Tanabe, K., Eds.; Institute for Global Environmental Strategies (IGES): Tokyo, Japan, 2006. [Google Scholar]
  21. Wang, Y.; Zhu, Q.; Geng, Y. Trajectory and driving factors for GHG emissions in the Chinese cement industry. J. Clean. Prod. 2013, 53, 252–260. [Google Scholar] [CrossRef]
  22. Douglas, S.; Nishioka, S. International differences in emissions intensity and emissions content of global trade. J. Dev. Econ. 2012, 99, 415–427. [Google Scholar] [CrossRef]
  23. Nansai, K.; Moriguchi, Y.; Tohno, S. Compilation and application of Japanese inventories for energy consumption and air pollutant emissions using input-output tables. Environ. Sci. Technol. 2003, 37, 2005–2015. [Google Scholar] [CrossRef] [PubMed]
  24. Nakamura, S.; Kondo, Y. Waste Input-Output Analysis: Concepts and Application to Industrial Ecology; Springer: Berlin, Germany, 2009; Volume 26. [Google Scholar]
  25. Davis, S.J.; Caldeira, K. Consumption-based accounting of CO2 emissions. Proc. Natl. Acad. Sci. USA 2010, 107, 5687–5692. [Google Scholar] [CrossRef] [PubMed]
  26. Wixted, B.; Yamano, N.; Webb, C. Input-Output Analysis in an Increasingly Globalised World: Applications of OECD’s Harmonised International Tables; OECD Science, Technology and Industry Working Papers, 2006/07; OECD Publishing: Paris, France, 2006. [Google Scholar]
  27. Timmer, M.P.; Dietzenbacher, E.; Los, B.; Stehrer, R.; de Vries, G.J. An illustrated user guide to the World Input–Output Database: The case of global automotive production. Rev. Int. Econ. 2015, in press. [Google Scholar] [CrossRef]
  28. Lenzen, M.; Kanemoto, K.; Moran, D.; Geschke, A. Mapping the structure of the world economy. Environ. Sci. Technol. 2012, 46, 8374–8381. [Google Scholar] [CrossRef] [PubMed]
  29. Nansai, K.; Kagawa, S.; Kondo, Y.; Suh, S.; Nakajima, K.; Inaba, R.; Oshita, Y.; Morimoto, T.; Kawashima, K.; Terakawa, T. Characterization of economic requirements for a “carbon-debt-free country”. Environ. Sci. Technol. 2011, 46, 155–163. [Google Scholar] [CrossRef] [PubMed]
  30. Boden, T.A.; Marland, G.; Andres, R.J. Global, Regional, and National Fossil-Fuel CO2 Emissions; Carbon Dioxide Information Analysis Center, Oak Ridge National Laboratory, U.S. Department of Energy: Oak Ridge, TN, USA, 2011.
  31. Guan, D.; Liu, Z.; Geng, Y.; Lindner, S.; Hubacek, K. The gigatonne gap in China’s carbon dioxide inventories. Nat. Clim. Chang. 2012, 2, 672–675. [Google Scholar] [CrossRef]
  32. Dietzenbacher, E.; Los, B.; Stehrer, R.; Timmer, M.; de Vries, G. The construction of world input–output tables in the WIOD project. Econ. Syst. Res. 2013, 25, 71–98. [Google Scholar] [CrossRef]
  33. Chen, G.; Zhang, B. Greenhouse gas emissions in China 2007: Inventory and input–output analysis. Energy Policy 2010, 38, 6180–6193. [Google Scholar] [CrossRef]
  34. Liu, Z.; Feng, K.; Hubacek, K.; Liang, S.; Anadon, L.D.; Zhang, C.; Guan, D. Four system boundaries for carbon accounts. Ecol. Model. 2015, in press. [Google Scholar] [CrossRef]
  35. Peters, G.; Weber, C.; Liu, J. Construction of Chinese Energy and Emissions Inventory; Norwegian University of Science and Technology: Trondheim, Norway, 2006. [Google Scholar]
  36. NBS. Personal Communication; National Bureau of Statistics of China: Beijing, China, 2013.
  37. Lenzen, M.; Moran, D.; Kanemoto, K.; Geschke, A. Building Eora: A global multi-region input–output database at high country and sector resolution. Econ. Syst. Res. 2013, 25, 20–49. [Google Scholar] [CrossRef]
  38. International Energy Agency (IEA). CO2 Emissions from Fuel Combustion (2014 Edition); IEA: Paris, France, 2014. [Google Scholar]
  39. Steen-Olsen, K.; Owen, A.; Hertwich, E.G.; Lenzen, M. Effects of sector aggregation on CO2 multipliers in Multiregional Input–Output Analyses. Econ. Syst. Res. 2014, 26, 284–302. [Google Scholar] [CrossRef]
  40. De Koning, A.; Bruckner, M.; Lutter, S.; Wood, R.; Stadler, K.; Tukker, A. Effect of aggregation and disaggregation on embodied material use of products in input–output analysis. Ecol. Econ. 2015, 116, 289–299. [Google Scholar] [CrossRef]
  41. Wood, R.; Stadler, K.; Bulavskaya, T.; Lutter, S.; Giljum, S.; de Koning, A.; Kuenen, J.; Schütz, H.; Acosta-Fernández, J.; Usubiaga, A. Global Sustainability Accounting—Developing EXIOBASE for Multi-Regional Footprint Analysis. Sustainability 2014, 7, 138–163. [Google Scholar] [CrossRef] [Green Version]
  42. Yuan, J.; Hou, Y.; Xu, M. China’s 2020 carbon intensity target: Consistency, implementations, and policy implications. Renew. Sustain. Energy Rev. 2012, 16, 4970–4981. [Google Scholar] [CrossRef]
  43. Chow, J.; Kopp, R.J.; Portney, P.R. Energy resources and global development. Science 2003, 302, 1528–1531. [Google Scholar] [CrossRef] [PubMed]
  44. Zeng, N.; Ding, Y.; Pan, J.; Wang, H.; Gregg, J. Climate change—The Chinese challenge. Science 2008, 319, 730–731. [Google Scholar] [CrossRef] [PubMed]
  45. Xiang, N.; Xu, F.; Sha, J. Simulation Analysis of China’s Energy and Industrial Structure Adjustment Potential to Achieve a Low-carbon Economy by 2020. Sustainability 2013, 5, 5081–5099. [Google Scholar] [CrossRef]

