
A Study on Diffusion Pattern of Technology Convergence: Patent Analysis for Korea

Abstract
:1. Introduction
2. Measurement of Technology Convergence Degree
2.1. Previous Studies to Measure Convergence

| Level | Data | Methodology | Study |
|---|---|---|---|
| Science | Thesis | Co-word analysis | Callon et al. (1986) [18] |
| Palmer (1999) [19] | |||
| Co-citation analysis | Small (1977) [20] | ||
| Zitt et al. (2005) [21] | |||
| Leydesdorff (2007) [22] | |||
| Porter and Rafols (2009) [23] | |||
| Porter et al. (2008) [24] | |||
| Co-authorship analysis | Porter et al. (2007) [25] | ||
| Co-classification analysis | Noyon and van Raan (1998) [26] | ||
| Tijssen (1992) [27] | |||
| Morillo et al. (2003) [28] | |||
| Schummer (2004) [29] | |||
| Technology | Patent | IPC co-classification analysis * | Curran and Leker (2011) [7] |
| Geum et al. (2012) [30] | |||
| Jeong (2014) [31] | |||
| Jeong et al.(2015) [17] | |||
| Co-citation analysis | Geum et al. (2012) [30] | ||
| Industry | Industry information, Patent | SIC-IPC concordance analysis * | Pennings and Puranam (2001) [32] |
| Athreye and Keeble (2000) [6] | |||
| Fai and Tunzelmann (2001) [33] | |||
| Curran et al. (2010) [34] | |||
| Karvonen et al. (2012) [14] | |||
| Karvonen and Kassi (2013) [16] | |||
| Input-output analysis | Xing et al. (2011) [35] |
2.1.1. Measurement of the Science Convergence
2.1.2. Measurement of Technology Convergence
2.1.3. Measurement of the Industry Convergence
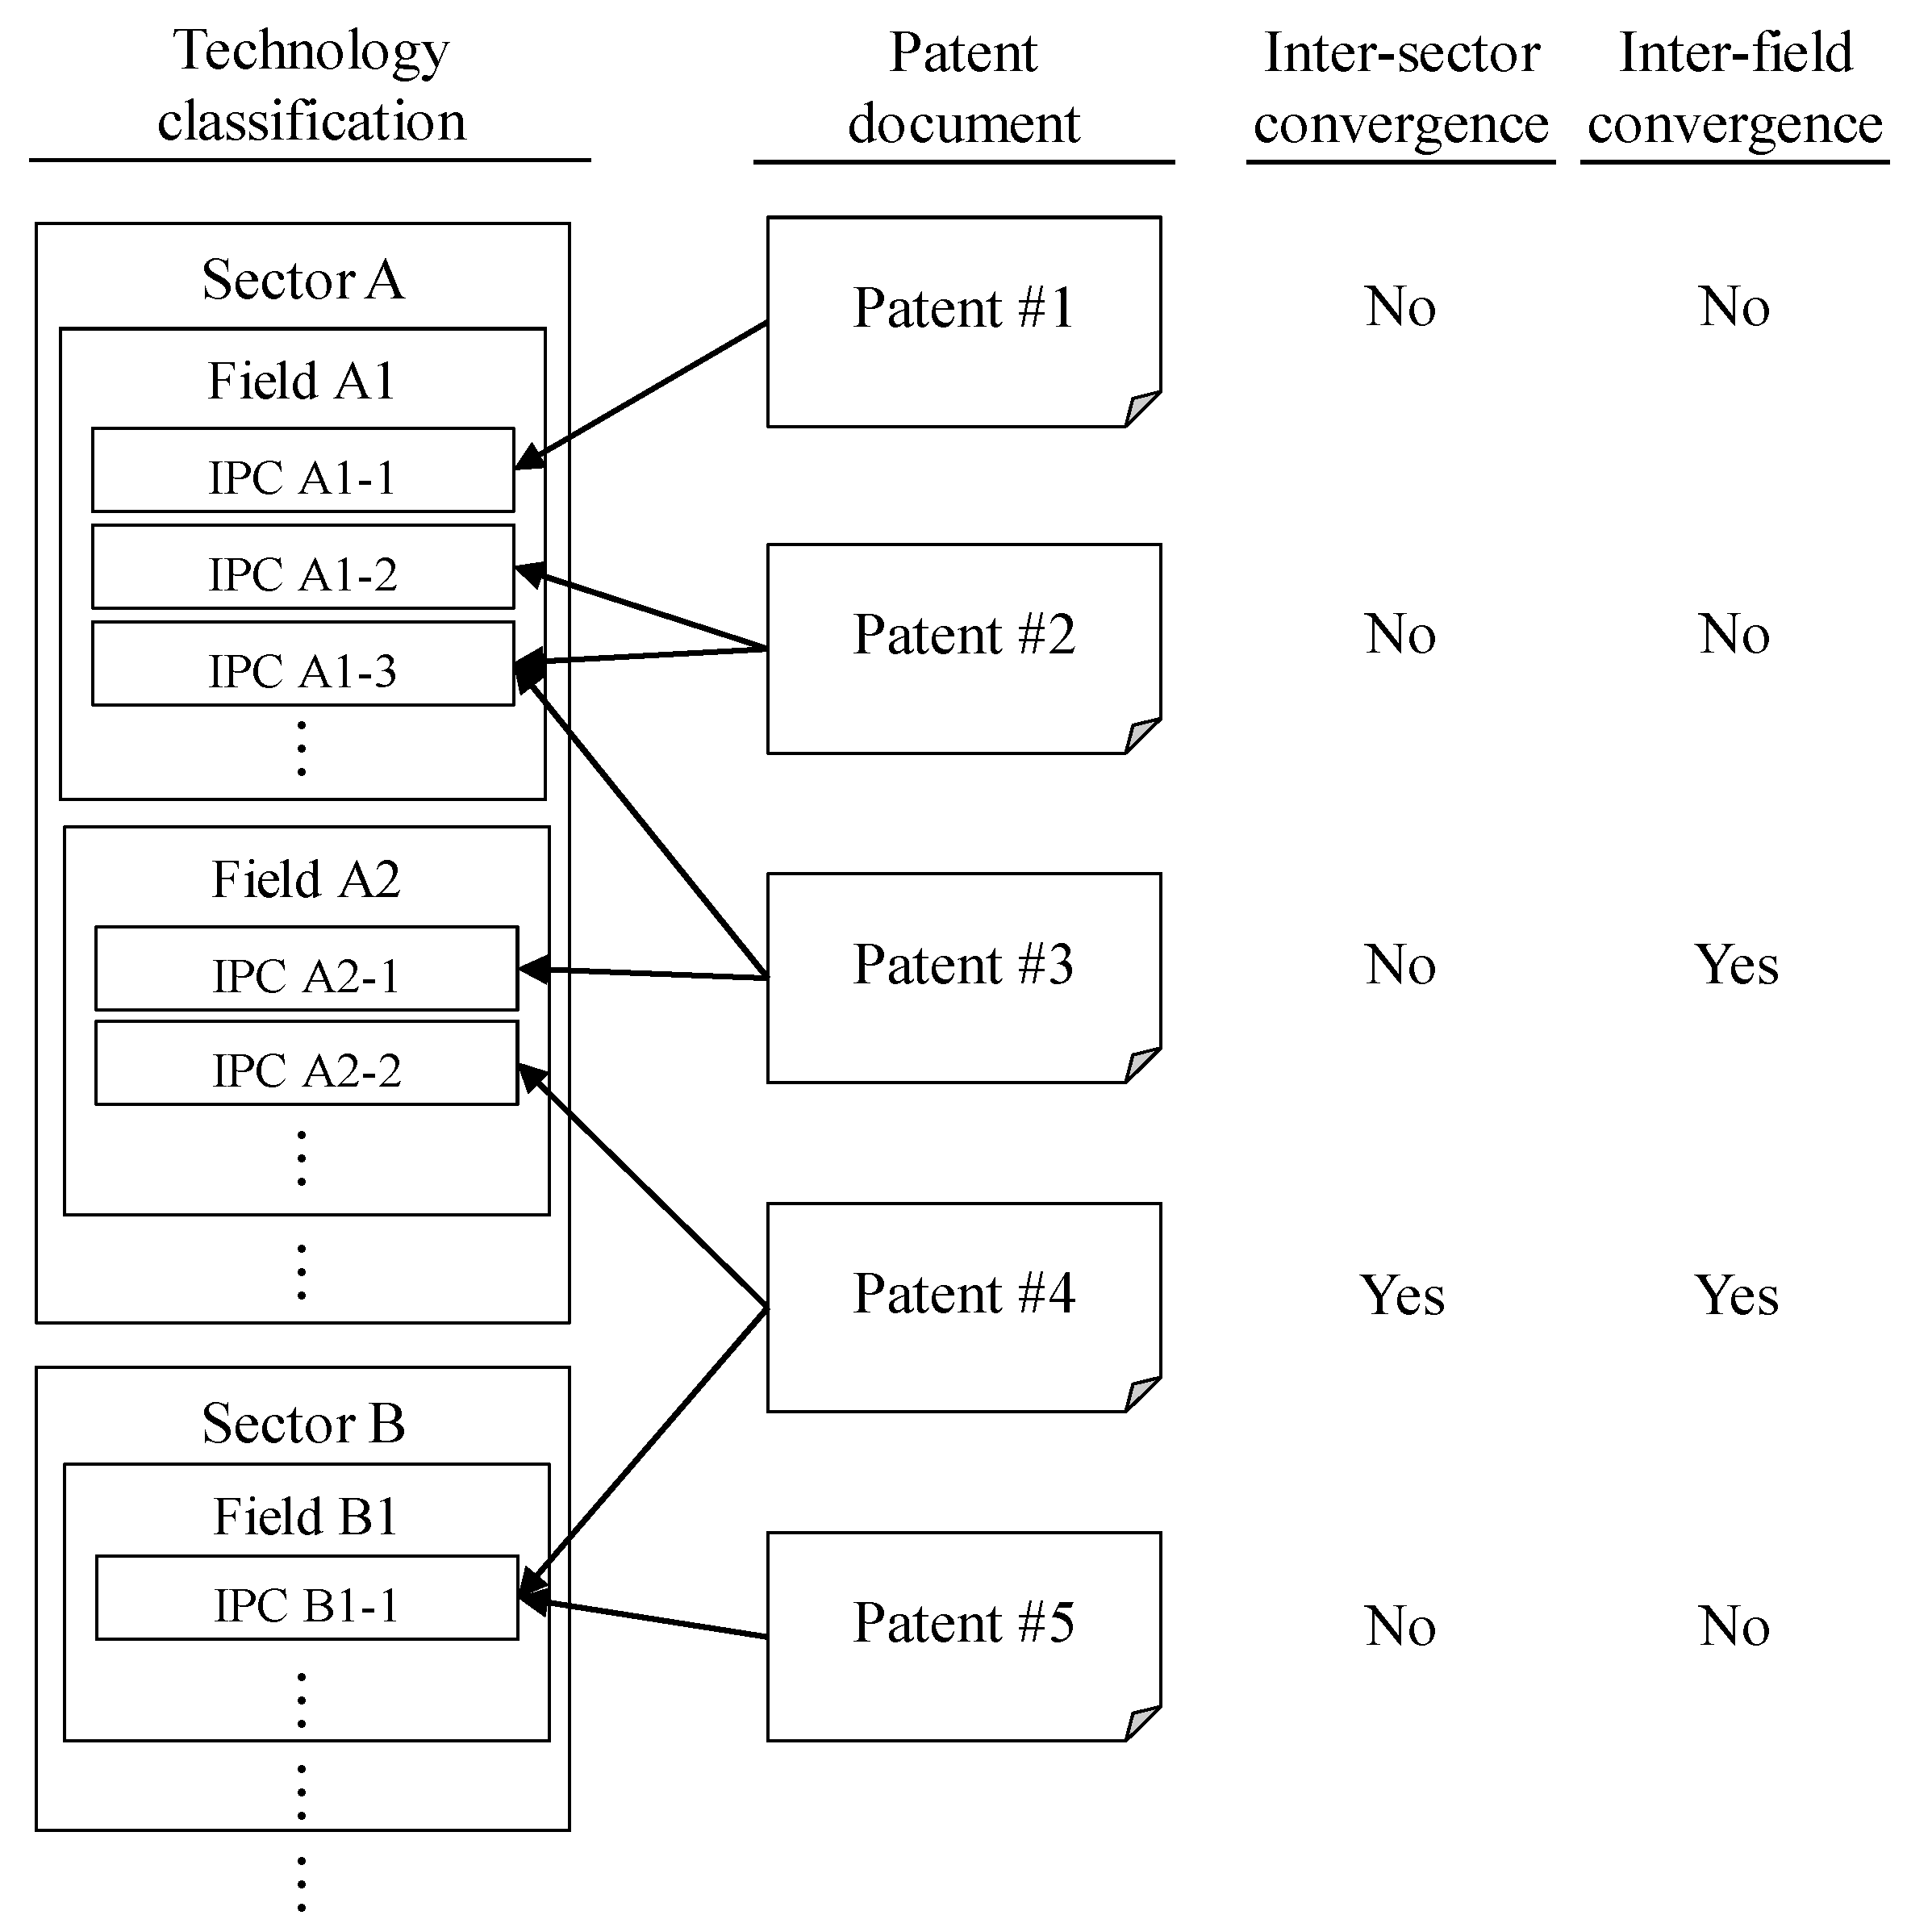
2.2. Identification of Technology Convergence Degree
- (1)
- Selection of measurement: What indicator will be used to measure technologies?
- (2)
- Selection of classification system: What classification system will be used to classify the measured technologies?
- (3)
- Convergence identification method: What methodologies will be used to identify convergence?
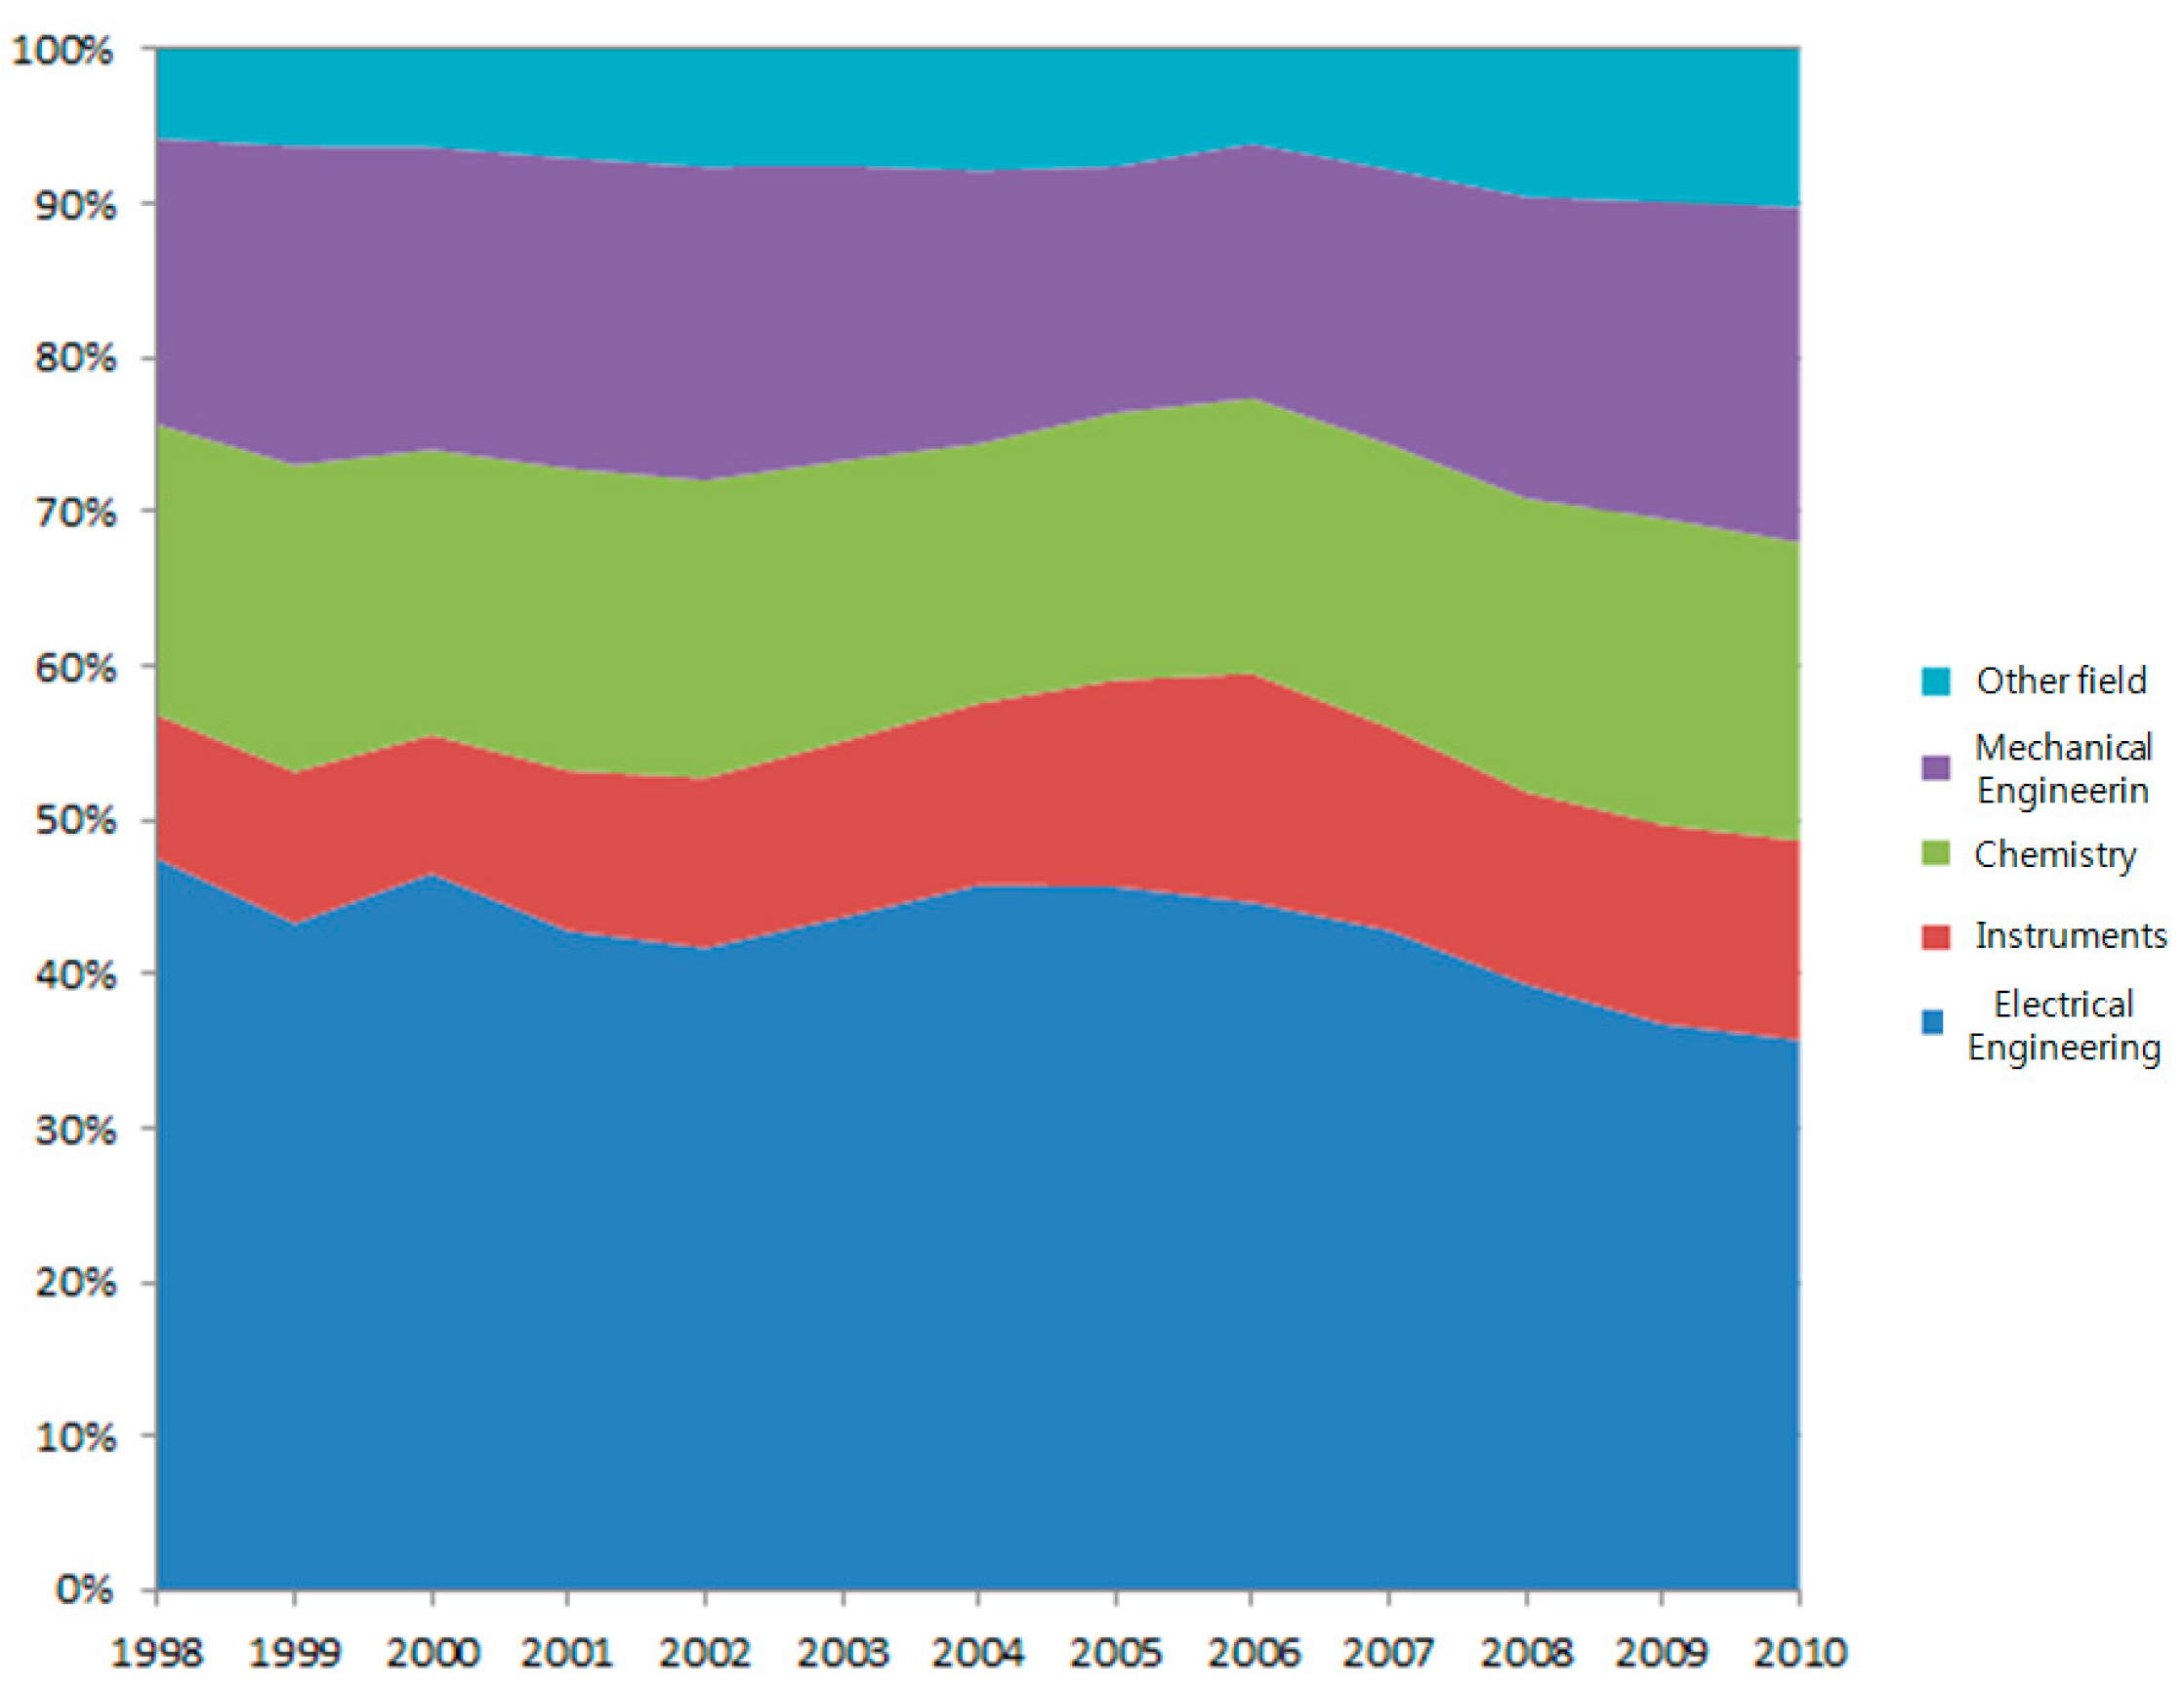
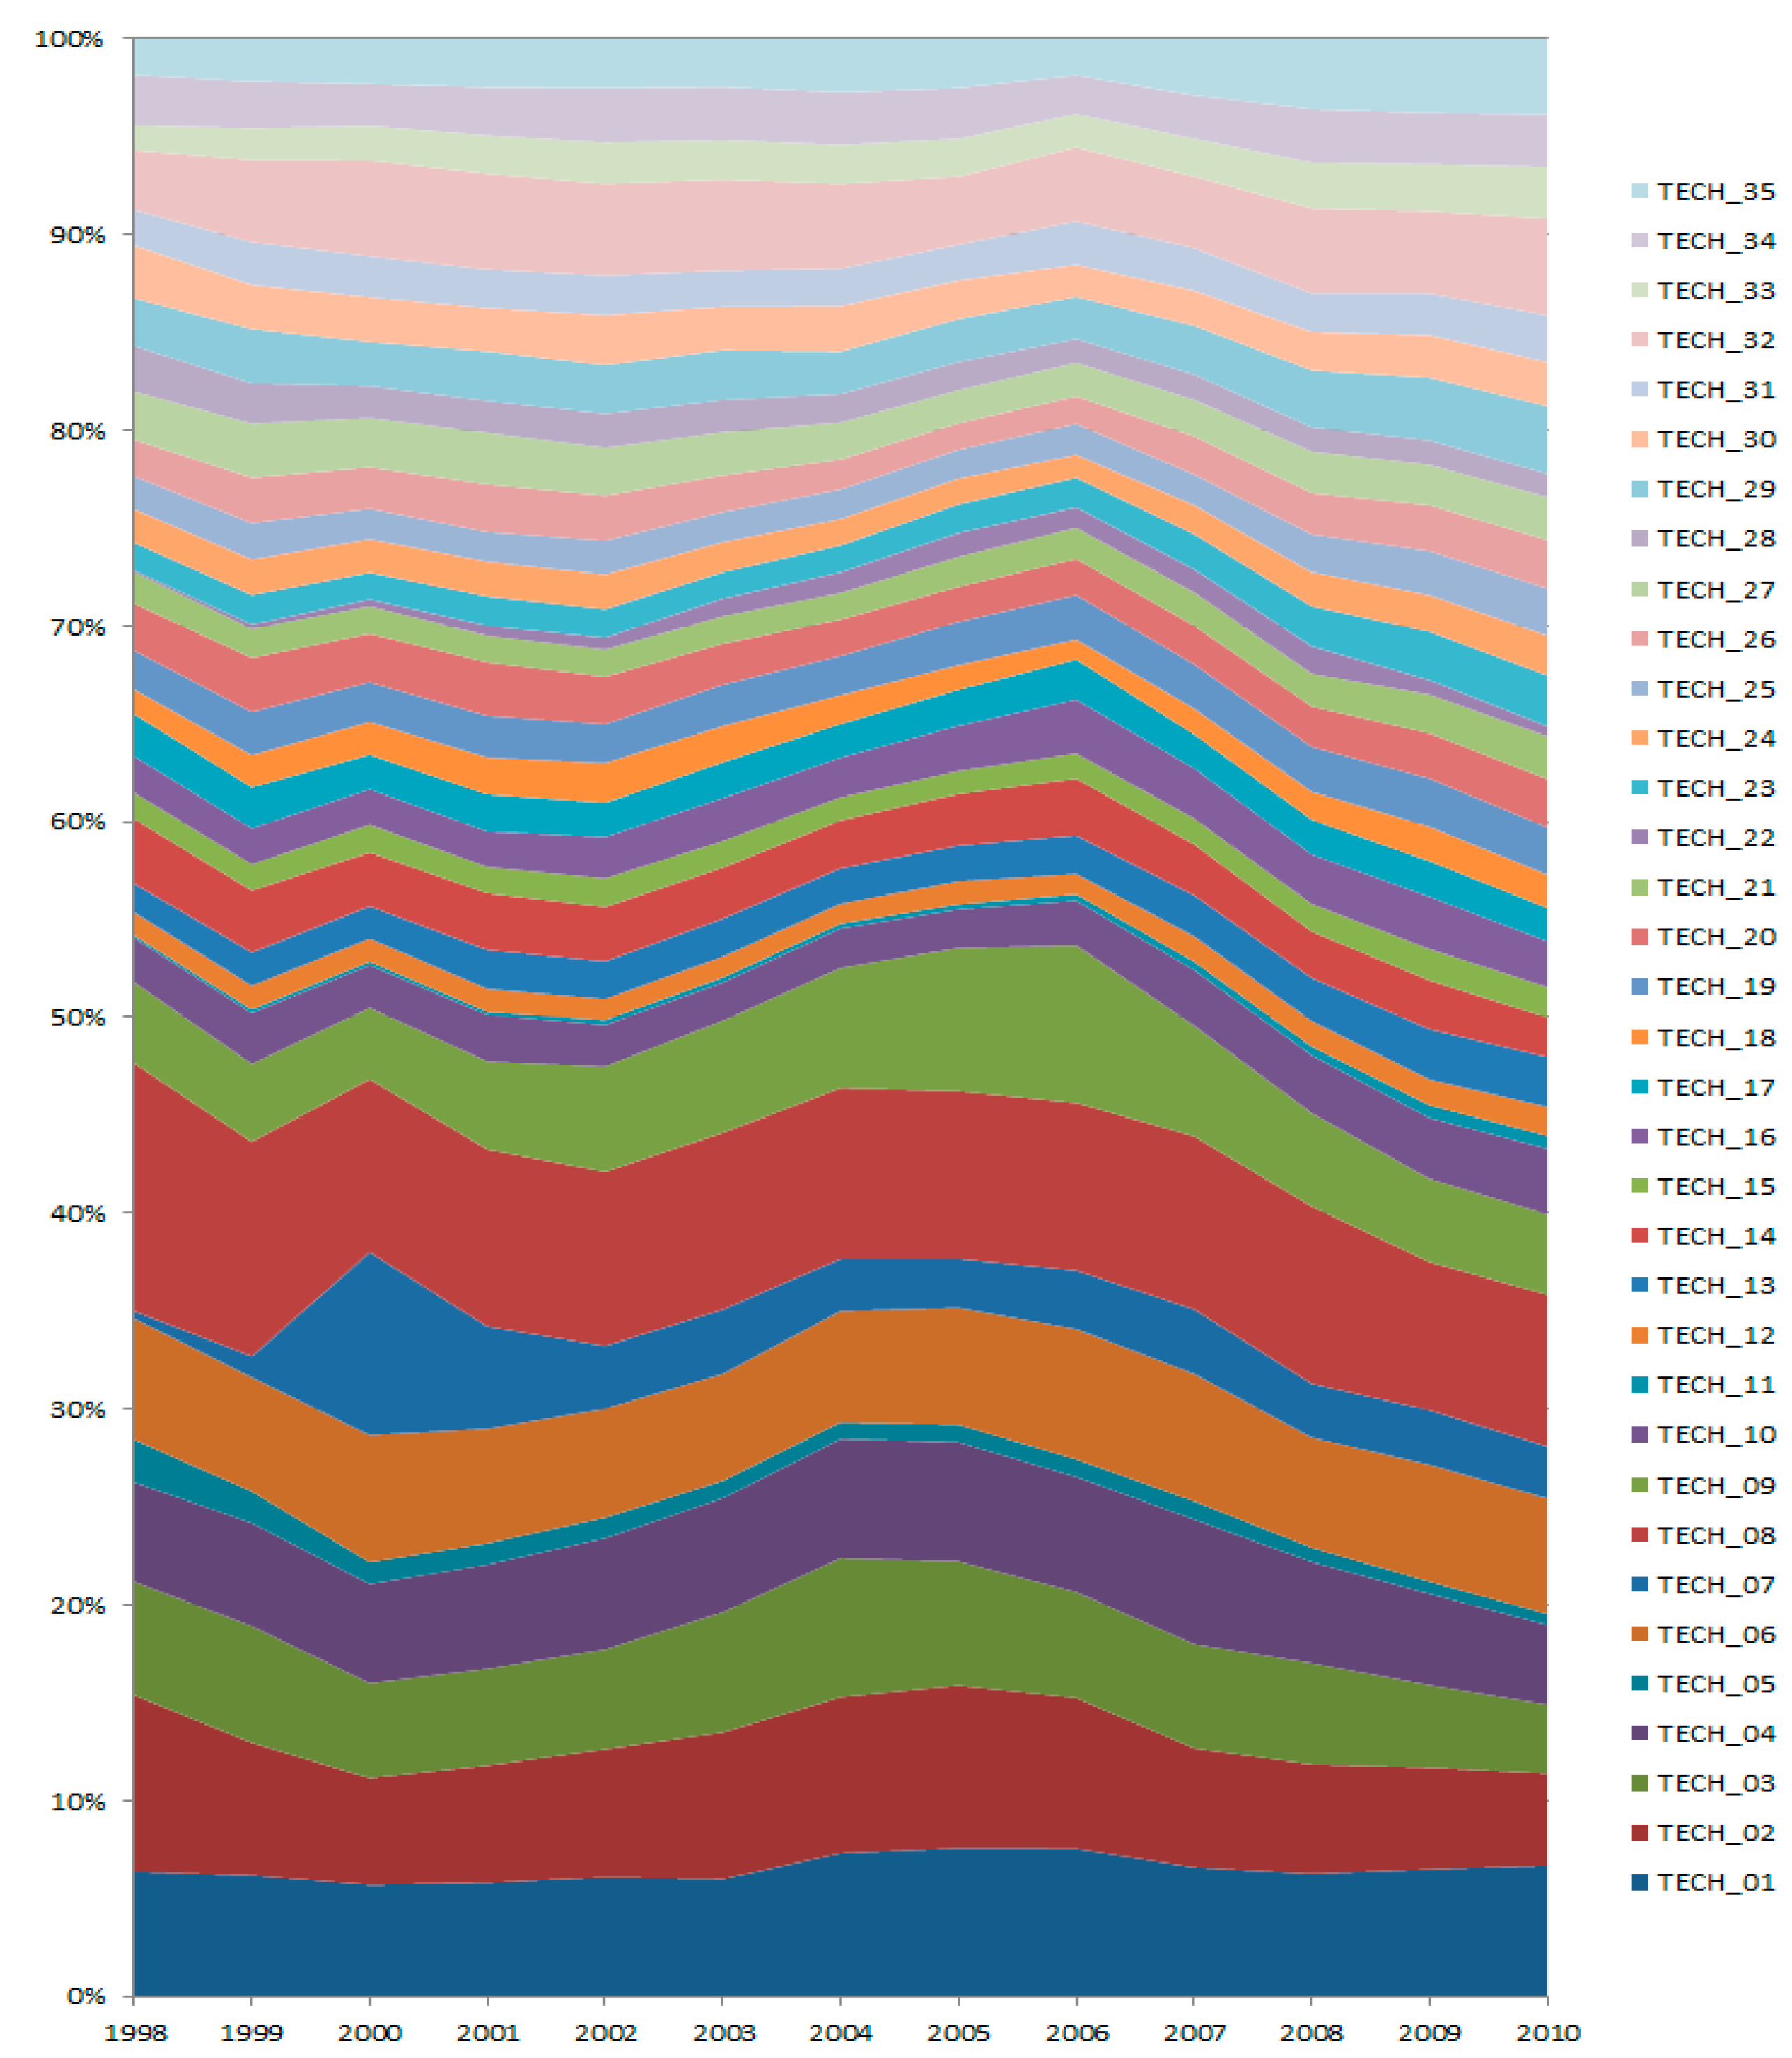
| Sector | Abbreviation | Field | ||
|---|---|---|---|---|
| Electrical Engineering | TECH_01 | Electrical machinery, Apparatus, Energy | ||
| TECH_02 | Audio-Visual Technology | |||
| TECH_03 | Telecommunications | |||
| TECH_04 | Digital Communication | |||
| TECH_05 | Basic Communication Processes | |||
| TECH_06 | Computer Technology | |||
| TECH_07 | IT Methods for Management | |||
| TECH_08 | Semiconductors | |||
| Instruments | TECH_09 | Optics | ||
| TECH_10 | Measurement | |||
| TECH_11 | Analysis of Biological Materials | |||
| TECH_12 | Control | |||
| TECH_13 | Medical Technology | |||
| Chemistry | TECH_14 | Organic Fine Chemistry | ||
| TECH_15 | Biotechnology | |||
| TECH_16 | Pharmaceuticals | |||
| TECH_17 | Macromolecular Chemistry/Polymers | |||
| TECH_18 | Food Chemistry | |||
| TECH_19 | Basic Materials Chemistry | |||
| TECH_20 | Materials/Metallurgy | |||
| TECH_21 | Surface Technology/Coating | |||
| TECH_22 | Micro-structural and/Nano-technology | |||
| TECH_23 | Chemical Engineering | |||
| TECH_24 | Environmental Technology | |||
| Mechanical Engineering | TECH_25 | Handling | ||
| TECH_26 | Machine Tools | |||
| TECH_27 | Engines/Pumps/Turbines | |||
| TECH_28 | Textile/Paper Machines | |||
| TECH_29 | Other special Machines | |||
| TECH_30 | Thermal Processes and Apparatus | |||
| TECH_31 | Mechanical Elements | |||
| TECH_32 | Transport | |||
| Other fields | TECH_33 | Furniture/Games | ||
| TECH_34 | Other Consumer Goods | |||
| TECH_35 | Civil Engineering | |||

3. Analysis of Diffusion Pattern of Technology Convergence
3.1. Estimation Model for Diffusion Pattern of Technology Convergence
3.2. Data


4. Result and Discussion
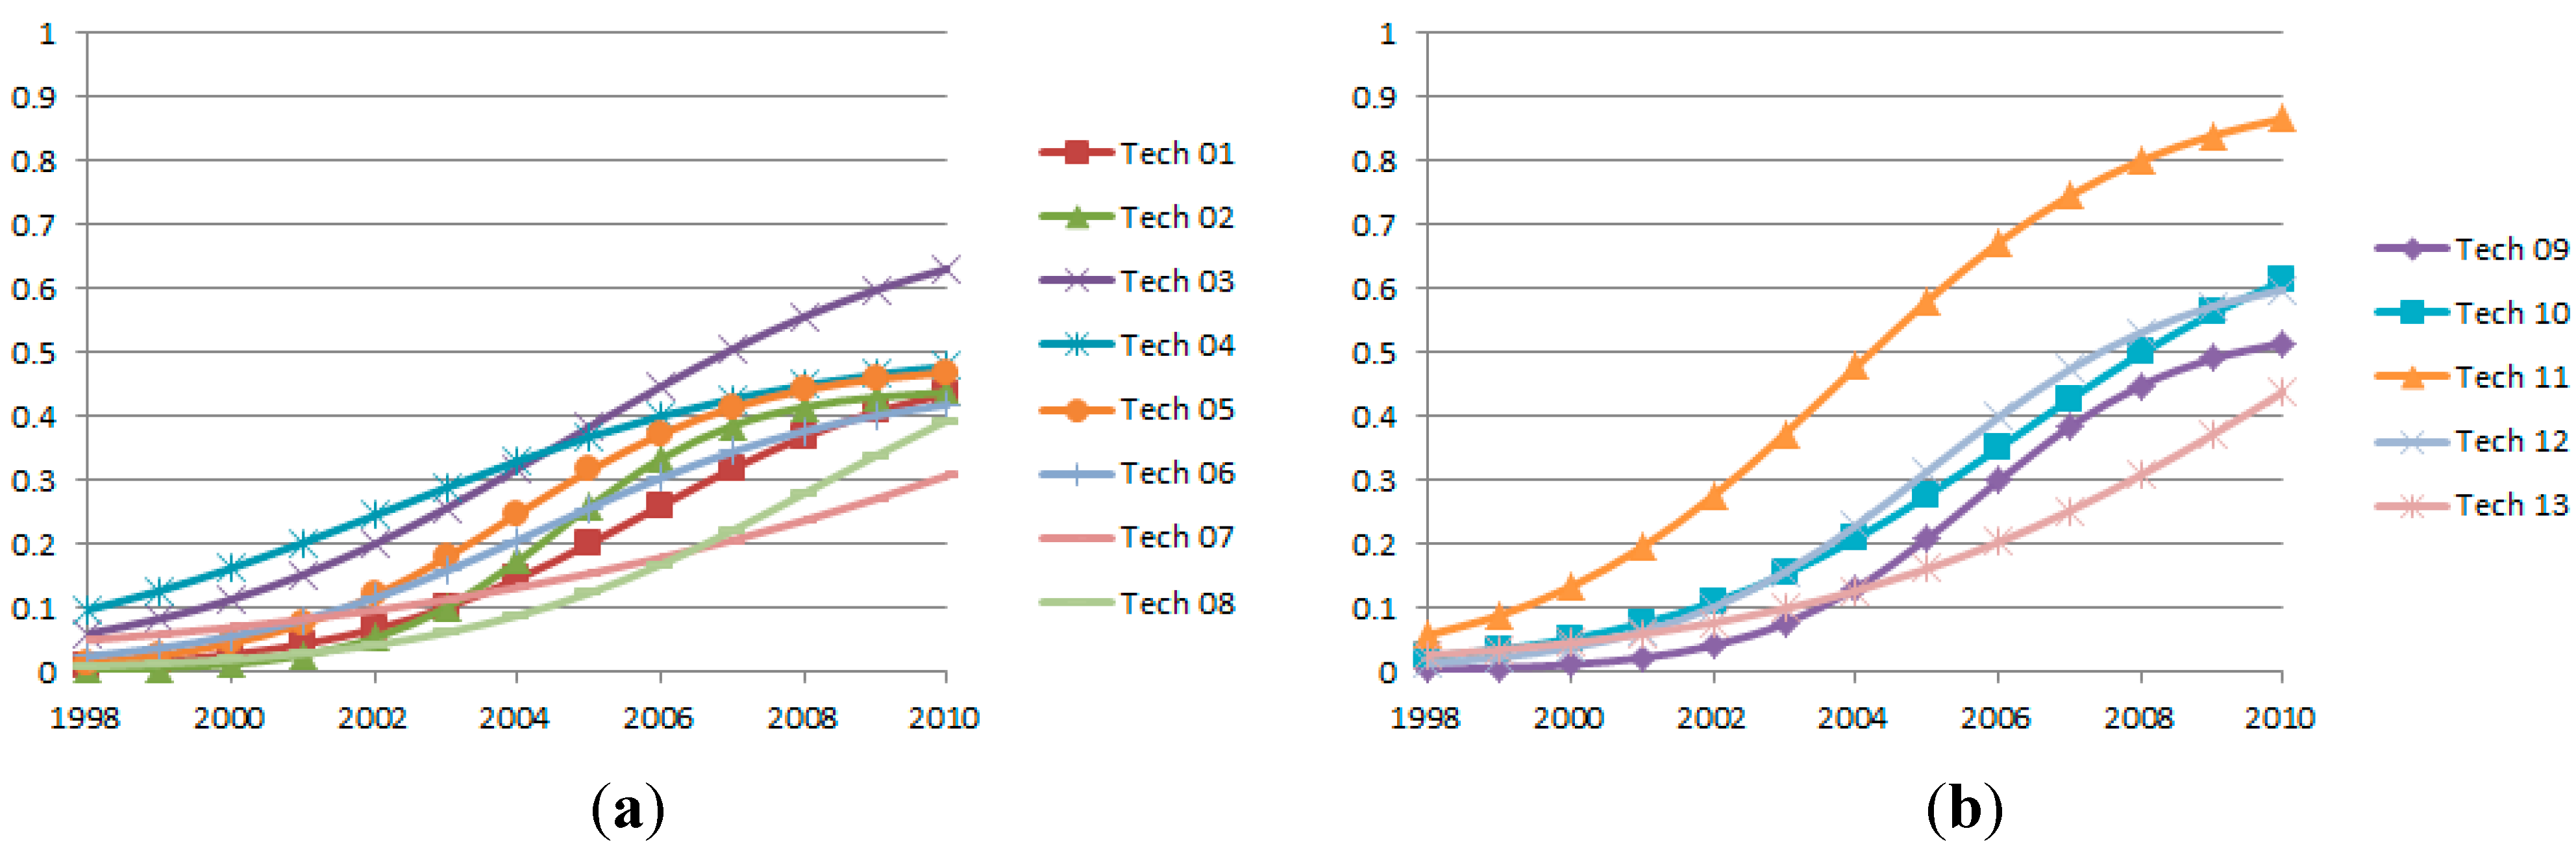
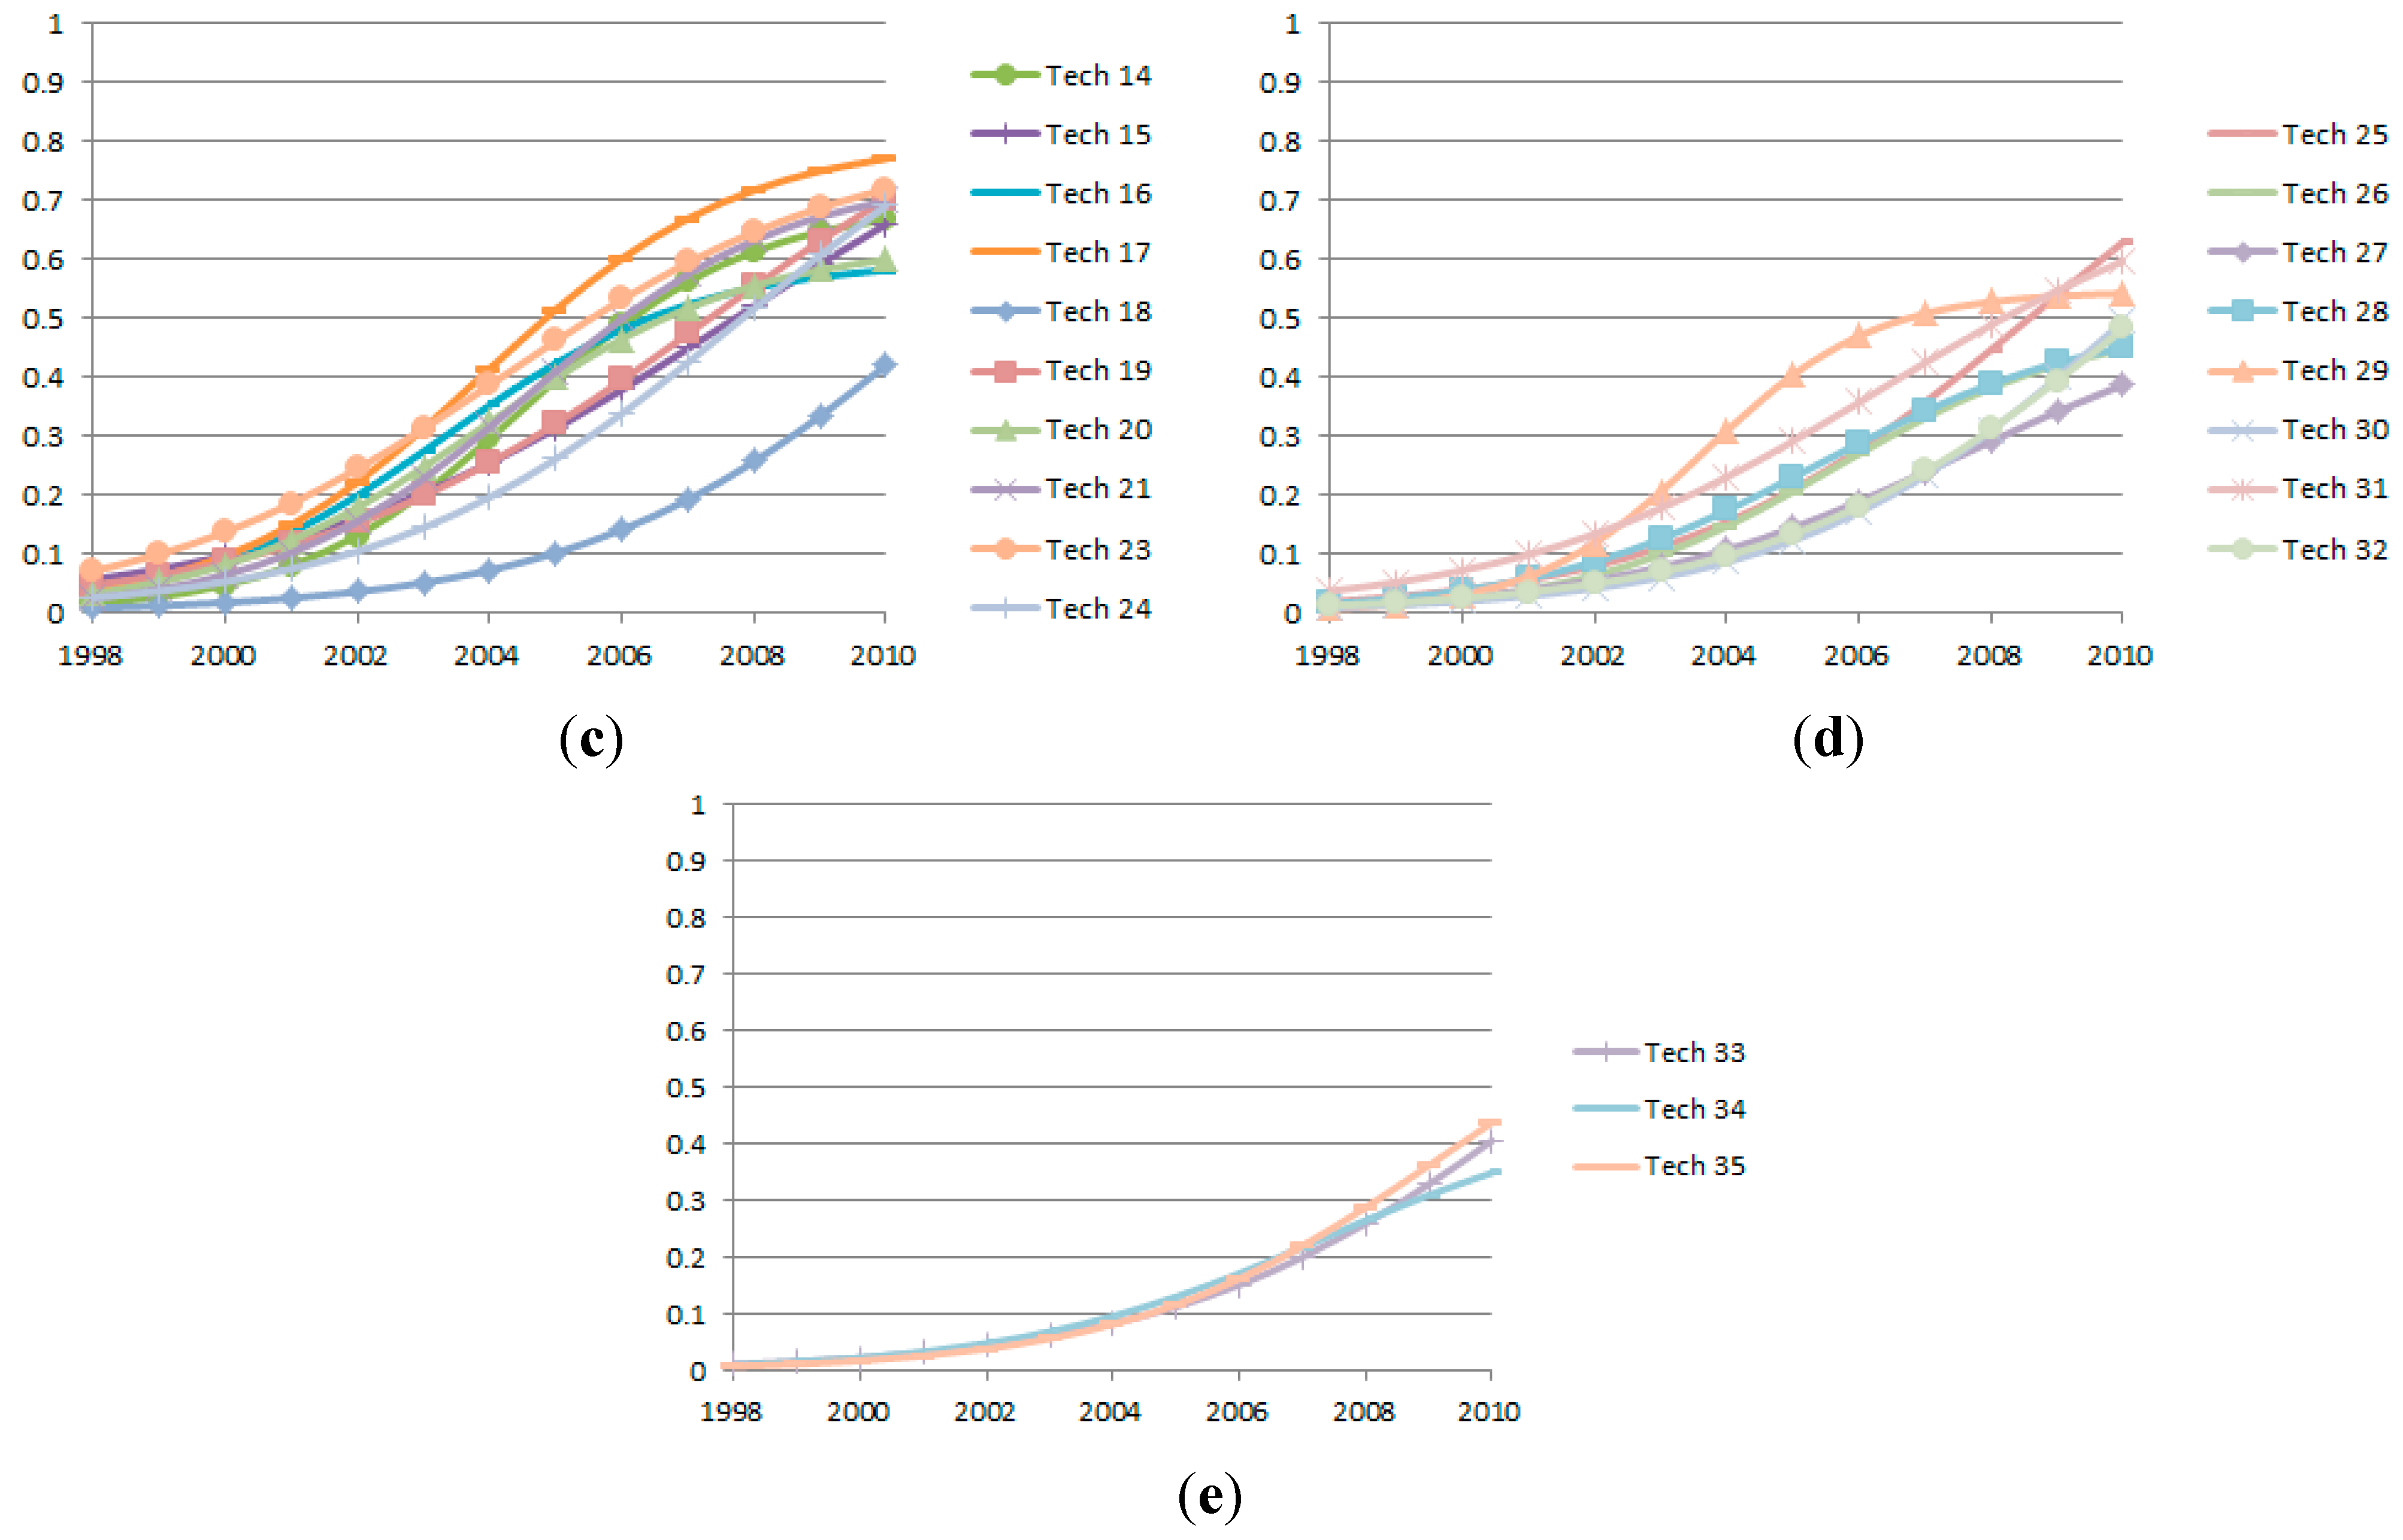
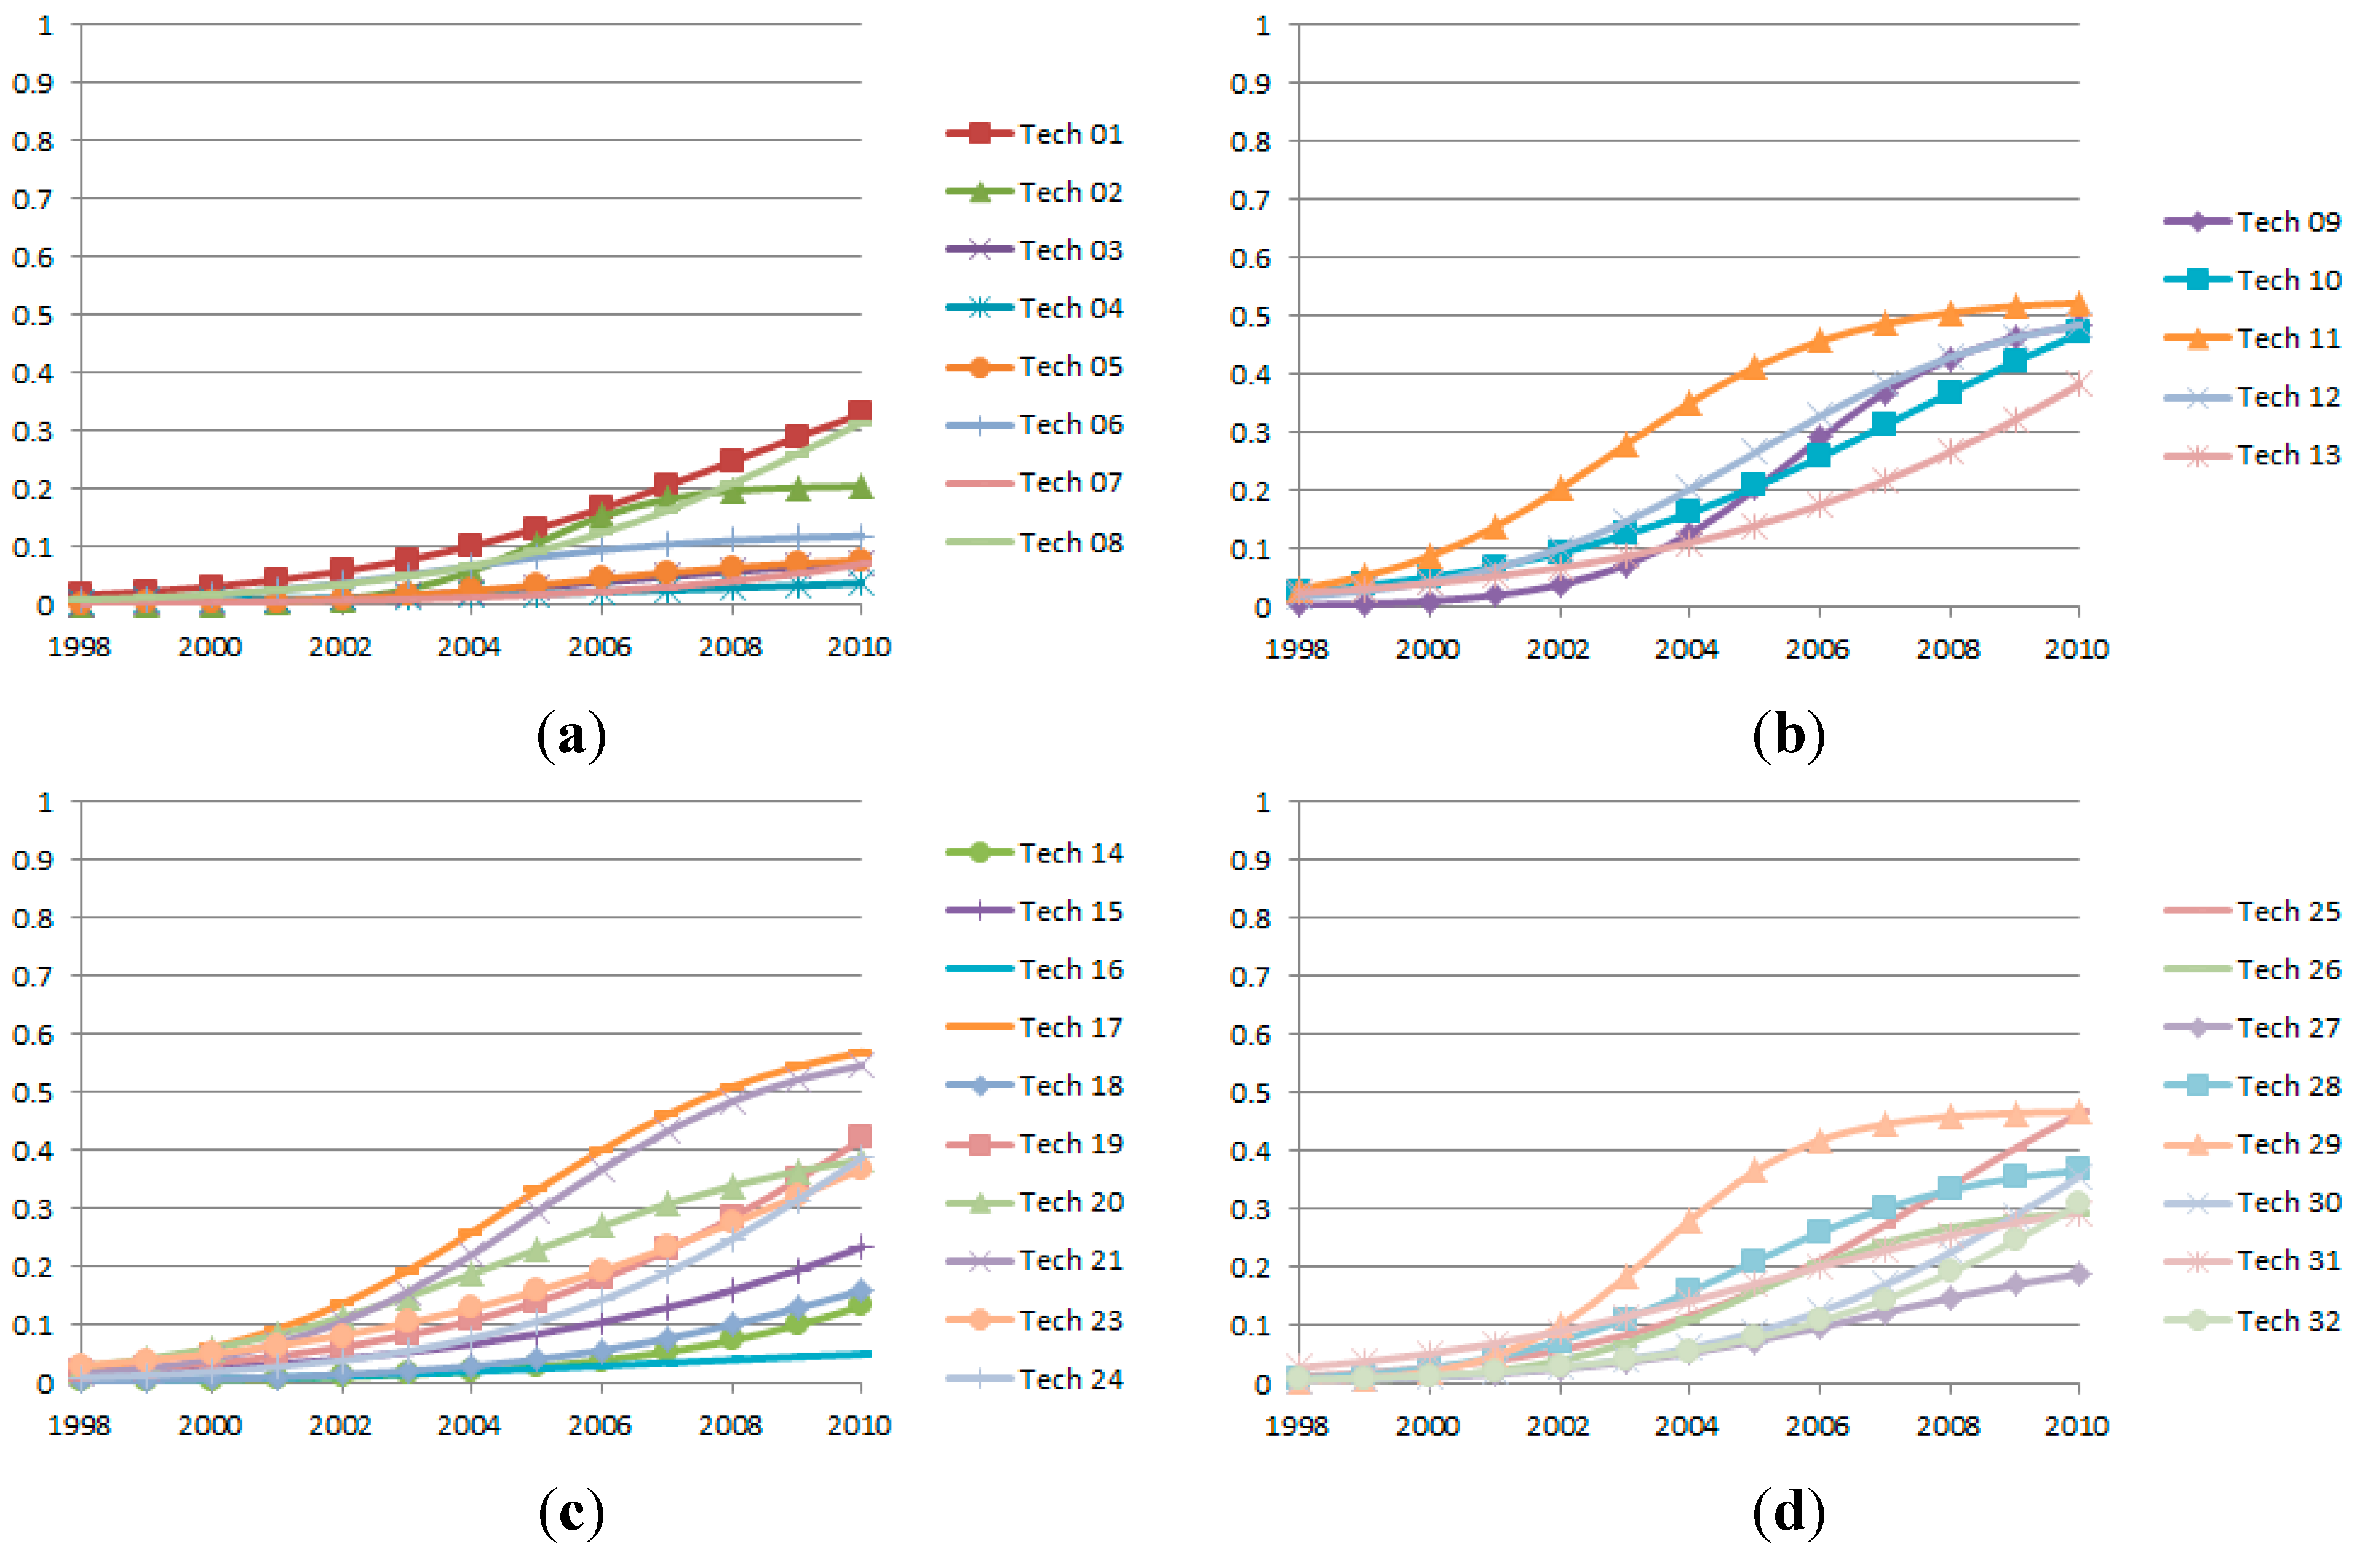
4.1. Regression Results of Diffusion Model
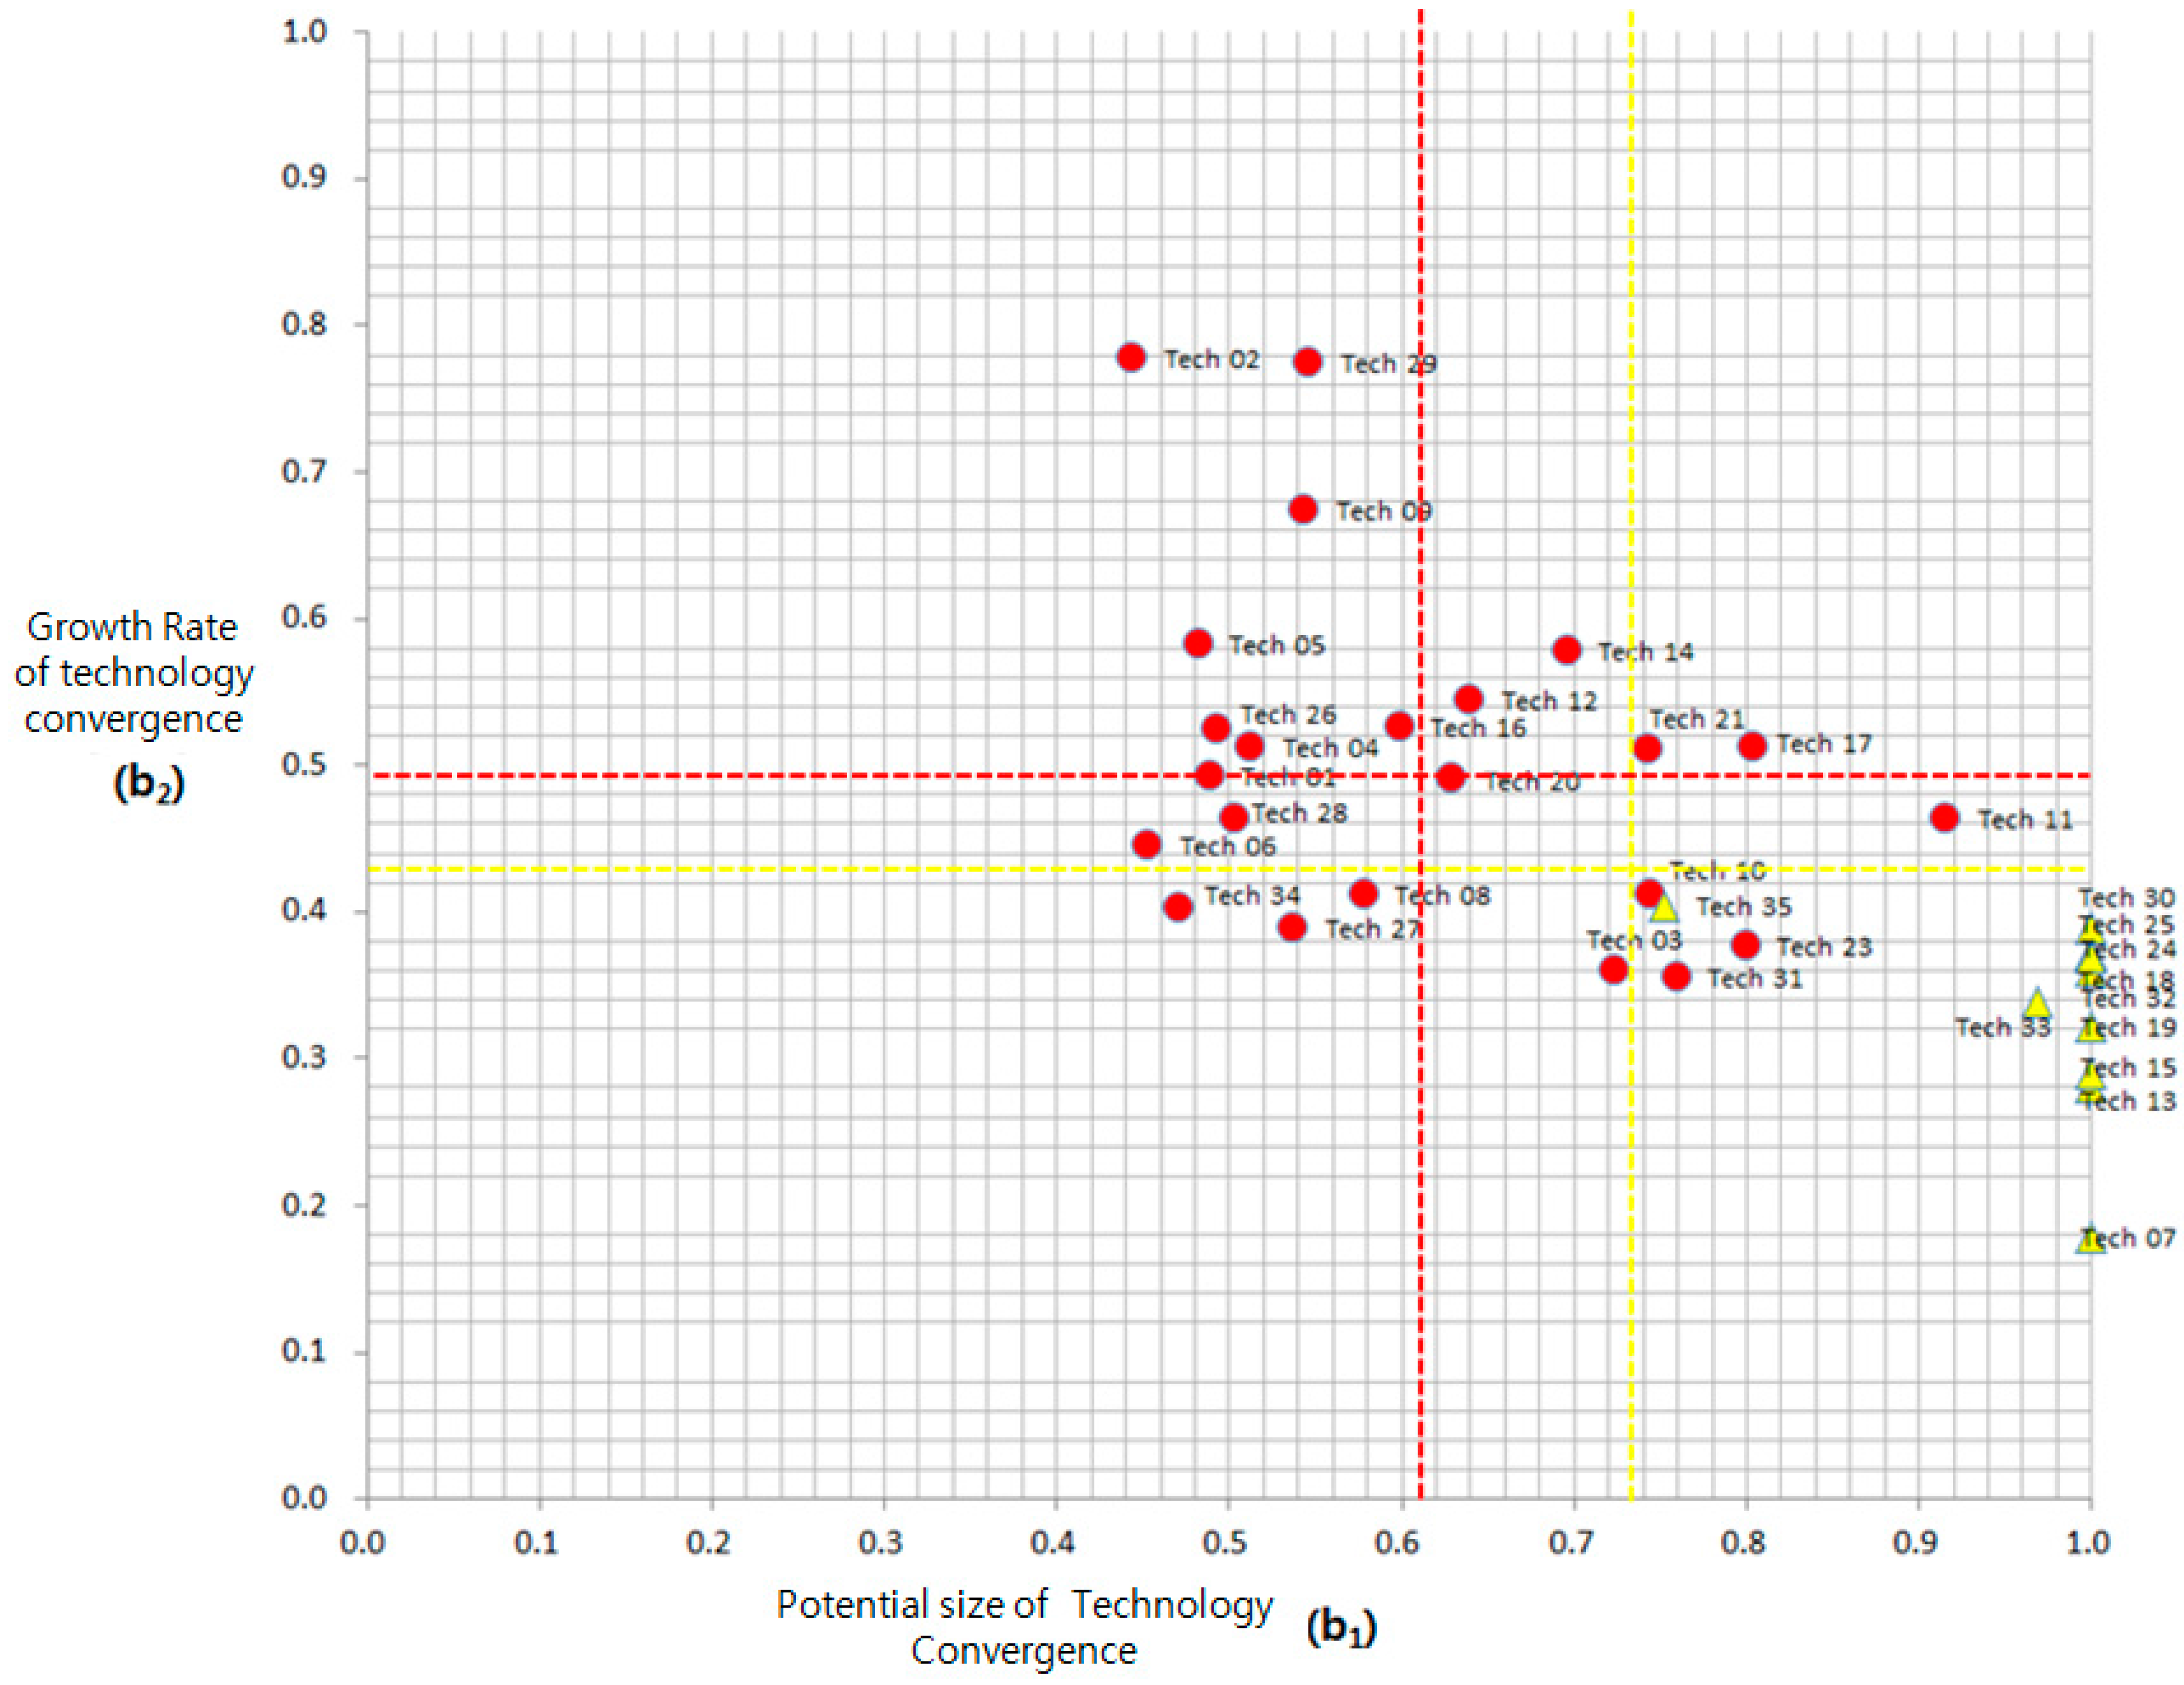
| Sector | Field | Technology Convergence at Initial Time (b0) | Potential Size of Technology Convergence (b1) | Growth Rate of Technology Convergence (b2) |
|---|---|---|---|---|
| Electrical Engineering | TECH 01 Electrical machinery, Apparatus, Energy | 0.0106 *** | 0.4887 *** | 0.4928 *** |
| TECH 02 Audio-Visual Technology | 0.0027 | 0.4437 *** | 0.7781 *** | |
| TECH 03 Telecommunications | 0.0600 ** | 0.7239 *** | 0.3604 *** | |
| TECH 04 Digital Communication | 0.0974 *** | 0.5128 *** | 0.3405 *** | |
| TECH 05 Basic Communication Processes | 0.0150 | 0.4820 *** | 0.5827 *** | |
| TECH 06 Computer Technology | 0.0248 *** | 0.4529 *** | 0.4455 *** | |
| TECH 07 IT Methods for Management | 0.0497 *** | 1.0000 | 0.1782 *** | |
| TECH 08 Semiconductors | 0.0086 *** | 0.5781 *** | 0.4125 *** | |
| Instruments | TECH 09 Optics | 0.0030 ** | 0.5434 *** | 0.6745 *** |
| TECH 10 Measurement | 0.0237 | 0.7440 *** | 0.4126 *** | |
| TECH 11 Analysis of Biological Materials | 0.0579 ** | 0.9154 *** | 0.4643 *** | |
| TECH 12 Control | 0.0134 | 0.6397 *** | 0.5441 *** | |
| TECH 13 Medical Technology | 0.0263 *** | 1.0000 | 0.2804*** | |
| Chemistry | TECH 14 Organic Fine Chemistry | 0.0157 ** | 0.6958 *** | 0.5778 *** |
| TECH 15 Biotechnology | 0.0569 *** | 1.0000 | 0.2893 *** | |
| TECH 16 Pharmaceuticals | 0.0344 | 0.5990 *** | 0.5262 *** | |
| TECH 17 Macromolecular Chemistry/Polymers | 0.0376 *** | 0.8043 *** | 0.5132 *** | |
| TECH 18 Food Chemistry | 0.0084 | 1.0000 | 0.3712 *** | |
| TECH 19 Basic Materials Chemistry | 0.0474 *** | 1.0000 | 0.3219 *** | |
| TECH 20 Materials/Metallurgy | 0.0333 ** | 0.6295 *** | 0.4905 *** | |
| TECH 21 Surface Technology/Coating | 0.0247 ** | 0.7433 *** | 0.5113 *** | |
| TECH 22 Micro-structural and/Nano-technology | 0.9070 *** | 1.0000 | −0.0437 | |
| TECH 23 Chemical Engineering | 0.0713 *** | 0.7995 *** | 0.3767 *** | |
| TECH 24 Environmental Technology | 0.0261 *** | 1.0000 | 0.3687 *** | |
| Mechanical Engineering | TECH 25 Handling | 0.0192 ** | 1.0000 | 0.3720 *** |
| TECH 26 Machine Tools | 0.0089 | 0.4926 *** | 0.5244 *** | |
| TECH 27 Engines/Pumps/Turbines | 0.0126 | 0.5374 ** | 0.3896 *** | |
| TECH 28 Textile/Paper Machines | 0.0160 | 0.5039 *** | 0.4636 *** | |
| TECH 29 Other special Machines | 0.0068 | 0.5462 *** | 0.7750 *** | |
| TECH 30 Thermal Processes and Apparatus | 0.0091 ** | 1.0000 | 0.3892 *** | |
| TECH 31 Mechanical Elements | 0.0374 *** | 0.7593 *** | 0.3555 *** | |
| TECH 32 Transport | 0.0123 ** | 1.0000 | 0.3597 *** | |
| Other fields | TECH 33 Furniture/Games | 0.0120 | 0.9685 | 0.3380 ** |
| TECH 34 Other Consumer Goods | 0.0107 | 0.4704 *** | 0.4021 *** | |
| TECH 35 Civil Engineering | 0.0081 | 0.7521 | 0.4043 *** |
| Sector | Field | Technology Convergence at Initial Time (b0) | Potential Size of Technology Convergence (b1) | Growth Rate of Technology Convergence (b2) |
|---|---|---|---|---|
| Electrical Engineering | TECH 01 Electrical machinery, Apparatus, Energy | 0.0166 *** | 0.5074 *** | 0.3339 *** |
| TECH 02 Audio-Visual Technology | 0.0002 | 0.2058 *** | 0.9915 *** | |
| TECH 03 Telecommunications | 0.0024 ** | 0.0898 *** | 0.4183 *** | |
| TECH 04 Digital Communication | 0.0059 *** | 0.0912 | 0.1926 *** | |
| TECH 05 Basic Communication Processes | 0.0015 | 0.0850 *** | 0.5164 *** | |
| TECH 06 Computer Technology | 0.0067 *** | 0.1236 *** | 0.5046 *** | |
| TECH 07 IT Methods for Management | 0.0023 *** | 1.0000 | 0.2927 ** | |
| TECH 08 Semiconductors | 0.0089 *** | 0.6127 *** | 0.3561 *** | |
| Instruments | TECH 09 Optics | 0.0026 ** | 0.5063 *** | 0.6970 *** |
| TECH 10 Measurement | 0.0267 ** | 0.6559 *** | 0.3409 *** | |
| TECH 11 Analysis of Biological Materials | 0.0315 | 0.5320 *** | 0.5723 *** | |
| TECH 12 Control | 0.0174 *** | 0.5288 *** | 0.4838 *** | |
| TECH 13 Medical Technology | 0.0243 *** | 1.0000 | 0.2683 *** | |
| Chemistry | TECH 14 Organic Fine Chemistry | 0.0030 *** | 1.0000 | 0.3261 *** |
| TECH 15 Biotechnology | 0.0164 ** | 0.9405 | 0.2437 ** | |
| TECH 16 Pharmaceuticals | 0.0044 | 0.0702 | 0.3025 ** | |
| TECH 17 Macromolecular Chemistry/Polymers | 0.0254 *** | 0.6153 *** | 0.4723 *** | |
| TECH 18 Food Chemistry | 0.0036 | 0.3542 | 0.3644 *** | |
| TECH 19 Basic Materials Chemistry | 0.0196 *** | 1.0000 | 0.2994 *** | |
| TECH 20 Materials/Metallurgy | 0.0299 ** | 0.4322 *** | 0.3896 *** | |
| TECH 21 Surface Technology/Coating | 0.0163 ** | 0.5900 *** | 0.5088 *** | |
| TECH 22 Micro-structural and/Nano-technology | 0.4668 *** | 1.0000 | 0.0284 | |
| TECH 23 Chemical Engineering | 0.0309 *** | 0.7216 | 0.2625 *** | |
| TECH 24 Environmental Technology | 0.0100 | 0.8641 | 0.3535 *** | |
| Mechanical Engineering | TECH 25 Handling | 0.0129 | 0.6753 *** | 0.3943 *** |
| TECH 26 Machine Tools | 0.0035 | 0.3043 *** | 0.6451 *** | |
| TECH 27 Engines/Pumps/Turbines | 0.0049 | 0.2365 *** | 0.4356 *** | |
| TECH 28 Textile/Paper Machines | 0.0100 | 0.3872 *** | 0.5432 *** | |
| TECH 29 Other special Machines | 0.0041 | 0.4689 *** | 0.8554 *** | |
| TECH 30 Thermal Processes and Apparatus | 0.0059 | 0.6713 | 0.4036 *** | |
| TECH 31 Mechanical Elements | 0.0283 *** | 0.3508 *** | 0.3403 *** | |
| TECH 32 Transport | 0.0072 | 0.7777 | 0.3545 *** | |
| Other fields | TECH 33 Furniture/Games | 0.0104 | 0.8949 | 0.3289 ** |
| TECH 34 Other Consumer Goods | 0.0075 | 0.3447 *** | 0.4637 *** | |
| TECH 35 Civil Engineering | 0.0077 | 0.7084 | 0.4018 *** |


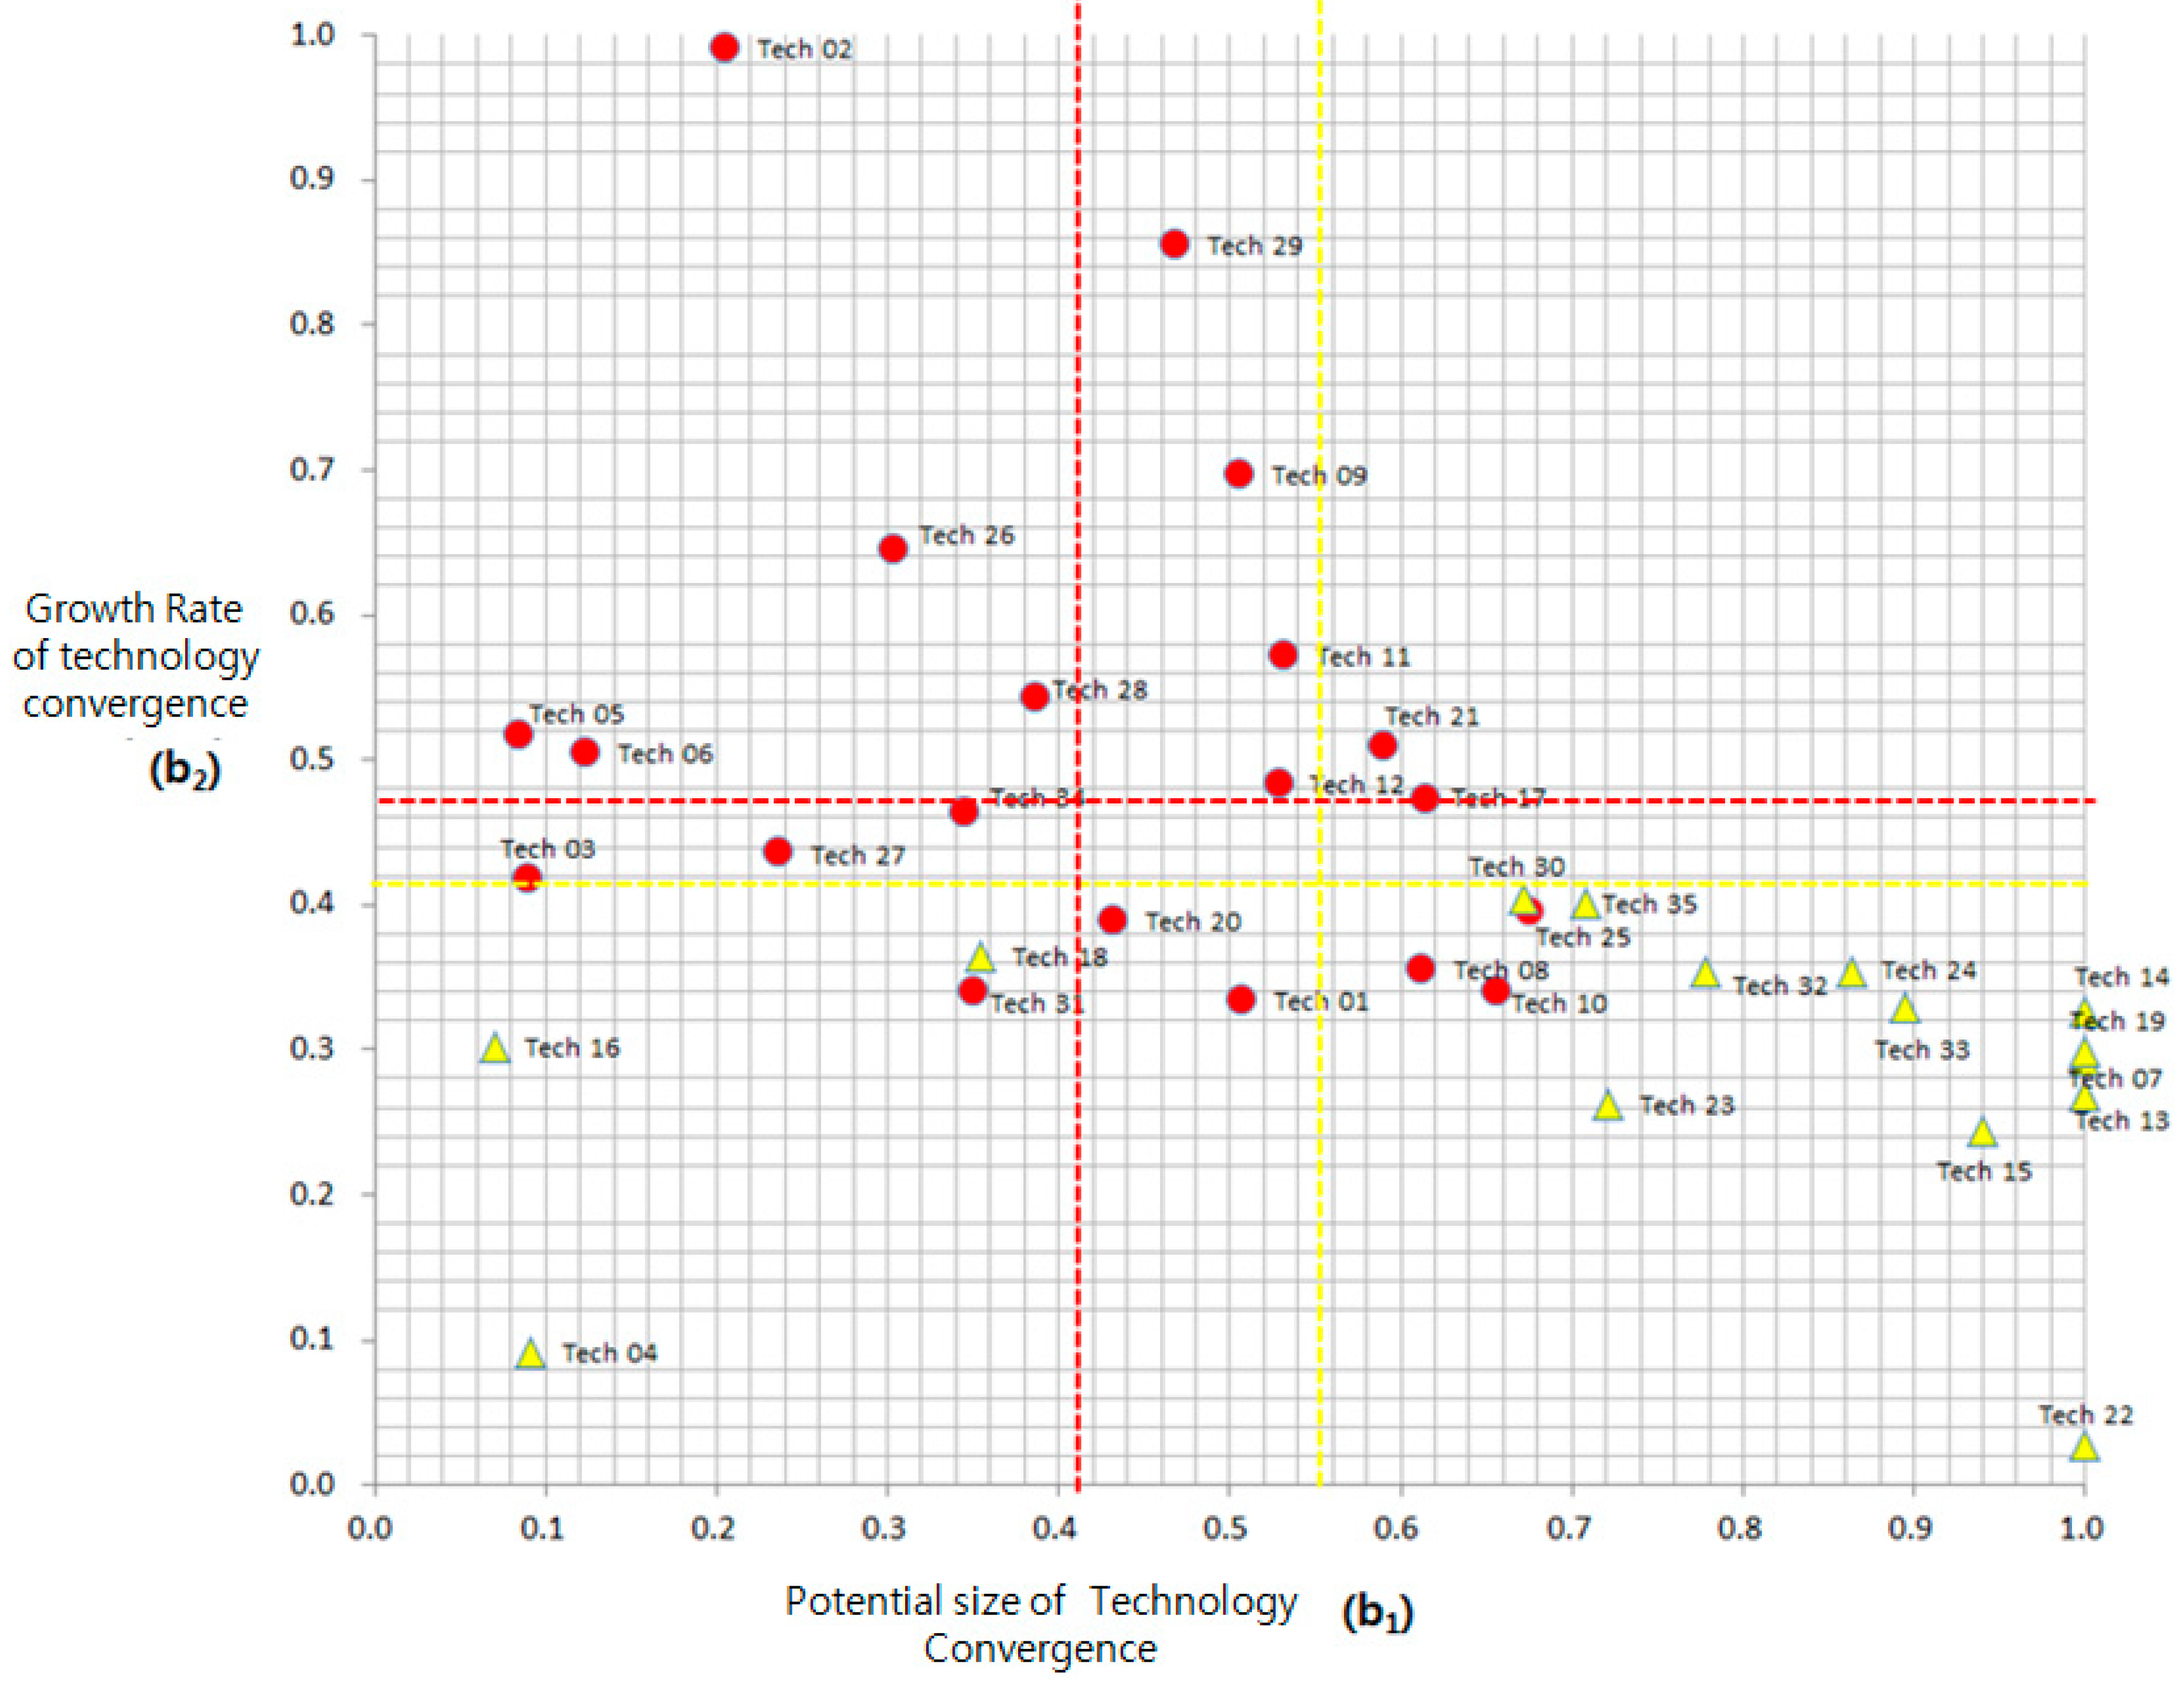
4.2. Analysis of Diffusion Pattern


| Type of Convergence | Top Rank | Bottom Rank | |
|---|---|---|---|
| Total | Field | TECH 11 Analysis of Biological Materials | TECH 07 IT Methods for Management |
| TECH 17 Macromolecular Chemistry/Polymers | TECH 34 Other Consumer Goods | ||
| Sector | TECH 17 Macromolecular Chemistry/Polymers | TECH 04 Digital Communication TECH 16 Pharmaceuticals | |
| TECH 21 Surface Technology/Coating | |||
| TECH 11 Analysis of Biological Materials | |||
| Electrical Engineering | Field | TECH 03 Telecommunications | TECH 07 IT Methods for Management |
| Sector | TECH 01 Electrical machinery, Apparatus, Energy | TECH 04 Digital Communication | |
| Instruments | Field | TECH 11 Analysis of Biological Materials | TECH 13 Medical Technology |
| Sector | TECH 11 Analysis of Biological Materials | TECH 13 Medical Technology | |
| Chemistry | Field | TECH 17 Macromolecular Chemistry/Polymers | TECH 18 Food Chemistry |
| Sector | TECH 17 Macromolecular Chemistry/Polymers | TECH 16 Pharmaceuticals | |
| Mechanical Engineering | Field | TECH 25 Handling | TECH 27 Engines/Pumps/Turbines |
| Sector | TECH 29 Other special Machines | TECH 27 Engines/Pumps/Turbines | |
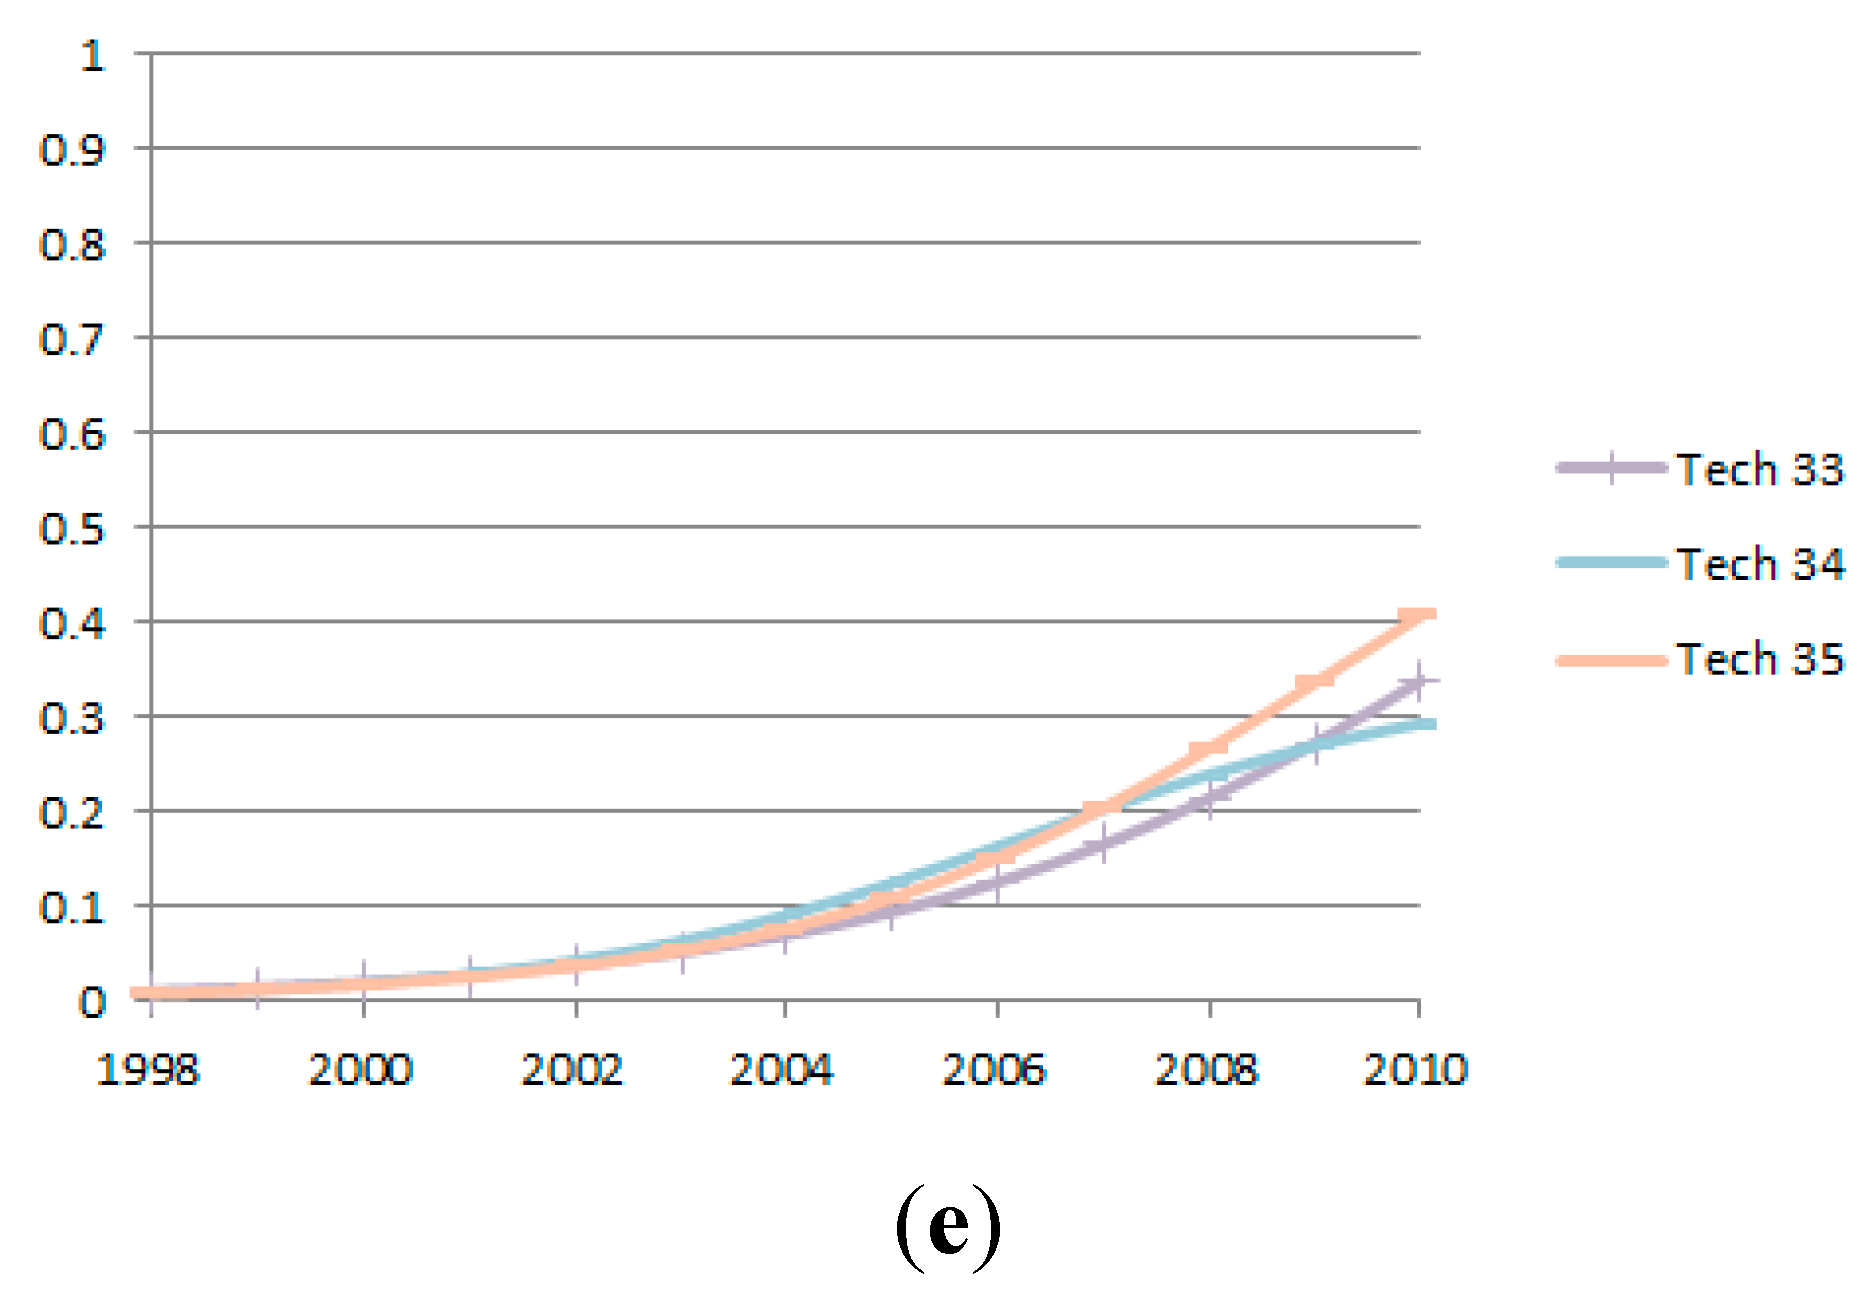
| Other fields | Field | TECH 35 Civil Engineering | TECH 34 Other Consumer Goods |
| Sector | TECH 35 Civil Engineering | TECH 34 Other Consumer Goods |
5. Conclusions
Acknowledgments
Author Contributions
Conflicts of Interest
References
- Dolata, U. Technological innovations and sectoral change. Res. Policy 2009, 38, 1066–1076. [Google Scholar] [CrossRef]
- Lei, D.T. Industry evolution and competence development: The imperatives of technology convergence. Int. J. Technol. Manag. 2000, 19, 699–738. [Google Scholar] [CrossRef]
- Yoffie, D.B. Competing in the age of digital convergence. Calif. Manag. Rev. 1996, 4, 31–53. [Google Scholar] [CrossRef]
- Baer, M. Kooperationen und Konvergenz; Peter Lang GmbH: Frankfurt, Germany, 2004. [Google Scholar]
- Katz, M.L. Remarks on the economic implications of convergence. Ind. Corp. Chan. 1996, 5, 1079–1095. [Google Scholar] [CrossRef]
- Athreye, S.; Keeble, D. Technology convergence, globalisation and ownership in the UK computer industry. Technovation 2000, 20, 227–245. [Google Scholar] [CrossRef]
- Curran, C.S.; Leker, J. Patent indicators for monitoring convergence—examples from NFF and ICT. Technol. Forecast. Soc. Chang. 2011, 78, 256–273. [Google Scholar] [CrossRef]
- Roco, M.C.; Bainbridge, W.S. Converging Technologies for Improving Human Performance. Arlington, Virginia: National Science Foundation. Available online: http://www.nsf.gov/crssprgm/nano/activities/ct05_flyer_rev54.pdf (accessed on 12 August 2015).
- Hacklin, F. Management of Convergence in Innovation: Strategies and Capabilities for Value Creation beyond Blurring Industry Boundaries: Contributions to Management Science; Springer: Berlin, Germany, 2008. [Google Scholar]
- Hacklin, F.; Wallin, M.W. Convergence and interdisciplinarity in innovation management: A review, critique, and future directions. Serv. Ind. J. 2013, 33, 774–788. [Google Scholar] [CrossRef]
- Nordmann, A. Converging Technologies—Shaping the Future of European Societies; Office for Official Publications of the European Communities (EUR 21357): Luxembourg, 2004. [Google Scholar]
- Borés, C.; Saurina, C.; Torres, R. Technology convergence: A strategic perspective. Technovation 2003, 23, 1–13. [Google Scholar] [CrossRef]
- Curran, C.S. The Anticipation of Converging Industries; Springer: London, UK, 2013. [Google Scholar]
- Karvonen, M.; Lehtovaara, M.; Kässi, T. Build-up of understanding of technology convergence: Evidence from printed Intelligence industry. Int. J. Innov. Technol. Manag. 2012, 9. [Google Scholar] [CrossRef]
- Preschitschek, N.; Curran, C.S.; Leker, J. The importance of access to resources in a setting of industry convergence: The case of agriculture and chemistry. In IEEE Proceedings of the Technology Management in the Energy Smart World (PICMET), 2011 PICMET'11, Portland, OR, USA, 31 July–4 August 2011; pp. 1–9.
- Karvonen, M.; Kassi, T. Patent citations as a tool for analysing the early stages of convergence. Technol. Forecast. Soc. Change 2013, 80, 1094–1107. [Google Scholar] [CrossRef]
- Jeong, S.K.; Kim, J.C.; Choi, J.Y. Technology Convergence: What Developmental Stage Are We in? Scientometrics 2015. [Google Scholar] [CrossRef]
- Callon, M.; Law, J.; Rip, A. Mapping the Dynamics of Science and Technology: Sociology of Science in the Real World; MacMillan: London, UK, 1986. [Google Scholar]
- Palmer, C. Structures and strategies of interdisciplinary science. J. Am. Soc. Inf. Sci. 1999, 50, 242–253. [Google Scholar] [CrossRef]
- Small, H. A co-citation model of a scientific specialty: A longitudinal study of collagen research. Soc. Stud. Sci. 1977, 7, 139–166. [Google Scholar] [CrossRef]
- Zitt, M.; Ramanana-Rahary, S.; Bassecoulard, E. Relativity of citation performance and excellence measures: From cross-field to cross-scale effects of field-normalisation. Scientometrics 2005, 63, 373–401. [Google Scholar] [CrossRef]
- Leydesdorff, L. Mapping interdisciplinarity at the interfaces between the Science Citation Index and the Social Science Citation Index. Scientometrics 2007, 71, 391–405. [Google Scholar] [CrossRef]
- Porter, A.L.; Rafols, I. Is science becoming more interdisciplinary? Measuring and mapping six research fields over time. Scientometrics 2009, 81, 719–745. [Google Scholar] [CrossRef]
- Porter, A.L.; Roessner, D.J.; Heberger, A.E. How interdisciplinary is a given body of research? Res. Eval. 2008, 17, 273–282. [Google Scholar] [CrossRef]
- Porter, A.L.; Cohen, A.S.; David Roessner, J.; Perreault, M. Measuring researcher interdisciplinarity. Scientometrics 2007, 72, 117–147. [Google Scholar] [CrossRef]
- Noyons, E.C.M.; van Raan, A.F.J. Monitoring scientific developments from a dynamic perspective: Self-organized structuring to map neural network research. J. Am. Soc. Inf. Sci. 1998, 49, 68–81. [Google Scholar]
- Tijssen, R.J.W. A quantitative assessment of interdisciplinary structures in science and technology: Co-classification analysis of energy research. Res. Policy 1992, 21, 27–44. [Google Scholar] [CrossRef]
- Morillo, F.; Bordons, M.; Gomez, I. Interdisciplinarity in science: A tentative typology of disciplines and research areas. J. Am. Soc. Inf. Sci. Technol. 2003, 54, 1237–1249. [Google Scholar] [CrossRef]
- Schummer, J. Multidisciplinarity, interdisciplinarity, and patterns of research collaboration in nanoscience and nanotechnology. Scientometrics 2004, 59, 425–465. [Google Scholar] [CrossRef]
- Geum, Y.; Kim, C.; Lee, S.; Kim, M. Technology convergence of IT and BT: Evidence from Patent Analysis. ETRI J. 2012, 34, 439–449. [Google Scholar] [CrossRef]
- Jeong, S.K. Strategic collaboration of R&D entities for technology convergence: Exploring organizational differences within the triple helix. J. Manag. Org. 2014, 20, 227–249. [Google Scholar]
- Pennings, J.M.; Puranam, P. Market Convergence and firm strategy: New directions for theory and research. In Proceedings of the ECIS Conference, the Future of Innovation Studies, Eindhoven, The Netherland, 20–23 September 2001.
- Fai, F.; von Tunzelmann, N. Industry-specific competencies and converging technological systems: Evidence from patents. Str. Change Econ. Dyn. 2001, 12, 141–170. [Google Scholar] [CrossRef]
- Curran, C.S.; Bröring, S.; Leker, J. Anticipating converging industries using publicly available data. Technol. Forecast. Soc. Change 2010, 77, 385–395. [Google Scholar] [CrossRef]
- Xing, W.; Ye, X.; Kui, L. Measuring convergence of China’s ICT industry: An input-output analysis. Telecommun. Policy 2011, 35, 301–313. [Google Scholar] [CrossRef]
- Rafols, I.; Porter, A.; Leydesdorff, L. Science overlay maps: A new tool for research policy and library management. J. Am. Soc. Inf. Sci. Technol. 2010, 61, 1871–1887. [Google Scholar] [CrossRef]
- Wagner, C.S.; Roessner, J.D.; Bobb, K.; Klein, J.T.; Boyack, K.W.; Keyton, J.; Rafols, I.; Börner, K. Approaches to understanding and measuring interdisciplinary scientific research (IDR): A review of the literature. J. Inf. 2011, 5, 14–26. [Google Scholar] [CrossRef]
- Ernst, H. Patent information for strategic technology management. World Pat. Inf. 2003, 25, 233–242. [Google Scholar] [CrossRef]
- Gambardella, A.; Giuri, P.; Luzzi, A. The market for patents in Europe. Res. Policy 2007, 36, 1163–1183. [Google Scholar] [CrossRef]
- World Intellectual Property Organisation (WIPO). Concept of a Technology Classification for Country Comparison; WIPO: Karlsruhe, Germany, 2008. [Google Scholar]
- Jaakkola, H. Comparison and Analysis of Diffusion Models. In Diffusion and Adoption of Information Technology; Kautzand, K., Pries-Heje, J., Eds.; Chapman & Hall: New York, NY, USA, 1996. [Google Scholar]
- Mahajan, V.; Muller, E.; Bass, F.M. New Product Diffusion Models in Marketing: A Review and Directions for Research. J. Mark. 1990, 54, 1–26. [Google Scholar] [CrossRef]
- Mahajan, V.; Peterson, R. Models for Innovation Diffusion; Sage Publication: Beverly Hills, CA, USA, 1985. [Google Scholar]
- Kamakura, W.A.; Balasubramanian, S.K. Long-Term View of the Diffusion of Durables: A Study of the Role of Price and Adoption Influence Process via Tests of Nested Models. Int. J. Res. Mark. 1988, 5, 1–13. [Google Scholar] [CrossRef]
- Sung, O.H. A Study on the Mid and Short Term Demand Forecasting of Information Technology Industry Market Using Growth and Diffusion Models. Stat. Rev. 2002, 10, 31–48. [Google Scholar]
- Meyer, M. What is special about patent citations? Differences between scientific and patent citations. Scientometrics 2000, 49, 93–123. [Google Scholar] [CrossRef]
- WIPO. World Intellectual Property Indicators 2012 Edition. Available online: http://www.wipo.int/edocs/pubdocs/en/intproperty/941/wipo_pub_941_2012.pdf (accessed on 12 August 2015).
- Gambardella, A.; Torrisi, S. Does technology convergence imply convergence in markets? Evidence from the electronics industry. Res. Policy 1998, 27, 445–463. [Google Scholar] [CrossRef]
- Tuttlebee, W.H.W. Cordless Telecommunications Worldwide; Springer: Berlin, Germany, 1996; ISBN 978-3-540-19970-0. [Google Scholar]
- Stinson, S. Pharmaceutical fine chemicals. CENEAR 2000, 78, 63–80. [Google Scholar] [CrossRef]
© 2015 by the authors; licensee MDPI, Basel, Switzerland. This article is an open access article distributed under the terms and conditions of the Creative Commons Attribution license (http://creativecommons.org/licenses/by/4.0/).
Share and Cite
Choi, J.Y.; Jeong, S.; Kim, K. A Study on Diffusion Pattern of Technology Convergence: Patent Analysis for Korea. Sustainability 2015, 7, 11546-11569. https://0-doi-org.brum.beds.ac.uk/10.3390/su70911546
Choi JY, Jeong S, Kim K. A Study on Diffusion Pattern of Technology Convergence: Patent Analysis for Korea. Sustainability. 2015; 7(9):11546-11569. https://0-doi-org.brum.beds.ac.uk/10.3390/su70911546
Chicago/Turabian StyleChoi, Jae Young, Seongkyoon Jeong, and Kyunam Kim. 2015. "A Study on Diffusion Pattern of Technology Convergence: Patent Analysis for Korea" Sustainability 7, no. 9: 11546-11569. https://0-doi-org.brum.beds.ac.uk/10.3390/su70911546