Article

Risk Assessment of Regional Irrigation Water Demand and Supply in an Arid Inland River Basin of Northwestern China

1
College of Geodesy and Geomatics, Shandong University of Science and Technology, Qingdao 266590, China
2
State Key Laboratory of Mining Disaster Prevention and Control Co-Founded by Shandong Province and Ministry of Science & Technology, Shandong University of Science and Technology, Qingdao 266590, China
3
State Key Laboratory of Desert and Oasis Ecology, Xinjiang Institute of Ecology and Geography, Chinese Academy of Sciences, Urumqi 830011, China
*
Author to whom correspondence should be addressed.
Sustainability 2015, 7(9), 12958-12973; https://0-doi-org.brum.beds.ac.uk/10.3390/su70912958
Submission received: 10 August 2015 / Revised: 30 August 2015 / Accepted: 15 September 2015 / Published: 22 September 2015
(This article belongs to the Special Issue Sustainable Irrigation and Drainage)

Abstract

:
Irrigation water demand accounts for more than 95% of the total water use in the Kaidu-kongqi River Basin. Determination of the spatial and temporal trends in irrigation water demand is important for making sustainable and wise water management strategies in this highly water deficit region. In this study, the spatial and temporal trends in irrigation water demand as well as net crop irrigation water requirements for nine major crops during 1985–2009 were analyzed by combining the Penman-Monteith equation recommended by Food and Agriculture Organization (FAO) and GIS technology. The regional water stress was also evaluated based on the total irrigation water demand and river discharge at the annual and monthly scales. The results indicated that the annual irrigation water demand in this arid region showed a significant increasing trend during the past 25 years. Total irrigation water demand increased from 14.68 × 10⁸ m3 in 1985 to 34.15 × 10⁸ m3 in 2009. The spatial pattern of total irrigation water demand was significantly affected by the changes in cotton growing area. Due to differences in crop planting structure, the monthly average irrigation water demands in Korla City and Yuli County amounted to the peak in July, while those in other regions reached the maximum in June. Although the annual river runoff was much larger than the irrigation water demand, there was serious water deficit during the critical water use period in May and June in some dry years. The presented study provides important information for managers and planners on sustainable use of water resources in this arid region.

1. Introduction

Water is a key element to restrict the social and economic development and affects the ecological safety in the arid northwestern China, which plays a vital role in the future sustainable development of economy and society [1]. As an important grain, cotton and characteristic forestry and fruit producing region, the Kaidu-kongqi River Basin is one of the most water stressed regions, and the agricultural water use accounts for more than 95% of the total socio-economic water consumption [2]. Irrational irrigation regimes and inadequate water infrastructure lead to extremely low water utilization efficiency. Additionally, with the rapid expansion of arable land in recent years, the agricultural water withdrawal and consumption in this region are becoming increasingly huge. Consequently, water scarcity has become an increasingly serious issue and ecological & socio-economic problems have emerged in this hyper arid region [3].
Currently, there are several methods to calculate crop irrigation water requirement, including mathematical model simulation based on ground observation [4,5] and the method by calculating crop water requirement in combination with crop area to determine the regional irrigation water demand [6,7]. Although the former can obtain accurate agricultural water consumption estimation at the farmland scale, it is not suitable for the study of irrigation water demand in a region. The large-scale crop water requirement can be calculated through rational spatial interpolation of the point scale data, and the large-scale irrigation water demand can be further derived according to the crop planting structure [8,9]. The calculation methods of crop water requirement at the point scale can be summarized as the direct [10,11] and indirect methods [12,13]. Recently, the indirect method is widely adopted to calculate crop water requirement at the point scale in the world [7,8,9,12,13,14,15]. The calculation principle is based on the sufficient irrigation of crops, and the crop water requirement is mainly restricted by meteorological and crop physiological conditions. Consequently, the crop water requirement can be obtained by firstly calculating reference crop evapotranspiration (ET0) and then correction by the crop coefficient (Kc). The Penman-Monteith method is widely applied in calculating ET0 [7,14,15], and it is featured by wide range of application and reliable calculation results [13,16,17]. Many previous studies have been conducted to estimate crop water requirement per unit area [8,9,18]. However, few studies focus on irrigation water demand at the regional scale, especially at the basin scale [7].
Therefore, based on the Penman-Monteith method and crop growing acreage, we selected such nine major crops as wheat, corn, cotton, oilseed, sugar beet, vegetable, pear, grape and apple and analyzed the spatial and temporal variations of irrigation water demand in the Kaidu-kongqi River Basin. The primary objectives of our study are: (1) to explore the quantification methods of irrigation water demand at the basin scale; (2) to estimate the risks of irrigation water supply and demand in the Kaidu-kongqi River Basin. The results of this presented study will provide a baseline for the sustainable use of water resources in this hyper arid basin.

2. Materials and Methods

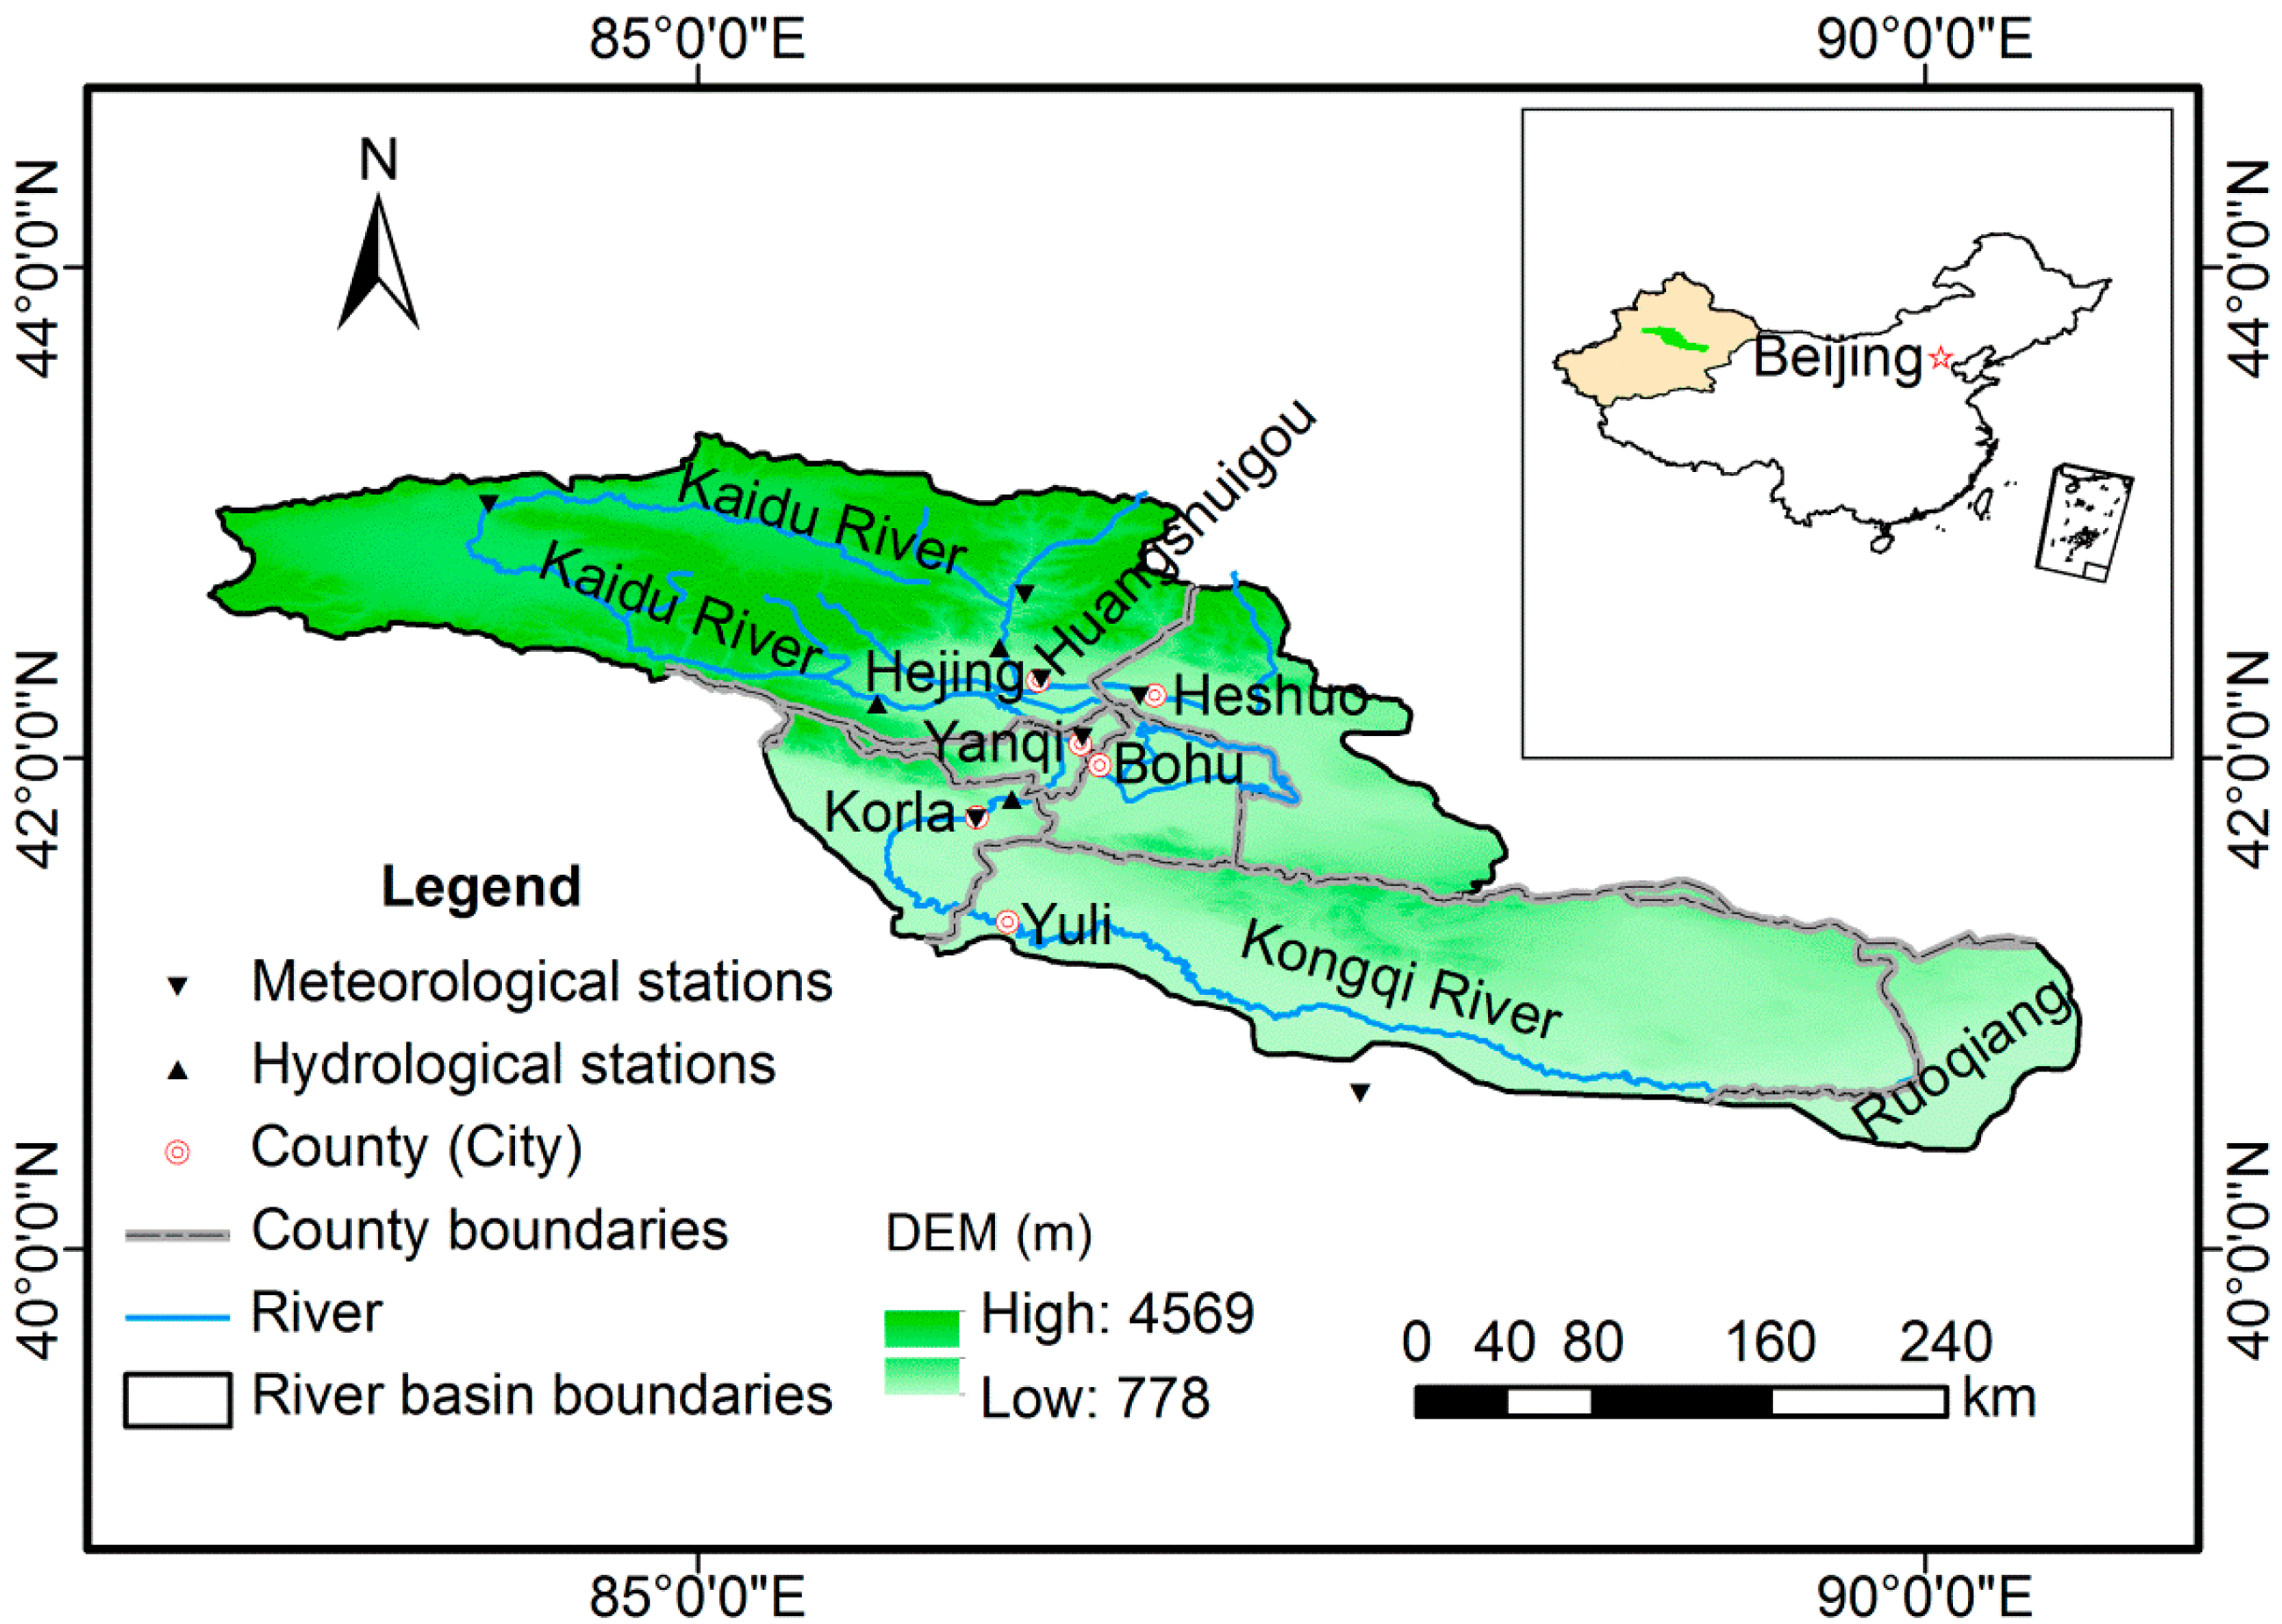
2.1. Study Area Description

Located in the northwestern China, far from oceans, the Kaidu-kongqi River Basin is a typical semiarid and arid area. It is approximately between 40°25′ N and 43°21′ N latitudes and between 82°57′ E and 90°39′ E longitudes and covers an area of 77,000 km2 (Figure 1). The study area possesses a typical inner-continental climate with sufficient sunshine, great temperature variations, scarce precipitation and low humidity. The annual mean runoff of all drainages has been calculated to 35.31 × 10⁸ m3, while the Kaidu River provides more than 85% of the total input. As a result, a large fan developed along the northwestern side of the lake and has been intensively used as irrigated farmland for centuries. The irrigated area in this region is 360.51 × 10³ hm2 in 2010, and the fastest increase goes to cottongrowing land.
Figure 1. Geographical location of the Kaidu-kongqi River Basin, and locations of the meteorological and hydrological stations used in this study.
Sustainability 07 12958 g001
Bosten Lake, the largest inland freshwater lake in China, is located in this basin, comprising a total lake area of approximately 1000 km2 with a maximum water depth of 16 m. During the year 2002–2012, the lake level had decreasing tendency, and in 2012 reached 1045.05 m. Additionally, Bosten Lake is the major water source of ecological-based emergent water conveyance to downstream of the Tarim River, crucial to solve the ecological crisis of this region.
There are abundant resources in the study area including farmlands, minerals and solar-thermal energy. However, the scarce precipitation limits the development of agriculture. Furthermore, the rapid growth of urbanization in the arid region leads to the increased use of water, reducing the supply of water for agriculture. Thus, agricultural and rural areas draw water from natural ecosystems to lessen the economic loss. Moreover, with the increasing population and unplanned exploitation of land and water resources, the contradiction between ecological degradation and economic development has become more apparent and complicated. Consequently, water has become the main restrictive factor for social-economic development and ecological conservation.

2.2. Data Description

In this study, daily meteorological observations for the period of 1985–2010 from seven meteorological stations (Figure 1) were collected from China Meteorological Data Sharing Service System [19]. The main meteorological variables include the maximum and minimum temperatures, wind speed, relative humidity and sunshine duration. Socio-economic statistical data were obtained from the Bayinguoleng Statistical Yearbook [20] and Xinjiang Production & Construction Group Statistical Yearbook (1986–2010) [21], including arable land and the various crops sown at the county level. Land-cover data for the years 1985 and 2000 at 1 km × 1 km resolution were available from the Environmental and Ecological Science Data Centre for West China [22]. Monthly river discharge data from Dashankou and Huangshuigou hydrological stations (supplied by Tarim River Basin Management Bureau) were also used to analyze the supply and demand situation in the Kaidu-kongqi River Basin.

2.3. Methods

2.3.1. Calculation of Crop Irrigation Water Requirement

The total irrigation water demand of a certain crop was calculated using the following formula:
W = 10 N S / I e
where W is the total irrigation water demand of a certain crop (m3); N is the net irrigation water requirement of a certain crop (mm); S is the sown area of a certain crop (hm2); Ie is the irrigation efficiency.
The net irrigation water requirement of a certain crop was calculated as follows [23]:
N = E T c P e
where ETc is the water requirement of a certain crop (mm); Pe denotes the effective rainfall (mm).

2.3.2. Calculation of ETc

The crop water requirement ETc, as the basis to calculate crop irrigation water requirement, can be determined by the methods of field measurement and theoretical calculation. In this paper, the crop coefficient method was employed to calculate the crop water requirement, with the formula as shown below [24]:
E T c = E T 0 K c
where ET0 is the reference evapotranspiration (mm); Kc is the crop coefficient.

2.3.3. Calculation of ET0

Reference evapotranspiration (ET0) was calculated using the modified Penman-Monteith equation recommended by FAO [24].

2.3.4. Crop Coefficient

The Kc values reflect the relative water consumption capacity of crop during different growing stages of various crops [7]. In general, the crop coefficient varies during four developing stages: the initial growth period, the rapid development period, mid-maternity and mature period. Kc value is generally very small at the initial growth period because of low crop cover and most water consumption from soil evaporation. During the rapid development period, the leaf area increases rapidly and causes a rapid increase in Kc value. The Kc value reaches the maximum when crops are fully developed, and remains stable over a period of time. As the crop matured, the Kc value starts to decrease [25].
The crop coefficients at different growing stages in Yanqi County, calculated by FAO subsection single value average method, are used in this study [25]. In addition, the crop coefficients for individual crops refer to standard crop coefficients recommended by FAO. The crop coefficients for selected major crops are shown in Table 1.
Table 1. Crop coefficients for selected major crops during the growing period in the Kaidu-kongqi River Basin.
CropDevelopment StageSowing (mm/dd)Harvesting (mm/dd)Total (days)
InitialDevelopingMiddleLate
Wheat0.170.17–1.161.161.16–0.403/77/5121
Corn0.210.21–1.201.201.20–0.354/279/17144
Cotton0.260.26–1.201.201.20–0.704/2010/16180
Oilseed0.310.31–1.151.151.15–0.356/149/29108
Sugar beet0.340.34–1.211.210.21–0.703/159/24194

2.3.5. Effective Rainfall

The effective rainfall at agricultural land is defined as the portion of rainfall penetrating canopy, infiltrated in soil layer and stored in the crop root zone, which can be used later by crops as transpiration. It does not include the interception of plant canopy, surface runoff and the amount of water percolating to the layer below the root zone. Effective rainfall is usually calculated as follows:
P e = P δ
where P is the precipitation (mm); δ is an empirically effective utilization coefficient of rainfall, which is adopted as 0.52 [26].

2.3.6. Irrigation Efficiency

Irrigation water utilization coefficient refers to the ratio of the net amount of water used by crops to the total amount of water withdrawn from river channels to reservoirs. It is mainly composed of the canal water utilization coefficient and the field water utilization coefficient. The canal water utilization is used to measure the degree of utilization of canal water delivery; the field water utilization coefficient is used to measure the degree of utilization of soil water [27]. Improvements in irrigation infrastructure as well as the development of water-saving technologies have led to an obvious improvement of irrigation efficiency. According to Xinjiang Water Resources Bulletin [28] and Bayinguoleng Water Resources Bulletin (supplied by Bayinguoleng Water Conservancy Bureau), the irrigation water utilization coefficient has increased from 0.35 in 1985 to 0.56 in 2009 (Table 2).
Table 2. Development of irrigation water efficiency in the Kaidu-kongqi River Basin during 1985–2009.
Year19851990200020052009
Irrigation Efficiency0.350.400.500.550.56

2.3.7. Spatial Distribution of Crop Acreage

The spatial distribution of data mainly includes the quantification of crop acreage in administrative units of county in 1985, 2000 and 2009 to the geographic grid cell of land-cover data. The crop acreage data of the Second Agricultural Division of Xinjiang Production and Construction Group are integrated into the counties according to its administrative region. The initial value of arable land area for each county was obtained based on the land-cover data in the years 1985 and 2000, and then it was corrected according to the actual statistical data for the corresponding years. Finally, the spatial distribution maps of crop acreage for major crops at a resolution of 1 km × 1 km were obtained. Figure 2 shows the spatial distribution of acreage for cotton at a resolution of 1 km × 1 km for the years 1985, 2000 and 2009. In addition, cotton acreage showed a significantly increasing trend during 1985–2009, especially in Yuli County and Korla City.
Figure 2. Spatial distribution of acreage for cotton at a resolution of 1 km × 1 km during 1985–2009.
Sustainability 07 12958 g002

3. Results and Discussions

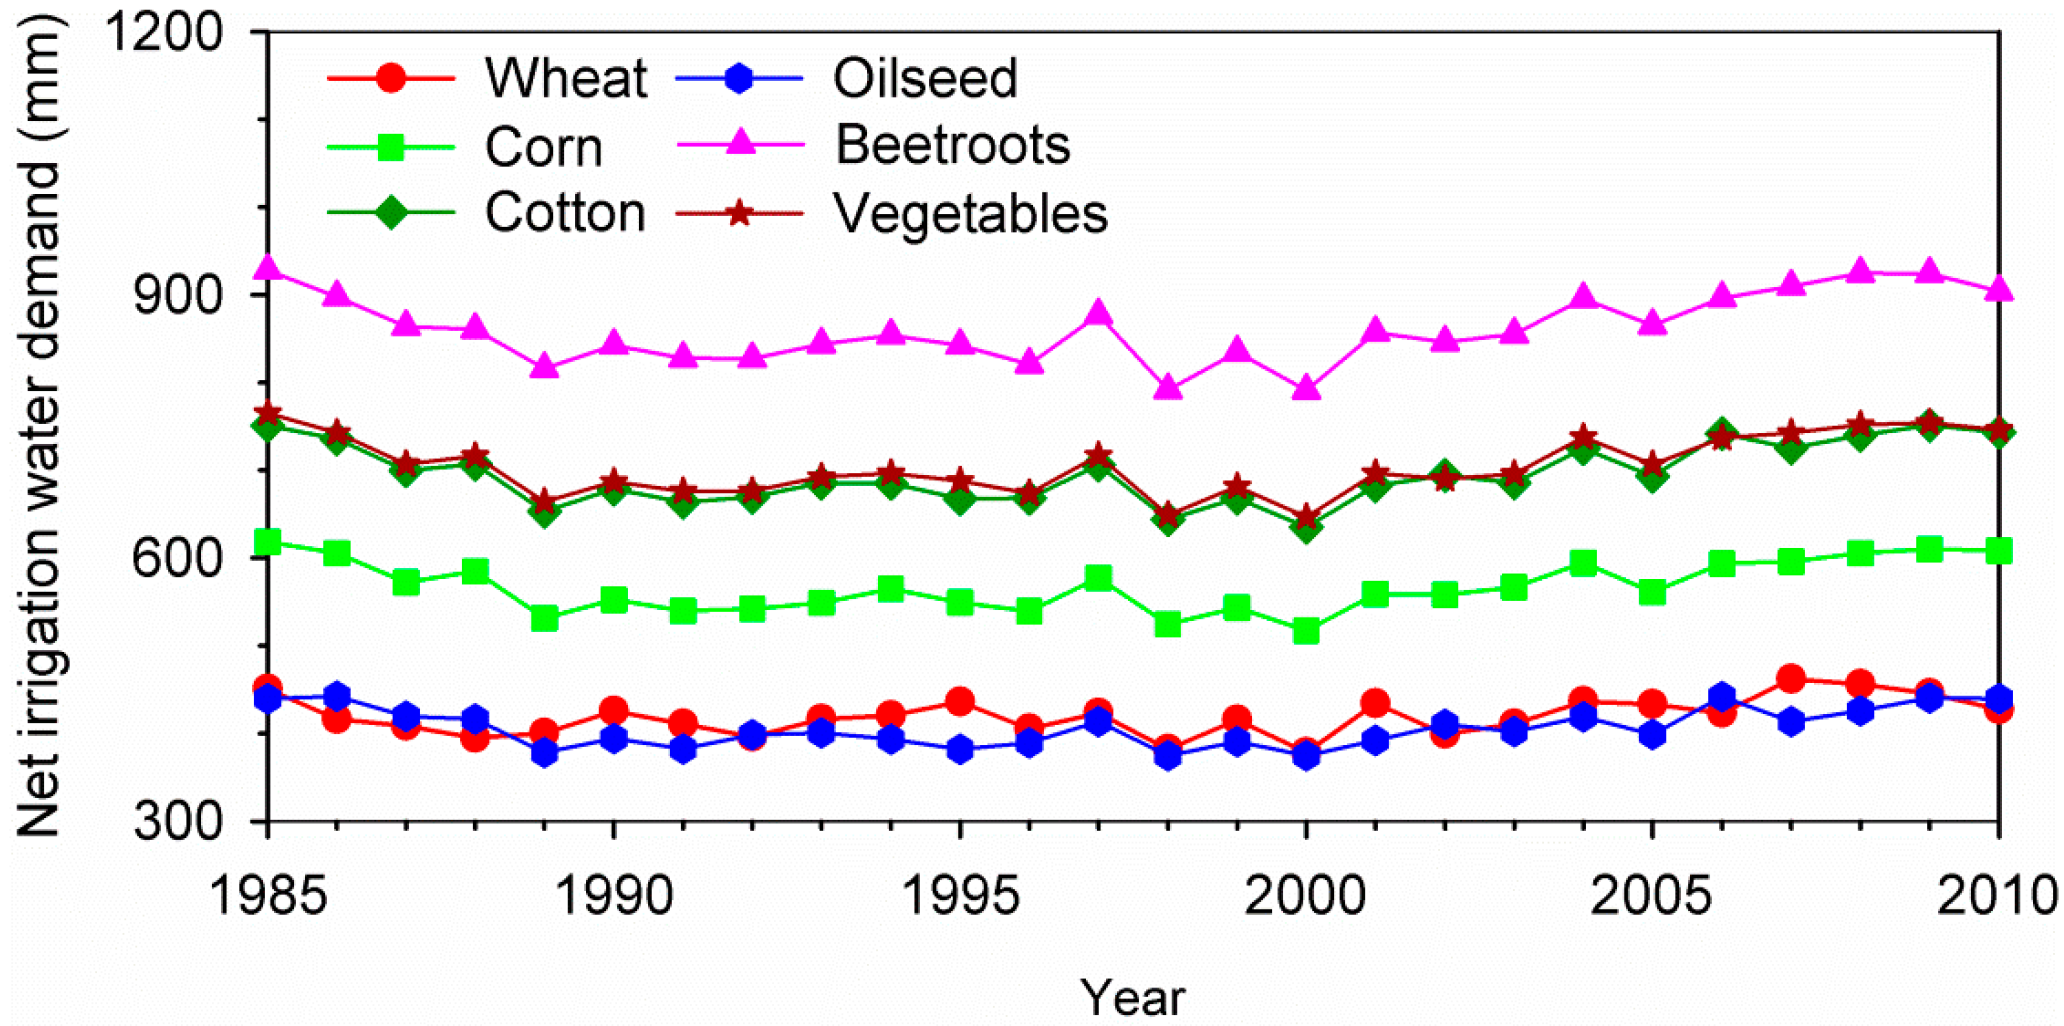
3.1. Characteristics of Net Crop Irrigation Water Requirement

Table 3 shows the mean net irrigation water requirements for the nine major crops during 1985–2009 in the Kaidu-kongqi River Basin. The net irrigation water requirement for sugar beet is the maximum, up to 861 mm, while that for oilseed is the minimum, only 407 mm. In addition, the overall characteristics of the mean net irrigation water requirements are shown as the sugar beet > apple > pear > vegetable > cotton > corn > grape > wheat > oilseed. Due to the differences in geographical conditions, there exists a difference in the spatial distribution of the net crop irrigation water requirement for each region, but it is not obvious. The strong evaporation of reference crop and rare rainfall in Korla City and Yuli County resulted in slightly higher net crop irrigation water requirements than that in other regions.
Table 3. Mean net irrigation water requirements for major crops in the Kaidu-kongqi River Basin.
RegionMean Net Irrigation Water Requirements for Major Crops (mm)
WheatCornCottonOilseedSugar beetVegetablePearGrapeApple
Hejing354463579336717582638461670
He shuo415560684399848695764544780
Korla452636779459956783864617882
Yanqi415560684399848695764544780
Bohu415560684399848695764544780
Yuli465629768448951780858612877
Average420568696407861705775554795
Figure 3 shows the variation trends of net irrigation water requirements for several selected crops in the river basin during 1985–2010. As shown in Figure 3, the net irrigation water requirements for these crops began to decline in 1985 and continued until 1989, and then they increased gradually after 1989, especially after the year 2000. The temperature in this basin showed an increasing trend in the most recent five decades, especially during 1990–2010 [29]. However, the precipitation presented a decreasing trend in the oases where agricultural land was mainly distributed [29]. The decrease of precipitation in the oases was harmful to the agricultural production. Thus, the rising temperature and decreasing precipitation in the oases had resulted in an increase in net crop irrigation water requirement since 1989.
Figure 3. Trends of net irrigation water requirements for selected crops in the Kaidu-kongqi River Basin during 1985–2010.
Sustainability 07 12958 g003

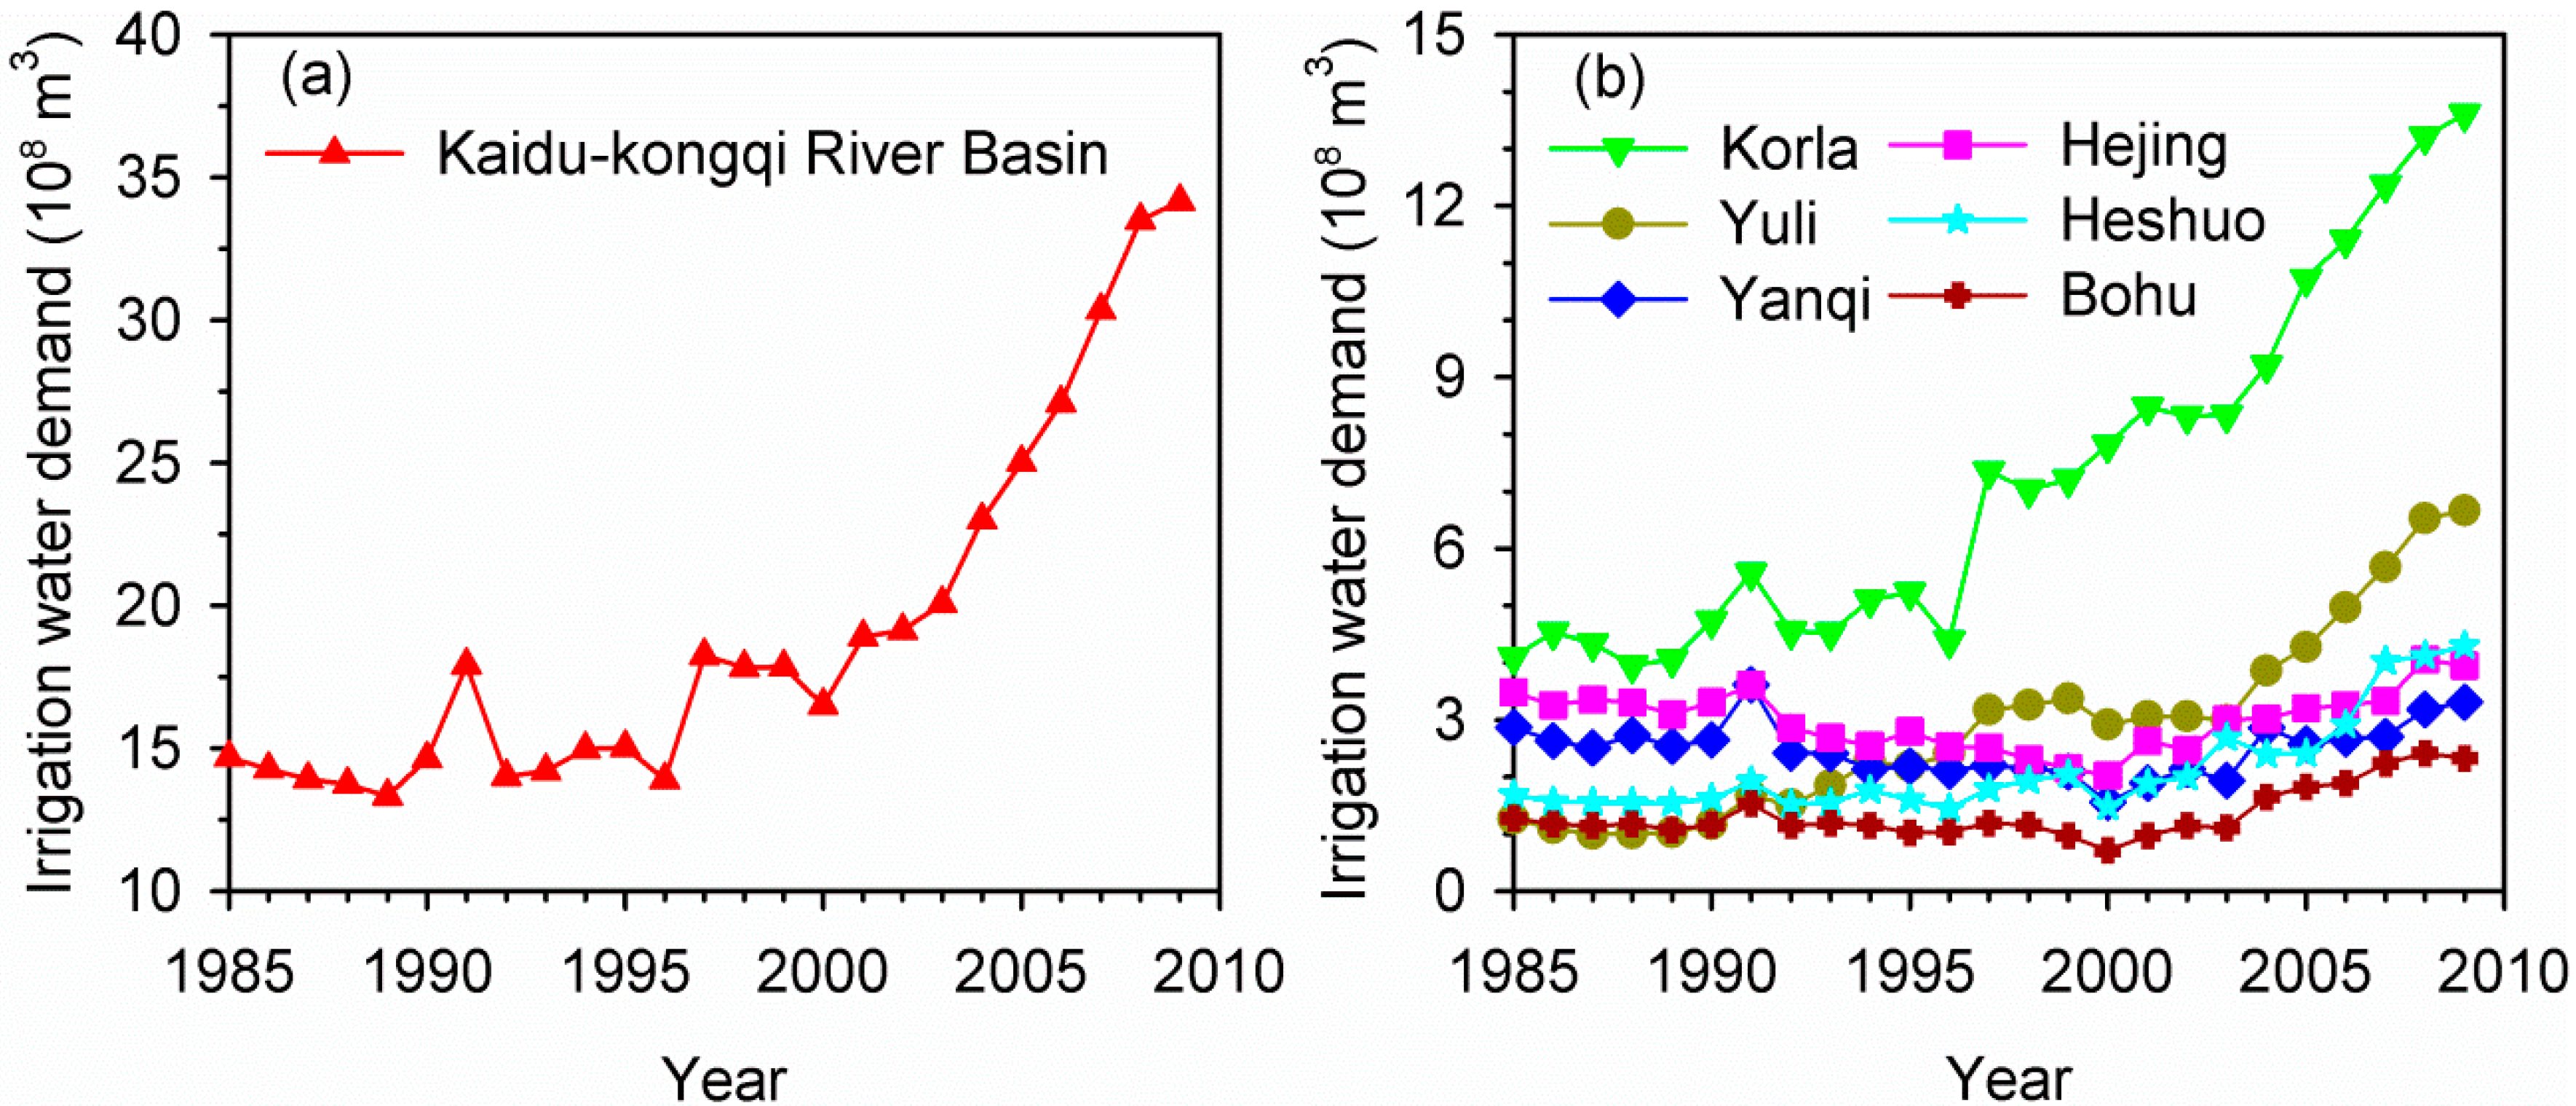
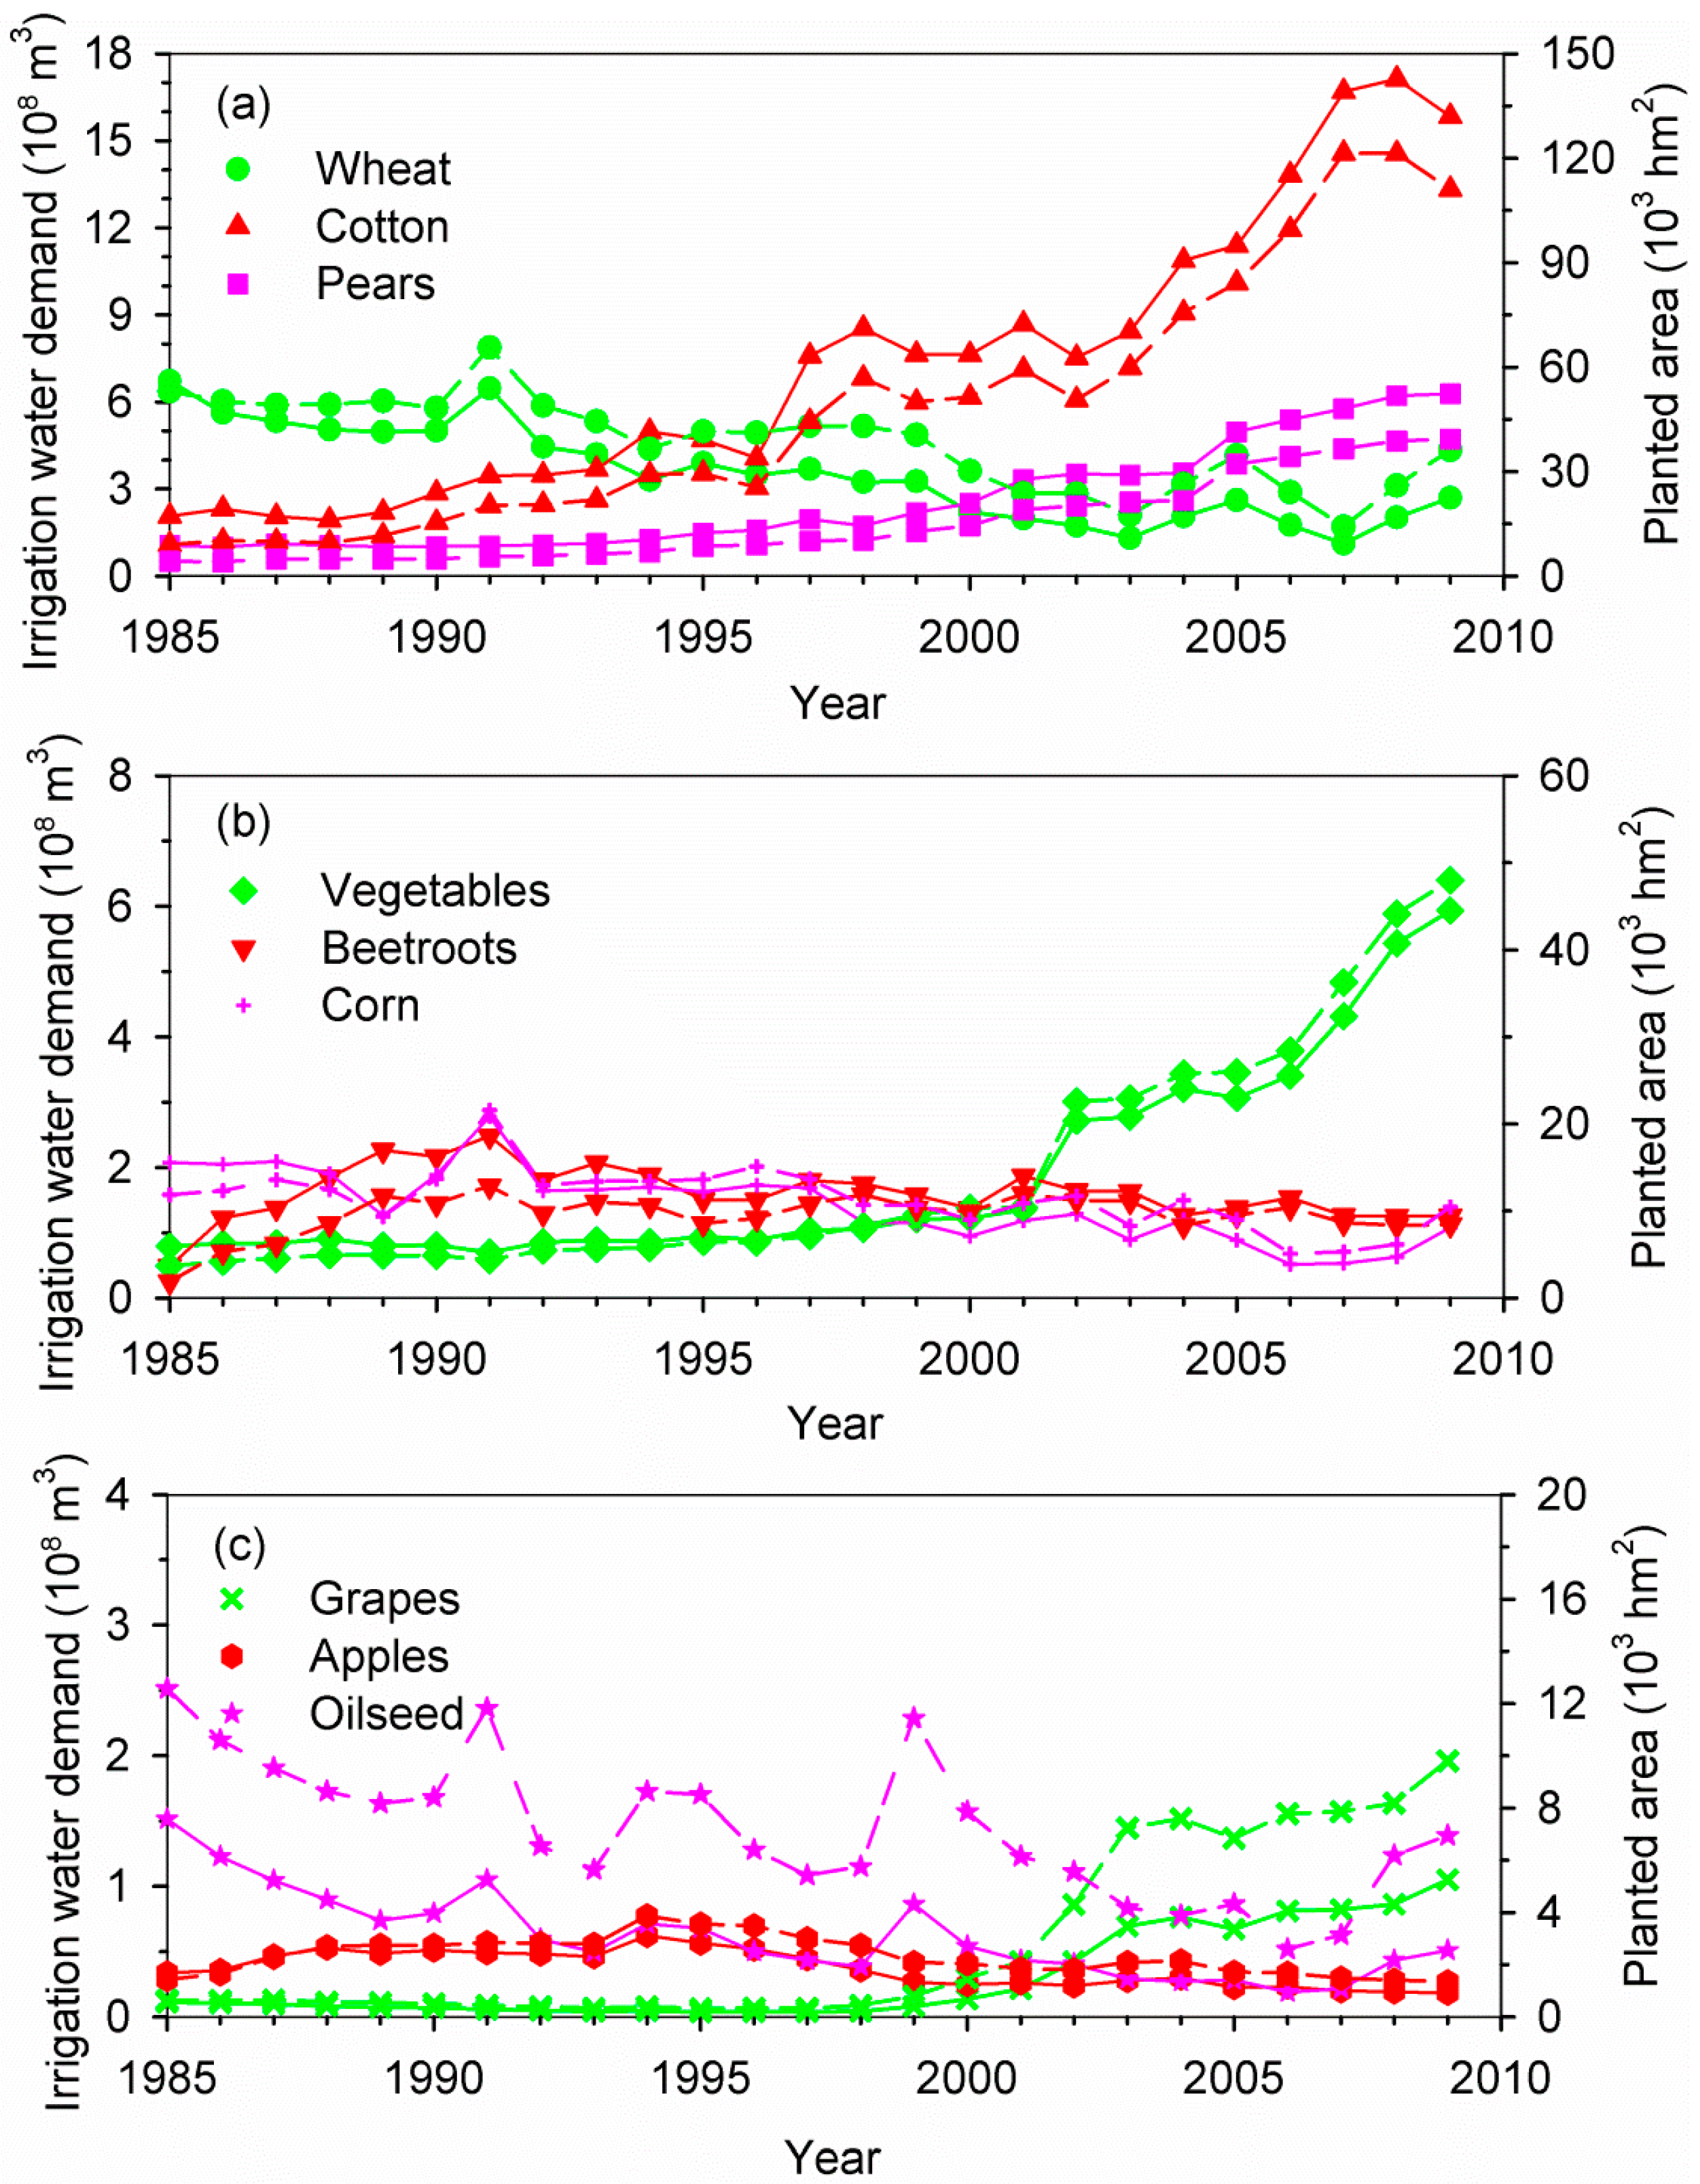
3.2. Characteristics of the Inter-Annual Irrigation Water Demand

The total irrigation water demand in the whole basin showed an obviously increasing trend, especially after the year 1997 (Figure 4). The total irrigation water demand in the Kaidu-kongqi River Basin reached 34.15 × 10⁸ m3 in 2009, increasing by nearly 20.00 × 10⁸ m3 compared with that in 1985. The increase of irrigation water demand could be attributed to the increase in net crop irrigation water requirement and the expansion of cultivated land. The population grew fast in the basin and the continuous growth of population directly led to the expansion of the cultivated land during the recent two decades [29]. Large areas of wasteland and natural grassland had been reclaimed for cultivation [29]. The cultivated land increased slowly during 1985–1996, and then it showed a rapid increase after the year 1997.
The total irrigation water demands showed rapid increase in Korla City, Yuli County and Heshuo County. In 1985, the irrigation water demands for these three regions were only 4.10 × 10⁸ m3, 1.26 × 10⁸ m3 and 1.69 × 10⁸ m3, respectively. However, they amounted to 13.61 × 10⁸ m3, 6.66 × 10⁸ m3 and 4.29 × 10⁸ m3 in 2009, respectively. The considerable increase in irrigation water demands in these regions was mainly due to the rapid expansion of cultivated land [29] and the adjustment of the planting structure. The total irrigation water demands in Hejing and Yanqi County increased from 3.48 × 10⁸ m3 and 2.87 × 10⁸ m3 in 1985 to 3.95 × 10⁸ m3 and 3.31 × 10⁸ m3 in 2009, respectively, increasing by only 14% and 15% compared with that in 1985. The variation trend of total irrigation water demand in Bohu County was similar to that in Yanqi County, and the total irrigation water demand increased from 1.28 × 10⁸ m3 in 1985 to 2.33 × 10⁸ m3 in 2009, increasing by 82% compared with that in 1985. The slightly increase in the cultivated land and the adjustment of the planting structure were responsible for the variation trends of irrigation water demand in these counties.
Figure 4. Trends of total irrigation water demands in the (a) Kaidu-kongqi River Basin and (b) each county during 1985–2009.
Sustainability 07 12958 g004
Figure 5 shows the variation trends of the total irrigation water demands and acreage for major crops in the Kaidu-kongqi River Basin during 1985–2009. As shown in Figure 5, the variation trends of the total irrigation water demands for crops were consistent with the trends of crop acreage. With the implementation of advantageous resources transformation strategy for “One Black (i.e., petroleum) and One White (i.e., cotton)” and the regional development strategy of “Cotton in the South and Grain in the North” as well as the improvement of water conservancy facilities in Xinjiang Uygur Autonomous Region, a great proportion of cultivated land had been devoted to the profitable cotton production in this basin [29]. The cotton acreage increased rapidly from 9 × 10³ hm2 in 1985 to 111 × 103 hm2 in 2009, increasing by 11.3 times. The total irrigation water demand for cotton also increased rapidly from 2.07 × 10⁸ m3 in 1985 to 15.84 × 10⁸ m3 in 2009, increasing by 6.7 times. However, the total irrigation water demands for wheat, corn and apple showed decreasing trends, and they were 2.69 × 10⁸ m3, 1.08 × 10⁸ m3 and 0.18 × 10⁸ m3, respectively, in 2009, reducing by 60%, 48% and 46%, respectively compared with that in 1985. Although the net irrigation water requirements for oilseed, sugar beet and other crops were much higher than those for wheat, corn and cotton, the small acreage without substantial change during 1985–2009 had resulted in a smaller amount of the total irrigation water demand and generally kept constant. In 2009, the total irrigation water demands for vegetables, pears and grapes reached 5.94 × 10⁸ m3, 6.28 × 10⁸ m3 and 1.05 × 10⁸ m3 respectively, increasing by 6.5, 5.0 and 8.4 times, respectively, compared with that in 1985.
Figure 5. Trends of the total irrigation water requirements (solid lines) and crop acreage (dashed lines) for (a) wheat, cotton and pears; (b) vegetables, beetroots and corn and (c) grapes, apples and oilseed in the Kaidu-kongqi River Basin during 1985–2009.
Sustainability 07 12958 g005

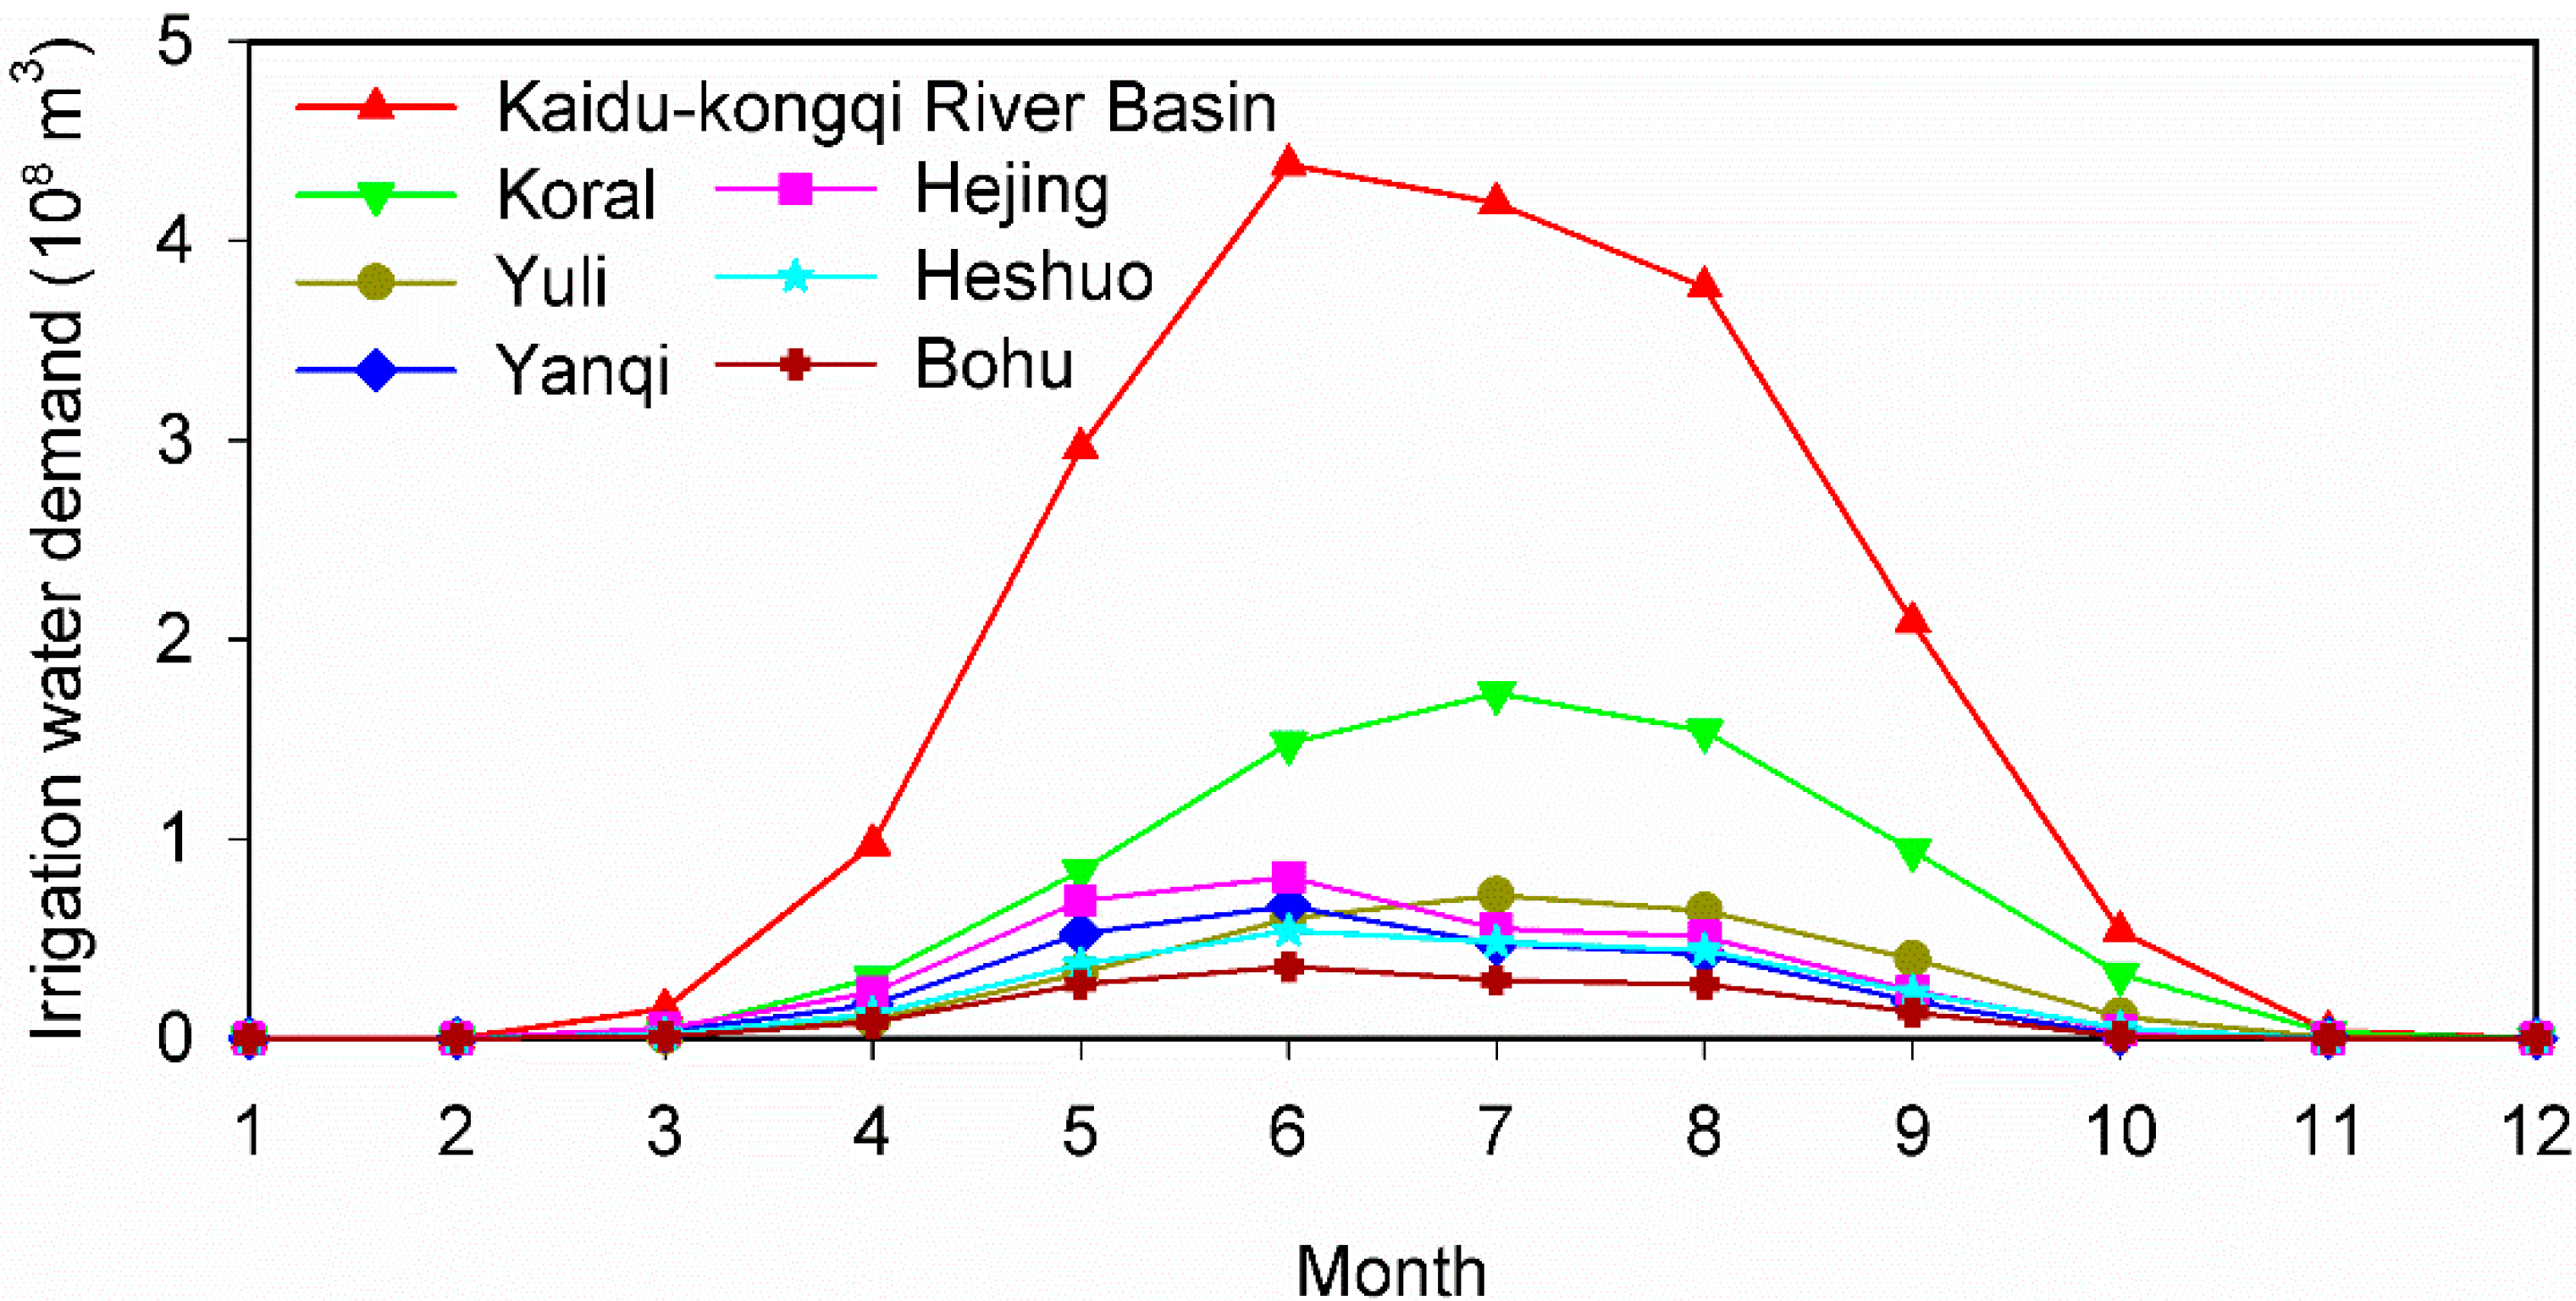
3.3. Characteristics of Intra-Annual Irrigation Water Demand

Figure 6 shows the monthly average total irrigation water demand in the Kaidu-kongqi River Basin. There were some differences in monthly average total irrigation water demands. It reached the peak in June for the whole basin, up to 4.38 × 10⁸ m3, and that in Korla City and Yuli County reached the maximum in July, up to 1.73 × 10⁸ m3 and 0.72 × 10⁸ m3, respectively. However, monthly average total irrigation water demands in Yanqi, Hejing, Heshuo and Bohu County reached the maximum in June, up to 0.66 × 10⁸ m3, 0.81 × 10⁸ m3, 0.54 × 10⁸ m3 and 0.36 × 10⁸ m3, respectively. These differences were mainly related to the crop planting structure in various regions. The irrigation water demands for cotton and pear orchard were dominated in Korla City and Yuli County, and the water demand peak period came as the cotton coincides with the boll split and flowering in July. In addition, most fruit trees were subject to a rapid expanding in July, and they needed adequate water supply to guarantee the reproductive and vegetative growth of pear trees. Therefore, total irrigation water demand in these regions reached the maximum at this time. The spring wheat and corn were mainly planted in Yanqi, Hejing, Heshuo and Bohu County, and the monthly average total irrigation water demand in these regions amounted to the maximum in June as the spring wheat and corn are in the grain filling and elongation stages at this time.
Figure 6. The intra-annual variation of irrigation water demand in the Kaidu-kongqi River Basin during 1985–2009.
Sustainability 07 12958 g006

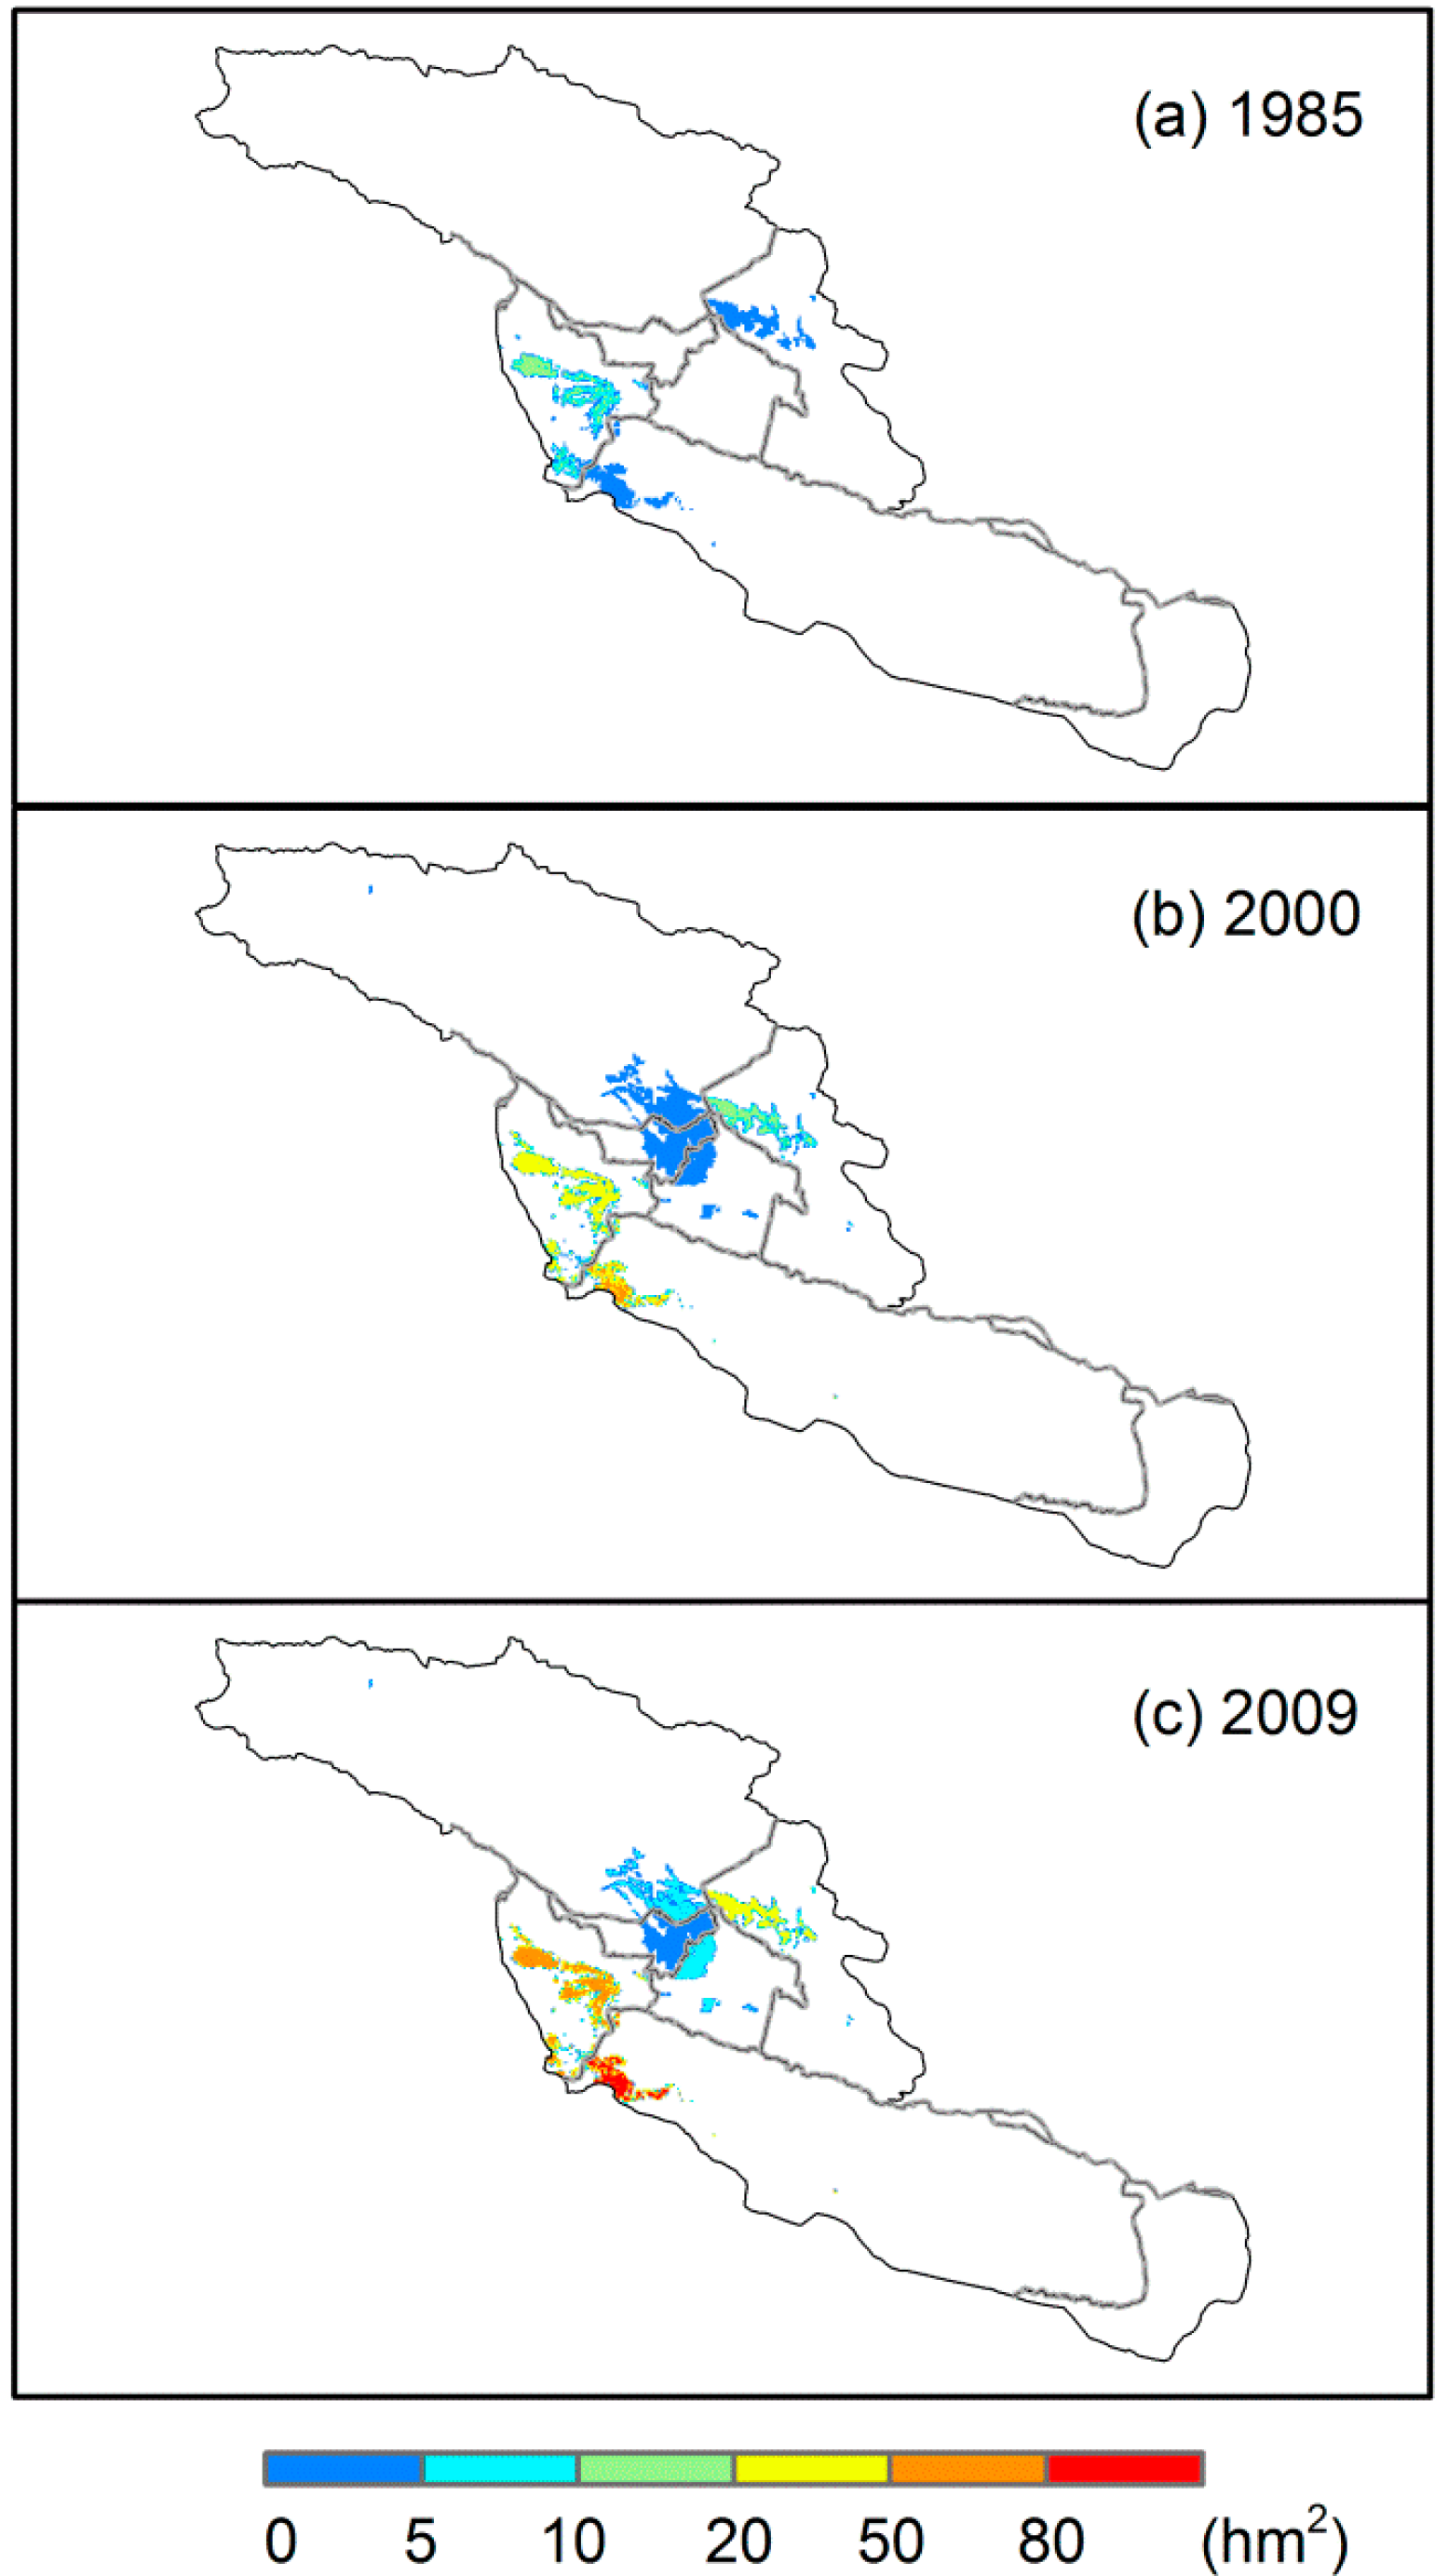
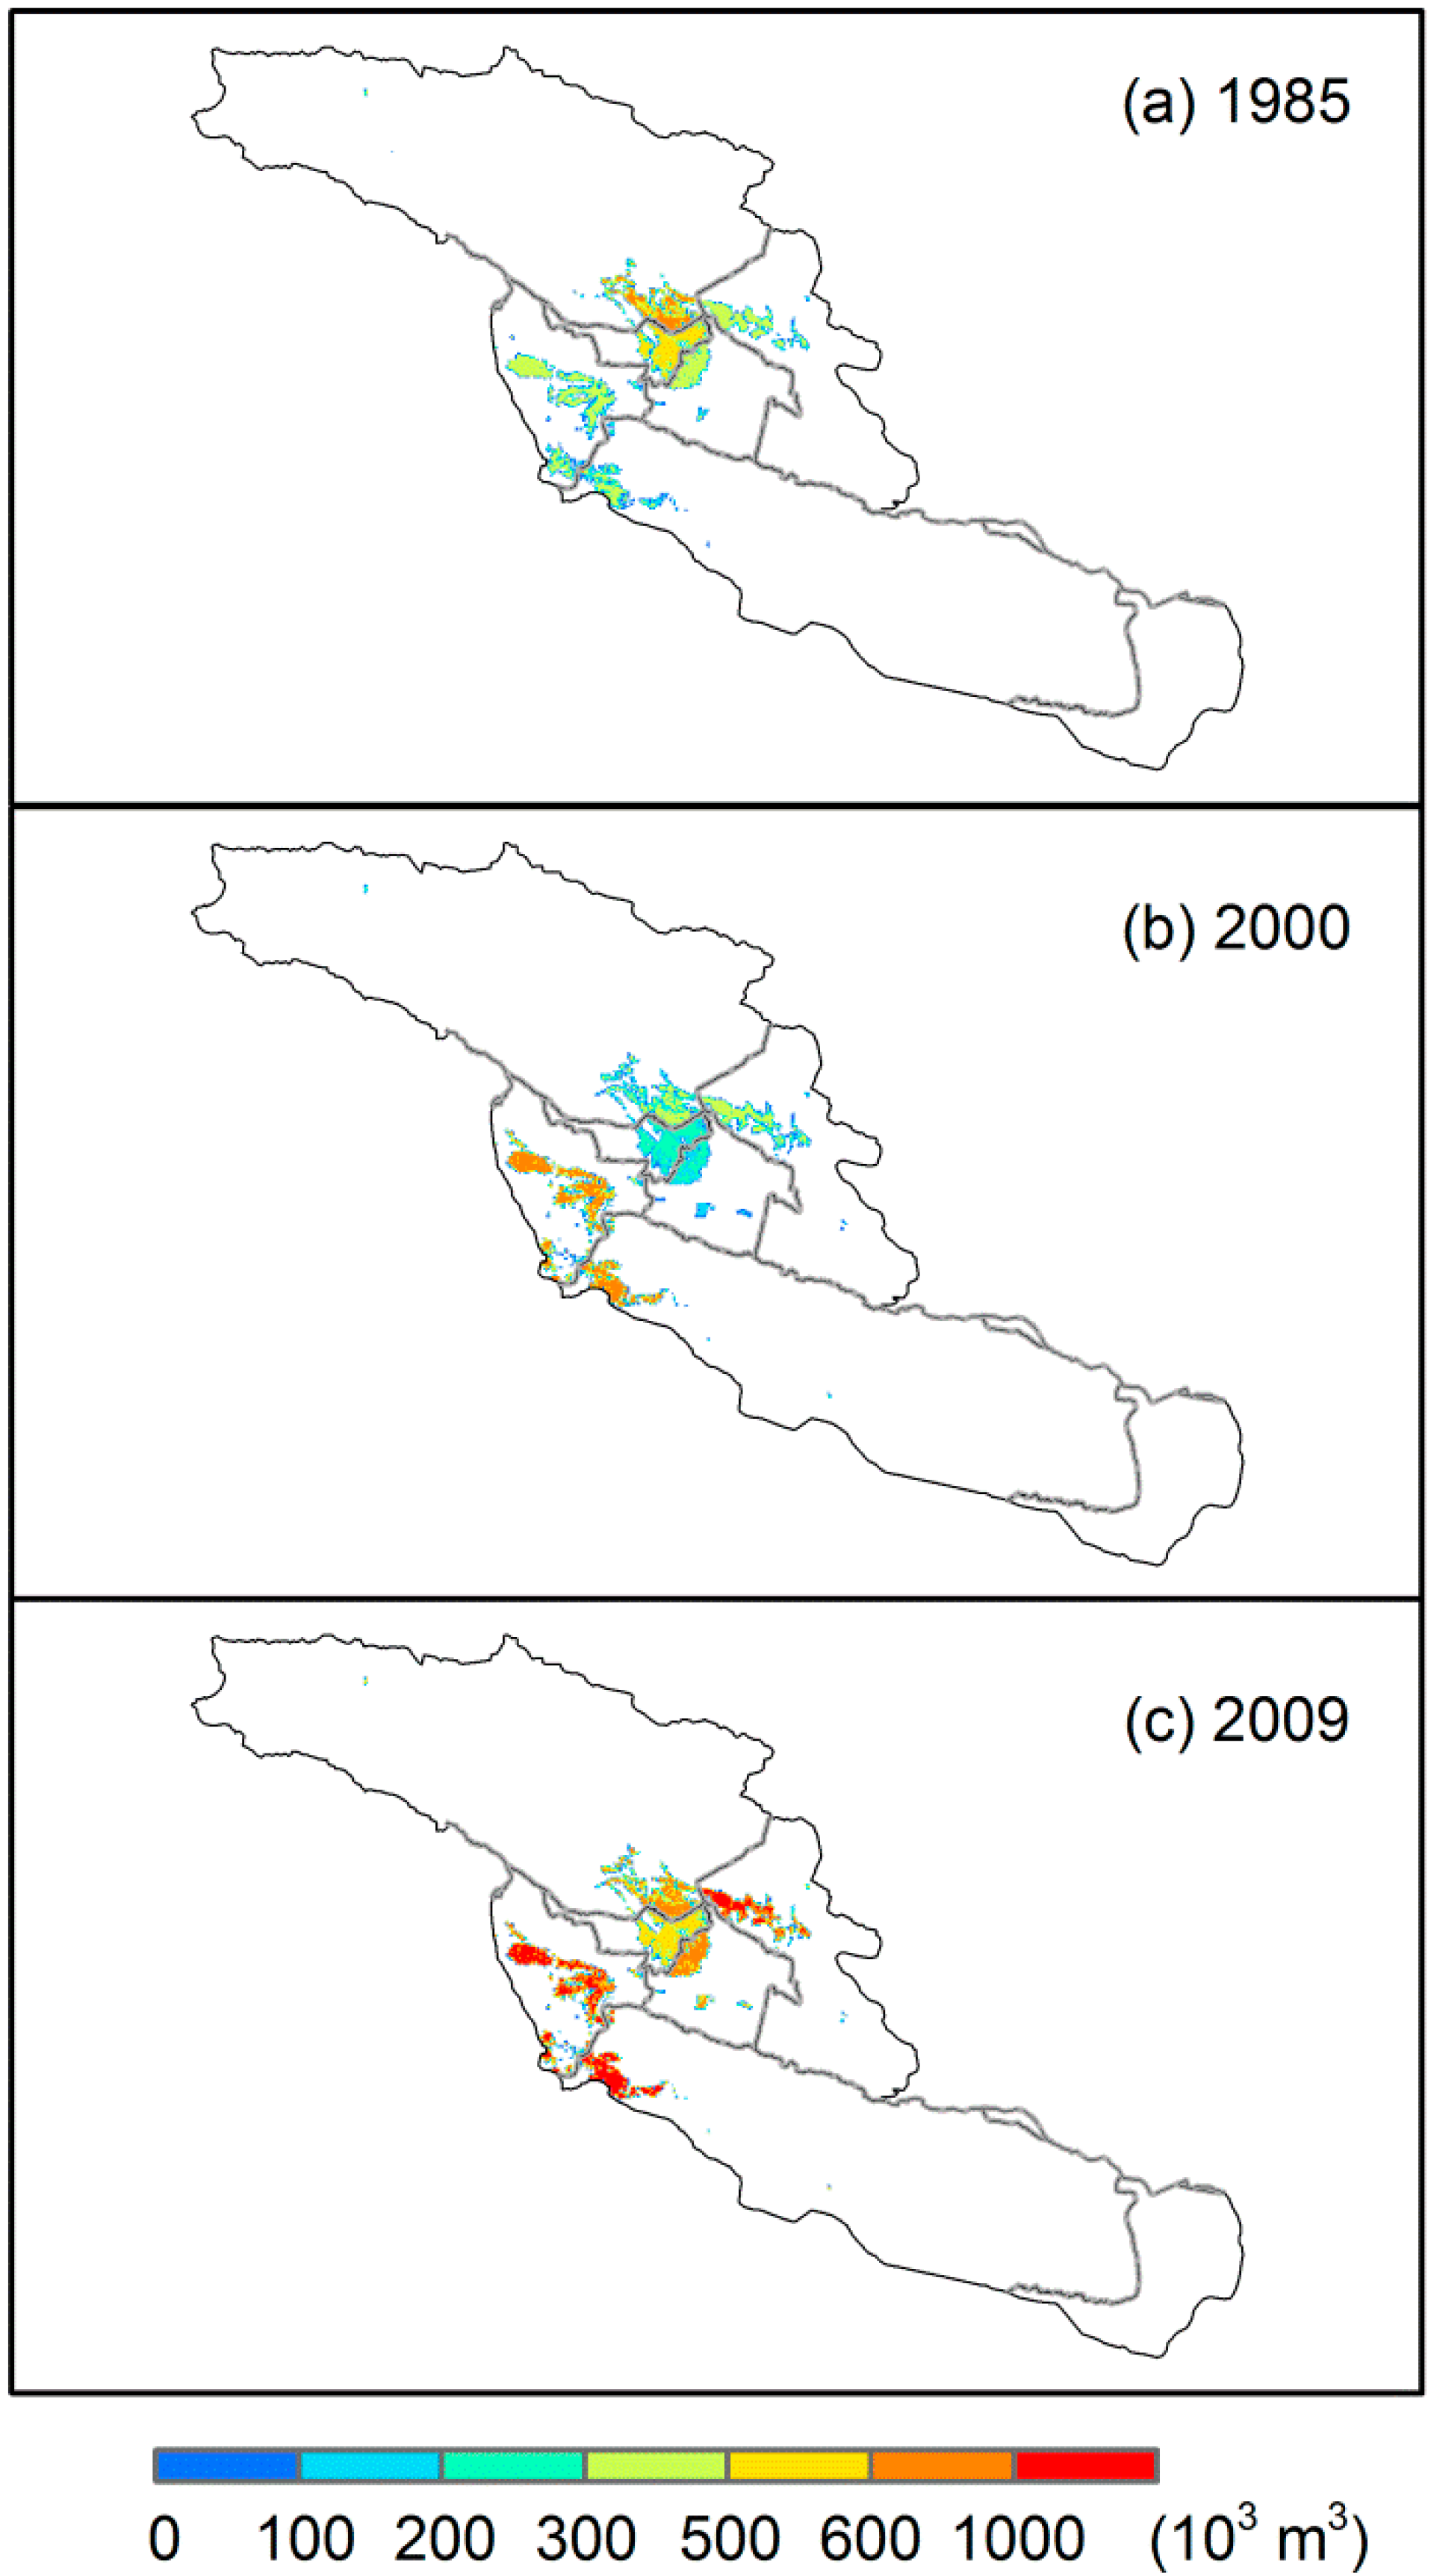
3.4. Spatial Distribution of Irrigation Water Demand

Figure 7 shows the spatial distribution of total irrigation water demands for major crops in the Kaidu-kongqi River Basin for the years 1985, 2000 and 2009. In 1985, the total annual irrigation water demands were relatively larger in Hejing and Yanqi County. The highest total annual irrigation water demand per grid cell (i.e., 8.50 × 10⁵ m3) was found in Yanqi County. In most of the other regions, the total annual irrigation water demand per grid cell was generally between 3.00 × 10⁵ and 5.00 × 10⁵ m3. Between the years 1985 and 2000, due to the adjustment of planting structure, the total irrigation water demand showed a substantial decreasing trend in most parts of the Yanqi Basin, but presented an obviously increasing trend in Korla City and Yuli County. In 2000, the highest total annual irrigation water demand per grid cell was found in Yuli County, amounting to 1.20 × 10⁶ m3. The total irrigation water demand per grid cell in most regions had increased rapidly between 2000 and 2009, especially in Korla City, Yuli and Heshuo County. The adjustment of planting structure and continuously expanding of cotton acreage in the river basin have led to a rapid increase in the total irrigation water demand. In 2009, the highest total annual irrigation water demand per grid cell (e.g., 1.00 × 10⁶ m3) was found in Korla City, Yuli and Heshuo County. The spatial distribution of total irrigation water demand in 2009 may be different from the actual total irrigation water demand per grid cell, due to the lack of land-cover data for the corresponding year. Despite this uncertainty, the modelled spatial total irrigation water demand can also provide a baseline for water resources planning and management in the river basin.
Figure 7. Spatial distribution of irrigation water demand in the Kaidu-kongqi River Basin during 1985–2009.
Sustainability 07 12958 g007

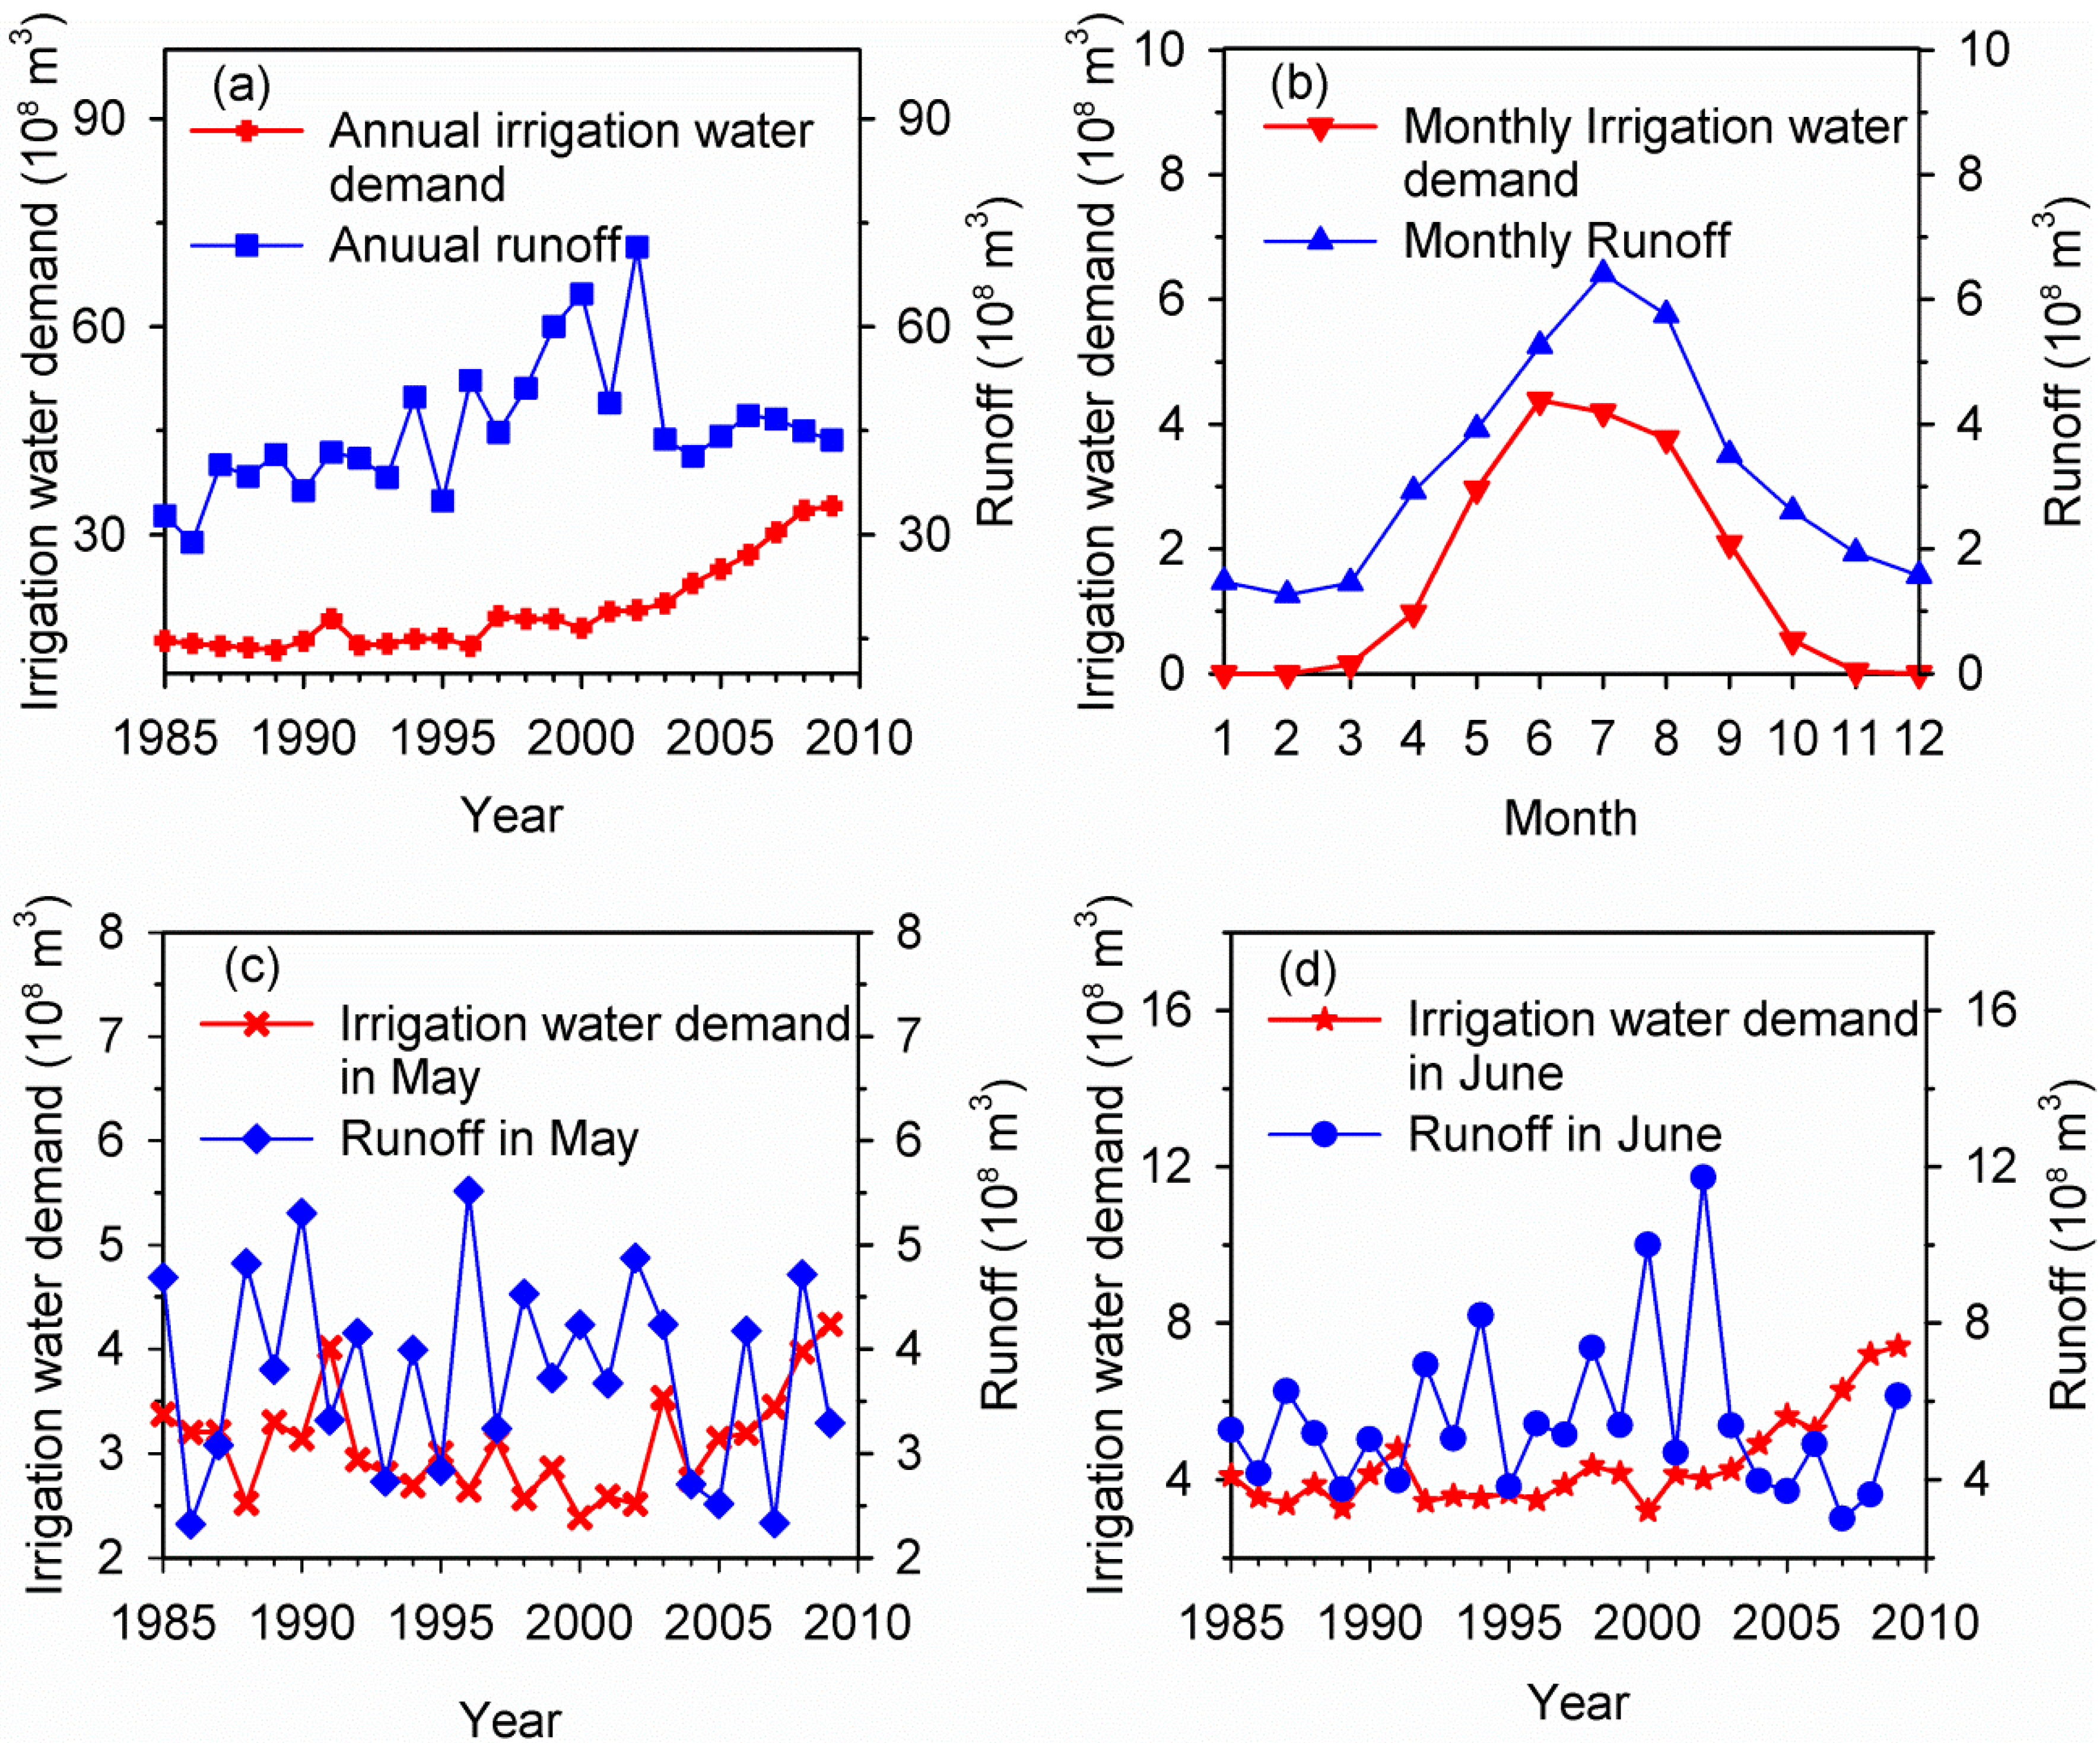
3.5. Risk Assessment of Irrigation Water Supply and Demand

The cultivated land mainly located in the oases in the Kaidu-kongqi River Basin. Due to the shortage of precipitation in the oases, more than 95% of cultivated land required irrigation [30]. Irrigation water sourced from river runoff, which mainly originated from snow/glacier melting and summer rainfall in mountain areas [31]. Climate change had large impact on the quantity of runoff in this basin [29,31]. The runoff of the Kaidu-kongqi River had an increasing trend during the past five decades due to the rising temperature and increasing precipitation in the mountain areas [29]. The variations of runoff will certainly influence the agricultural irrigation water demand.
To assess the irrigation water supply and demand risk in the Kaidu-kongqi River Basin, the irrigation water demand and river runoff (which was considered as the maximum water resources available to society) were compared at the annual and monthly scales (Figure 8a,b). It was found that the river runoff was much larger than the total irrigation water demand at both the annual and monthly scales in the Kaidu-kongqi River Basin. According to water scarcity index (the ratio of water use to water availability), the basin falled into the highly water stressed category when the water scarcity index was greater than 0.4 [31]. The average ratio of annual irrigation water demand to annual river runoff was 0.43 for the Kaidu-kongqi River Basin, indicating that severe water stress existed in this basin.
However, inconsistencies in seasonal variation between river runoff and irrigation water demand may cause some problems for irrigation in the basin. Generally, the river runoff reached the peak in July and August [29] and it was much larger than the irrigation water demand during this period. However, during May, when was the critical period for spring crops seedling such as spring wheat, corn, and cotton, water shortage would have a major impact on crop yields. In order to study the irrigation water supply and demand risk during the critical periods, long-term river runoff was also compared with irrigation water demand in May and June (Figure 8c,d). It was found that the river runoff was substantially larger than irrigation water demand in May and June during 1985–2003 except for some low flow years. However, with the increasing irrigation water demand and large variability of river runoff, the irrigation water demand could not be guaranteed in May and June during 2004–2009. Seasonal water scarcity has being existed in this hyper arid basin during this period. Therefore, the rational planning of crop planting structure and proper control of crop acreage should be implemented in the Kaidu-kongqi River Basin. In case of insufficient water, the cotton should be first guaranteed since it brings the highest benefit when water demand is satisfied [30]. Additionally, effective integrated optimization models should be developed for agricultural water resources planning and management, such as the two-stage interval-quadratic programming method developed by Huang et al. [30].
To cope with water scarcity, plans and policies for long-term use of water resources should be created in the Kaidu-kongqi River Basin. First, projections of future water availability and demand are urgent to be surveyed, evaluated and addressed as the basics to develop sound water allocation plans and integral strategies. The ecological water transfer project in the lower reaches of the Tarim River has had a positive effect on local agricultural development [32]. However, the water volume transferred from Bosten Lake to the lower reaches of the Tarim River should be strictly controlled when the lake level declines to 1045.10 m. Generally, global warming would increase crop water requirement in this basin. Consequently, policies making for water sustainability must take into full consideration the potential adverse impacts brought upon by global warming. Second, it is urgent to construct a water-saving society to improve water use efficiency. A rational water pricing system would be a good approach to strengthen people’s water-saving consciousness from economic view. Efforts should be made to popularize drip irrigation and other water-saving techniques. Finally, establishment of flexible ecological compensation mechanism in this region is available and feasible. For instance, water demand for food in the basin can be offset by importing food from water-rich provinces. Thus, water saved from agricultural use could be transferred into natural ecosystems. These measures outlined herein have the potential to alleviate water scarcity and realize sustainable development of environment, economy and society in the Kaidu-kongqi River Basin.
Figure 8. Comparison of river runoff and irrigation water demands (a) at annual scale; (b) at monthly scale; (c) in May and (d) in June in the Kaidu-kongqi River Basin during 1985–2009.
Sustainability 07 12958 g008

4. Conclusions

Based on the Penman-Monteith formula and crop coefficient approach, we estimated the spatial and temporal variations of irrigation water demand in combination with land-cover data and socio-economic statistical data for nine major crops in the Kaidu-kongqi River Basin during 1985–2009. The results demonstrated that the total irrigation water demand in the whole basin presented a considerable increasing trend during 1985–2009. The irrigation water demand in 2009 has amounted to 34.15 × 10⁸ m3, with a net increase of 20.00 × 10⁸ m3 compared with that in the year 1985. Among the nine major crops, cotton was the most water consuming crop in the Kaidu-kongqi River Basin. In 2009, the total water demand for cotton reached 15.84 × 10⁸ m3, accounting for 46.38% of the total irrigation water demand. Due to the differences in planting structure of crops, the monthly average irrigation water demands in Korla City and Yuli County amounted to the peak in July, while those in other regions reached the maximum in June. The regional water stress was also evaluated based on the total irrigation water demand and river runoff. The annual and average monthly water resources could meet the irrigation demand, but a huge deficit existed during the critical periods for crops in some lower flow years, such as in May and June during 2004–2009. It is urgent that the rational planning of crop planting structure and proper control of crop acreage should be implemented in this hyper arid basin.
Due to the lack of land-cover data in 2009, we distributed statistical data of crop acreage for the corresponding year according to land-cover data in 2000. Thus, the irrigation water demand may be underestimated or overestimated in this region. Despite this uncertainty, the results are helpful to assess the problem of water scarcity and to develop wise water management strategies in the Kaidu-kongqi River Basin.

Acknowledgments

This work was supported by Research Fund of State Key Laboratory of Desert and Oasis Ecology, Xinjiang Institute of Ecology and Geography, Chinese Academy of Sciences (G2015-02-04), SDUST Research Fund (2014RCJJ003, 2014TDJH101, 2014JQJH101), Joint Innovative Center for Safe and Effective Mining Technology and Equipment of Coal Resources, Shandong Province and Program for Innovative Research Team of College of Geodesy and Geomatics, SDUST (Remote Sensing Monitoring of Ecosystem and Environment in the High-intensity Disturbance Zone). The authors are grateful to anonymous reviewers for their constructive comments on the earlier version of this paper. Finally, we are also grateful to the editors and the editorial office for their kind assistance.

Author Contributions

Bin Guo carried out the calculations, result analyses and drafted the manuscript, which was revised by all authors. All authors gave their approval of the version submitted for publication.

Conflicts of Interest

The authors declare no conflict of interest.

References

  1. Chen, Y.N.; Li, Z.; Fan, Y.T.; Wang, H.J.; Fang, G.H. Research progress on the impact of climate change on water resources in the arid region of Northwest China. Acta Geogr. Sin. 2014, 69, 1295–1304. [Google Scholar]
  2. Li, W.H.; Chen, Z.S.; Li, B.F.; Fu, A.H.; Zhou, H.H. Analysis of water demand and stability for oasis in Kaidu-Kongque River Basin, Southern Xinjiang. J. Glaciol. Geocryol. 2012, 34, 1470–1477. [Google Scholar]
  3. Wang, C.J.; Zhang, X.L.; Du, H.R.; Wang, F. Comprehensive evaluation and analysis on the water resources carrying capacity levels in the Kaidu-Kongqi River Basin. J. Glaciol. Geocryol. 2012, 34, 990–998. [Google Scholar]
  4. Fu, Q.; Wang, Z.L.; Liang, C. Application of multi-variate auto-regression model to forecast water demand of well irrigated paddy. J. Hydraul. Eng. 2002, 33, 107–112. [Google Scholar]
  5. Zheng, Y.S.; Huang, J.S. Forecast of irrigation water use based on neural network. J. Irrig. Drain. 2004, 23, 59–61. [Google Scholar]
  6. Liu, X.R.; Shen, Y.J.; Guo, Y.; Li, S.; Guo, B. Modeling demand/supply of water resources in the arid region of northwestern China during the late 1980s to 2010. J. Geogr. Sci. 2015, 25, 573–591. [Google Scholar] [CrossRef]
  7. Shen, Y.J.; Li, S.; Chen, Y.N.; Qi, Y.Q.; Zhang, S.W. Estimation of regional irrigation water requirement and water supply risk in the arid region of Northwestern China 1989–2010. Agric. Water Manag. 2013, 128, 55–64. [Google Scholar] [CrossRef]
  8. Liu, X.Y.; Li, Y.Z.; Hao, W.P. Trend and causes of water requirement of main crops in North China in recent 50 years. Trans. Chin. Soc. Agric. Eng. 2005, 21, 155–159. [Google Scholar]
  9. Liu, Y.; Wang, L.; Ni, G.H.; Cong, Z.T. Spatial distribution characteristics of irrigation water requirement for main crops in China. Trans. Chin. Soc. Agric. Eng. 2009, 25, 6–12. [Google Scholar]
  10. Hobbins, M.T.; Ramírez, J.A.; Brown, T.C. The complementary relationship in estimation of regional evapotranspiration: An enhanced advection–aridity model. Water Resour. Res. 2001, 37, 1389–1403. [Google Scholar] [CrossRef]
  11. Liu, S.M.; Sun, R.; Sun, Z.P.; Li, X.W.; Liu, C.M. Comparison of different complementary relationship models for regional evapotranspiration estimation. Acta Geogr. Sin. 2004, 59, 331–340. [Google Scholar]
  12. Xu, C.Y.; Singh, V.P. Evaluation of three complementary relationship evapotranspiration models by water balance approach to estimate actual regional evapotranspiration in different climatic regions. J. Hydrol. 2005, 308, 105–121. [Google Scholar] [CrossRef]
  13. Zhou, M.C.; Ishidaira, H.; Takeuchi, K. Estimation of potential evapotranspiration over the Yellow River basin: Reference crop evaporation or Shuttleworth–Wallace? Hydrol. Process. 2007, 21, 1860–1874. [Google Scholar] [CrossRef]
  14. Abdelhadi, A.W.; Hata, T.; Tanakamaru, H.; Tada, A.; Tariq, M.A. Estimation of crop water requirements in arid region using Penman-Monteith equation with derived crop coefficients: A case study on Acala cotton in Sudan Gezira irrigated scheme. Agric. Water Manag. 2000, 45, 203–214. [Google Scholar] [CrossRef]
  15. Liu, S.M.; Sun, Z.P.; Li, X.W.; Liu, C.M. A comparative study on models for estimating evapotranspiration. J. Nat. Resour. 2003, 18, 161–167. [Google Scholar]
  16. Beyazgül, M.; Kayam, Y.; Engelsman, F. Estimation methods for crop water requirements in the Gediz Basin of western Turkey. J. Hydrol. 2000, 229, 19–26. [Google Scholar] [CrossRef]
  17. Smith, M. The application of climatic data for planning and management of sustainable rainfed and irrigated crop production. Agric. For. Meteorol. 2000, 103, 99–108. [Google Scholar] [CrossRef]
  18. Du, T.S.; Kang, S.Z.; Zhang, J.H.; Li, F.S.; Hu, X.T. Yield and physiological responses of cotton to partial root-zone irrigation in the oasis field of northwest China. Agric. Water Manag. 2006, 84, 41–52. [Google Scholar] [CrossRef]
  19. China Meteorological Data Sharing Service System. Available online: http://cdc.nmic.cn/home.do (accessed on 17 September 2015).
  20. Statistics Bureau of Bayinguoleng. Bayinguoleng Statistical Yearbook (1986–2010); Xinjiang Statistics Press: Urumqi, China, 1986–2010.
  21. Statistics Bureau of Xinjiang Production & Construction Group. Xinjiang Production & Construction Group Statistical Yearbook (1986–2010); China Statistics Press: Beijing, China, 1986–2010.
  22. Environmental and Ecological Science Data Centre for West China. Available online: http://westdc.westgis.ac.cn/ (accessed on 17 September 2015).
  23. Liu, Y.; Teixeira, J.L.; Zhang, H.J.; Pereira, L.S. Model validation and crop coefficients for irrigation scheduling in the North China Plain. Agric. Water Manag. 1998, 36, 233–246. [Google Scholar] [CrossRef]
  24. Allen, R.G.; Smith, M.; Pereira, L.S.; Perrier, A. An update for the calculation of reference evapotranspiration. Int. Comm. Irrig. Drain. Bull. 1994, 43, 35–92. [Google Scholar]
  25. Duan, A.W.; Sun, J.S.; Liu, Y.; Xiao, J.F.; Liu, Q.; Qi, X. Irrigation Quota of Major Crops for Northern China; China Agricultural Science and Technology Press: Beijing, China, 2004; p. 197. [Google Scholar]
  26. Xu, X.B.; Zhou, H.P.; Wang, Z.; Jiapaer, R.Z. Study on effective rainfall use efficiency in arid irrigation district. Water Sav. Irrig. 2010, 12, 44–50. [Google Scholar]
  27. Wu, X.C.; Zhou, H.P. Influence factor to water transport index in canal system in Xinjiang irrigation area. Yellow River 2011, 33, 93–97. [Google Scholar]
  28. Water Resources Department of Xinjiang Uygur Autonomous Region. Available online: http://www.xjslt.gov.cn/szygb/index.htm (accessed on 17 September 2015).
  29. Wang, Y.; Chen, Y.; Ding, J.; Fang, G. Land-use conversion and its attribution in the kaidu–kongqi river basin, China. Quatern. Int. 2015, 380–381, 216–223. [Google Scholar] [CrossRef]
  30. Huang, Y.; Li, Y.; Chen, X.; Ma, Y. Optimization of the irrigation water resources for agricultural sustainability in tarim river basin, China. Agric. Water Manag. 2012, 107, 74–85. [Google Scholar] [CrossRef]
  31. Shen, Y.J.; Chen, Y.N. Global perspective on hydrology, water balance, and water resources management in arid basins. Hydrol. Process. 2010, 24, 129–135. [Google Scholar] [CrossRef]
  32. Xu, H.; Ye, M.; Li, J. The water transfer effects on agricultural development in the lower tarim river, xinjiang of china. Agric. Water Manag. 2008, 95, 59–68. [Google Scholar] [CrossRef]

