Article

Predicting Public Bicycle Adoption Using the Technology Acceptance Model

by
Benjamin T. Hazen
1,2,
Robert E. Overstreet
2 and
Yacan Wang
3,*
1
Department of Marketing and Supply Chain Management, University of Tennessee, Knoxville, TN 37996, USA
2
Department of Operational Sciences, Air Force Institute of Technology, Wright-Patterson AFB, OH 45433-7765, USA
3
Department of Economics, Beijing Jiaotong University, Beijing 100044, China
*
Author to whom correspondence should be addressed.
Sustainability 2015, 7(11), 14558-14573; https://0-doi-org.brum.beds.ac.uk/10.3390/su71114558
Submission received: 8 September 2015 / Revised: 23 October 2015 / Accepted: 26 October 2015 / Published: 30 October 2015
(This article belongs to the Special Issue Green Logistics)

Abstract

:
Bicycle sharing programs provide a sustainable mode of urban transportation. Although cities across the globe have developed these systems for their citizens and visitors, usage rates are not as high as anticipated. This research uses the technology acceptance model as the basis to understand one’s intention to adopt bicycle sharing programs. Using survey data derived from 421 participants in Beijing, China, the proposed covariance-based structural equation model consisting of perceived quality, perceived convenience, and perceived value is found to predict 50.5% of the variance in adoption intention. The findings of this research contribute to theory and practice in the burgeoning literature on public bicycle systems and sustainable urban transportation by offering a theoretical lens through which to consider system adoption, and providing information to practitioners as to what factors might contribute most to adoption.

1. Introduction

As the world’s population continues to expand and urban city centers become denser, the need for intra-city transportation is increasing. In addition, problems with smog and other pollutants are driving the desire for transportation solutions to be environmentally sustainable. At the intersection of these two problems lies the re-emergence of bicycling as a viable mode of personal urban transportation. To this end, many cities across the globe offer public bicycle sharing programs for residents and tourists to utilize [1,2]. Research to date in this area has been instrumental in describing program implementation and identifying potential barriers to, and facilitators of adoption [3,4,5]. Unfortunately, public bicycle programs have still not been widely adopted in many cities [6]. As such, there is a need for more empirical research regarding acceptance and use of public bicycle sharing programs. This research helps to fill this gap by using theory from the technology management domain to help explain intention to adopt public bicycles as a sustainable and readily available mode of urban transportation.
Bicycle riding has existed as a hobby and mode of transportation since the late 19th century [7]. However, viable city-wide bicycle sharing systems have only emerged over the last decade. These bicycle sharing systems consist of a seemingly complex network of stations, and the usage rules and fees associated with using these bicycles are a source of ambiguity for potential adopters, in part because different rates apply to different customers. In addition, these systems are supported largely by information technologies that allow users to register for the system and pay for service. Considering bicycle sharing systems as a technology, this research uses Davis’ [8] technology acceptance model (TAM) as a theoretical foundation to examine adoption of public bicycle sharing systems.
The remainder of this article is structured as follows. In the next section, we provide background information regarding bicycle sharing literature as well as the research context. Then, we explain the theoretical foundation of the research, and present the conceptual model and hypotheses. Then, we describe the data collection and analysis approach. Next, the results are presented, which leads to a discussion of the findings and contributions for research and practice. The article closes with a brief discussion of limitations, future research, and some closing remarks.

2. Background

A review of the bicycle sharing literature reveals two primary research streams. In one stream, research is centered upon operational issues such as development models, network design, and vehicle scheduling from the program facilitator’s point of view [9,10,11]. However, considering that the success of any bicycle sharing system is dependent upon consumer utilization [12], another stream of research is focused upon consumer usage.
Case studies and other qualitative methods are used in a preponderance of the consumer usage literature to date. For instance, Fuller et al. examined health-related outcomes associated with residential exposure to the public bicycle sharing program implemented in Montreal [13,14]. Bechand-Marleau, Lee and EI-Geneidy examined existing users of a bicycle sharing system in Montreal to identify characteristics influencing their frequency of use [15]. In related research, Sherwood and Murphy document the process for expanding San Antonio’s urban municipal bicycle sharing program to find key determinants of success [16], and Lathia, Ahmed and Capra study the effect of changing the user-access policy in London [17]. These studies have been important for establishing the contextual domain of bicycle sharing literature, and identifying variables that might be of general importance. At this juncture, we posit that a more quantitative, theory-based approach to testing these variables is needed in order to move forward in this area. Therein lies the contribution of this research to this stream of literature. Specifically, we examine a public bicycle sharing system in Beijing, China, which is currently seeing less than desired usage.
Sometimes referred to as the “kingdom of bicycle”, China was considered by many as the leading country globally in terms of both the ownership and usage of bicycles as a major transportation means in the 1980s. However, recently China has witnessed a sharp decline in bicycle use. For example, the ratio of cycling transport to all urban transport for Beijing commuters has dropped at a rate of 2% annually, from 30.3% in 2005 to 17.8% in 2014 [18,19]. Starting from 2009, major programs have been launched by the Beijing municipal government to develop public bicycling as an important component of the public transport system. For example, based on a plan released by the Beijing government in 2009, the target usage of bicycles in Beijing needs to reach 23% by the end of 2015 [20]. In 2011, the Beijing municipal government started a pilot bicycle sharing program to encourage more people to use public bicycles [21]. By the end of 2013, 25,000 public bicycles located in 600 different stations distributed throughout the six regions of the city were in operation. It is predicted that by the end of 2015, more than 50,000 public bicycles will be in operation, covering each main district and county [22,23].
While diffusion of bicycle sharing is anticipated, actual usage rates have remained lower than expected [23]. The bicycle sharing system in Beijing is guided by the municipal government, which provides seed money. However, private enterprises own and operate the bicycles and stations. Because of the low turnover of bicycles, major operators are at an economic loss and have trouble maintaining service without subsidies from the government. Therefore, there are many stakeholders that are in need of understanding how to encourage adoption and use of this system. This research takes an initial step toward informing business and government leaders how to promote adoption.

3. Conceptual Development and Hypotheses

The TAM is based upon several well-established theories and literature streams that seek to predict human intentions. These theories include the theory of reasoned action [24] the theory of planned behavior [25], self-efficacy theory [26], innovation diffusion theory [27], and others. As an assimilation and extension of the aforementioned theories, the original TAM suggests that perceived usefulness and perceived ease of use play key roles in explaining the variance in a user’s intentions to adopt new information systems technology [8]. Since that time, TAM has been recognized as a powerful theory in its own right and subsequently modified and extended to help explain adoption of a variety of other technological phenomenon [28,29,30,31].
Notably, TAM has been modified and extended since Davis’ initial conceptualization. Significant extensions include the unified theory of acceptance and use of technology (UTAUT) [32] UTAUT 2 [33], TAM 2 [28] and TAM 3 [29]. Through each of these extensions, a variety of additional explanatory variables have been introduced, and research suggests the contextual relevance of these variables in consideration of the given focal population for adoption, and the technological artifact under investigation. Herein, we use TAM as a theoretical foundation, and extend the original model via the introduction of an additional factor (perceived value), in order to examine adoption of public bicycle sharing systems.
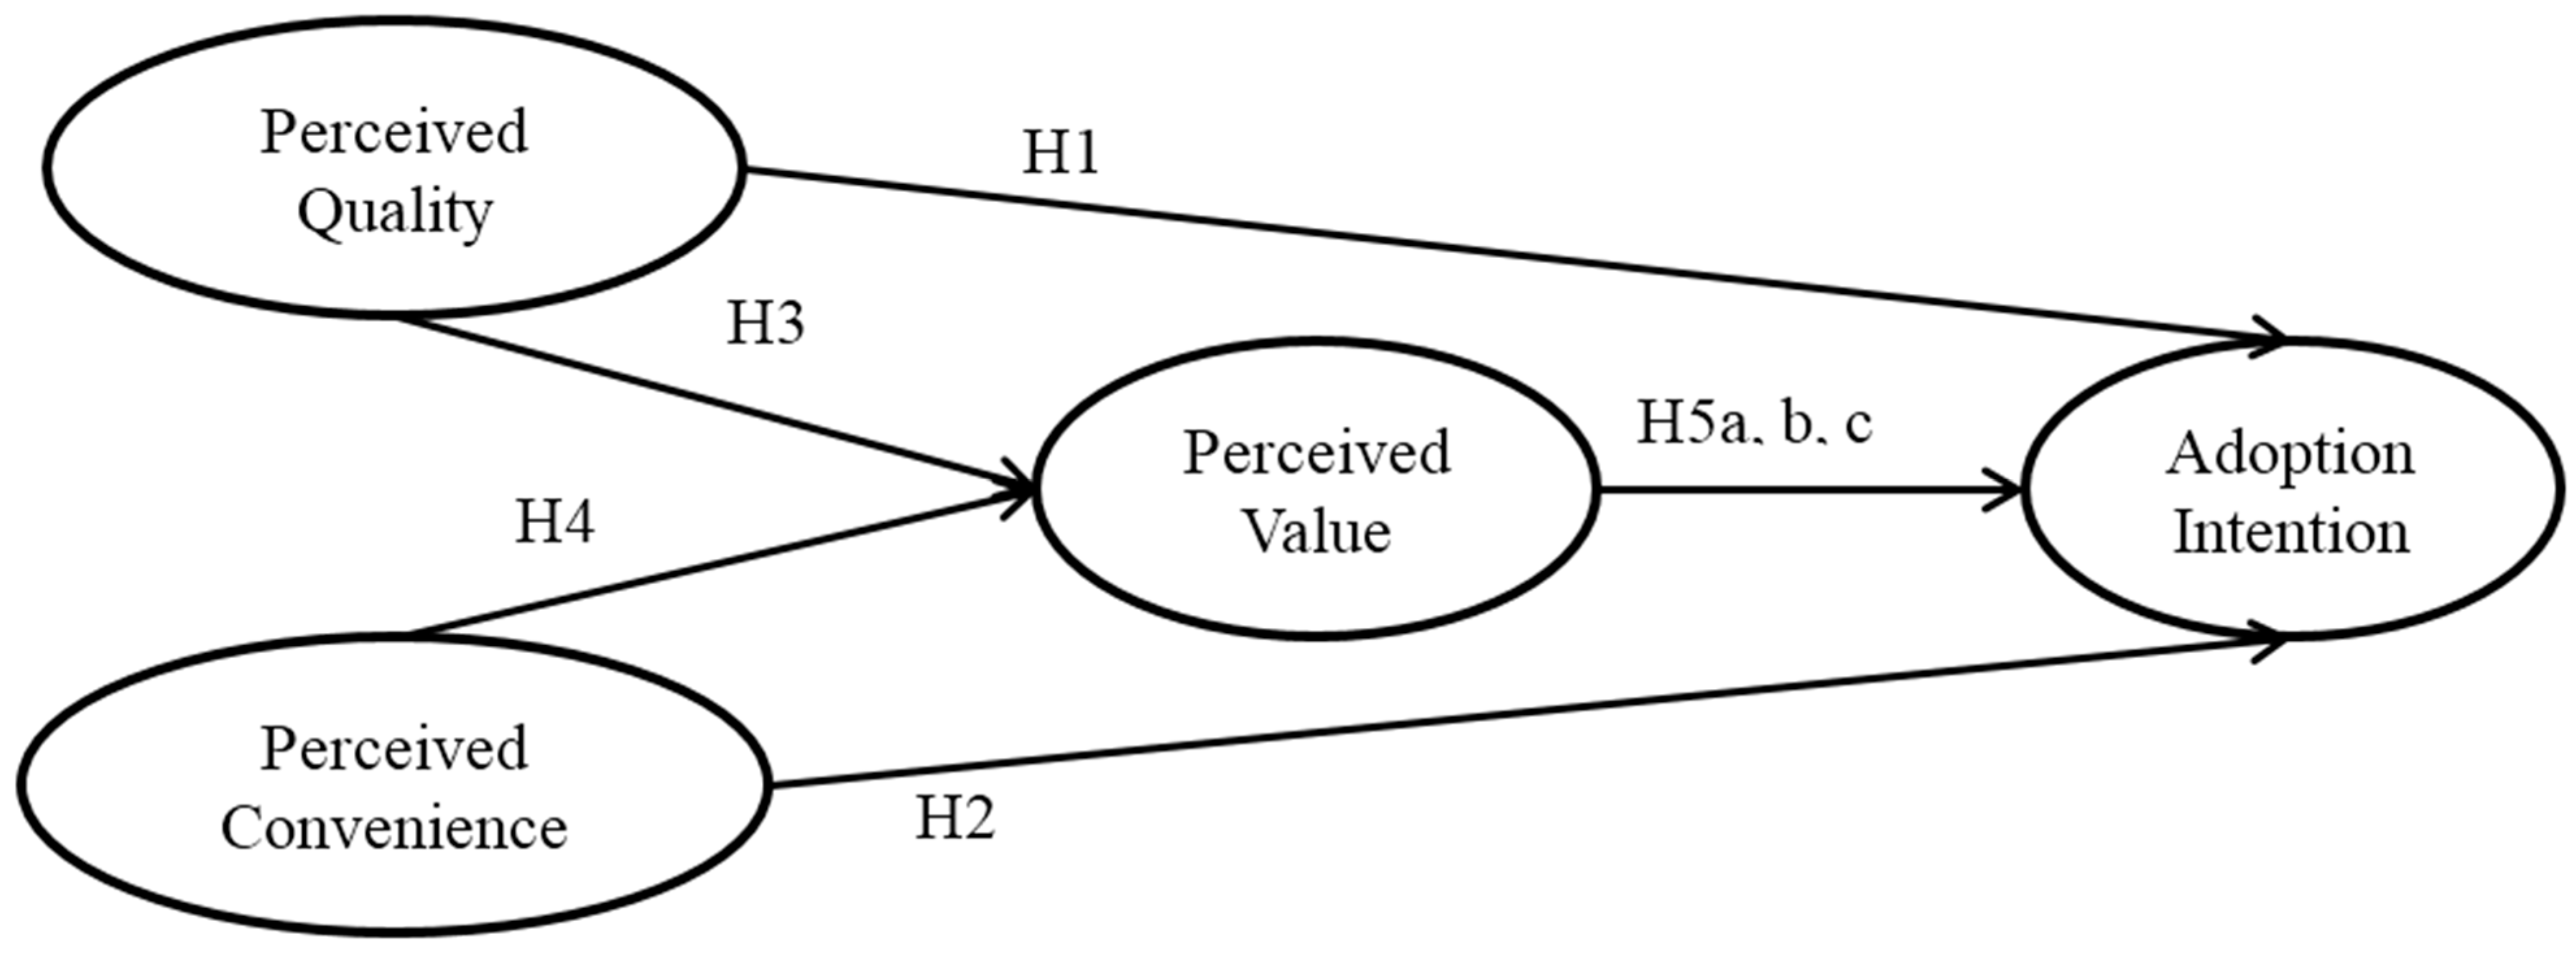
We contextualize the TAM variables in this research. In many TAM extensions, a quality construct has been noted as a primary component of perceived usefulness. Considering the focal context of this research (bicycle sharing programs), we suggest that perceived quality is especially relevant. Therefore, perceived usefulness is contextualized in this research as perceived quality. Additionally, perceived ease of use is contextualized as perceived convenience. Finally, perceived value is included as an important mediating variable. As discussed below in the development of our hypotheses, these three constructs are used to explain the variance in user intention to adopt public bicycle sharing systems. The hypothesized model is specified below as Figure 1. Kline [34] states that specification is the most important step in structural equation modeling, and suggests that alternate models should be considered if supported by theory and findings. Herein, the specified model is one possible modification to the TAM.
Figure 1. Conceptual model.
Sustainability 07 14558 g001

3.1. TAM Relationships

Perceived usefulness is described in the literature as the degree to which an individual believes that using a particular system will enhance performance [8,35]. The relationship between perceived usefulness and adoption intention has been demonstrated across a wide degree of research [36]. Herein, we contextualize the perceived usefulness construct as “perceived quality”, which we define as one’s judgment about the superiority or excellence of a product or service [37]. In the context of public bicycle sharing systems, quality represents the usefulness of the system as a viable transportation option. As such, it follows that:
H1: Perceived quality will be positively associated with public bicycle sharing systems adoption intention.
Perceived ease of use is defined as the degree to which a person believes that using a particular system would be effortless [8]. Again, as a key relationship espoused by TAM, the relationship between perceived ease of use and adoption intention has been shown to be significant across several studies, examining myriad artifacts [36]. In this study, we examine a “perceived convenience” construct, which we define as one’s judgment of the time and effort required to use a service [38]. As representative of perceived ease of use, it follows that perceived convenience will have a significant impact on adoption intention.
H2: Perceived convenience will be positively associated with public bicycle sharing systems adoption intention.

3.2. The Role of Perceived Value

Perceived value is hypothesized to play a significant intervening role in our research model. Perceived value can be defined as one’s overall assessment of the utility of a product or service based on his or her assessed comparison of the trade-off between perceived benefits (utility) and perceived sacrifices (typically, cost considerations) [37]. To begin, extant literature suggests that perceived quality has a strong positive effect on perceived value [39,40], which has been demonstrated in empirical research [39,41]. We have no reason to doubt that this direct relationship will remain significant within the context of this study, and therefore propose:
H3: Perceived quality will be positively associated with perceived value.
Research on urban transportation consistently rates measures of convenience as being significant antecedents to transportation mode usage [1,2,42]. What is not as clear is how perceived convenience affects one’s value considerations with respect to these transportation modes. However, it follows that convenience adds to the utility realized via acquiring a given product or service, and research on consumer-perceived value generally supports this notion [43]. Herein, we suggest that the degree to which one finds public bicycle sharing systems easy to use (convenient) will be related to one’s perceived value of the system.
H4: Perceived convenience will be positively associated with perceived value.
Perceived value is arguably the most significant predictor of consumer intentions in that consumers will invariably choose the option that will provide them with the highest level of perceived value [37,41]. This relationship between perceived value and consumer purchase or adoption intention has been shown to be significant across a variety of settings examining a variety of technological phenomena [44,45,46]. Thus, it follows that this relationship will hold in this research setting.
H5a: Perceived value will be positively associated with public bicycle sharing systems adoption intention.
The direct relationships hypothesized above regarding perceived value are rather consistent with theory and literature on technology acceptance, especially given the rich history of research on consumer value considerations and consumer intentions. Thus, it is the mediating role that perceived value plays in the hypothesized model that is of key interest in this study. Indeed, TAM and its many variants have been operationalized across several decades of research. However, the constructs of perceived usefulness and ease of use fail to fully capture the value proposition that a technological system has to offer a consumer. Therefore, thus study contributes to this line of research by examining whether or not:
H5b: Perceived value partially mediates the relationship between perceived quality and public bicycle sharing systems adoption intention.
H5c: Perceived value partially mediates the relationship between perceived convenience and public bicycle sharing systems adoption intention.

4. Method

4.1. Measures

To collect data, a survey method was employed. Existing scales and literature were used as the basis to measure the constructs in the hypothesized model. The measure for adoption intention was based on measures employed by Turel et al. [47], and the measure for perceived value was based on the research of Sweeney and Soutar [48]. Items for perceived quality were based on measures employed by Hazen et al. [49]. Items to measure the perceived convenience were based on research by Shaheen et al. [2], Zhang et al. [3], and Eboli and Mazzula [42]. All items were measured on a 7-point, Likert-type scale ranging from “strongly disagree” to “strongly agree” and can be found in the Appendix (Table A1). The questionnaire contained not just the aforementioned items, but also a brief introduction to the research. It also captured basic demographic information regarding gender, age, income, education level, and area (rural, urban, suburban) to use as controls and to better understand the sample frame.

4.2. Participants

The target population for this study consists of commuters in need of short-distance urban transportation. The sample frame for this study consists of residents of Beijing, China who use various modes of public and private transportation to traverse the city. We used two survey distribution techniques: web-based and face-to-face solicitation. We used SOJUMP (http://www.sojump.com) to solicit 109 potential participants, of which 101 usable surveys were returned (92.7% response rate). We also canvassed areas of the city where residents typically frequent when attempting to satisfy transportation needs (subway stations, taxi and bus stops, bicycle paths, and public bicycle rental stations) and solicited participants face-to-face. Notably, it was not required that participants had previously used bicycle sharing programs to participate. Of the 355 individuals invited to participate face to face, 320 usable surveys were returned (90.1% response rate). The total sample size for this study is 421. Participant demographics can be found in Table 1. Although the education and income levels noted in the sample are not necessarily representative of the Beijing population, we posit that the sample is representative of those that would consider using bicycle sharing programs. Indeed, research on bicycle sharing programs consistently finds that the demographics of those who use or intend to use shared bicycles often differ from the general population [50,51,52]. For instance, a recent study found that the users of the bicycle sharing program in Washington, DC differed from the general population of the city in terms of having significantly higher employment rates and education levels, and a lower average age [53].
Table 1. Participant descriptive statistics.
Demographic CharacteristicFrequencyPercentage
GenderFemale21551.07%
Male20648.93%
Age18–2525761.05%
26–3511727.79%
36–45245.70%
46–55122.85%
56–6561.43%
66+51.19%
Income (Yuen)<50,00012830.40%
50,000–100,00015436.58%
100,001–200,00010725.42%
200,001–500,000266.18%
>500,00061.43%
EducationHigh school4610.93%
Bachelor’s degree29770.55%
Master’s degree7016.63%
Doctor’s degree81.90%
AreaUrban38190.50%
Suburban286.65%
Rural122.85%

5. Analysis and Results

5.1. Preliminary Analysis

Prior to factor analysis, we screened for missing data and ensured as a minimum that the data passed the Kaiser-Meyer-Olkin Measure of Sampling Adequacy (KMO) and Bartlett’s Test of Sphericity. Surveys with missing data were not used in the analysis; KMO was 0.89 and Bartlett’s Test was significant at p < 0.001 indicating that the data was suitable for analysis in SEM [34].
The four constructs that we used in this research are conceptually related so we performed confirmatory factor analysis prior to testing the hypotheses. We used principle axis factoring for factor extraction with direct oblimin rotation, which provided the results shown in Table 2. All 14 indicators significantly loaded only onto their intended factor with loadings >0.5, signifying convergent validity [54]. Next, we tested for discriminate validity by combining the perceived convenience and perceived quality constructs into one and comparing the χ2 with that of the original model. The original χ2 of 206.346 was significantly smaller compared with 626.823 in the alternate model and provides evidence of discriminate validity [55].
To assess the degree to which common method bias might influence the study results, we performed Harman’s one-factor test by including all indicators in a principal components factor analysis. Evidence for common method bias exists if either a single factor emerges, or if one general factor accounts for the majority of the covariance among the items [56]. Our results show that neither case exists; the largest factor accounts for 43% of the variance; variance is distributed among all study constructs. Second, we examined correlations between our study constructs. Our correlation matrix (see Table 3) does not indicate any factors that are highly correlated (r > 0.95) [34]. Together, these assessments indicate that common method bias is not a significant threat to the validity of the results.
Table 2. Item descriptives. Note: All z-values are significant at p < 0.001.
ItemsMeanSDStandardized Loadingz-Value
Adoption Intention 14.502.0000.775-
Adoption Intention 25.161.7970.83513.363
Perceived Quality 14.411.7110.533-
Perceived Quality 24.161.5990.88110.197
Perceived Quality 33.971.5530.79710.390
Perceived Convenience 15.821.4600.756-
Perceived Convenience 25.811.5430.78919.576
Perceived Convenience 35.891.4710.78816.451
Perceived Convenience 45.691.4860.77816.158
Perceived Convenience 55.861.4420.84417.673
Perceived Convenience 65.811.5290.69414.214
Perceived Convenience 75.811.4720.78916.427
Perceived Value 15.071.6550.705-
Perceived Value 25.401.6160.85911.755
Table 3. Factor correlation matrix. Notes: Diagonal represents square root of the average variance extracted (AVE) in bold, correlations are in the off-diagonal, all correlations are significant at p < 0.01.
FactorMeanSDCA1234
1. Perceived Convenience5.811.220.9170.780
2. Perceived Quality4.181.340.7660.2060.752
3. Adoption Intention4.831.730.7890.4970.3470.812
4. Perceived Value5.241.470.7540.4960.3350.4920.786
The four latent constructs have evidence of construct reliability (Cronbach’s alpha > 0.70), convergent validity, and discriminate validity as presented in the correlation matrix in Table 3. The square root of each factor’s average variance extracted is larger than their correlations.
Using the power analysis tool provided by Preacher and Coffman [57] to estimate power for the final model indicated acceptable power levels. Given N = 421, dfM = 70, and assuming α = 0.05, ε0 ≤ 0.05, and ε1 = 0.08 resulted in a close fit test power of 0.998. Changing ε0 ≥ 0.05 to ε1 = 0.01 to test not-close fit resulted in a power estimate of 0.997.

5.2. Model Fit

After evaluating the measurement model, we developed the structural model using covariance-based structural equation modeling (SEM) in Amos 23. We used the fit indices found in Table 4 to assess how well the sample data fit our model. The χ2 fit test for exact fit rejected the hypothesis that the model and data fit. This is not surprising as this test has some limitations assessing the fit with large sample sizes [34]. Other fit indices used to measure approximate fit (see Table 4) provide evidence that the hypothesized model fits the data reasonably well [34].
Table 4. Goodness-of-fit measures.
Fit IndicesRecommended ValueResult Value
χ2p > 0.05206.346 (p < 0.001)
d.f.-119
Normed χ2≤3.01.734
GFI = ≥0.90.948
CFI = ≥0.90.972
SRMR = ≤0.10.055
RMSEA = ≤0.080.042 [0.032, 0.051]

5.3. Findings

Analysis of the SEM output (Figure 2) shows that all hypothesized path coefficients are positive, with z-values that are significant, p < 0.001. Our data supports all hypotheses tested. Hypothesis 1 stated that perceived quality will be positively associated with public bicycle sharing systems adoption intention. Our results supported Hypothesis 1 (γ = 0.352, z = 3.681, p < 0.001). Hypothesis 2 stated that perceived convenience will be positively associated with public bicycle sharing systems adoption intention. Our results also supported Hypothesis 2 (γ = 0.558, z = 5.790, p < 0.001). Hypothesis 3 stated that perceived quality will be positively associated with perceived value. Our results supported Hypothesis 3 (γ = 0.353, z = 4.786, p < 0.001). Hypothesis 4 stated that perceived convenience will be positively associated with perceived value. Our results support Hypothesis 4 (γ = 0.594, z = 8.706, p < 0.001). Hypothesis 5a stated that perceived value will be positively associated with public bicycle sharing systems adoption intention. Our results supported Hypothesis 5a (β = 0.347, z = 3.466, p < 0.001).
Following the example of Saldanha et al. [58], the mediation hypotheses were evaluated using the bootstrap test of the indirect effect as suggested by Zhao et al. [59], who suggest that a significant indirect effect is all that is needed to establish mediation. Five thousand re-samples with replacement using Shrout and Bolger’s [60] bias-corrected bootstrap method in Amos 23 (Table 5) were used to determine the product of the mediation pathways with a 95% confidence interval. Support was found for Hypothesis 5b (β = 0.123 [0.034, 0.289], p = 0.003), which stated that perceived value mediates the relationship between perceived quality and public bicycle sharing systems adoption intention. Additionally, support was found for Hypothesis 5c (β = 0.206 [0.069, 0.408], p = 0.004), which stated that perceived value partially mediates the relationship between perceived convenience and public bicycle sharing systems adoption intention.
Responses to four demographic questions were used as control variables. Of gender, age, income, and education, only age revealed a significant relationship with adoption intention. The significant positive relationship between age and adoption intention indicates that older participants had a higher adoption intention than did the younger participants. Area was not considered as a control variable because more than 90% of the respondents identified as urban.
Figure 2. Model results.
Sustainability 07 14558 g002
Table 5. Structural model results. Note: Indirect effects were estimated using a bias-corrected bootstrap method (k = 5000).
EffectS.E.C.R.p-Value0.95 LCL0.95 UCL
AI ← PQ0.3520.0963.681<0.001--
AI ← PC0.5580.0965.790<0.001--
PV ← PQ0.3530.0744.786<0.001--
PV ← PC0.5940.0688.706<0.001--
AI ← PV0.3470.1003.466<0.001--
AI ← PV ← PQ0.1230.066-0.0030.0340.289
AI ← PV ← PC0.2060.087-0.0040.0690.408

6. Discussion and Conclusions

This study explored factors that affect one’s intention to adopt public bicycle sharing systems. To accomplish this, we adapted and extended the TAM to include the additional construct of perceived value. The direct relationships between perceived quality, perceived convenience, and perceived value are all significant and positive with adoption intention. The indirect relationships indicate that value plays an important role in the acceptance of public bicycle sharing systems by potential users. If program operators decide to raise costs to improve the system or make a larger profit, that may lower the users’ perceived value and intent to use the public bicycle sharing system. Likewise, if the perceived quality or convenience of the program increases, they may also find the program to be of greater value. Conversely, if their perception of one of these constructs decreases, than they are less likely to use the system. These findings provide theoretical and practical contributions to the burgeoning bicycle sharing research stream.

6.1. Theoretical Implications and Future Research

Using the data collected, we were able to show support for this extended model that was developed based on the current literature on public bicycle sharing systems [5,15]. This study contributes to the theory behind the TAM by replicating and extending the model to include an additional construct (perceived value) while using it to examine data in a new context. This study shows that this model can be used outside of the information systems and technology field with reasonable results.
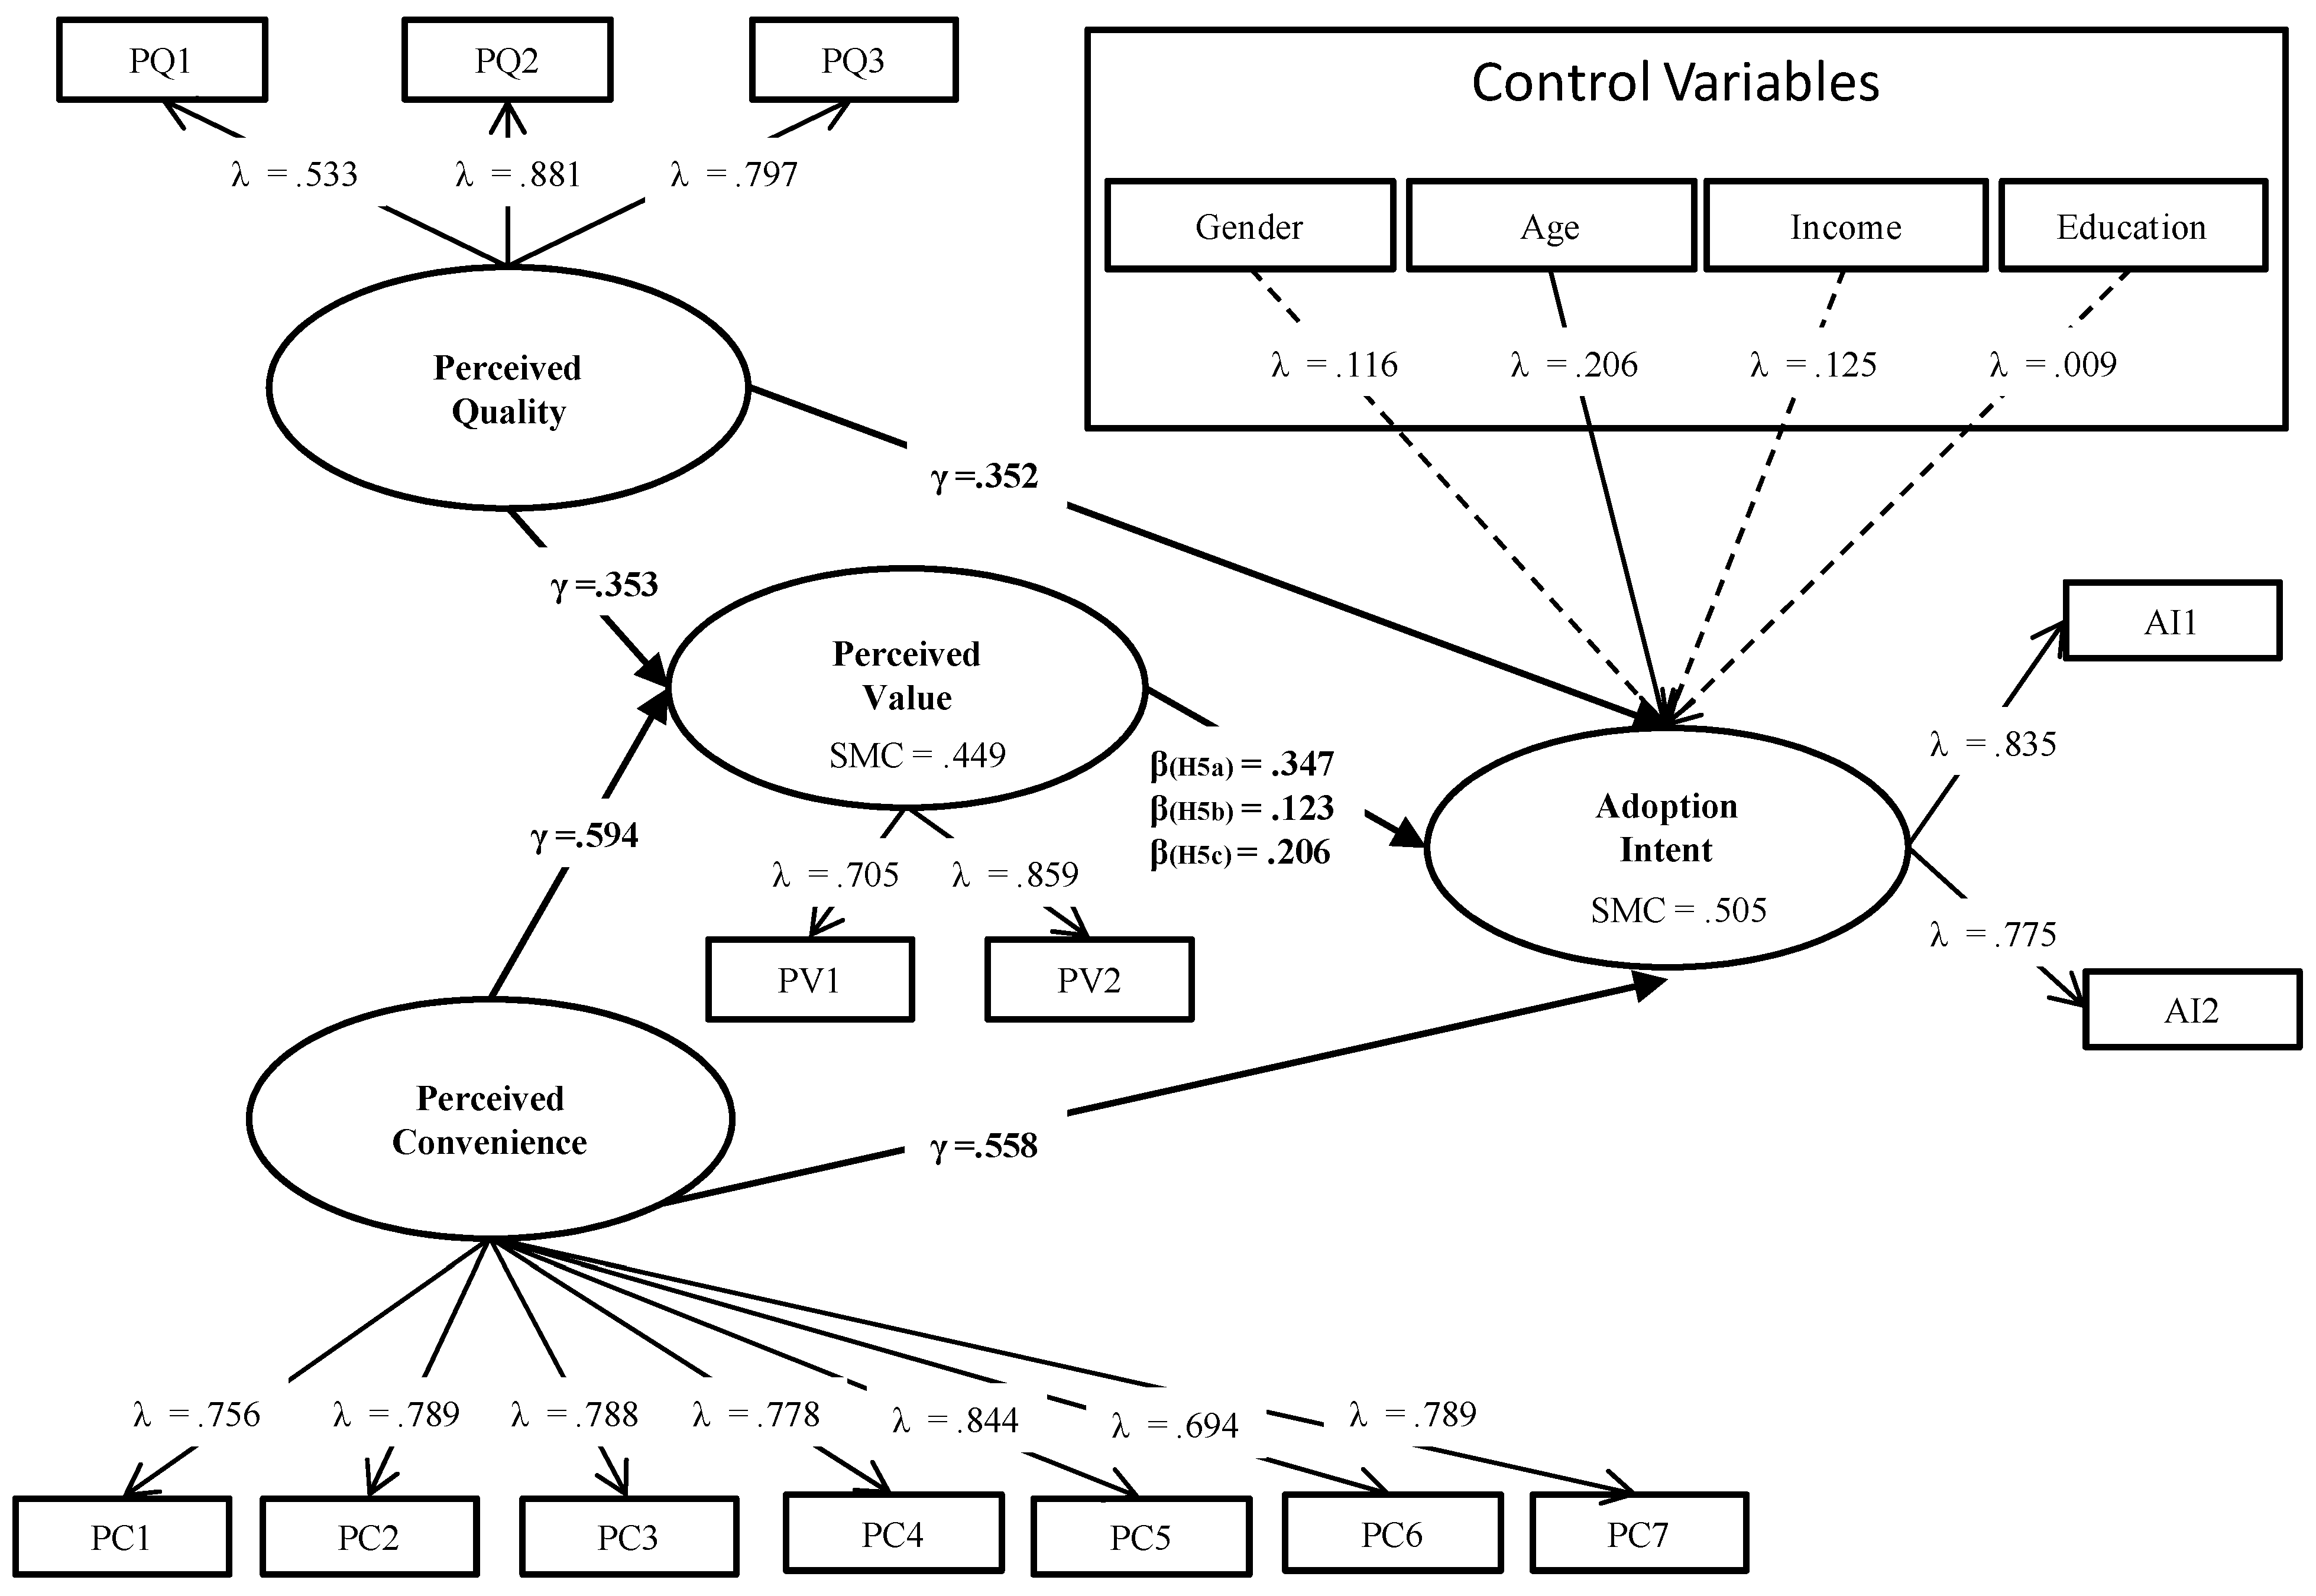
This study used a four-construct model to show how different perceptions can affect one’s intended behavior, and in this case was able to explain 50.5% of the variance in public bicycle sharing systems adoption intention. Future research is still needed to account for other factors that affect intentions to adopt these systems. Nonetheless, this research contributes to the largely qualitative body of literature by suggesting and empirically testing the importance of variables germane to adoption.

6.2. Practical Implications

Zhao et al. [6] found that greater government expenditure positively related to daily use and bicycle turnover rate. This demonstrates the need for government subsidies to lower user costs in order to increase usage; however, if there is no government subsidy, companies may find it hard to add value for the user and still make a profit. Public bicycle sharing systems’ operators in China depend on government subsidies, as they cannot expect to see much revenue generated from the penalty associated with exceeding the typical one hour of free use. Using the extended TAM, this research supports the hypothesis that reasonable value of use positively affects one’s intentions to adopt public bicycle sharing systems. Value needs to be considered as some zero-cost models have increased public bicycle sharing systems’ daily use, but may also increase usage time per user and diminish overall sustainability. Wuhan and other cities in China have changed from a zero-cost model and suffered a significant decline in members and usage during the transformation [61]. If the operators cut the free usage time too much, members who are forced to pay a penalty every time based on their need to use the bicycle longer than the free usage period will likely use the public bicycle sharing systems less frequently or may not use them at all. In other countries, where government subsidies are more limited, managers need to balance value with perceived usefulness of the public bicycle sharing system in order to increase use in the system, and ensure profits are generated through new annual memberships or daily use passes [1].

6.3. Limitations

The first limitation of this study is that all the data was collected in one location, Beijing, China. Therefore we must be careful in trying to generalize these findings to other locations within China and even more so to other countries as many of the dynamics of the public bicycle sharing systems will be different.
Another limitation is that there are many different constructs that can affect one’s intention to adopt the system and only three were considered in this study, which accounted for half of the variance in adoption intention. Some key questions that were not asked in the questionnaire were: what mode of transportation would the public bicycle sharing system be replacing for you and how often will you use the system?

6.4. Concluding Remarks

The hypothesized model has been determined to be an adequate fit with the data collected and through SEM, we find that the model explains more than 50% of the variance of whether or not potential users intend to adopt public bicycle sharing systems. Extending this model further with more factors in the future may provide even more details as to what public bicycle sharing systems’ operators can do to attract a greater number of users or get more government expenditures in order to grow these systems and make them more attractive or beneficial to all parties involved. This study suggests that one area businesses and governments that want to establish or grow public bicycle sharing systems need to focus on is the intended users’ perceived value of the system.

Acknowledgments

This research was funded by “Key Project of National Natural Science Foundation of China (71390334)”, “Key Project of National Social Science Foundation of China (13&ZD026)”, “Humanity and Social Science Youth Foundation of Ministry of Education of China (13YJCZH186)”and “Fundamental Research Funds for the Central Universities of China (2013JBZ019, 2014JBM046)”.

Author Contributions

The research was designed by Benjamin Hazen, Yacan Wang, and Robert Overstreet. Yacan Wang was responsible for data collection and Robert Overstreet analyzed the data. All authors contributed to the development of the manuscript.

Conflicts of Interest

The authors declare no conflict of interest.

Appendix

Table A1. Measures.
Table A1. Measures.
Adoption Intention (AI)
1.
I will use a public bicycle soon.
2.
I plan to use public bicycles in the future.
Perceived Quality (PQ)
1.
Public bicycles have consistent quality.
2.
Public bicycles are well maintained.
3.
Public bicycles perform consistently.
Perceived Convenience (PC)
1.
Using public bicycles is convenient as long as there are enough rental stations.
2.
Using a public bicycle is convenient if the distance between my residency (living place or working place) to the rental station is appropriate.
3.
Using a public bicycle is convenient if I can easily find return locations.
4.
If anything is wrong with the public bicycle, then the problem will not affect my travel plans (i.e., repair or replacement is easy).
5.
Using public bicycles is convenient if a map of rental stations is provided.
6.
Using public bicycles will help me to increase my levels of physical exercise.
7.
Using public bicycles is convenient if there are enough bicycles available in the rental station at all times (i.e., 24 h a day, 365 days per year).
Perceived Value (PV)
1.
Public bicycles are reasonably priced.
2.
Using public bicycles is economical.

References

  1. Parkes, S.D.; Marsden, G.; Shaheen, S.A.; Cohen, A.P. Understanding the diffusion of public bikesharing systems: Evidence from Europe and North America. J. Transp. Geogr. 2013, 31, 94–103. [Google Scholar] [CrossRef]
  2. Shaheen, S.A.; Zhang, H.; Martin, E.; Guzman, S. China’s Hangzhou public bicycle: Understanding early adoption and behavioral response to bikesharing. Transp. Res. Rec. 2011. [Google Scholar] [CrossRef]
  3. Zhang, L.H.; Zhang, J.; Duan, Z.; Bryde, D. Sustainable bike-sharing systems: Characteristics and commonalities across cases in urban China. J. Clean. Prod. 2014, 97, 124–133. [Google Scholar] [CrossRef]
  4. Fishman, E.; Washington, S.; Haworth, N. Bike share: A synthesis of the literature. Transp. Rev. 2013, 33, 148–165. [Google Scholar] [CrossRef] [Green Version]
  5. Fishman, E.; Washington, S.; Haworth, N. Barriers and facilitators to public bicycle scheme use: A qualitative approach. Transp. Res. Part F 2012, 15, 686–698. [Google Scholar] [CrossRef] [Green Version]
  6. Zhao, J.; Deng, W.; Song, Y. Ridership and effectiveness of bike-sharing: The effects of urban features and system characteristics on daily use and turnover rate of public bikes in China. Transp. Policy 2014, 35, 253–264. [Google Scholar] [CrossRef]
  7. Herlihy, D.V. Bicycle: History; Yale University Press: New Haven, CT, USA, 2004. [Google Scholar]
  8. Davis, F.D. Perceived usefulness, perceived ease of use, and user acceptance of information technology. MIS Q. 1989, 13, 319–339. [Google Scholar] [CrossRef]
  9. Raidl, B.R.; Hu, B.; Rainer-Harbach, M.; Papazek, P. Balancing Bicycle Sharing Systems: Improving a VNS by Efficiently Determining Optimal Loading Operations; Hybrid Metaheuristics Workshop: Naples, Italy, 2013; pp. 130–143. [Google Scholar]
  10. Midgley, P. The role of smart bike-sharing systems in urban mobility. Journeys 2009, 2, 23–31. [Google Scholar]
  11. Lin, J.R.; Yang, T.H. Strategic design of public bicycle sharing systems wiht service level contstraints. Transp. Res. Part E 2011, 47, 284–294. [Google Scholar] [CrossRef]
  12. Bordagaray, M.; Ibeas, A.; Dell’Olio, L. Modeling user perception of public bicycle services. Soc. Behav. Sci. 2012, 54, 1308–1316. [Google Scholar] [CrossRef]
  13. Fuller, D.; Gauvin, L.; Kestens, Y.; Daniel, M.; Fournier, M.; Morency, P.; Drouin, L. Use of a new public bicycle share probram in Montreal, Canada. Am. J. Prev. Med. 2011, 41, 80–83. [Google Scholar] [CrossRef] [PubMed]
  14. Fuller, D.; Gauvin, L.; Kestens, Y.; Daniel, M.; Fournier, M.; Morency, P.; Drouin, L. Impact evaluation of a public bicycle share program on cycling: A case example of Bixi in Montreal, Quebec. Am. J. Public Health 2013, 103, 85–92. [Google Scholar] [CrossRef] [PubMed]
  15. Bechand-Marleau, J.; Lee, B.H.Y.; El-Geneidy, A.M. Better understanding of factors influencing likelihood of using shared bicycle systems and frequency of use. J. Transp. Res. Board 2012, 2314, 66–71. [Google Scholar] [CrossRef]
  16. Sherwood, K.; Murphy, J. Expanding a municipal bike share system into an urban national park through community partnerships: The city of San Antonio and Antonio missions national historical park. In Proceedings of the 93rd Annual Meeting of the Transportation Research Board, Washington, DC, USA, 12–16 January 2014.
  17. Lathia, N.; Ahmed, S.; Capra, L. Measuring the impact of opening the London shared bicycle scheme to casual users. Transp. Res. Part C 2012, 22, 88–102. [Google Scholar] [CrossRef]
  18. Xinhua Net. Why the Public Bicycle System is Not Popular. Available online: http://news.xinhuanet.com/local/2014-04/24/c_1110398169.htm (accessed on 24 April 2015). (In Chinese)
  19. Xinhua Net. The Sharp Decline of Bicycling in Beijing. Available online: http://news.xinhuanet.com/politics/2014-07/23/c_126787679.htm (accessed on 23 July 2015). (In Chinese)
  20. Beijing Municipal Government. The Plan of Construcing Harmonious, Advanced and Green Transportation (2009–2015). Available online: http://zhengwu.beijing.gov.cn/ghxx/qtgh/t1066279.htm (accessed on 1 October 2015). (In Chinese)
  21. Beijing Municipal Government. The Opinion of Relieving Urban Transport Jam and Promoting the Development of Urban Transport. Available online: http://www.gov.cn/gzdt/2010-12/24/content_1771925.htm (accessed on 1 October 2015). (In Chinese)
  22. Beijing Municipal Commission of Transport. Green Travelling in Beijing. Available online: http://shipin.beijing.gov.cn/index.php?option=com_content&id=5949 (accessed on 2 September 2014). (In Chinese)
  23. Beijing Municipal Commission of Transport. Transportation Admistration of Beijing Municipal Commission of Transport Enhances the Dispatch and Building of Public Bicycle Stations and Improves the Rate of Usage. Available online: http://www.bjjtw.gov.cn/bjggzxc/Home_index_1_1.html (accessed on 1 October 2015). (In Chinese)
  24. Fishbein, M.; Ajzen, I. Belief, Attitude, Intention and Behavior: An Introduction to Theory and Research; Addison-Wesley: Reading, MA, USA, 1975. [Google Scholar]
  25. Ajzen, I. The theory of planned behavior. Organ. Behav. Hum. Decis. Process. 1991, 50, 179–211. [Google Scholar] [CrossRef]
  26. Bandura, A. Social Foundations of Thought and Action: A Social Cognitive Theory; Prentice Hall: Englewood Cliffs, NJ, USA, 1986. [Google Scholar]
  27. Rogers, E.M. Diffusion of Innovations, 5th ed.; Free Press: New York, NY, USA, 2003. [Google Scholar]
  28. Venkatesh, V.; Davis, F.D. A theoretical extension of the technology acceptance model: Four longitudinal field studies. Manag. Sci. 2000, 45, 186–204. [Google Scholar] [CrossRef]
  29. Venkatesh, V.; Bala, H. Technology acceptance model 3 and a research agenda on interventions. Decis. Sci. 2008, 39, 273–315. [Google Scholar] [CrossRef]
  30. Autry, C.W.; Grawe, S.J.; Daugherty, P.; Richey, R.G., Jr. The effects of technological turbulence and breadth on supply chain technology acceptance and adoption. J. Oper. Manag. 2010, 28, 522–536. [Google Scholar] [CrossRef]
  31. Hazen, B.T.; Wu, Y.; Sankar, C.S. Factors that influence dissemination in engineering education. IEEE Trans. Educ. 2012, 55, 384–393. [Google Scholar] [CrossRef]
  32. Venkatesh, V.; Morris, M.G.; Davis, G.B.; Davis, F.D. User acceptance of information technology: Toward a unified view. MIS Q. 2003, 27, 427–478. [Google Scholar]
  33. Venkatesh, V.; Thong, J.Y.L.; Xu, X. Consumer acceptance and use of information technology: Extending the unified theory of acceptance and use of technology. MIS Q. 2012, 36, 157–178. [Google Scholar]
  34. Kline, R.B. Principles and Practice of Structural Equation Modeling, 3rd ed.; The Guilford Press: New York, NY, USA, 2011. [Google Scholar]
  35. Davis, F.D.; Bagozzi, R.P.; Warshaw, P.R. User acceptance of computer technology: A comparison of two theoretical models. Manag. Sci. 1989, 35, 982–1002. [Google Scholar] [CrossRef]
  36. Schepers, J.; Wetzels, M. A meta-analysis of the technology acceptance model: Investigating subjective norm and moderation effects. Inf. Manag. 2007, 44, 90–103. [Google Scholar] [CrossRef]
  37. Zeithaml, V.A. Consumer perceptions of price, quality, and value: A means-end model and synthesis of evidence. J. Mark. 1988, 52, 2–22. [Google Scholar] [CrossRef]
  38. Berry, L.L.; Seiders, K.; Grewal, D. Understanding service convenience. J. Mark. 2002, 66, 1–17. [Google Scholar] [CrossRef]
  39. Cronin, J.J., Jr.; Brady, M.K.; Hult, G.T.M. Assessing the effects of quality, value, and customer satisfaction on consumer behavioral intentions in service environments. J. Retail. 2000, 76, 193–218. [Google Scholar] [CrossRef]
  40. Lapierre, J. Customer-perceived value in industrial contexts. J. Bus. Ind. Mark. 2000, 15, 122–140. [Google Scholar] [CrossRef]
  41. Dodds, W.B.; Monroe, K.B.; Grewal, D. Effect of price, brand name, and store name on buyer’s perception of product quality. J. Mark. Res. 1991, 28, 307–319. [Google Scholar] [CrossRef]
  42. Eboli, L.; Mazzula, G. How to capture the passengers’ point of view on a transit service through rating and choice options. Transp. Rev. 2010, 30, 435–450. [Google Scholar] [CrossRef]
  43. Sanchez-Fernandez, R.; Iniesta-Bonillo, M.A. The concept of perceived value: A systematic review of the research. Mark. Theory 2007, 7, 427–451. [Google Scholar] [CrossRef]
  44. Bolton, R.N.; Drew, J.H. A multistage model of customers’ assessments of service quality and value. J. Consum. Res. 1991, 17, 375–384. [Google Scholar] [CrossRef]
  45. Chang, T.Z.; Wildt, A.R. Price, product information, and purchase intention: An empirical study. J. Acad. Mark. Sci. 1994, 22, 16–27. [Google Scholar] [CrossRef]
  46. Chen, Z.; Dubinsky, A.J. A conceptual model of perceived customer value in e-commerce: A preliminary investigation. Psychol. Mark. 2003, 20, 323–347. [Google Scholar] [CrossRef]
  47. Turel, O.; Serenko, A.; Bontis, N. User acceptance of wireless short messaging services: Deconstructing perceived value. Inf. Manag. 2007, 44, 63–73. [Google Scholar] [CrossRef]
  48. Sweeney, J.C.; Soutar, G.N. Customer perceived value: The development of a multiple item scale. J. Retail. 2001, 77, 203–220. [Google Scholar] [CrossRef]
  49. Hazen, B.T.; Cegielski, C.G.; Hanna, J.B. Diffusion of green supply chain management: Examining perceived quality of green reverse logistics. Int. J. Logist. Manag. 2011, 22, 373–389. [Google Scholar] [CrossRef]
  50. Ogilvie, F.; Goodman, A. Inequities in usage of a public bicycle sharing scheme: Socio-demographic predictors of uptake and usage of the London (UK) cycle hire scheme. Prev. Med. 2012, 55, 40–45. [Google Scholar] [CrossRef] [PubMed]
  51. Virgina Tech. Capital Bikeshare Study: A Closer Look at Casual Users and Operation; Virgina Tech: Arlington, VA, USA, 2012. [Google Scholar]
  52. Lewis, T. Has London’s cycle hire scheme been a capital idea? Gaurdian, 10 July 2011. [CrossRef] [PubMed]
  53. LDA Consulting. Capital Bikeshare 2011 Member Survey Report; LDA Consulting: Washington, DC, USA, 2012. [Google Scholar]
  54. Sharma, S. Applied Multivariate Techniques; John Wiley and Sons, Inc.: New York, NY, USA, 1996. [Google Scholar]
  55. Segars, A.H. Assessing the unidimensionality of measurement: A paradigm and illustration within the context of information systems research. Omega 1997, 25, 107–121. [Google Scholar] [CrossRef]
  56. Podsakoff, P.M.; MacKenzie, S.B.; Lee, J.-Y.; Podsakoff, N.P. Common method biases in behavioral research: A critical review of the literature and recommended remedies. J. Appl. Psychol. 2003, 88, 879–903. [Google Scholar] [CrossRef] [PubMed]
  57. Preacher, K.J.; Coffman, D.L. Computing Power and Minimum Sample Size for RMSEA (Computer Software). 2006. Available online: http://quantpsy.Org/ (accessed on 25 February 2015).
  58. Saldanha, T.J.V.; Melville, N.P.; Ramirez, R.; Richardson, V.J. Information systems for collaborating versus transacting: Impact on manufacturing plant performance in the presence of demand volitility. J. Oper. Manag. 2013, 31, 313–329. [Google Scholar] [CrossRef]
  59. Zhao, X.; Lynch, J.G., Jr.; Chen, Q. Reconsidering baron and kenny: Myths and truths about mediation analysis. J. Consum. Res. 2010, 37, 197–206. [Google Scholar] [CrossRef]
  60. Shrout, P.E.; Bolger, N. Mediation in experimental and nonexperimental studies: New procedures and recommendations. Psychol. Methods 2002, 7, 422–445. [Google Scholar] [CrossRef] [PubMed]
  61. Zhang, H.; Lu, Y.; Gupta, S.; Zhao, L.; Chen, A.; Huang, H. Understanding the antecedents of customer loyalty in the Chinese mobile service industry: A push-pull-mooring framework. Int. J. Mob. Commun. 2014, 12, 551–577. [Google Scholar] [CrossRef]

