
Towards a Conceptual Framework for Social-Ecological Systems Integrating Biodiversity and Ecosystem Services with Resource Efficiency Indicators

 and
and 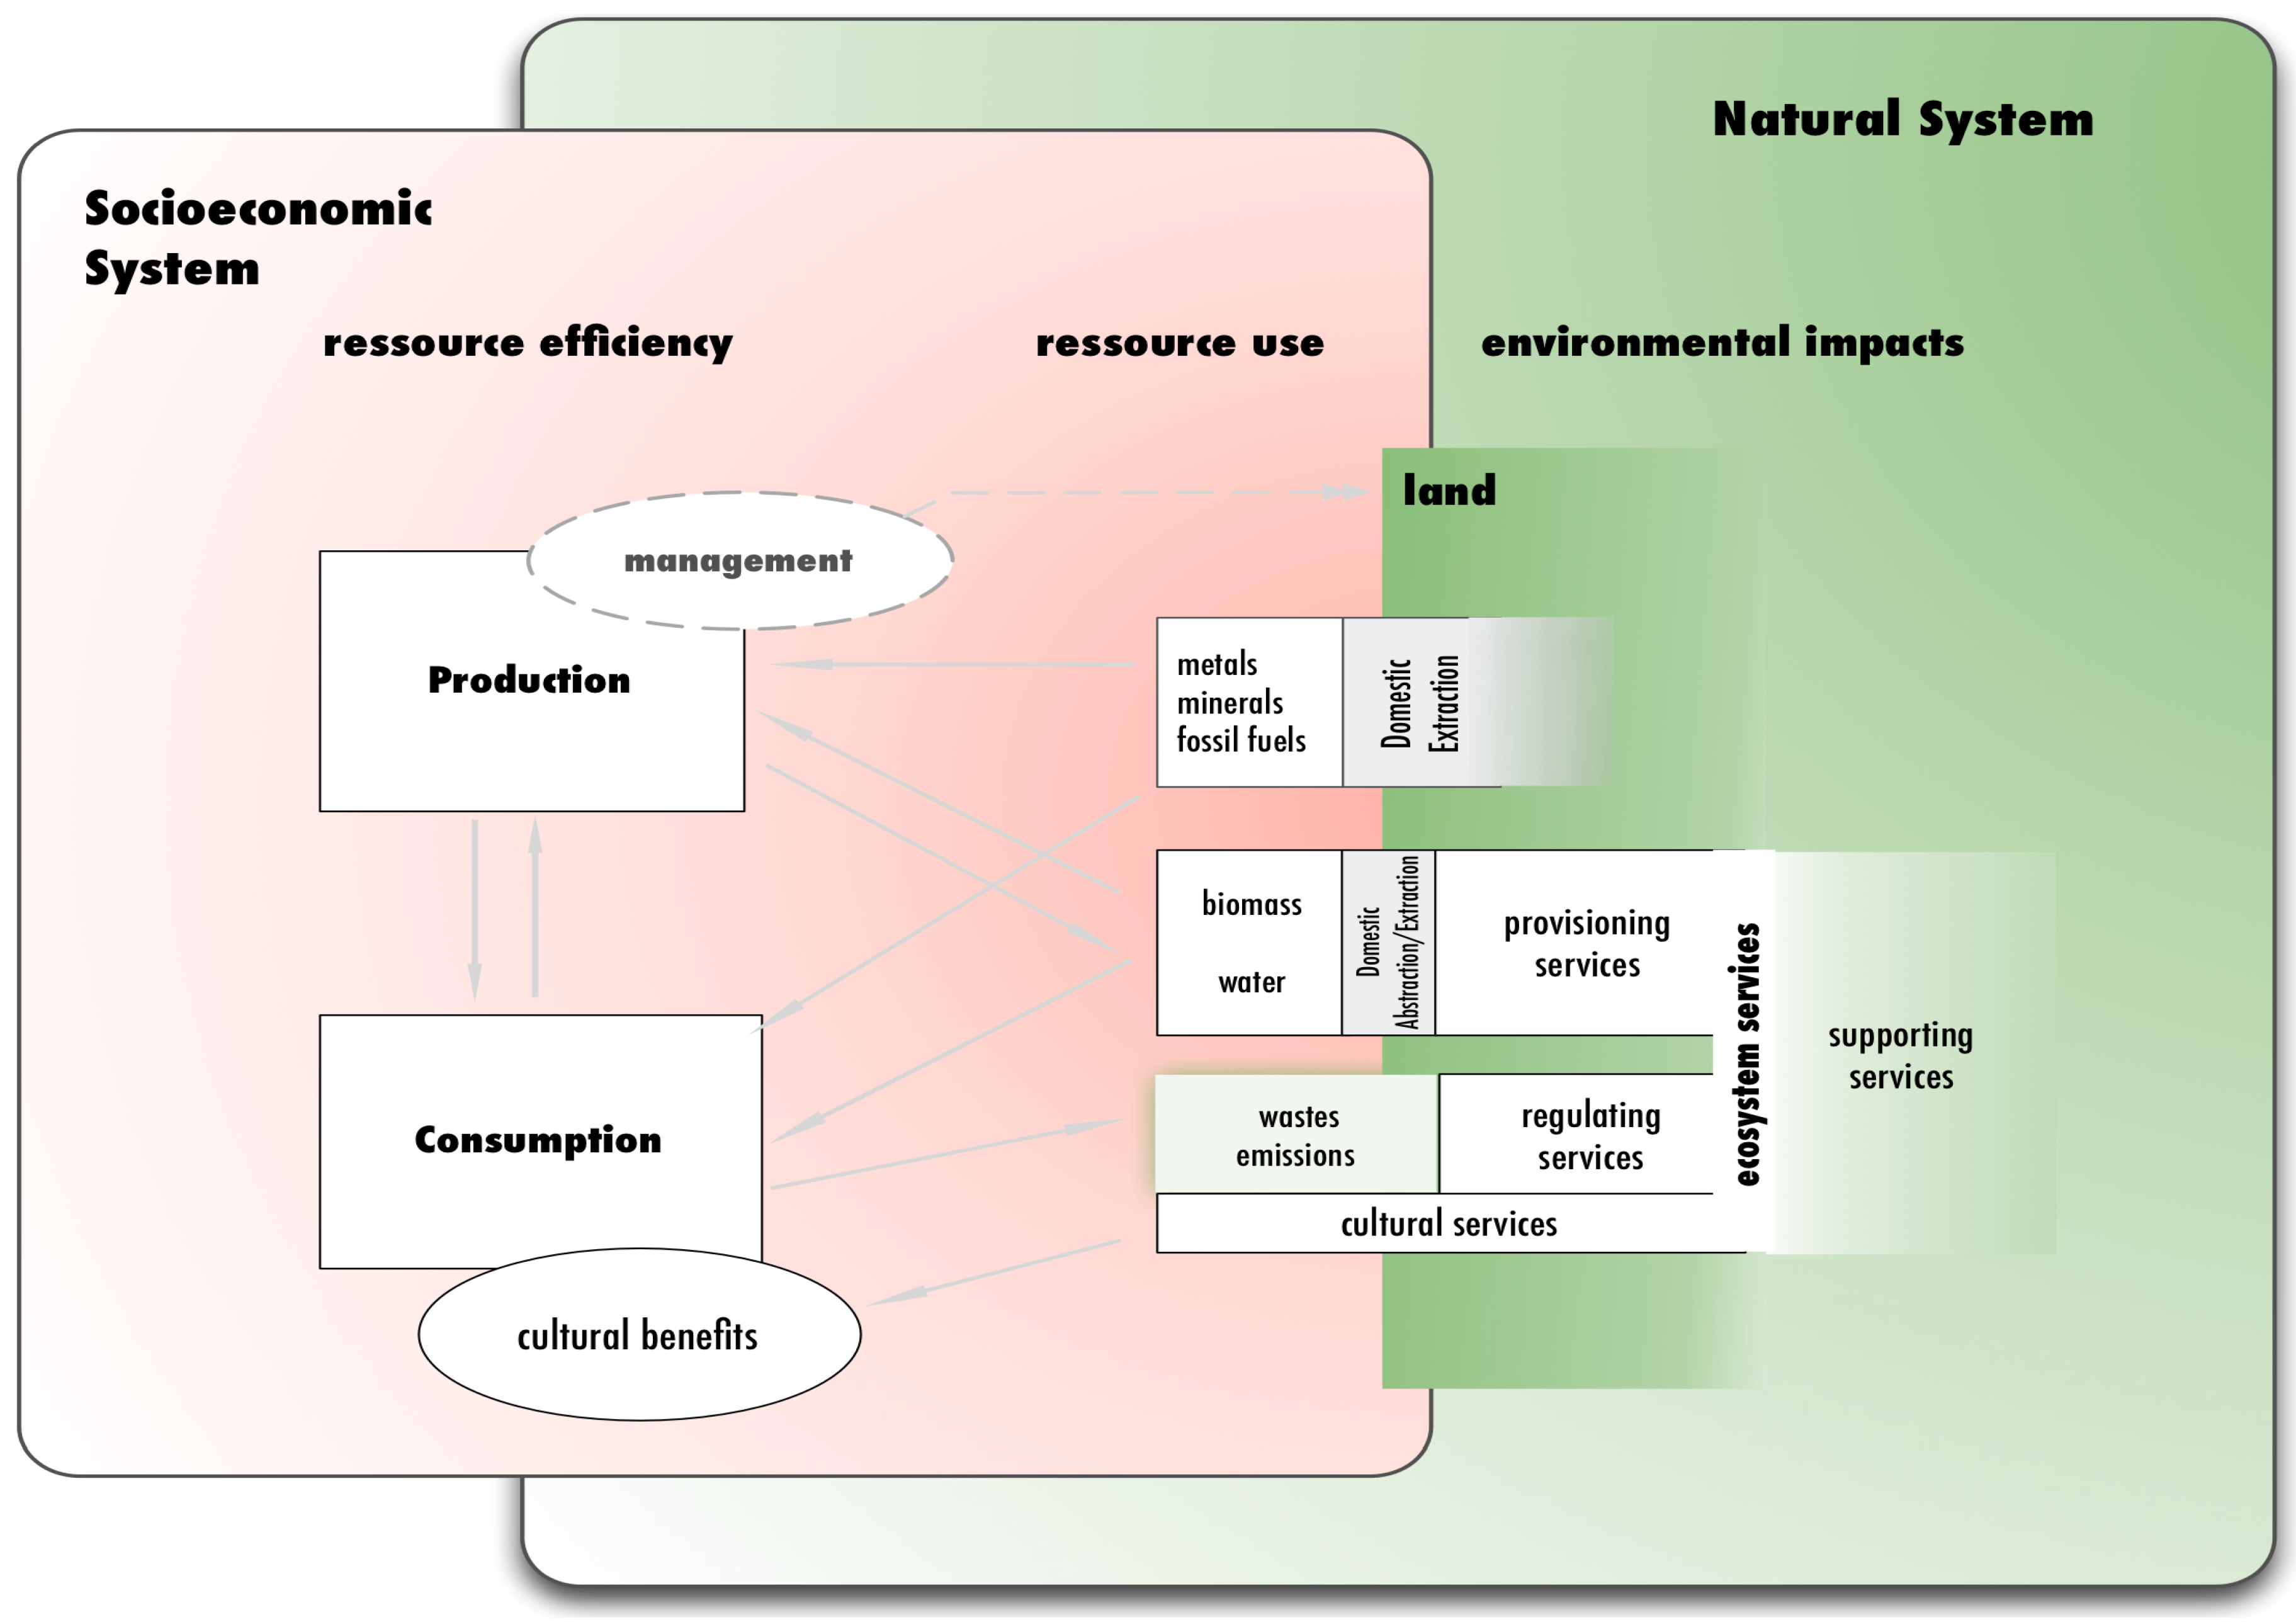
Abstract
:1. Introduction
2. Society–Nature Interactions and Their Physical Representation
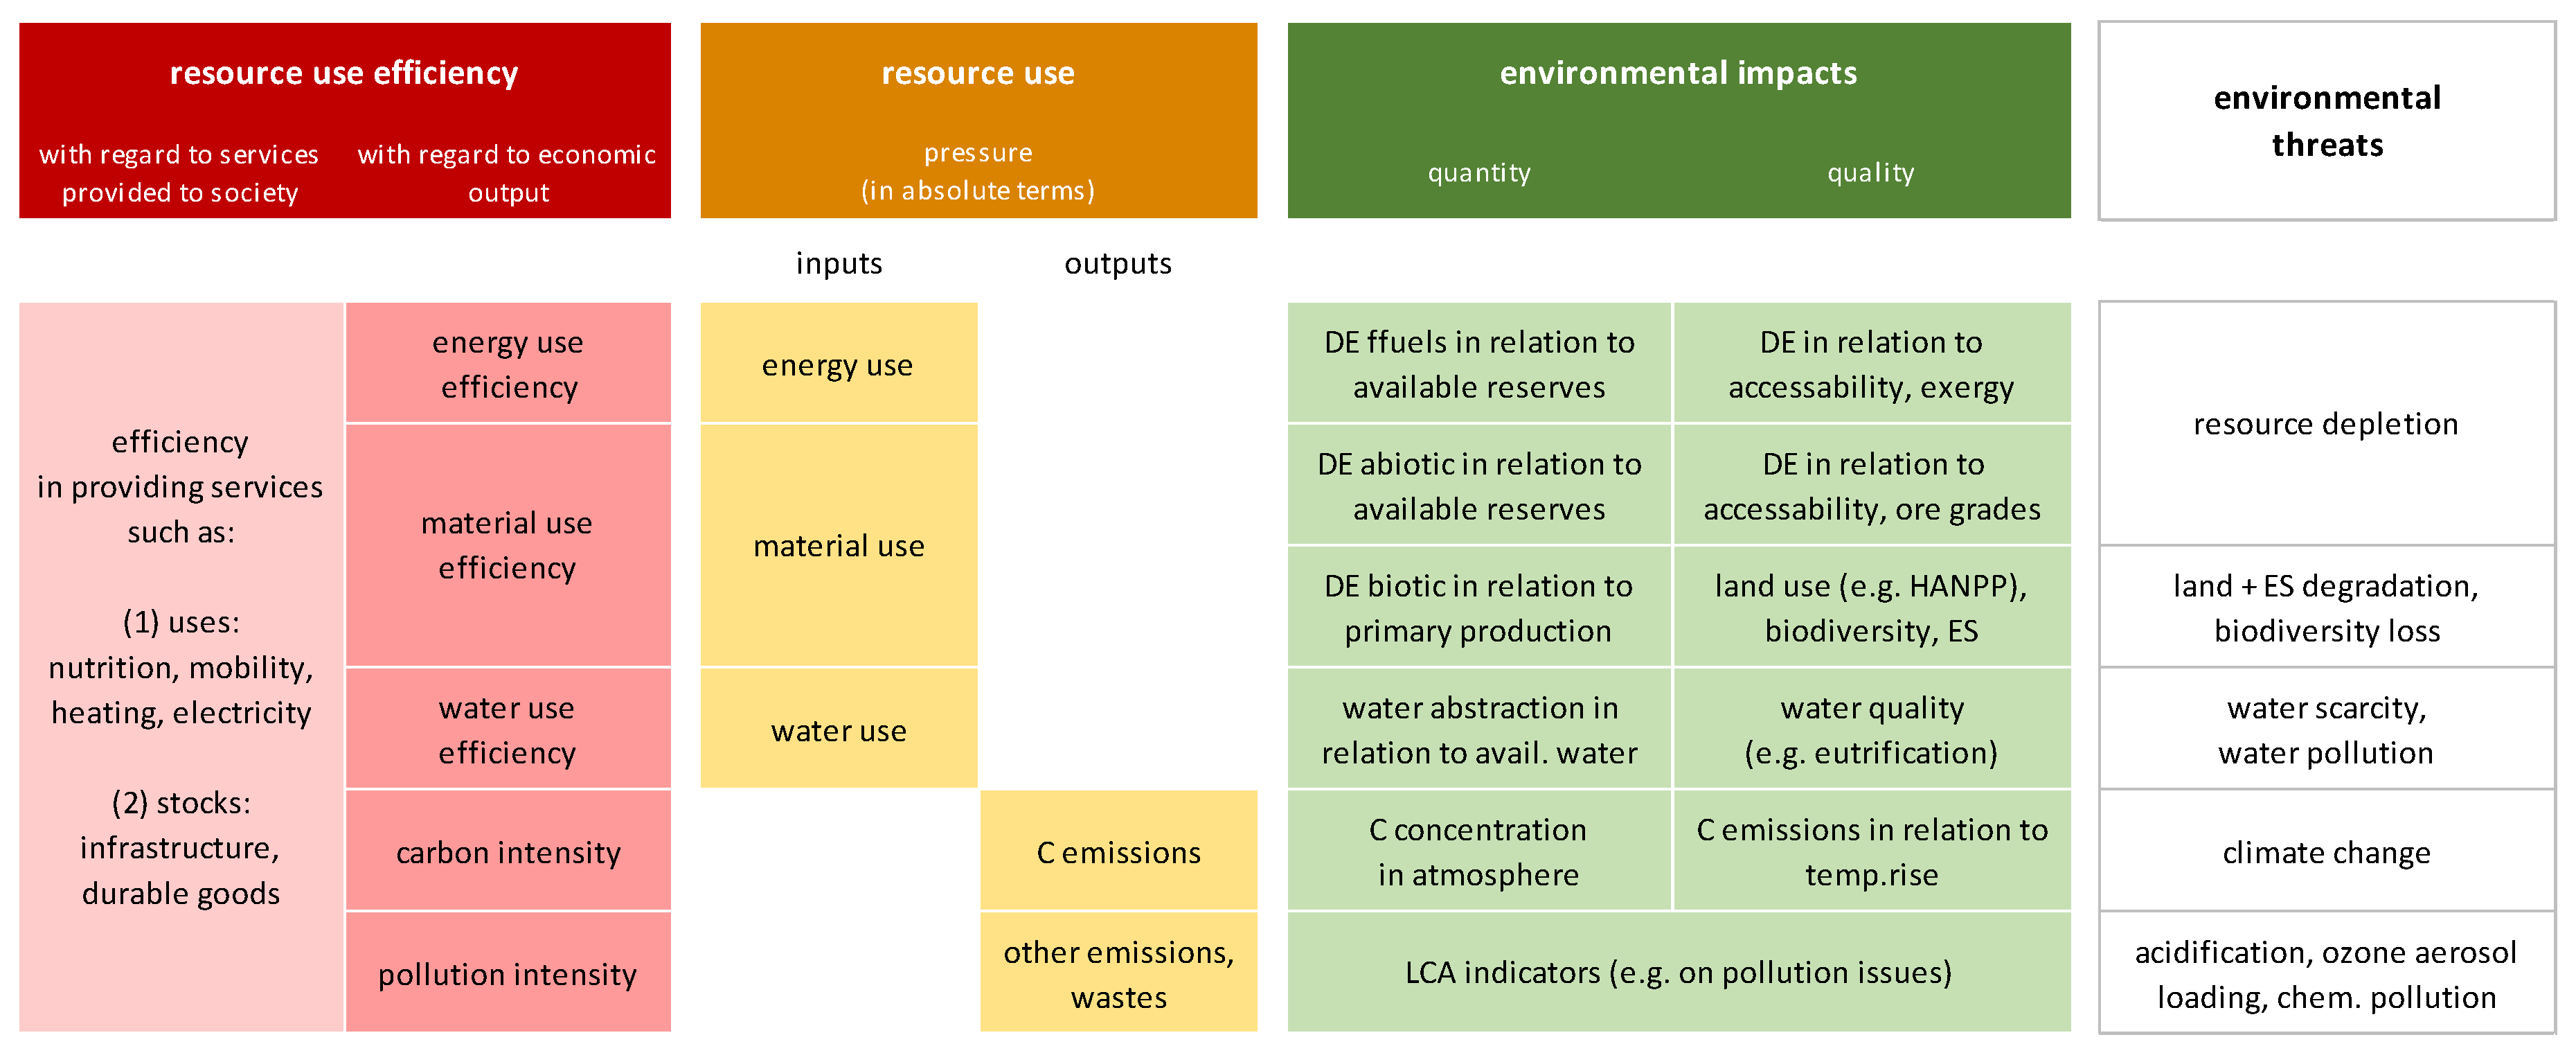
3. Proposal for an Indicator Framework Structured along Three Parts: Resource Use, Resource Efficiency and Environmental Impacts
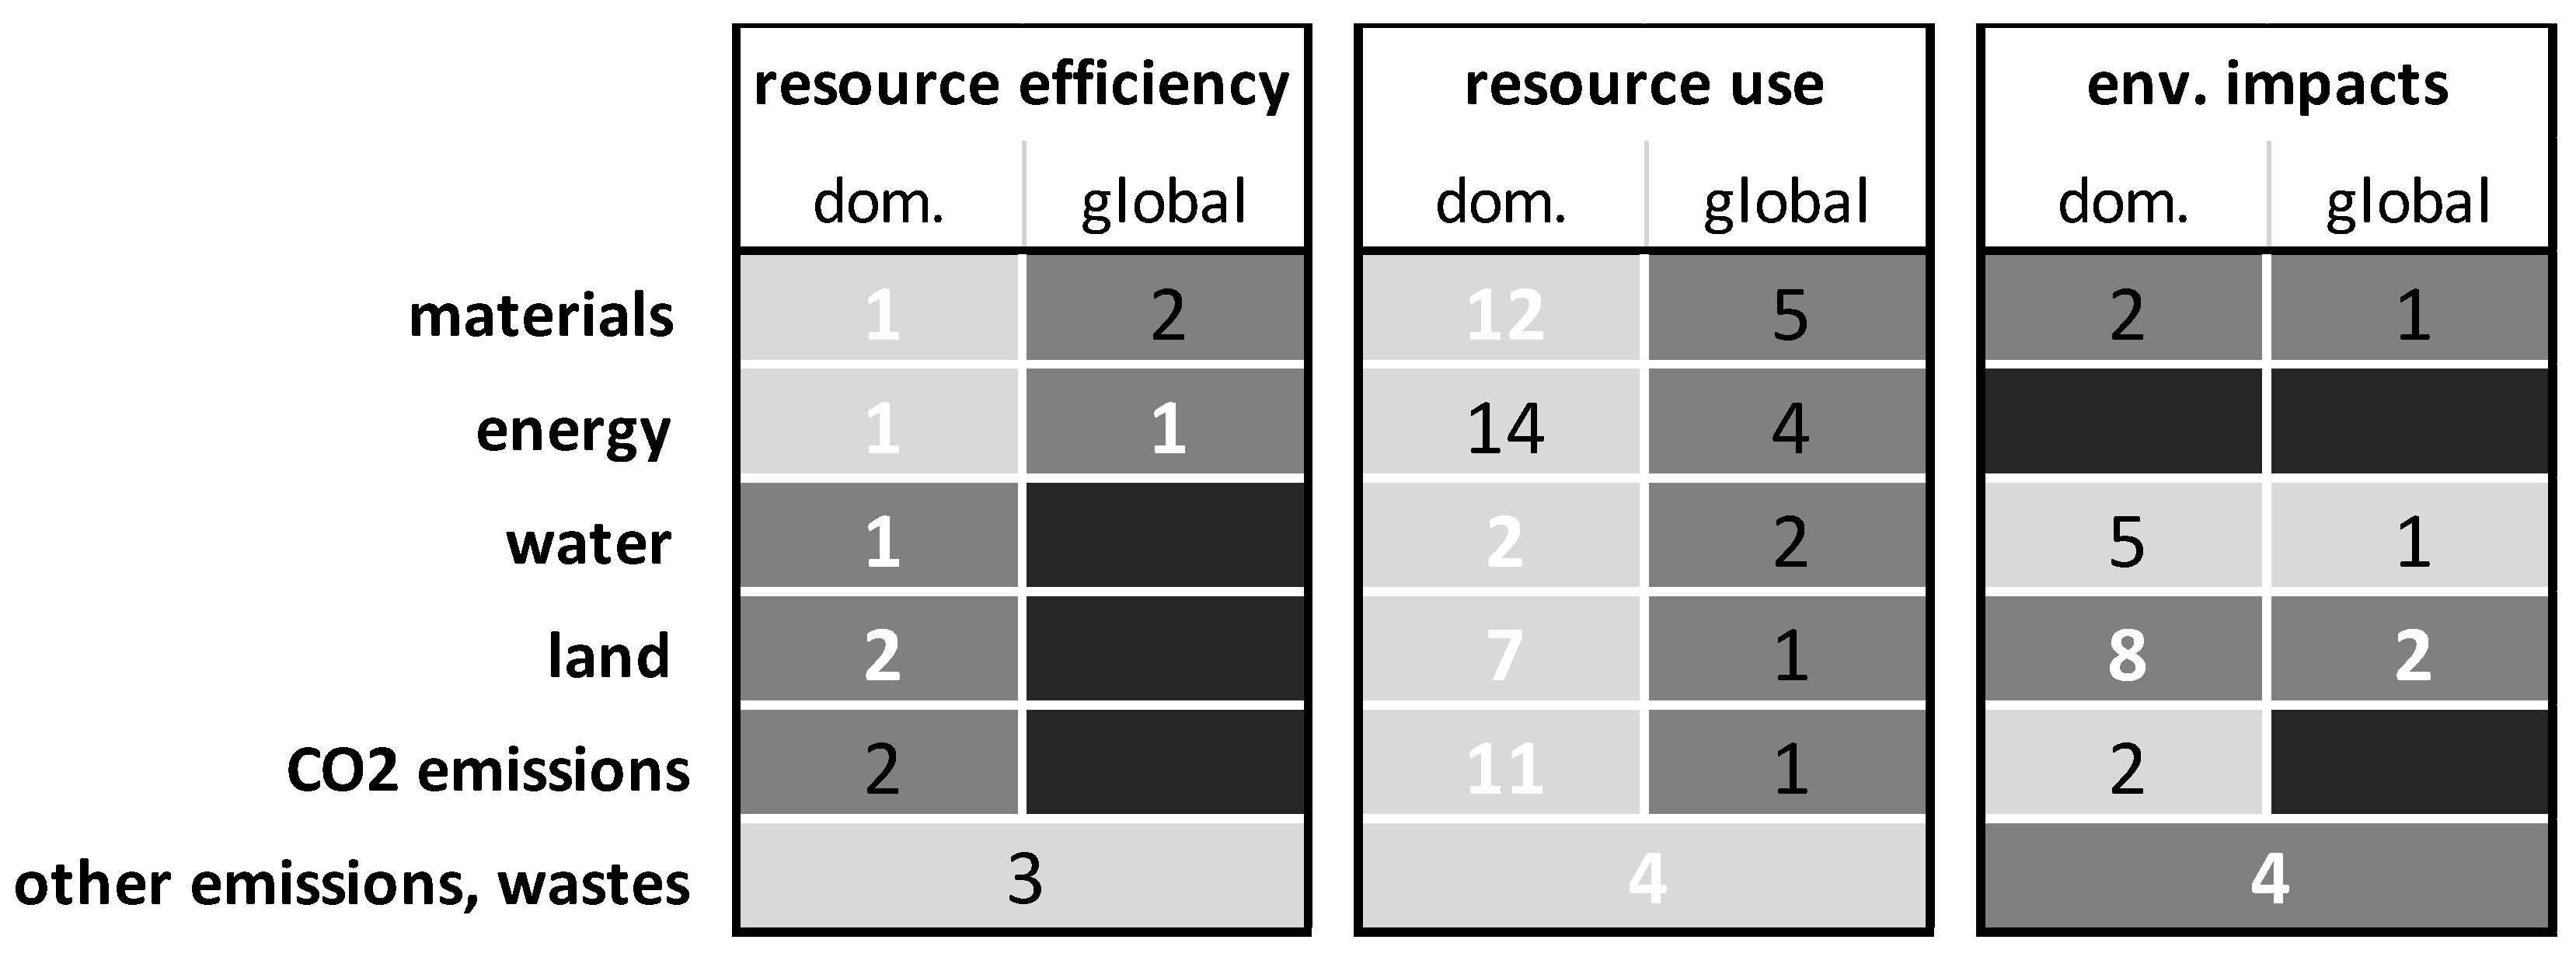
4. Resource-Efficiency Indicators—Where Do We Stand?
5. Conclusions
Supplementary Materials
Acknowledgments
Author Contributions
Conflicts of Interest
References
- Ayres, R.U.; Ayres, L.W. A Handbook of Industrial Ecology; Edward Elgar: Cheltenham, UK, 2002. [Google Scholar]
- Ayres, R.U.; Simonis, U.E. Industrial Metabolism: Restructuring for Sustainable Development; United Nations University Press: Tokyo, Japan; New York, NY, USA; Paris, France, 1994. [Google Scholar]
- Fischer-Kowalski, M.; Haberl, H. Sustainable development: Socio-economic metabolism and colonization of nature. Int. Soc. Sci. J. 1998, 50, 573–587. [Google Scholar] [CrossRef]
- Fischer-Kowalski, M.; Hüttler, W. Society’s Metabolism: The Intellectual History of Materials Flow Analysis, Part II, 1970–1998. J. Ind. Ecol. 1998, 2, 107–136. [Google Scholar] [CrossRef]
- Pauliuk, S.; Hertwich, E.G. Socioeconomic metabolism as paradigm for studying the biophysical basis of human societies. Ecol. Econ. 2015, 119, 83–93. [Google Scholar] [CrossRef]
- Fischer-Kowalski, M.; Weisz, H. Society as a Hybrid between Material and Symbolic Realms. Toward a Theoretical Framework of Society-Nature Interaction. Adv. Hum. Ecol. 1999, 8, 215–251. [Google Scholar]
- UNEP; Fischer-Kowalski, M.; Swilling, M.; von Weizsäcker, E.U.; Ren, Y.; Moriguchi, Y.; Crane, W.; Krausmann, F.; Eisenmenger, N.; Giljum, S.; et al. Decoupling Natural Resource Use and Environmental Impacts from Economic Growth; Report of the International Resource Panel; United Nations Environment Programme: Paris, France, 2011. [Google Scholar]
- Bleischwitz, R.; Welfens, P.J.J.; Zhang, Z. Sustainable Growth and Resource Productivity Economic and Global Policy Issues; Greenleaf: Sheffield, UK, 2009. [Google Scholar]
- Von Weizsäcker, E.U.; Hargroves, C.; Smith, M.H.; Desha, C.; Stasinopoulos, P. Factor Five: Transforming the Global Economy through 80% Improvements in Resource Productivity; Routledge, Earthscan: London, UK, 2009. [Google Scholar]
- Rockström, J.; Steffen, W.; Noone, K.; Persson, Å.; Chapin, F.S.; Lambin, E.F.; Lenton, T.M.; Scheffer, M.; Folke, C.; Schellnhuber, H.J.; et al. A safe operating space for humanity. Nature 2009, 461, 472–475. [Google Scholar] [CrossRef] [PubMed]
- Steffen, W.; Richardson, K.; Rockstrom, J.; Cornell, S.E.; Fetzer, I.; Bennett, E.M.; Biggs, R.; Carpenter, S.R.; de Vries, W.; de Wit, C.A.; et al. Planetary boundaries: Guiding human development on a changing planet. Science 2015, 347, 1259855. [Google Scholar] [CrossRef] [PubMed]
- Liu, J.; Mooney, H.; Hull, V.; Davis, S.J.; Gaskell, J.; Hertel, T.; Lubchenco, J.; Seto, K.C.; Gleick, P.; Kremen, C.; et al. Systems integration for global sustainability. Science 2015, 347, 1258832. [Google Scholar] [CrossRef] [PubMed]
- European Commission. Roadmap to a Resource Efficient Europe; European Commission: Brussels, Belgium, 2011; pp. 1–26. [Google Scholar]
- UNEP International Resource Panel. Available online: http://www.unep.org/resourcepanel/ (accessed on 8 April 2015).
- OECD. Recommendation of the Council on Material Flows and Resource Productivity; OECD: Paris, France, 2004. [Google Scholar]
- OECD. Material Resources, Productivity and the Environment; OECD Green Growth Studies; OECD Publishing: Paris, France, 2015. [Google Scholar]
- Huysman, S.; Sala, S.; Mancini, L.; Ardente, F.; Alvarenga, R.A.F.; de Meester, S.; Mathieux, F.; Dewulf, J. Toward a systematized framework for resource efficiency indicators. Resour. Conserv. Recycl. 2015, 95, 68–76. [Google Scholar] [CrossRef] [Green Version]
- European Commission. A Resource-Efficient Europe–Flagship Initiative under the Europe 2020 Strategy; European Commission: Brussels, Belgium, 2011; p. 17. [Google Scholar]
- European Commission. Thematic Strategy on the Sustainable Use of Natural Resources; Commission of the European Communities: Brussels, Belgium, 2005. [Google Scholar]
- United Nations. System of Environmental-Economic Accounting 2012. Available online: http://ec.europa.eu/eurostat/documents/3859598/5936709/KS-01-14-120-EN.PDF/334d5c04-b630-4395-8008-94f36712bf6bb (accessed on 15 February 2016).
- Eurostat Environmental accounts. Available online: http://epp.eurostat.ec.europa.eu/portal/page/portal/environmental_accounts/introduction (accessed on 3 November 2014).
- OECD. Environmental indicators, modelling and outlooks. Available online: http://www.oecd.org/environment/indicators-modelling-outlooks/ (accessed on 19 April 2015).
- Miller, R.E.; Blair, P.D. Input-Output Analysis: Foundations and Extensions, 2nd ed.; Cambridge University Press: Cambridge, UK; New York, NY, USA, 2009. [Google Scholar]
- Handbook of Input-Output Economics in Industrial Ecology; Suh, S. (Ed.) Eco-efficiency in Industry and Science; Springer: Dordrecht, The Netherlands; New York, NY, USA, 2009.
- UN. Millennium Ecosystem Assessment. Available online: http://www.millenniumassessment.org/en/index.html (accessed on 19 April 2015).
- UNEP. The Economics of Ecosystems & Biodiversity (TEEB). Available online: http://www.teebweb.org/ (accessed on 19 April 2015).
- Díaz, S.; Demissew, S.; Carabias, J.; Joly, C.; Lonsdale, M.; Ash, N.; Larigauderie, A.; Adhikari, J.R.; Arico, S.; Báldi, A.; et al. The IPBES Conceptual Framework—connecting nature and people. Curr. Opin. Environ. Sustain. 2015, 14, 1–16. [Google Scholar] [CrossRef] [Green Version]
- EU; EEA; CHM; UN. Mapping and Assessment of Ecosystems and their Services (MAES)—Biodiversity Information system for Europe. Available online: http://biodiversity.europa.eu/maes (accessed on 23 October 2015).
- UN. Intergovernmental Platform on Biodiversity & Ecosystem Services. Available online: http://www.ipbes.net/ (accessed on 23 October 2015).
- Haberl, H.; Erb, K.-H.; Krausmann, F.; Loibl, W.; Schulz, N.; Weisz, H. Changes in ecosystem processes induced by land use: Human appropriation of aboveground NPP and its influence on standing crop in Austria. Glob. Biogeochem. Cycles 2001, 15, 929–942. [Google Scholar] [CrossRef]
- Haberl, H.; Fischer-Kowalski, M.; Krausmann, F.; Weisz, H.; Winiwarter, V. Progress towards Sustainability? What the conceptual framework of material and energy flow accounting (MEFA) can offer. Land Use Policy 2004, 21, 199–213. [Google Scholar] [CrossRef]
- Baccini, P.; Brunner, P.H. Metabolism of the Anthroposphere: Analysis, Evaluation, Design, 2nd ed.; MIT Press: Cambridge, MA, USA, 2012. [Google Scholar]
- Haberl, H.; Gaube, V.; Díaz-Delgado, R.; Krauze, K.; Neuner, A.; Peterseil, J.; Plutzar, C.; Singh, S.J.; Vadineanu, A. Towards an integrated model of socioeconomic biodiversity drivers, pressures and impacts. A feasibility study based on three European long-term socio-ecological research platforms. Ecol. Econ. 2009, 68, 1797–1812. [Google Scholar] [CrossRef] [Green Version]
- EU. Regulation on European Environmental Economic Accounts; Official Journal of the European Union; European Parliament and of the Council: Brussels, Belgium, 2011. [Google Scholar]
- Fischer-Kowalski, M.; Krausmann, F.; Giljum, S.; Lutter, S.; Mayer, A.; Bringezu, S.; Moriguchi, Y.; Schütz, H.; Schandl, H.; Weisz, H. Methodology and Indicators of Economy-wide Material Flow Accounting State of the Art and Reliability Across Sources. Ind. Ecol. 2011, 15, 855–876. [Google Scholar] [CrossRef]
- Eurostat. Economy-Wide Material Flow Accounts and Derived Indicators. A Methodological Guide; European Commission: Luxembourg, 2001; pp. 1–85. [Google Scholar]
- OECD. Measuring Material Flows and Resource Productivity. Volume I. The OECD Guide; OECD: Paris, France, 2008. [Google Scholar]
- Eurostat Environmental accounts-establishing the links between the environment and the economy. Available online: http://ec.europa.eu/eurostat/statistics-explained/index.php/Environmental_accounts_-_establishing_the_links_between_the_environment_and_the_economy (accessed on 23 October 2015).
- Haberl, H. The Energetic Metabolism of Societies Part I: Accounting Concepts. J. Ind. Ecol. 2001, 5, 11–33. [Google Scholar] [CrossRef]
- Haberl, H.; Weisz, H.; Amann, C.; Bondeau, A.; Eisenmenger, N.; Erb, K.-H.; Fischer-Kowalski, M.; Krausmann, F. The Energetic Metabolism of the European Union and the United States: Decadal Energy Input Time-Series with an Emphasis on Biomass. J. Ind. Ecol. 2006, 10, 151–171. [Google Scholar] [CrossRef]
- UN System of Environmental-Economic Accounting for Water (SEEA-Water). Available online: http://unstats.un.org/unsd/envaccounting/seeaw/ (accessed on 23 October 2015).
- Eurostat Water statistics—Statistics Explained. Available online: http://ec.europa.eu/eurostat/statistics-explained/index.php?title=Water_statistics&oldid=204654 (accessed on 23 October 2015).
- Fischer-Kowalski, M.; Haberl, H. Socioecological Transitions and Global Change Trajectories of Social Metabolism and Land Use; Edward Elgar: Cheltenham, UK; Northampton, MA, USA, 2007. [Google Scholar]
- Weisz, H. The probability of the improbable: Society-nature coevolution. Geogr. Ann. Ser. B Hum. Geogr. 2011, 93, 325–336. [Google Scholar] [CrossRef]
- Foxon, T.J. A coevolutionary framework for analysing a transition to a sustainable low carbon economy. Ecol. Econ. 2011, 70, 2258–2267. [Google Scholar] [CrossRef]
- Krausmann, F.; Fischer-Kowalski, M.; Eisenmenger, N.; Schaffartzik, A.; Steinberger, J.K.; Weisz, U. Trends in the Use of Natural Resources. Annex I to the Preparatory Study for the Review of the Thematic Strategy on the Sustainable Use of Natural Resources. Final Report prepared for the European Commission, DG Environment; Institute of Social Ecology: Vienna, Austria, 2010. [Google Scholar]
- Verburg, P.H.; van de Steeg, J.; Veldkamp, A.; Willemen, L. From land cover change to land function dynamics: A major challenge to improve land characterization. J. Environ. Manag. 2009, 90, 1327–1335. [Google Scholar] [CrossRef] [PubMed]
- Haines-Young, R.; Potschin, M. Common International Classification of Ecosystem Services (CICES): Consultation on Version 4; European Environmental Agency: Kopenhagen, Denmark, 2013. [Google Scholar]
- Cardinale, B.J.; Duffy, J.E.; Gonzalez, A.; Hooper, D.U.; Perrings, C.; Venail, P.; Narwani, A.; Mace, G.M.; Tilman, D.; Wardle, D.A.; et al. Biodiversity loss and its impact on humanity. Nature 2012, 486, 59–67. [Google Scholar] [CrossRef] [PubMed]
- Duraiappah, A.; Naeem, S.; Agardy, T. Ecosystems & Human Well-Being: Biodiversity Synthesis; World Resources Institute: Washington, WA, USA, 2005. [Google Scholar]
- Mace, G.M.; Norris, K.; Fitter, A.H. Biodiversity and ecosystem services: A multilayered relationship. Trends Ecol. Evol. 2012, 27, 19–26. [Google Scholar] [CrossRef] [PubMed]
- Pereira, H.M.; Leadley, P.W.; Proenca, V.; Alkemade, R.; Scharlemann, J.P.W.; Fernandez-Manjarres, J.F.; Araujo, M.B.; Balvanera, P.; Biggs, R.; Cheung, W.W.L.; et al. Scenarios for Global Biodiversity in the 21st Century. Science 2010, 330, 1496–1501. [Google Scholar] [CrossRef] [PubMed]
- Schröter, M.; Barton, D.N.; Remme, R.P.; Hein, L. Accounting for capacity and flow of ecosystem services: A conceptual model and a case study for Telemark, Norway. Ecol. Indic. 2014, 36, 539–551. [Google Scholar] [CrossRef]
- Villamagna, A.M.; Angermeier, P.L.; Bennett, E.M. Capacity, pressure, demand, and flow: A conceptual framework for analyzing ecosystem service provision and delivery. Ecol. Complex. 2013, 15, 114–121. [Google Scholar] [CrossRef]
- Tittensor, D.P.; Walpole, M.; Hill, S.L.L.; Boyce, D.G.; Britten, G.L.; Burgess, N.D.; Butchart, S.H.M.; Leadley, P.W.; Regan, E.C.; Alkemade, R.; et al. A mid-term analysis of progress toward international biodiversity targets. Science 2014, 346, 241–244. [Google Scholar] [CrossRef] [PubMed]
- Millennium Ecosystem Assessment. Ecosystems and Human Well-Being Synthesis; Island Press: Washington DC, USA, 2014. [Google Scholar]
- UN Convention on Biological Diversity: Aichi Biodiversity Targets. Available online: https://www.cbd.int/sp/targets/ (accessed on 23 October 2015).
- Marques, A.; Pereira, H.M.; Krug, C.; Leadley, P.W.; Visconti, P.; Januchowski-Hartley, S.R.; Krug, R.M.; Alkemade, R.; Bellard, C.; Cheung, W.W.L.; et al. A framework to identify enabling and urgent actions for the 2020 Aichi Targets. Basic Appl. Ecol. 2014, 15, 633–638. [Google Scholar] [CrossRef]
- Fang, K.; Heijungs, R.; Duan, Z.; de Snoo, G. The Environmental Sustainability of Nations: Benchmarking the Carbon, Water and Land Footprints against Allocated Planetary Boundaries. Sustainability 2015, 7, 11285–11305. [Google Scholar] [CrossRef]
- Tukker, A.; Bulavskaya, T.; Giljum, S.; de Koning, A.; Lutter, S.; Simas, M.; Stadler, K.; Wood, R. Europe’s Environmental Footprints in a Global Context: A Structural Deficit in Resource Endowments. Better Decis.-Mak. Sustain. Dev. Life Cycle Assess. 2015. submitted. [Google Scholar]
- DG JRC. ILCD Handbook: Analysis of Existing Environmental Impact Assessment Methodologies for Use in Life Cycle Assessment. The International Reference Life Cycle Data System (ILCD); IES, DG Joint Research Centre, European Commission: Brussels, Belgium, 2010. [Google Scholar]
- German Federal Environment Agency (UBA). Ecologic Institute and Bosch & Partner Indicator-based Environmental Reporting; German Federal Environment Agency (UBA): Dessau, Germany, 2011. [Google Scholar]
- Hoekstra, A.Y.; Wiedmann, T.O. Humanity’s unsustainable environmental footprint. Science 2014, 344, 1114–1117. [Google Scholar] [CrossRef] [PubMed]
- Mudgal, S.; Tan, A.; Lockwood, S.; Eisenmenger, N.; Fischer-Kowalski, M.; Giljum, S.; Bruckner, M. Assessment of Resource Efficiency Indicators and Targets. Final Report Prepared for the European Commission, DG Environment; Contract Number 07.0307/2010/580623/ETU/C1 implementing Framework Contract number ENV.G.4/FRA/2008/0112; BIO Intelligence Service, Institute for Social Ecology, and Sustainable Europe Research Institute: Paris, France, 2012. [Google Scholar]
- NEF. Happy Planet Index: 2012 Report. A Global Index of Sustainable Well-Being; New Economic Foundation: London, UK, 2012; p. 25. [Google Scholar]
- European Commission. COMMISSION STAFF WORKING DOCUMENT. Progress on “GDP and Beyond” Actions. Volume 1 of 2; European Commission: Brussels, Belgium, 2013. [Google Scholar]
- European Commission. GDP and Beyond. Measuring Progress in a Changing World; Communication from the Commission to the Council and the European Parliament; European Commission: Brussels, Belgium, 2009. [Google Scholar]
- Leontief, W. Input-Output Economics; Oxford University Press: New York, NY, USA, 1986. [Google Scholar]
- Erb, K.H. Human Appropriation of NPP (HANPP). An Accounting Framwork for ana3lysing lan3d us3e proc3esses in the Earth sys3tem 2011. Available online: https://www.google.com.hk/url?sa=t&rct=j&q=&esrc=s&source=web&cd=1&ved=0ahUKEwik14GB54zLAhXJBiwKHWxFDOsQFggdMAA&url=https%3a%2f%2fwww.earthobservations.org%2fdocuments%2fmeetings%2f201102_ipcc_geoss%2f28_IPCC_GEOSS_Erb.ppt&usg=AFQjCNGXjd0zxrczgrUKovm01m3QIzN9MQ&sig2=6IJvQo-pyAwdMYZrAGZy5A&cad=rjt (accessed on 22 February 2016).
- Haberl, H.; Kastner, T.; Erb, K.H. HANPP and Embodied HANPP: A consistent accounting system to trace internal and trade-related pressures on ecosystems 2012. In Proceedings of the Institut de Ciència i Tecnologia Ambientals (ICTA), Catalonia, Spain, 31 October 2012.
- Erb, K.H.; Krausmann, F.; Gaube, V.; Gingrich, S.; Bondeau, A.; Fischer-Kowalski, M.; Haberl, H. Analyzing the global human appropriation of net primary production-processes, trajectories, implications. An introduction. Ecol. Econ. 2009, 69, 250–259. [Google Scholar] [CrossRef]
- Wiedmann, T.O.; Schandl, H.; Lenzen, M.; Moran, D.; Suh, S.; West, J.; Kanemoto, K. The material footprint of nations. Proc. Natl. Acad. Sci. USA 2015, 112, 6271–6276. [Google Scholar] [CrossRef] [PubMed]
- Hertwich, E.G.; Peters, G.P. Carbon Footprint of Nations: A Global, Trade-Linked Analysis. Environ. Sci. Technol. 2009, 43, 6414–6420. [Google Scholar] [CrossRef] [PubMed]
- Hoekstra, A.Y.; Chapagain, A.K. Water footprints of nations: Water use by people as a function of their consumption pattern. Water Resour. Manag. 2006, 21, 35–48. [Google Scholar] [CrossRef]
- EEA Eurostat: Environmental Data Centre on natural resources. Available online: http://www.eea.europa.eu/themes/waste/links/eurostat-environmental-data-centre-on (accessed on 23 October 2015).
- EEA Indicators. Available online: http://www.eea.europa.eu/data-and-maps/indicators/#c5=&c0=10&b_start=0 (accessed on 23 October 2015).
- EIONET. Towards a Set of Indicators on Sustainable Consumption and Production (SCP) for EEA reporting. Available online: http://scp.eionet.europa.eu/publications/SCP_Indicator_frame (accessed on 23 October 2015).
- Eurostat Sustainable Development Indicators. Available online: http://ec.europa.eu/eurostat/c/portal/layout?p_l_id=6938029&p_v_l_s_g_id=0 (accessed on 23 October 2015).
- European Commission. Europe 2020—Europe’s growth strategy. Available online: http://ec.europa.eu/europe2020/index_en.htm (accessed on 23 October 2015).
- UNEP. UNEP Year Book. Available online: http://www.unep.org/yearbook/ (accessed on 23 October 2015).
- OECD. OECD Statistics-Environment. Available online: http://stats.oecd.org/Index.aspx?themetreeid=7 (accessed on 23 October 2015).
- Eisenmenger, N.; Theurl, M.; Gierlinger, S.; Giljum, S.; Lutter, S.; Bruckner, M.; Deetman, S.; de Koning, A.; Kleijn, R.; Acosta-Fernández, J.; et al. DESIRE Development of a System of Indicators for a Resource Efficient Europe. D4.2 Final Report on Indicator Framework; Institute of Social Ecology: Vienna, Austria; Vienna University of Business and Economics: Vienna, Austria; CML Leiden University: Leiden, The Netherlands; Wuppertal Institute: Wuppertal, Germany, 2013. [Google Scholar]
- European Commission. IMPACT Assessment Guidelines; European Commission: Brussels, Belgium, 2009. [Google Scholar]
- Best, A.; Giljum, S.; Simmons, C.; Blobel, D.; Hammer, M.; Lewis, K.; Cavalieri, S.; Lutter, S.; Maguire, C. Potential of the Ecological Footprint for Monitoring Environmental Impacts from Natural Resource Use: Analysis of the Potential of the Ecological Footprint and Related Assessment Tools for Use in the EU’s Thematic Strategy on the Sustainable Use of Natural Resources; European Commission: Brussels, Belgium, 2008. [Google Scholar]
- Wiedmann, T.; Wilting, H.; Lutter, S.; Palm, V.; Giljum, S.; Wadeskog, A.; Nijdam, D. Development of a methodology for the assessment of global environmental impacts of traded goods and services. Available online: www.eipot.eu (accessed on 23 October 2015).


© 2016 by the authors; licensee MDPI, Basel, Switzerland. This article is an open access article distributed under the terms and conditions of the Creative Commons by Attribution (CC-BY) license (http://creativecommons.org/licenses/by/4.0/).
Share and Cite
Eisenmenger, N.; Giljum, S.; Lutter, S.; Marques, A.; Theurl, M.C.; Pereira, H.M.; Tukker, A. Towards a Conceptual Framework for Social-Ecological Systems Integrating Biodiversity and Ecosystem Services with Resource Efficiency Indicators. Sustainability 2016, 8, 201. https://0-doi-org.brum.beds.ac.uk/10.3390/su8030201
Eisenmenger N, Giljum S, Lutter S, Marques A, Theurl MC, Pereira HM, Tukker A. Towards a Conceptual Framework for Social-Ecological Systems Integrating Biodiversity and Ecosystem Services with Resource Efficiency Indicators. Sustainability. 2016; 8(3):201. https://0-doi-org.brum.beds.ac.uk/10.3390/su8030201
Chicago/Turabian StyleEisenmenger, Nina, Stefan Giljum, Stephan Lutter, Alexandra Marques, Michaela C. Theurl, Henrique M. Pereira, and Arnold Tukker. 2016. "Towards a Conceptual Framework for Social-Ecological Systems Integrating Biodiversity and Ecosystem Services with Resource Efficiency Indicators" Sustainability 8, no. 3: 201. https://0-doi-org.brum.beds.ac.uk/10.3390/su8030201