1. Introduction
The amount of energy consumption and CO
2 emission from the Korean construction industry accounts for 23% of the total industry energy consumption and 40% of the total CO
2 emission. As the greenhouse gas reduction goal of 37% below business-as-usual (BAU) by 2030, the construction industry is recognized as an anti-environment industry for mass consumption/mass waste; thus, it is necessary to make efforts to turn it to an environment-friendly industry [
1]. Considering that CO
2 emission per capita in Korea increased by 113% from 1990, which represents the largest increase in CO
2 emission among OECD countries, Korea also needs detailed environmental policies for CO
2 reduction. Because concrete, which is the main material used in the construction industry, emits a large amount of CO
2 during the production of raw materials such as cement, aggregate,
etc., research on CO
2 emission emitted from concrete production is direly needed.
The seven major building materials accounting for more than 90% of building greenhouse gas (GHG) emissions include concrete, a reinforcing rod, and section steel. Among the CO
2 emissions generated by these major building materials, concrete accounts for 70% [
2].
The types of concrete (mix design, strength) used varies according to building structure, building type and region. In the Republic of Korea, in particular, the concrete mix design significantly differs depending on whether the concrete is used inland or in a coastal area for prevention of chloride-induced corrosion. Therefore, an assessment of CO2 emission and an analysis of their characteristics against the concrete used in diverse construction sites is needed.
Therefore, the assessment of CO2 emission is very important for achieving the national-level CO2 reduction objective.
Recently, efforts to reduce CO
2 emission are being made through the use of procurement systems for low-CO
2-emission materials and the application of high-strength concrete at construction sites. As a part of such research, there is a demand for the establishment of a quantitative assessment method of CO
2 emission from concrete production to site procurement and a proposal of a CO
2 reduction plan at construction sites using this [
3].
This study attempts an assessment of CO2 emission against concrete among the major building materials and analyzes the characteristics on which building types (apartment, office) and regions (Seoul, Incheon, Ulsan) are dependent.
In addition, a CO2 emission reduction plan is proposed based on the result of the assessment of CO2 emission.
The concrete production was divided into the following stages: raw material, transportation, and manufacturing.
The input materials, transportation distance, and energy usage data of each stage were used for assessing CO2 emission.
The CO2 emission levels calculated as such were divided and based on material characteristics, building type, and local characteristics.
2. Literature Review
Kim
et al. [
4] analyzed the CO
2 emission reduction rate of long-life buildings using high durability and maintenance technologies for standard buildings. The CO
2 emission of the buildings was evaluated by dividing into construction, operation, maintenance/management, and dismantlement/disposal stage. Roh
et al. [
5] developed an embodied GHG assessment system for building materials in the Korea Green Building Certification System (G-SEED). For this purpose, green building certification systems and supporting assessment systems were analyzed in order to grasp the current trend of the GHG emission assessment on building materials. Roh
et al. [
6] developed and evaluated the applicability of an optimum design program for the CO
2 life cycle assessment (LCA) of a building that can be readily utilized during the planning and design phases. For this purpose, a database containing information about the CO
2-reducing performance and the cost of environmentally-friendly construction technologies that are applicable to apartment houses was constructed, and an interpretation program was built based on a simplified technique for assessing the life cycle CO
2 emission of an apartment house and the unit costs based on the inter-industry relation table. Yang
et al. [
7] analyzed a reliable procedure to assess the carbon dioxide (CO
2) uptake of concrete by carbonation during the service life of a structure and by the recycling of concrete after demolition. To generalize the amount of absorbable CO
2 per unit volume of concrete, the molar concentration of constituents in hardened cement paste was simplified as a function of the unit content of cement, and the degree of hydration of the cement paste was formulated as a function of the water-to-cement ratio. Kim
et al. [
8] evaluated the appropriateness and the reduction performance of the low-carbon-emission concrete mix design system and the deduced mix design results using an evolutionary algorithm (EA), the optimal mix design method, which minimizes the CO
2 emission of the concrete mix design. Park
et al. [
9] proposed a method to assess life cycle CO
2 emission using the compressive strength of concrete. The compressive strength of concrete used at construction sites was utilized to evaluate CO
2 emission. Additionally, comparisons according to the CO
2 characteristics of each concrete were also made.
Hasanbeigi
et al. [
10] analyzed the available information on process description, energy savings, environmental, and other benefits, costs, commercialization status, and references for emerging technologies to reduce the cement industry’s energy use and CO
2 emission. Ji
et al. [
11] proposed three methods (eco-efficiency, environmental priority strategy (EPS) system, and certified emission reduction (CER) price) to support the decision-making processes that simultaneously consider cost and CO
2 emission in acquiring an economical and environment-friendly design.
Yeo
et al. [
12] proposed an optimization approach developed with a view to allowing decision-makers to balance sustainability and economic objectives considering an RC frame under gravity and lateral loads. Gartner [
13] analyzed the practicality of replacing Ordinary Portland cements with alternative hydraulic cements that could result in lower CO
2 emission per unit volume of concrete. Fraile
et al. [
14] proposed a methodology for the selection of structural alternatives in residential buildings, in which CO
2 emission have been used as a measure of environmental impact, according to the proposal of CEN/TC-350.
Garcia
et al. [
15] endeavored to determine whether the reduction in producing emissions of blended cements compensates for the reduced durability and CO
2 capture. Miller
et al. [
16] investigated the influence of design age, in addition to mix proportions and geometric aspects, on the GWP (Global Warming Potential) associated with making beams, columns, and a concrete building frame. Lee
et al. [
17] investigated a sustainable development method such as material, service life, and reusability of concrete in terms of CO
2 balance (emission–absorption) and life cycle CO
2 of concrete to suppress the reckless development in pursuit of economic benefits.
Tae
et al. [
18] evaluated the environmental performance of high-strength concrete used in high-rise buildings as a material of environmental load reduction. Yepes
et al. [
19] described a methodology to optimize cost and CO
2 emission when designing precast concrete road bridges with a double U-shape cross-section. To this end, a hybrid glowworm swarm optimization algorithm was used to combine the synergy effect of the local search with simulated annealing and the global search with glowworm swarm optimization.
3. Methodology of CO2 Life Cycle Assessment for Concrete
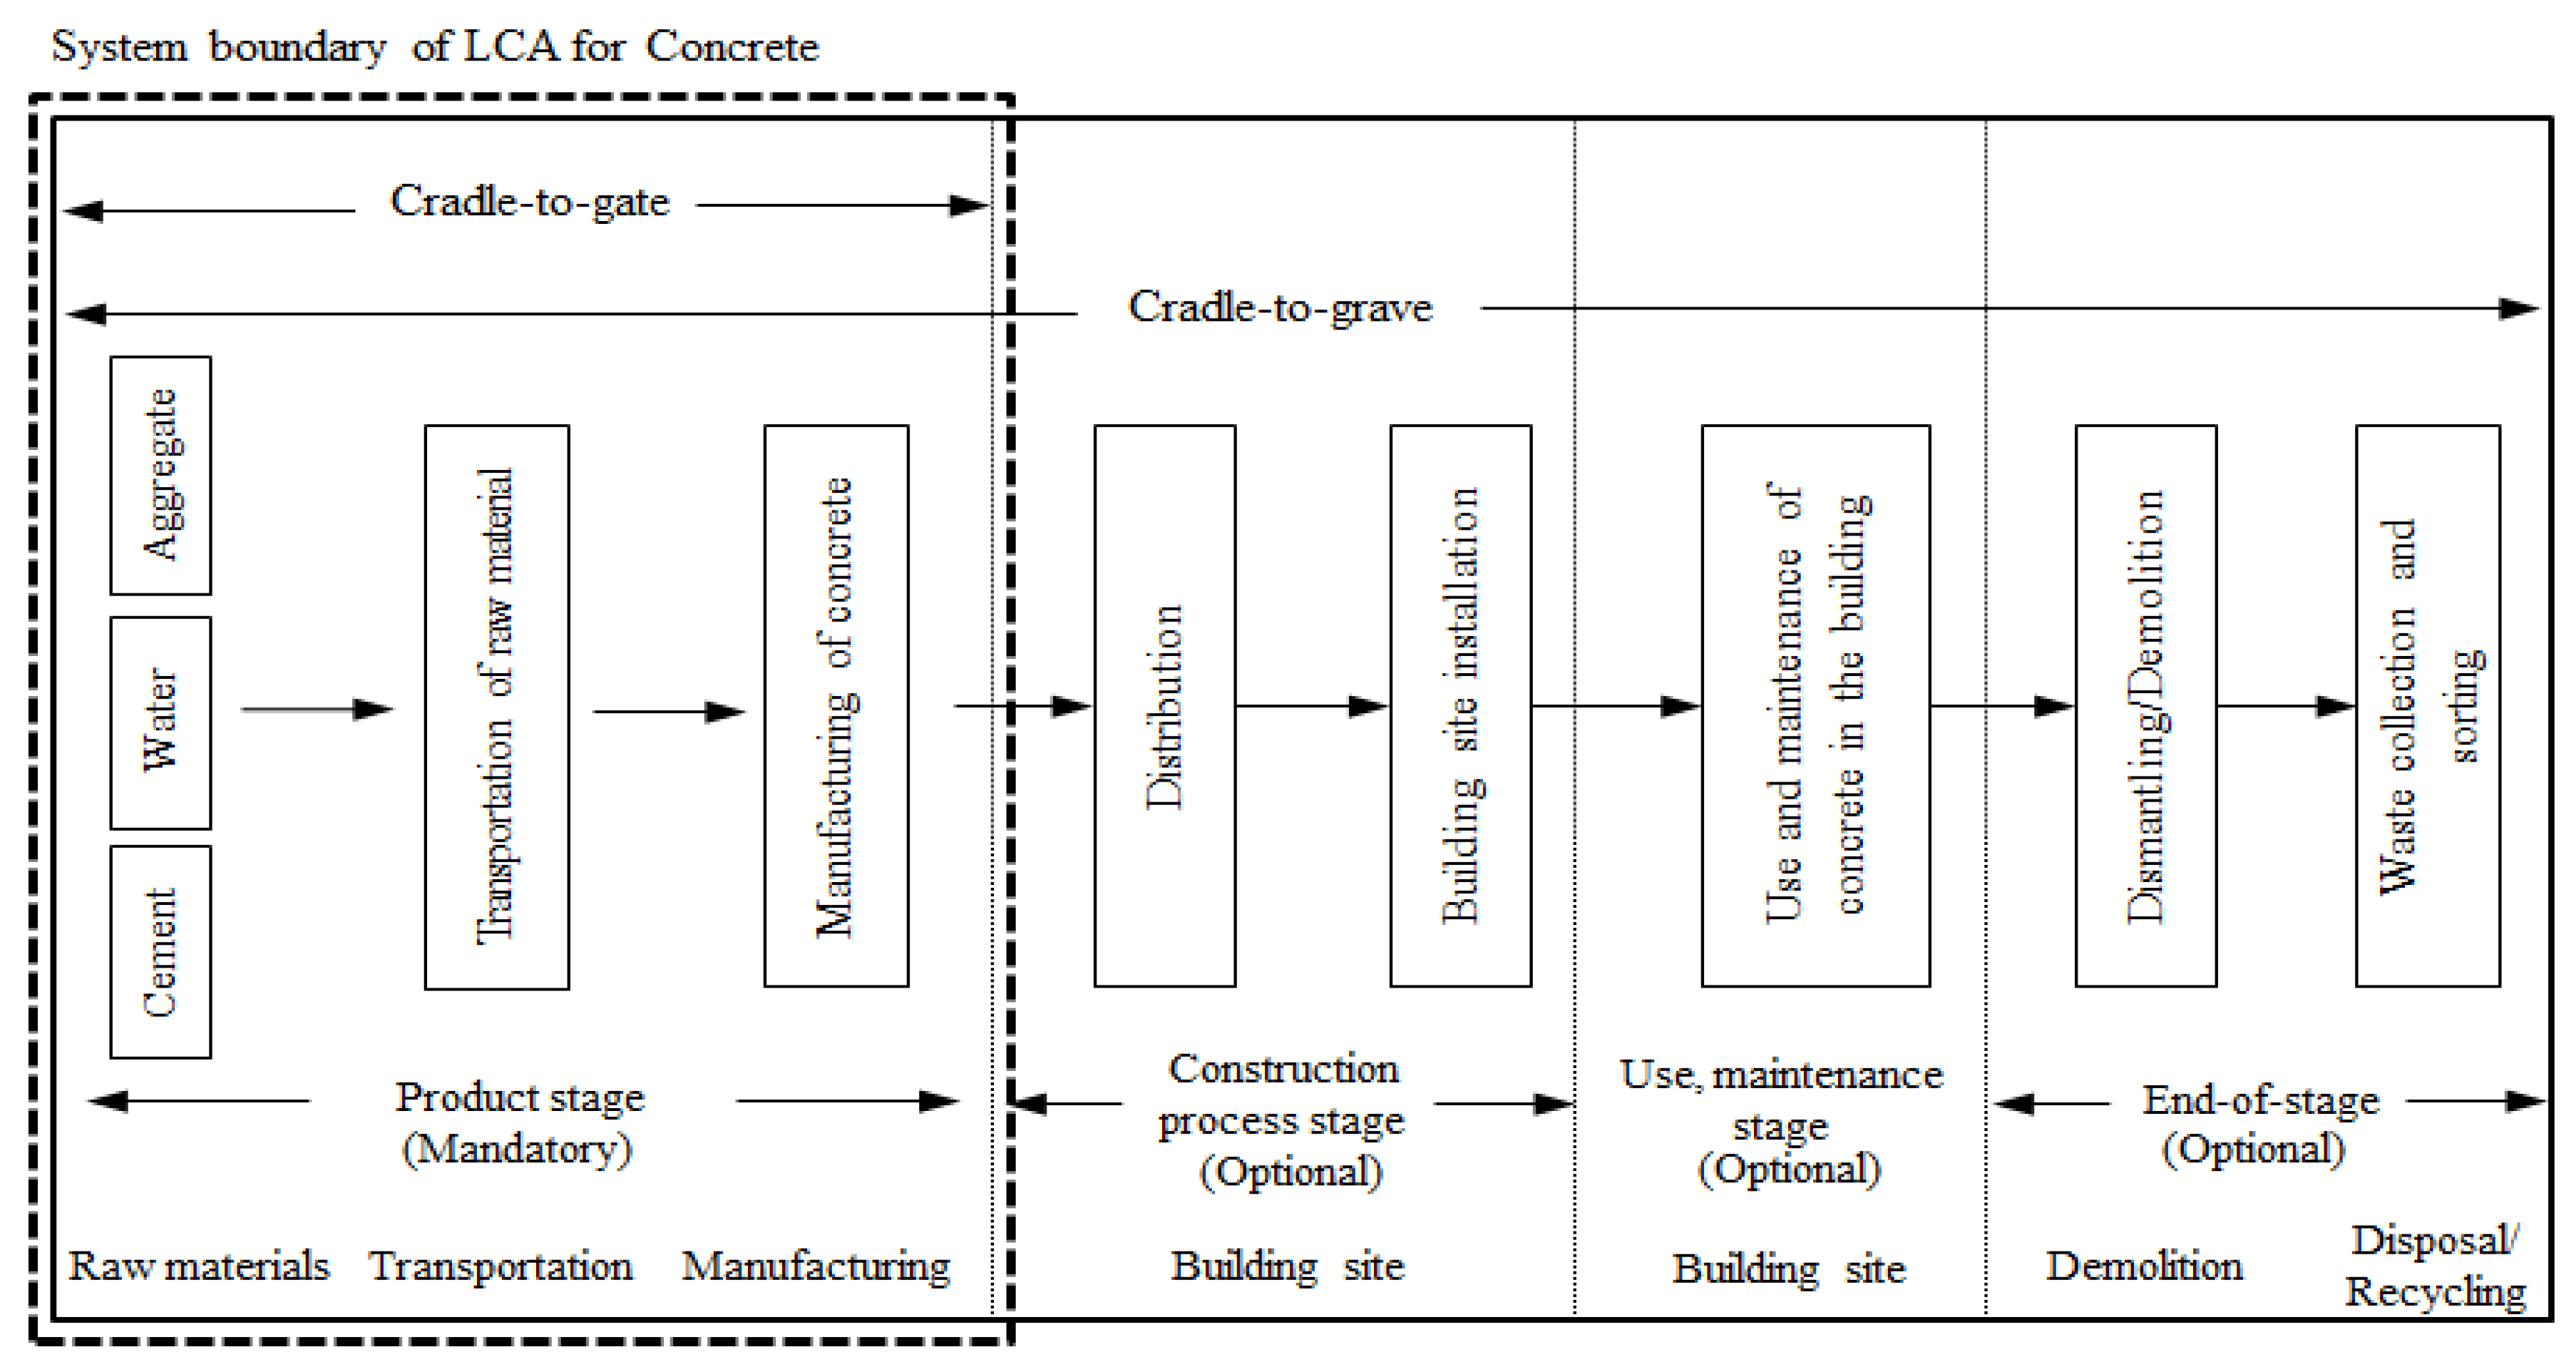
A system boundary was established for the life cycle CO
2 emission evaluation of concrete. The system boundary was selected as the product stage of concrete (cradle to gate) based on ISO 14044 [
20] and ISO 21930 [
21]. The product stage of concrete is divided into the raw material stage, the transportation stage, and the manufacturing stage [
22]. The raw material stage refers to CO
2 emission during the production of major components of concrete such as cement, aggregate, and water. The transportation stage’s CO
2 emission occurs during the transportation of raw materials to the ready-mixed concrete manufacturing plant. The manufacturing stage’s CO
2 emission comes from electricity and oil used in the concrete batch plant. The system boundary for life cycle CO
2 emission of concrete is shown in
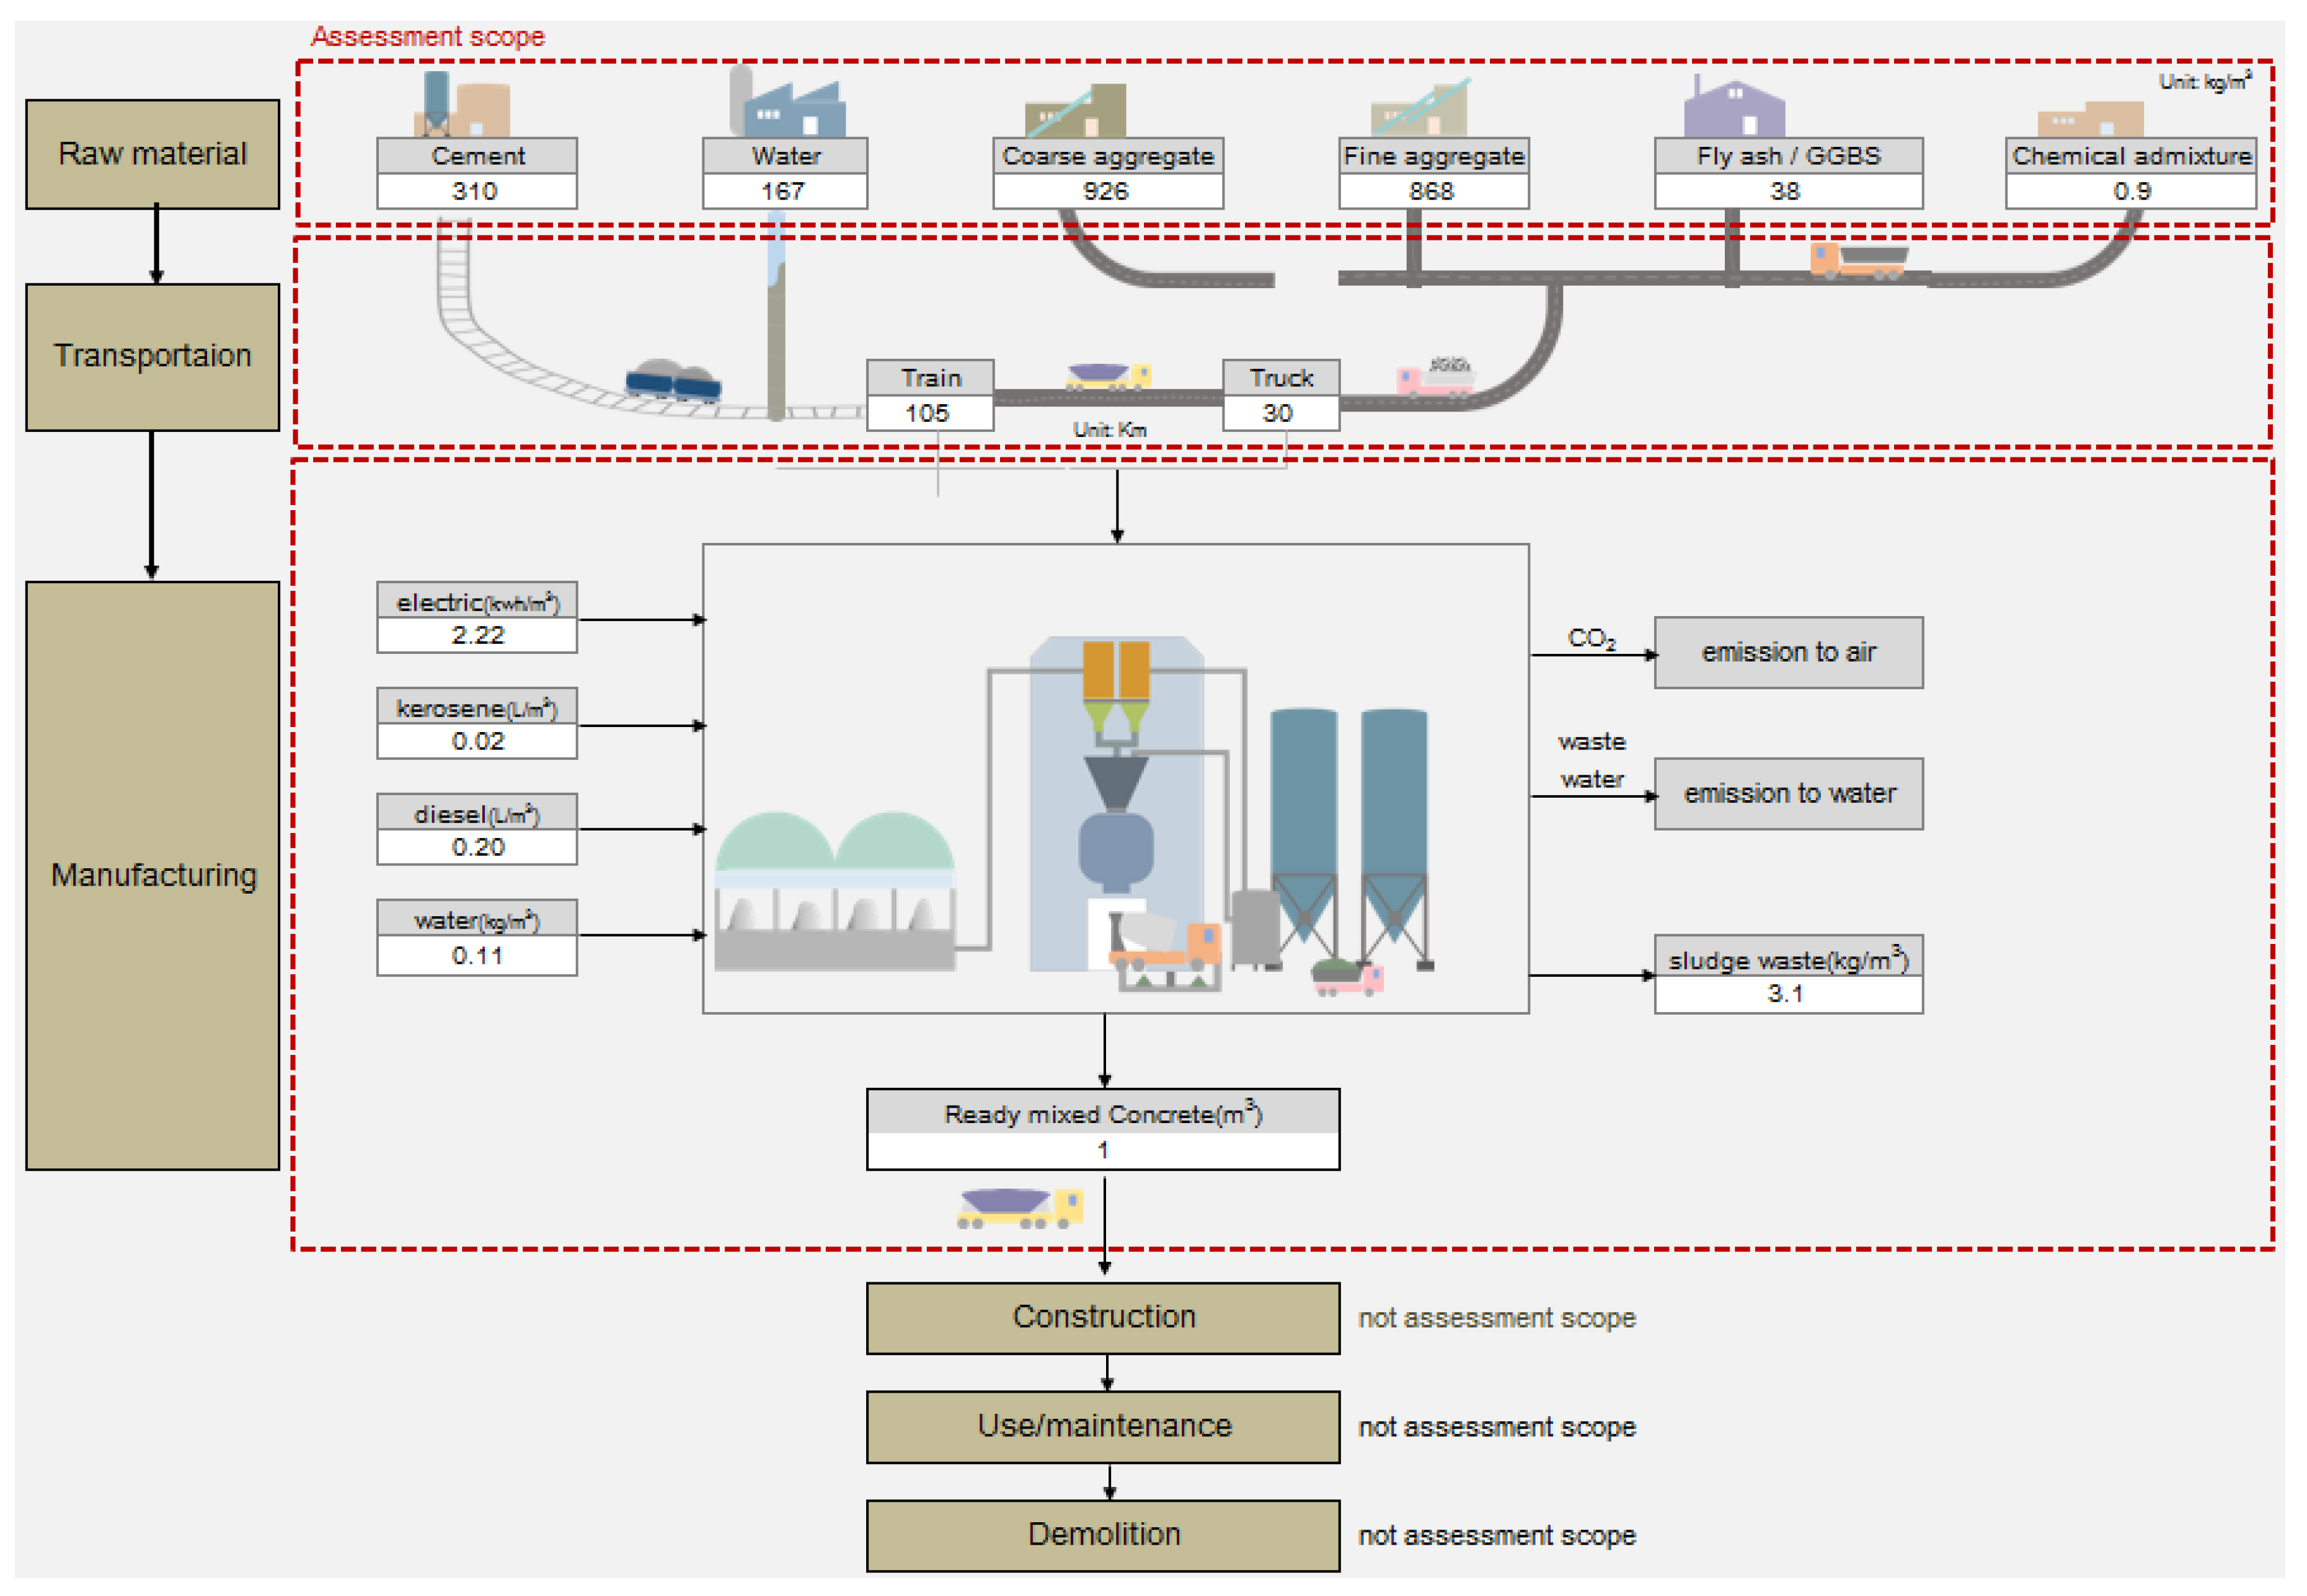
Figure 1. Also,
Figure 2 is the production process of concrete.
3.1. Raw Material
CO
2 emission from concrete production was calculated as the sum of the quantity of each ingredient used for producing 1 m
3 of concrete and the CO
2 emission factor. The CO
2 emission factor for cement, aggregate, and water were based on the Korea LCI DB (Life Cycle Inventory DataBase). In addition, blast-furnace slag, fly ash, and chemical admixtures, which are not database units in Korea, were applied to the overseas LCI DB [
23,
24]. Equation (1) is used for calculating the CO
2 emission during the production of the raw material required for manufacturing 1 m
3 of concrete.
Table 1 lists the CO
2 emission reference of each ingredient.
CO
2M is the CO
2 emission quantity at the raw material stage for the production of a unit of concrete [kg-CO
2/m
3], M(i) is the amount of material used [kg/m
3] of concrete, and CO
2 emission factor M is the CO
2 emission factor [kg-CO
2/kg] for each material.
3.2. Transportation
For assessing the CO
2 emission due to transportation, the total quantity used and the load for each component were measured to calculate the number of vehicles required for transportation. The calculated number of vehicles, the distance, and the fuel efficiency of each vehicle were used for assessing the CO
2 emission. In this study, the truck’s speed and traffic were not considered. Equation (2) is used for calculating the CO
2 emission during the transportation process.
Table 2 lists the CO
2 emission reference of each transportation method.
Here, CO2T is the quantity of CO2 emitted during the transportation of a unit of produced concrete [kg-CO2/m3], M(i) is the amount of material used [kg/m3] in the concrete, Lt is the transportation load [tons], d is the transportation distance [km], e is the fuel efficiency [km/L], and CO2 emission factor T is the CO2 emission factor [kg-CO2/kg] of the energy resource.
3.3. Manufacturing
The CO
2 emitted from concrete manufacturing can be calculated using the amount of energy consumed by the manufacturing equipment for producing 1 m
3 of concrete and converting that to CO
2. For this approach, the concrete manufacturing process must be divided, and the consumed energy must be calculated. The concrete manufacturing process can be divided into the following five stages: loading, storage, transportation, measurement for mixing, and mixing. The equipment required, the data related to the power, and the fossil fuel energy consumed in each stage are examined; then, by analyzing the ratio between the capacity of each piece of equipment and the total amount of electricity used, the energy consumed for manufacturing 1 m
3 of concrete can be calculated. Equation (3) is used for calculating the CO
2 emission during the manufacturing process, and
Table 3 lists the CO
2 emission reference of energy source.
Here, CO2F is the amount of CO2 emitted during the concrete manufacturing stage for producing a unit of concrete [kg-CO2/m3], R denotes the annual RMC production [m3/year], E(i) denotes the annual energy usage [unit/year], and CO2 emission factor F is the CO2 emission factor [kg-CO2/kg] of an energy resource.
4. Analysis of CO2 Emission for Concrete
The analyzed buildings were constructed in South Korea. These include three office buildings, four multipurpose buildings, and three apartment buildings; three of 10 buildings are located in Seoul, one in Busan, and 6 in Incheon. The characteristics of each project are summarized in
Table 4. Moreover, the CO
2 emission of concrete using construction projects was evaluated by the methodology of CO
2 life cycle assessment for concrete.
Assessment results were analyzed separately by the material type, the building type, and the local characteristics [
25,
26,
27].
4.1. Material Characteristics
Material characteristics can be interpreted based on multiple variables such as strength, slump and flow, project, building usage, region,
etc. The slump and flow of concrete did not have a large influence on CO
2 emission for the same compressive strength. This is because, generally, for the same slump and flow, water-reducing admixture and other similar materials are used for controlling slump and flow rather than material mixture. Therefore, a comparison of the same compressive strength concrete for multiple projects as a variable does not consider the “mixture per project” variable. In cases where the installation parts are different and strengths are the same, such as concrete for structure part installation or concrete for basis installation, the differences of slump and flow for the concrete may be compared. However, generally, in such cases, this is the reason for the difference in strength rather than differences in slump and flow for the case of using different installation parts when selecting concrete strength at a construction site [
28].
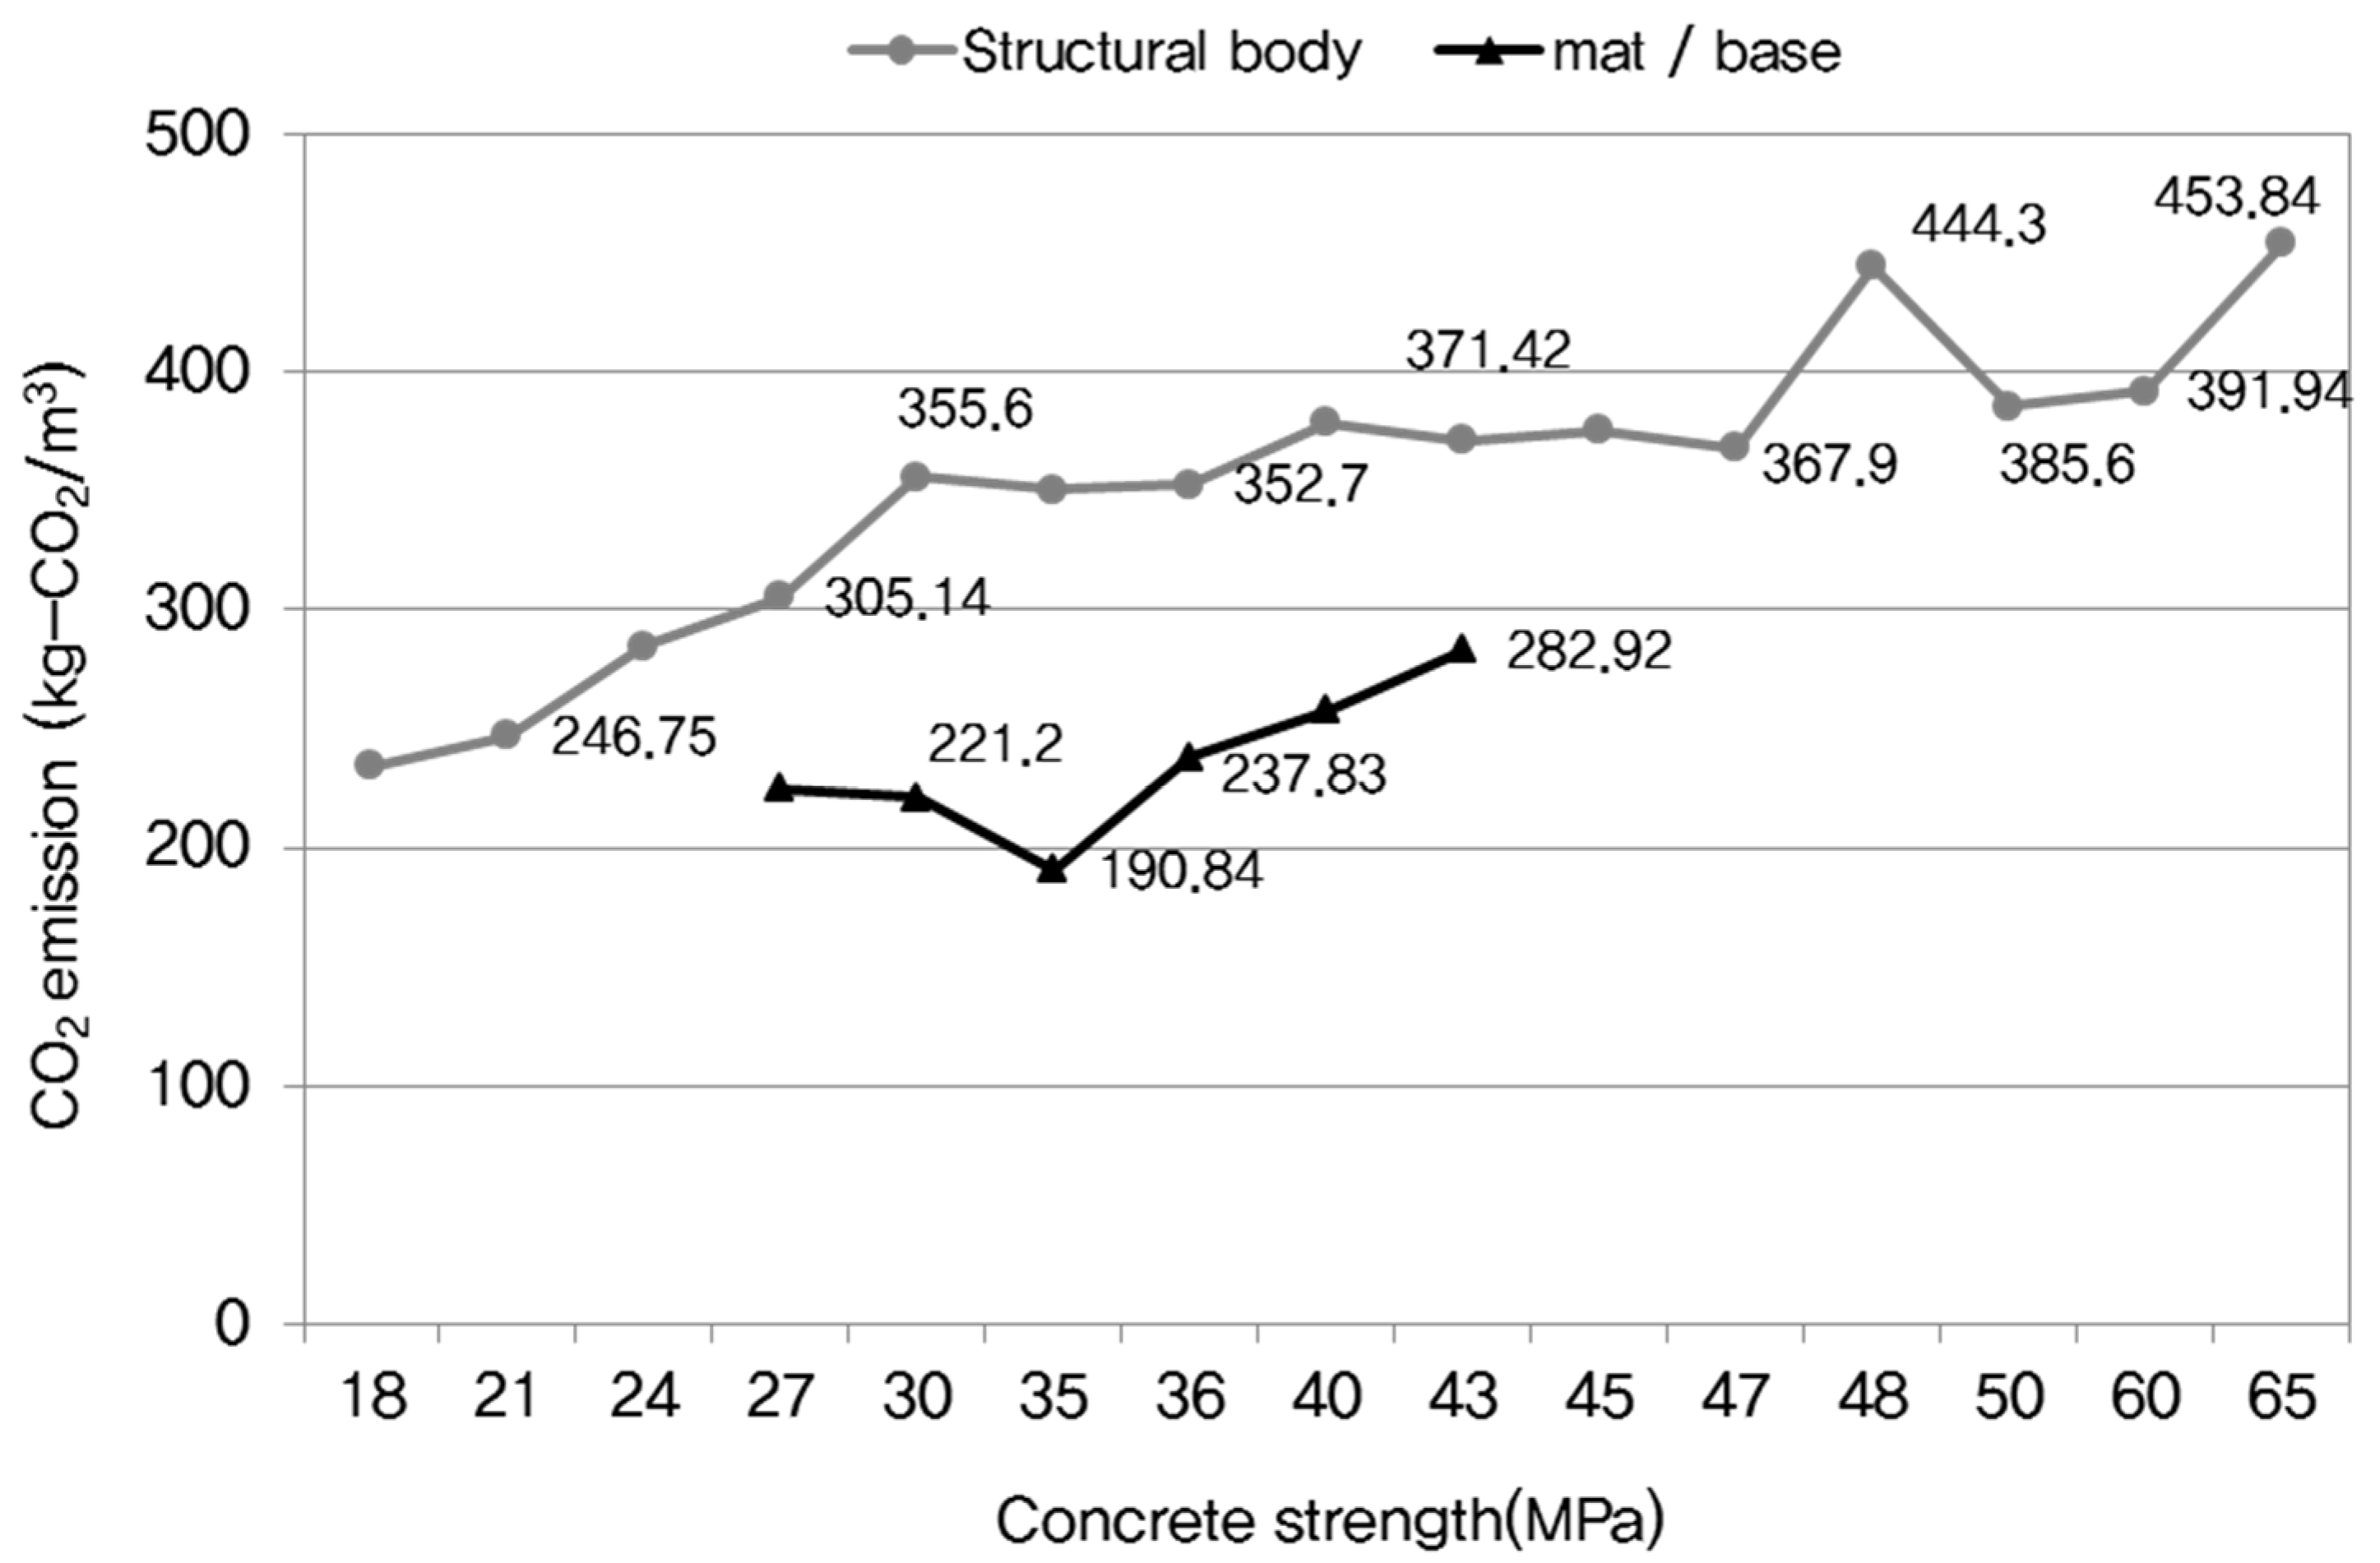
The analysis of CO
2 emission was divided into the structure part and basis part. This is because much of the cement is substituted with blast-furnace slag for reducing heat generation during hydration to ensure that the CO
2 emission is very low. The compressive strength of concrete using the projects can be divided into 16 levels ranging from 18 MPa to 65 MPa, and further in terms of slump and flow; thus, in total, 41 comparison factor data can be obtained. According to
Figure 3, with regard to the concrete used for structure as well as the basis, the CO
2 emission tends to increase with the strength; however, the increase in the latter case is 10% lower than that in the former case. This is because the concrete used for the basis contains a relatively lower amount of cement for hydration heat reduction, and admixture such as blast-furnace slag is added. As for the basis part, 60-MPa concrete results in 1.5-times higher CO
2 emission than 24-MPa concrete. As for the structures part, both blast-furnace slag and cement showed the same rate at 10%; in the case of the basis, the cement was substituted with ground granulated blast-furnace slag (GGBS). The reason for using a large quantity of blast-furnace slag is because the corporate policy of the assessment target construction company involves the usage of blast-furnace slag, and this usage was executed under a thorough concrete quality management and mix management scheme.
In the case of the O-S-12 and O-S-19 projects, both using concrete of 18-Mpa strength, the total amount of material for 1 m
3 of RMC were almost similar at 2311 kg and 2323 kg, respectively, but there was a difference of about 38 kg-CO/m
3 in their respective CO
2 emission levels, which stood at 252 kg-CO/m
3 and 214.80 kg-CO/m
3, respectively. This is because the amounts of cement used for these projects were 227 kg/m
3 and 182 kg/m
3, respectively, with blast-furnace slag and fly ash accounting for the difference. In the case of the same strength, the total mixed quantities of cement, aggregate, blast-furnace slag, and fly ash were similar, but the amount of cement used caused the difference in CO
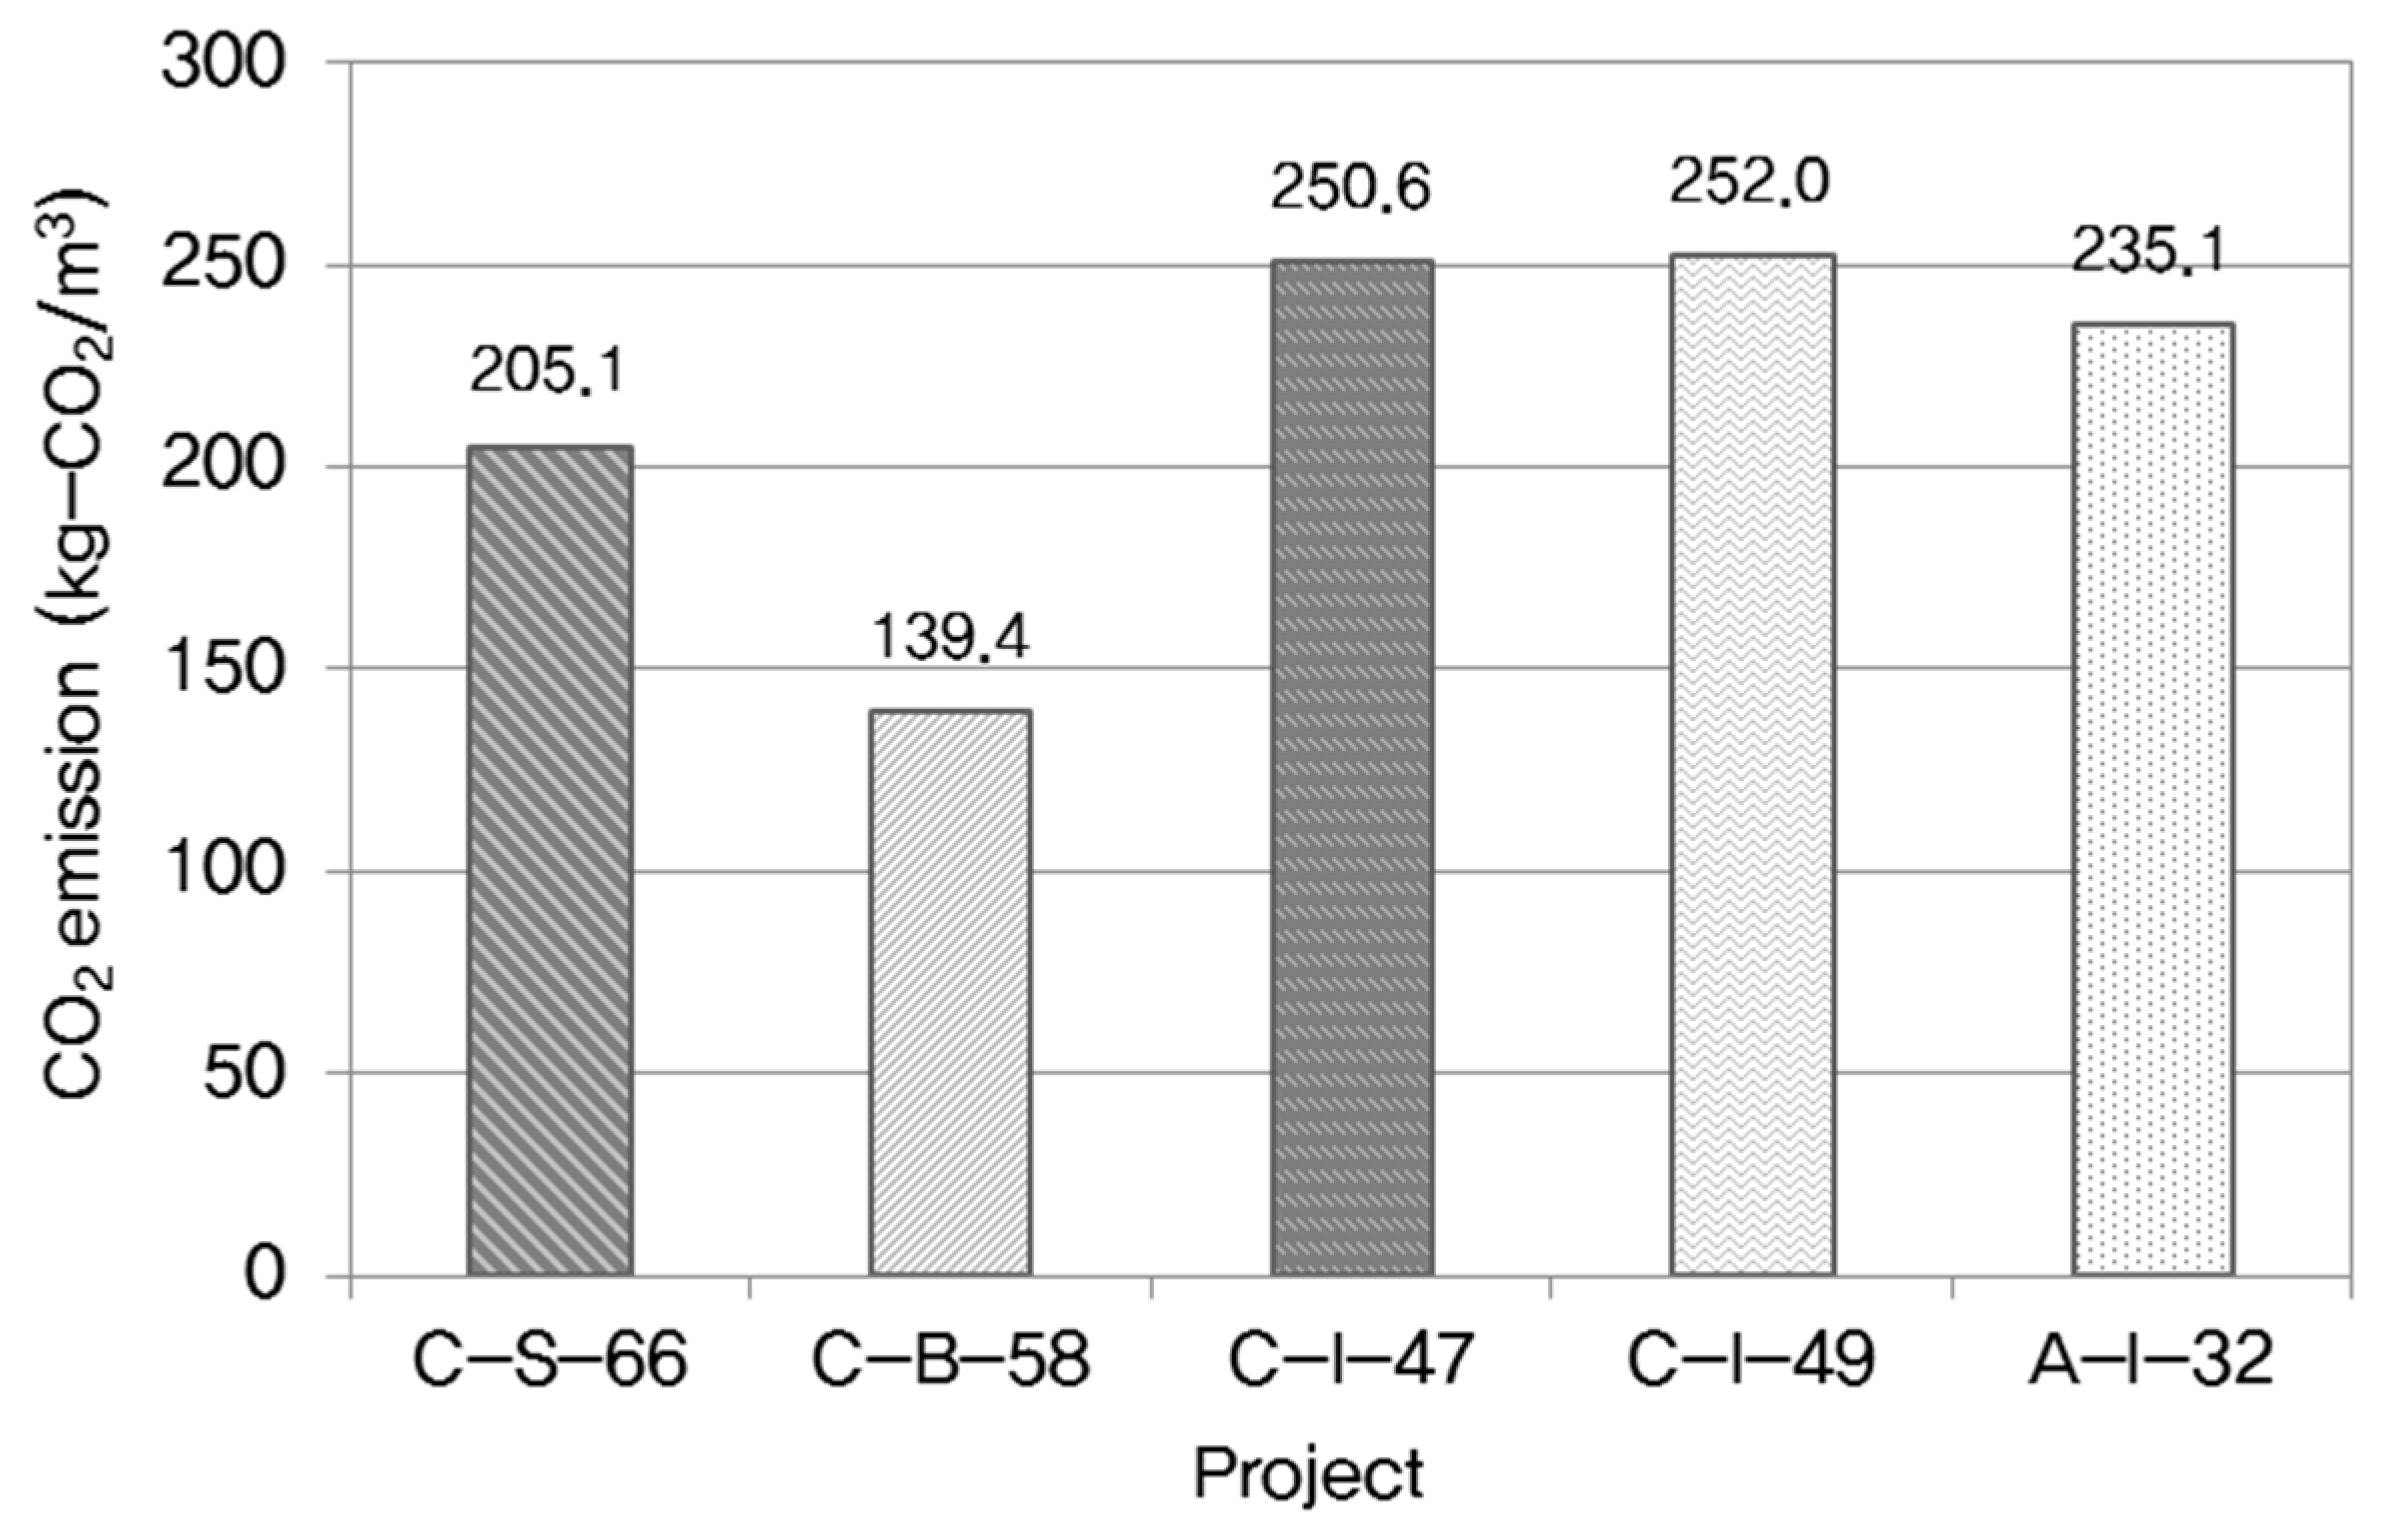
2 emission. Furthermore, RMC of the 25-30-500 standard was used in the following 5 projects as shown in
Figure 4: C-S-66, C-B-58, C-I-47, C-I-49, and A-I-32. Even for the same strength and slump, there were differences based on the installation part as in the cases of C-S-66 and C-B-58. Furthermore, and for cases such as C-S-66 and C-I-47, which were of the same type and had the same installation location, local differences led to the proposal of a mix design with increased use of fly ash for increasing resistance to salt attack, as is suited to coastal regions. In the case of the C-B-58 project, the material-stage emission was low because all cement was substituted with blast-furnace slag cement and blast-furnace fine particles, as can be inferred from
Table 5, which compares the various multipurpose projects considered. This is because the C-B-58 project mixed through technological review to reduce hydration heat and save costs during the installation of basic mat concrete.
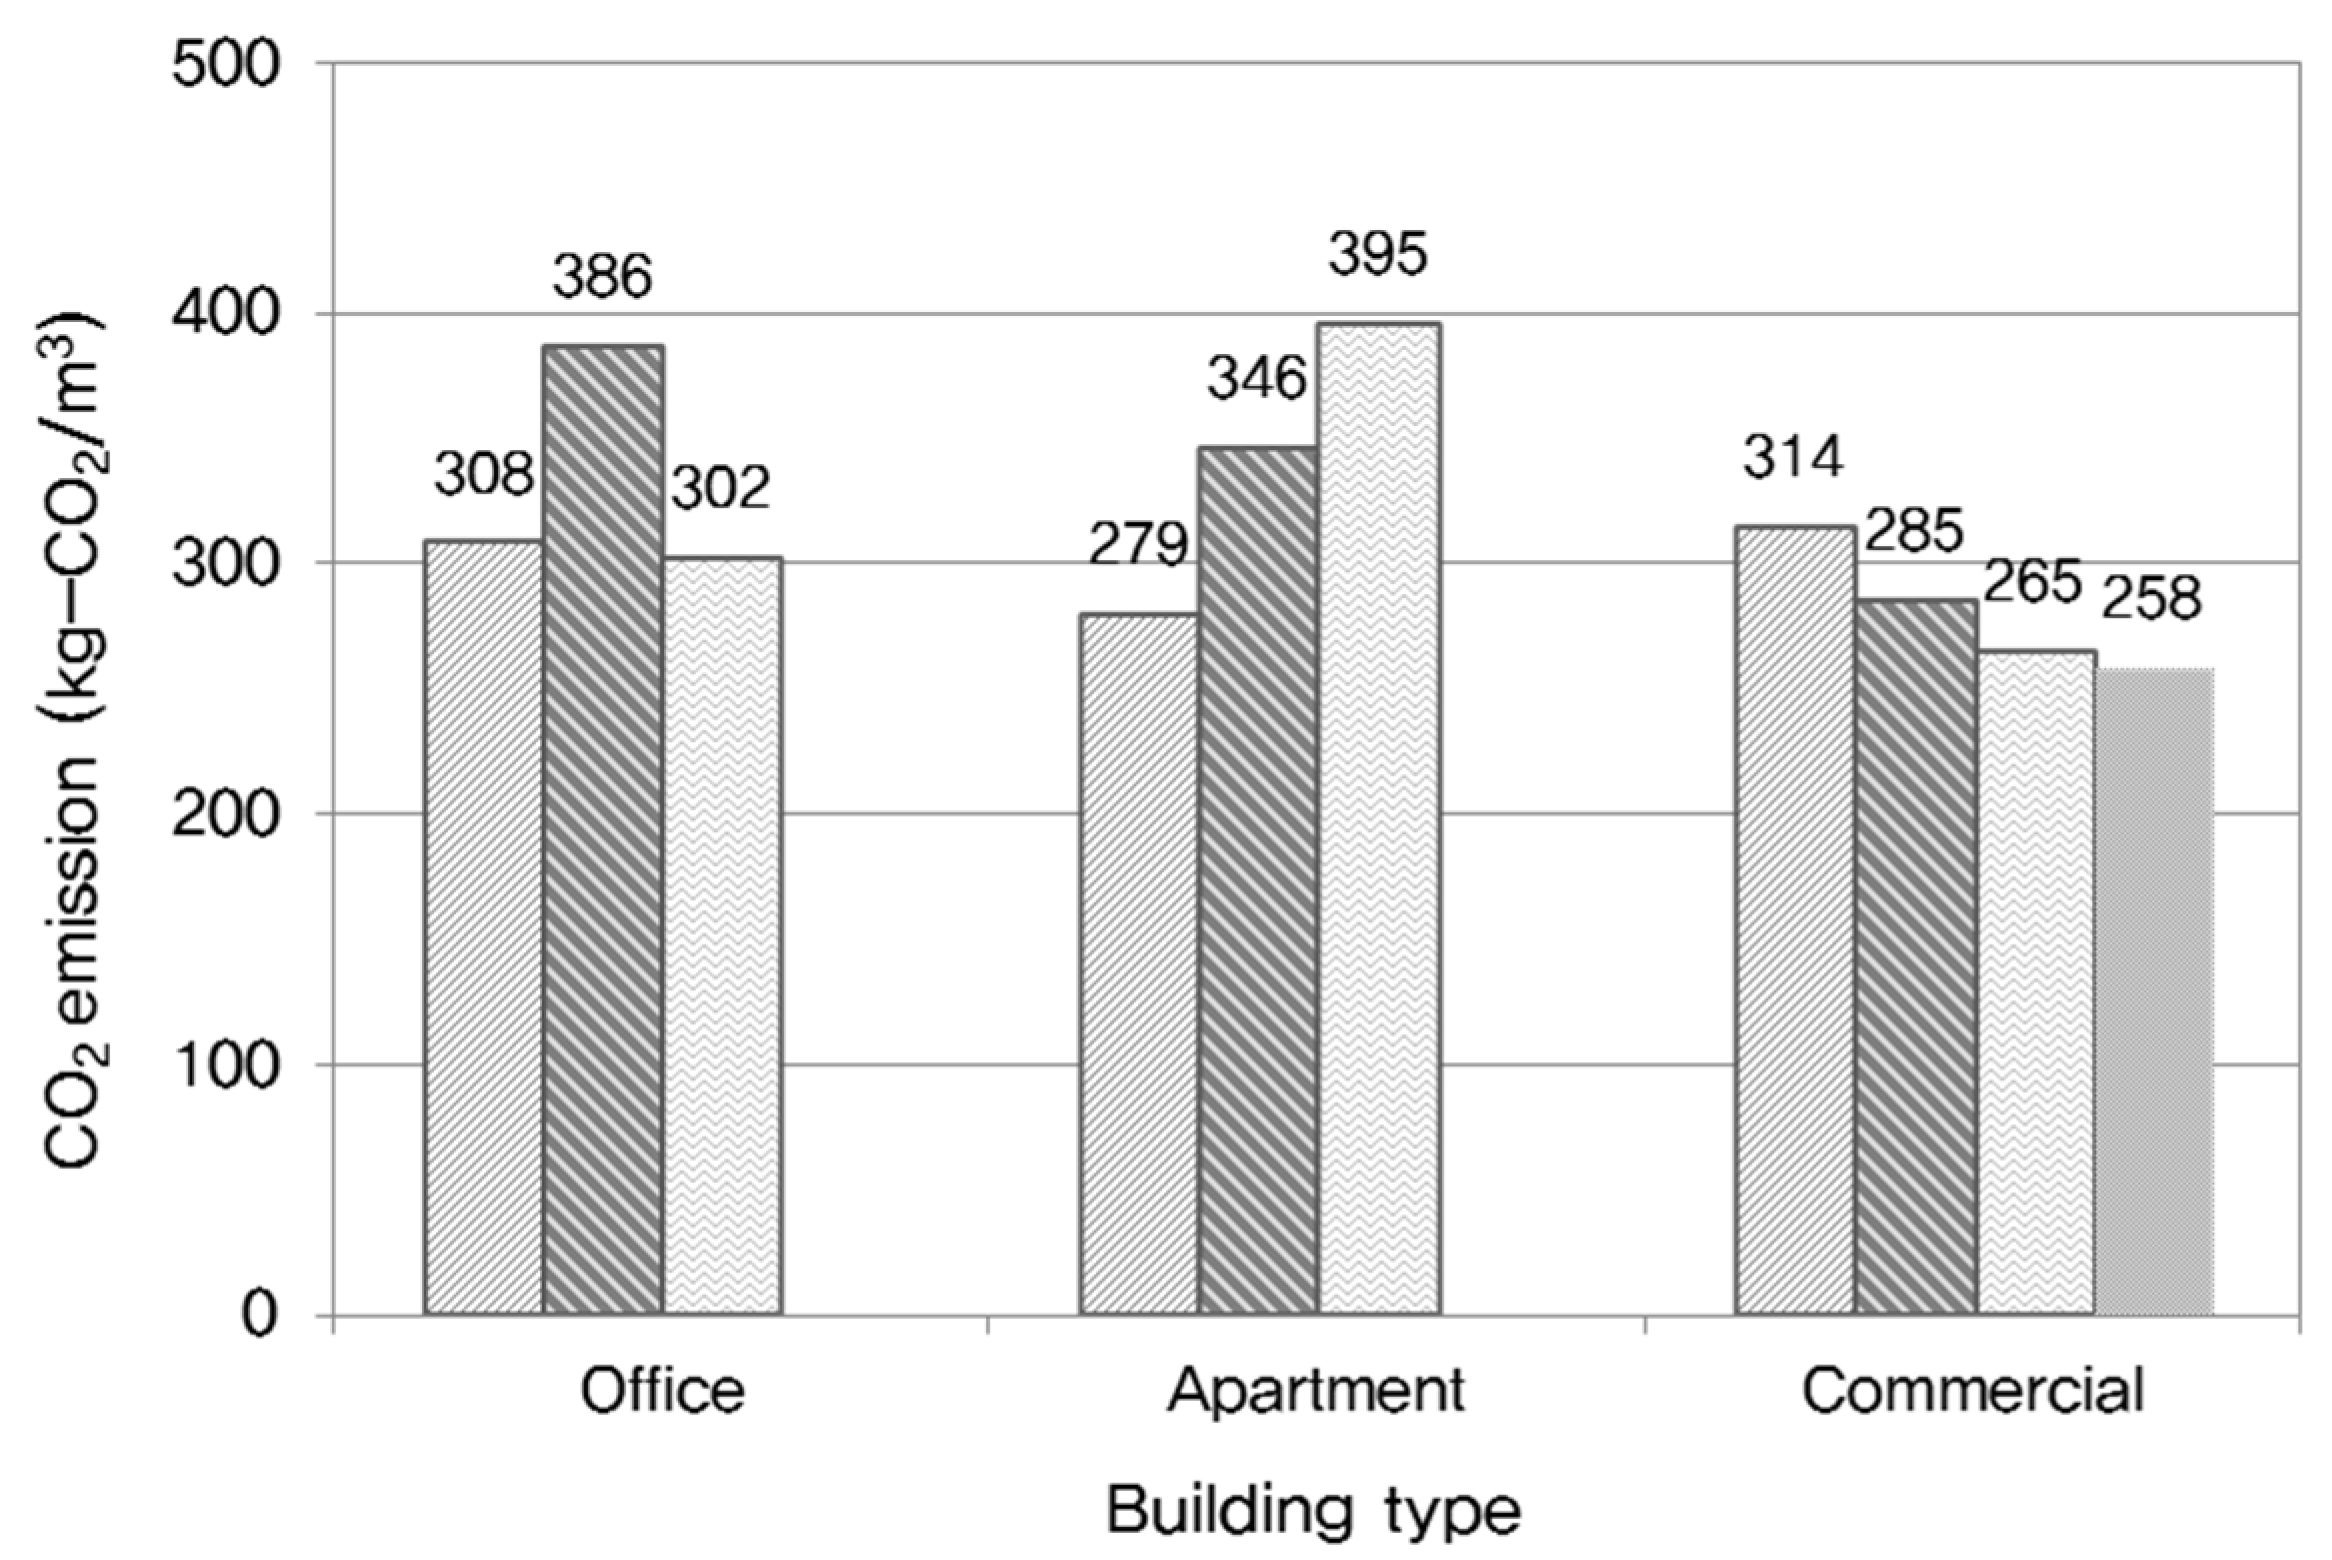
4.2. Building Type Characteristics
The characteristics of each building type are shown in
Figure 5. For apartment buildings and offices, the CO
2 emission levels were similar, and multipurpose buildings had the lowest emissions overall. The increase in concrete strength led to an increase in CO
2 emission, but the multipurpose buildings using high-strength concrete emitted lower CO
2 than the other building types. This is because offices and apartment buildings used a higher amount of cement for high-strength concrete, whereas multipurpose buildings used an increased amount of blast-furnace ash or fly ash. For multipurpose buildings, the concrete installation cycle is very important, owing to their sizes and characteristics. Thus, multipurpose buildings warrant a considerable daily installation effort, which involves mixing against hydration heat, leading to different CO
2 emission levels. The reason that offices have less CO
2 emission than apartments is the decrease in concrete volume (m
3) by applying high-strength concrete to office design [
29,
30].
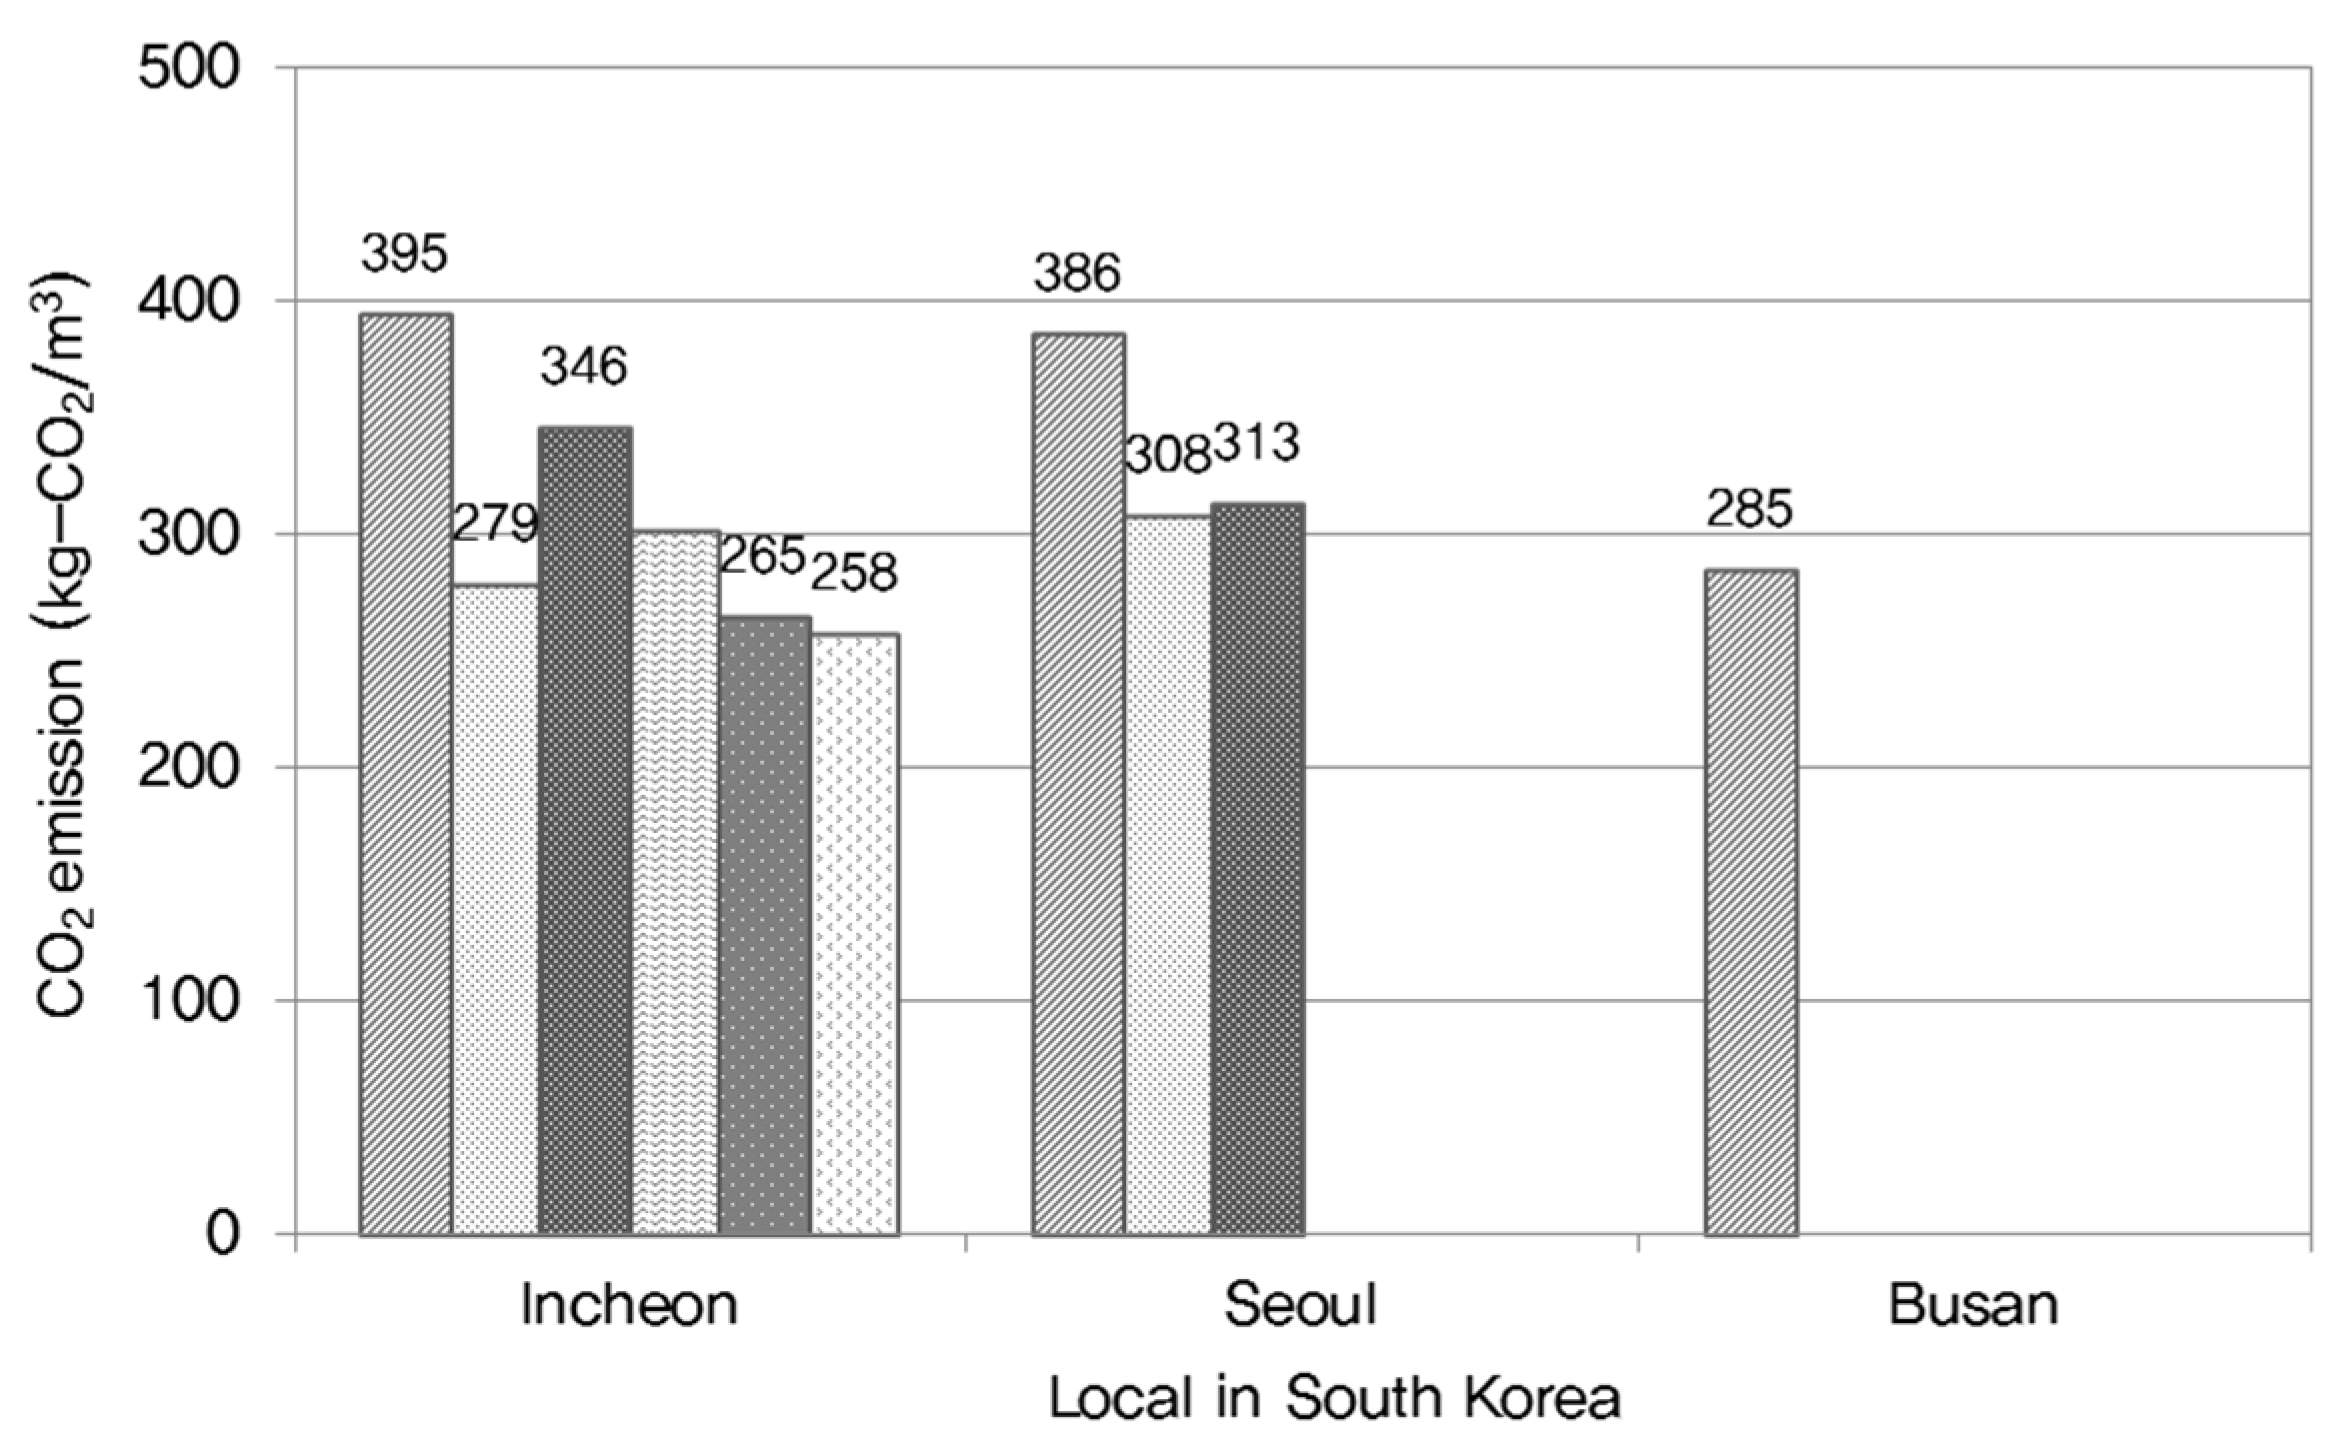
4.3. Local Characteristics
As shown in
Figure 6, Seoul was found to have higher CO
2 emission compared to Incheon and Busan; Busan has just one case of an ultra-high-rise multipurpose building using high-liquidity RMC, so it should be excluded. In the comparison of Seoul and Incheon, it can be seen that the CO
2 emission of the former are higher than the latter by about 27 (kg-CO
2/m
3). This is partly because Incheon has a greater distribution of multipurpose buildings with low CO
2 emission than Seoul does; furthermore, a greater amount of blast-furnace slag was used in Incheon for increasing the structure resistance to salt attack, since Incheon is a coastal city.
When analyzed for multipurpose buildings in each area, the Incheon-area ones have lower emissions than those in the other areas; this can be attributed to the salt-attack-resistant mix used in the region. As for the difference in CO
2 emission during the transportation stage among the three areas, the RMC company of the Incheon area mostly used local materials for aggregate, admixture, and compound except cement; similarly, the Seoul-area projects used aggregate from Seoul but admixture/compound from Incheon, thus resulting in lower CO
2 emission than the Busan-area projects [
31,
32].
5. Impact Analysis of the CO2 Emission on Construction Planning
The CO2 reduction plan according to the analysis of these 10 projects was applied to the construction site. This site is an RC structure office building with a gross area of 219,000 m2 located in South Korea.
It contains four buildings with 5 underground floors and 12 aboveground floors as shown
Table 6.
The work done on site included a proposed plan for the pillar design change of the above project, where the original design strength was 30 MPa at 1532 m
3, and an SRC structure, as summarized in
Table 7. The steel frame was deleted from the structure, and the structure itself was changed to the RC-type using high-strength concrete, for which the quantity of each material was compared for ALT 1 and 2. In the case of ALT 1, the pillar size was maintained at 800 mm × 800 mm, but high-strength concrete was used, and steel rebar was increased in addition to the removal of the steel frame. In the case of ALT 2, dimensions of the underground pillar were changed to 1100 mm × 800 mm, and the ground floor was maintained at 800 mm × 800 mm, but high-strength concrete was used for reducing the amount of concrete required. In this assessment, the method described above was applied, as summarized in
Table 8. Here, CO
2 emission per m
3 of each RMC used an average value for 30 MPa, while the mixtures of strengths 45 MPa and 50 MPa used much admixture, such as blast-furnace slag. Thus far, the mix design of this project shows that more cement has been used than the blast-furnace slag, but as the framework progresses, the proportion of blast-furnace slag used will increase. The basic unit CO
2 emission of steel rebar and steel frame was assessed using data obtained through inter-industry analysis. The above items were analyzed for the application of eco-friendly construction methods and V.E. to the target project, and it is expected to be applicable across all processes if further studies based on this study are executed and methods for reducing CO
2 emission are developed.
Table 7 lists the quantities of increase/decrease of RMC, steel rebar, and steel frame in the revised plan compared to those in the original, and
Table 9 lists the CO
2 emission deduced by applying the CO
2 basic unit per material to this quantity [
33,
34].
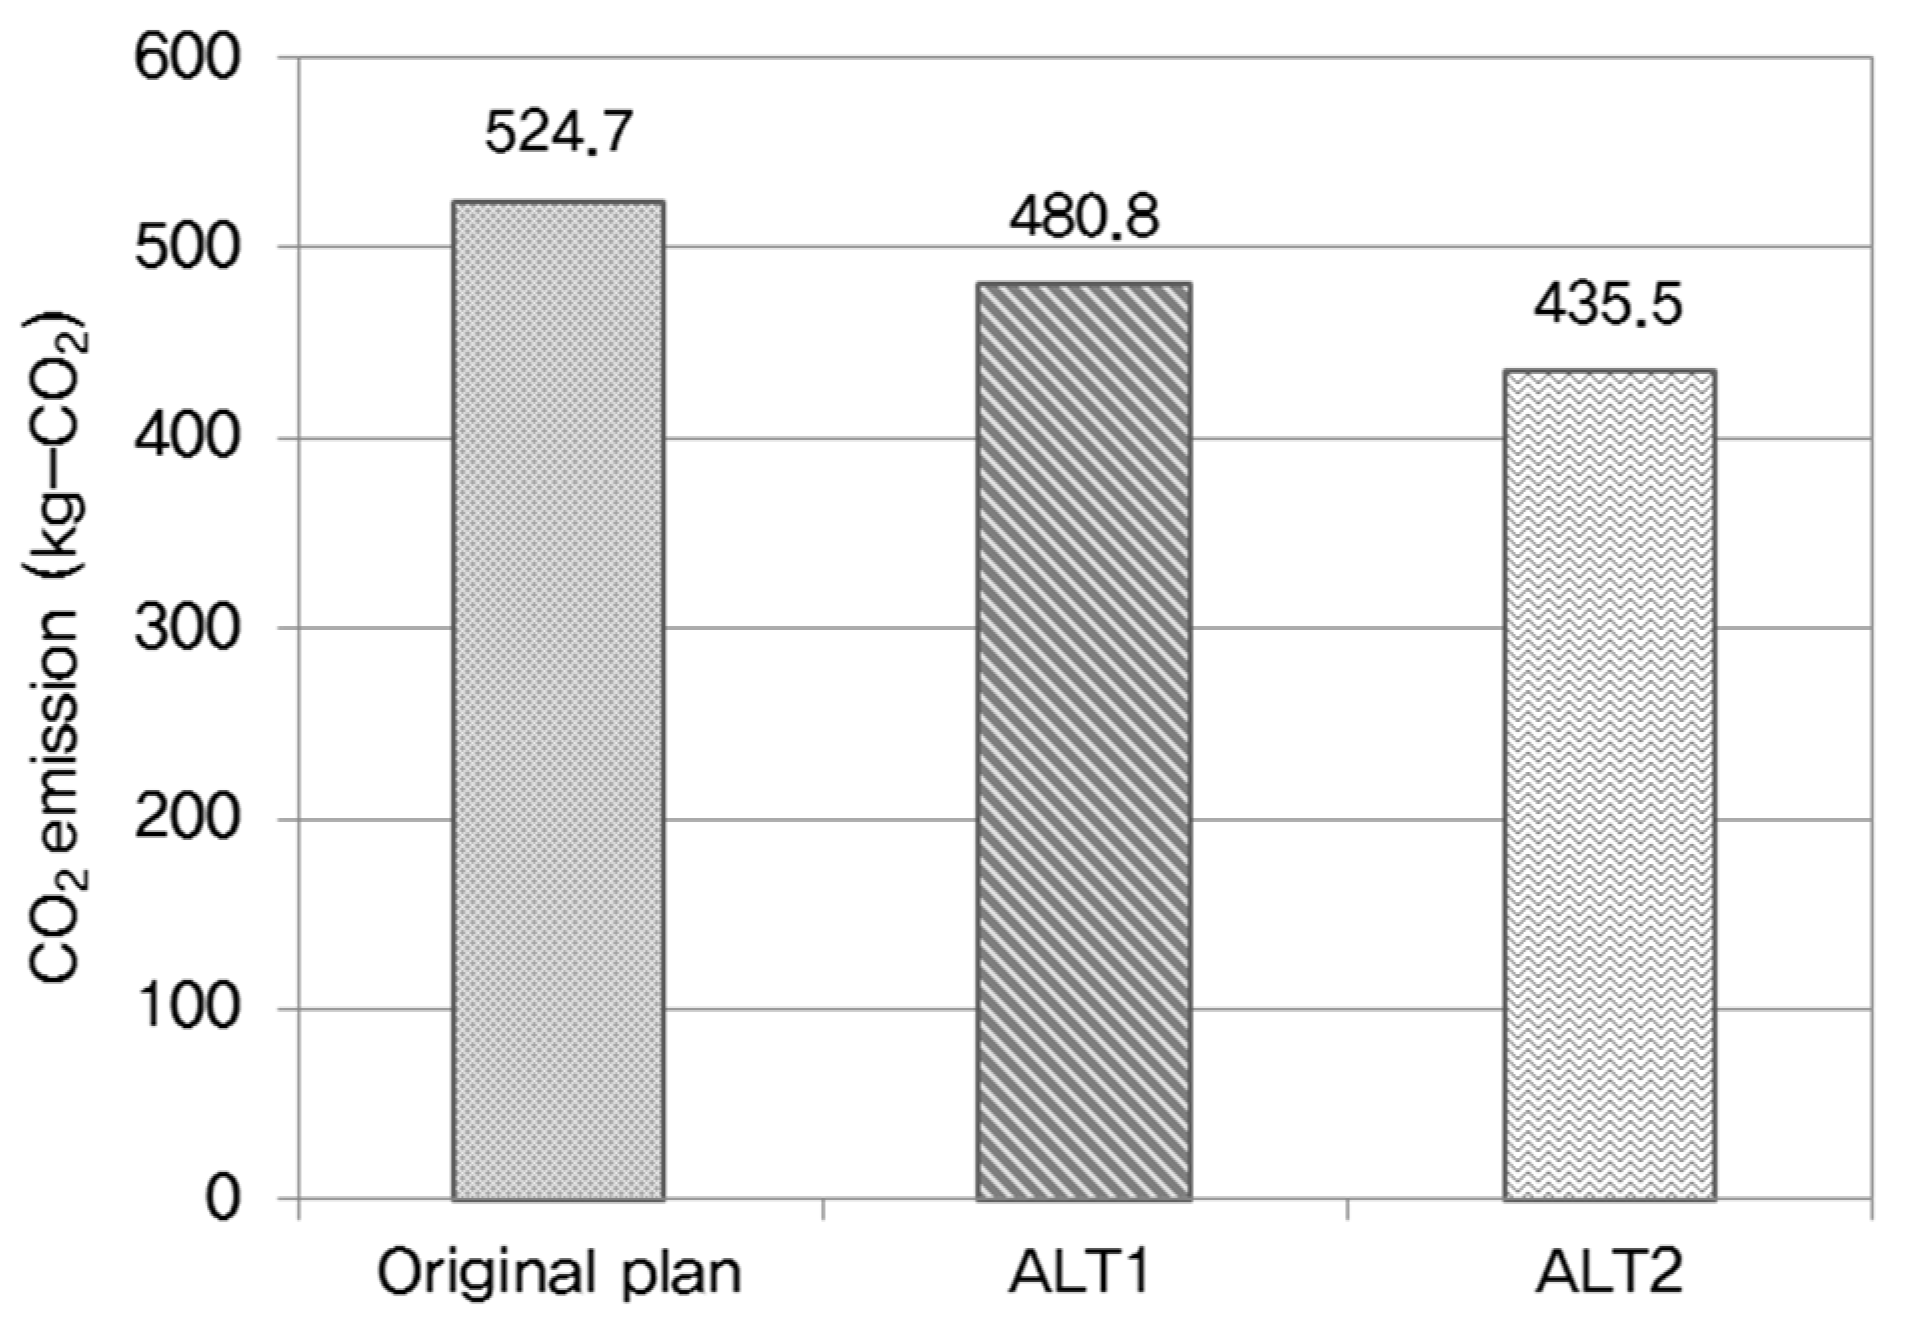
As shown in
Figure 7, the RC structure showed less CO
2 emission than the SRC structure, and high-strength concrete showed less CO
2 emission than the low-strength concrete. The CO
2 emission of ALT 2 was 85% that of the original. Even for low-rise offices, the application of high-strength concrete can reduce the required concrete quantity as well as CO
2 emission. In the case of pillars, the use of high-strength CO
2 emission must result in increased slab concrete strength, and, accordingly focused management for concrete installation is necessary. Here, several CO
2 emission reduction methods may be proposed. The first step is the application of high-strength concrete. As can be inferred from the mix design comparison according to pillar strength change, CO
2 emission was reduced with the application of high-strength concrete. In the case of high-strength, the required quantities of concrete and steel rebar are reduced. This decrease led to the reduction of CO
2 emission. The second step is the mixture. It was found that CO
2 emission levels were different, even for the same strength and slump. When the construction company prepares a standard mix design for RMC, the use of blast-furnace slag can reduce the amount of cement, thus leading to decreased CO
2 emission. Especially for basic concrete, the substitution rate can be increased for saving a large amount of CO
2. If the mix design that can save raw cost by using high-strength concrete and blast-furnace slag in multipurpose buildings and similar structures is managed across the enterprise, high-strength concrete could be used in low-rise buildings without any additional cost. Finally, if the weight of RMC company selection is increased through analysis, considering the distance between the RMC company and the site, the material procurement source, and the production equipment during the selection of an RMC company, CO
2 emission could be reduced [
35,
36].
6. Discussion and Limitations
This study aimed to assess and analyze the CO2 emission of concrete, which is used according to building type and region.
Then, it proposed a method to reduce CO2 emission in the use of concrete in building construction. In addition, CO2 emission was assessed by applying the proposed technology to the target building.
However, this study has the following limitations:
First, this study examined concrete only among diverse construction materials. Therefore, it is limited in assessing the CO2 emission of buildings. Among the construction materials used during a construction stage, the following seven materials accounted for 95% of total CO2 emission: ready-mixed concrete, reinforced rod, steel frame, paint, glass, concrete mix, and insulating material. Therefore, there should be further studies on the construction materials with high CO2 emission to assess the CO2 emission of buildings and propose their reduction technology.
Second, this study did not cover the CO2 absorptions by concrete carbonation. Concrete loses alkalinity after CO2 in the air is absorbed into concrete and generates chemical reactions. Concrete is not directly degraded by carbonation. If the carbonation of a reinforced concrete structure reaches up to the surface of a reinforcing rod beyond the cover thickness, the passivity layer around the reinforcing rod is destructed, initiating corrosion. From the perspective of ecological environment, concrete’s absorption of CO2 in the air is beneficial. However, durability should be considered. In other words, the absorption of CO2 absorptions during the construction and use of reinforced concrete structures should be assessed.
However, this study analyzed a construction stage (required) only in the LCA, without considering the use, maintenance, and destruction/disposal stages.
Third, a reliability test on the proposed CO2 emission reduction technology is not enough because only one case was analyzed. Therefore, there should be further verifications through diverse case studies.
7. Conclusions and Future Work
Using the proposed concrete CO2 emission assessment method, the characteristics of construction projects in terms of area and purpose were analyzed for the causes of differences in CO2 emission based on concrete strength, structure type, and structure area. This was accomplished by assessing each stage of construction, i.e., material procurement, transportation, and manufacturing. In the analysis according to building types, CO2 emission was found to decrease, from highest to lowest, apartment buildings, office buildings, and multipurpose buildings. This can be attributed to the increased use of blast-furnace slag and fly ash as a cement-replacement compound material in multipurpose buildings rather than using concrete of the same strength, as in the case of apartment buildings and offices. Under-construction projects were selected for the application/assessment of the developed CO2 emission reduction method. As a result, the RC-structure, high-strength concrete application showed a reduction of about 17% in CO2 emission compared to the SRC-structure, low-strength concrete. In RC-structure pillars, high-strength pillars were found to result in about a 10% reduction in CO2 emission than low-strength concrete pillars.
The CO2 emission reduction method at the construction stage can be summarized as the application of high-strength concrete, the standardization of reduction mix design using blast-furnace slag, and the selection of RMC companies with low CO2 emission.
The CO2, NOx, and SO2 emitted in concrete production affect the acidification and eutrophication as well as global warming. NOx and SO2 come down on the ground in such forms as acid rain and acid snow and are absorbed in lakes, rivers, and soil. The acidification and eutrophication caused by NOx and SO2 is a major cause of red tide and reinforced concrete structure degradation.
In the future, the LCA method and program (software) for various environmental load is needed and will be the topic of the next paper by the present researchers.


