1. Introduction
Organic soils, and especially peatlands, play an important role in maintaining the Earth’s carbon balance. Despite the fact that, globally, they cover a mere 3% of the land area, because they are extremely rich in carbon content they store up to 30% of the total soil carbon, thus acting as large terrestrial carbon reservoirs [
1]. Organic soils have become, in recent decades, a significant source of anthropogenic greenhouse gases, as a result of drainage for cultivation, peat extraction and other economic uses. Drainage causes large-scale oxidation of the organic material stored in these soils, releasing large quantities of carbon dioxide (CO
2) and nitrous dioxide (N
2O) into the atmosphere, for several decades after the drainage event. Despite such importance of organic soils to the global carbon cycle and their influence on climate change dynamics, detailed information on regional and global emission trends is scarce. This is due to the difficulty to map, measure, and assess the complex dynamics of land, soil, and water interactions that are required for their correct quantification. The only global databases on emissions from drained organic soils available to date are from Wetland International [
2] and FAO [
3]. Information from both sources was recently synthesized in the International Panel on Climate Change (IPCC) Fifth Assessment Report [
4]. An additional source of information on drained organic soils and their emissions is provided by national greenhouse gas inventories, submitted by countries to the UN Framework Convention on Climate Change (UNFCCC) on the basis of internationally-approved IPCC methodologies for estimating and reporting emissions from human action, including from agriculture and land use activities. These data are collected in the UNFCCC GHG database [
5].
All three available sources of information have limitations and advantages. While UNFCCC information is likely quite precise at the country level, its aggregation at regional and global level is less useful, due to significant heterogeneity in data quality and large data gaps. Indeed, while UNFCCC data for OECD countries (Annex I parties) are typically complete and provided in long time-series, UNFCCC data for developing countries (non-Annex I parties) are incomplete and usually provided for a few years only.
By contrast, the Wetlands International and FAO datasets provide consistent information on emissions from drained organic soils, globally and with country detail. At the same time, being based on simplified, default methodologies, these global datasets are likely to miss important geospatial characteristics, describing national circumstances with less precision compared to information in UNFCCC national inventories.
In order to assess the validity of utilizing the available global data for estimating trends in degradation and emissions linked to drainage of organic soils, the underlying methodologies need to be transparently communicated. This paper presents the methodologies behind the data available via the FAOSTAT database [
6]. It then utilizes such data to discuss regional and global trends in emissions from drained organic soils, adding relevant information to the recent analysis of the IPCC Fifth Assessment Report.
2. Materials and Methods
The FAOSTAT emissions data are estimated by using the 2006 IPCC guidelines, Tier 1 methodology [
7]. Emissions data are organized into two major domains:
Agriculture, containing non-CO
2 emission (methane and nitrous oxide) from crop and livestock production [
8] and
Land Use, containing CO
2 emissions related to land use activities, such as deforestation and forestry, and some non-CO
2 emissions related to biomass fires [
9]. Estimates for agriculture and forestry are computed directly at the national level, based on national activity data in relevant FAOSTAT sub-domains, such as “Crop Production”, “Livestock Production”, or “Inputs” (the latter containing data on Land, Organic and Inorganic Fertilizers, and Pesticides) [
6]. Specific emission categories, however, require the use of sub-national, and often geospatial activity data, which is not usually collected through statistical questionnaires. In these cases, available geo-spatial and remote sensing data must be used for analysis, including for aggregation to estimate new national level statistics [
10,
11]. This is precisely the case for statistics on the area extent of drained organic soils.
We, thus, estimated the extent of drained organic soils and associated emissions geospatially, and then aggregated the results to compute national statistics in FAOSTAT. These were disseminated as sub-domain items
cropland organic soils and
grassland organic soils, under
Emissions-Agriculture/Cultivation of organic soils [
8],
Emissions-Land Use/Cropland and Emissions-Land Use/Grassland [
9].
In all cases, greenhouse gas emissions and the underlying activity data were computed using the relevant IPCC equation, as follows:
where:
Emissioni,j = Emissions of greenhouse gas
i = N
2O, CO
2 over land use type
j = cropland, grassland;
Aj = underlying activity data, representing the area of cultivated organic soils under land use type
j = cropland, grassland; and
EFi,j = Emission Factor, representing emissions of greenhouse gas
i = N
2O, CO
2, per unit area of cultivated organic soils under land use type
j = cropland, grassland.
Three successive steps were followed for computing Equation (1). First, at the pixel level, independent information from maps of land use, livestock density, and organic soils distribution was used to determine the activity area, i.e., the extent of drained organic soils in either cropland or grassland pixels. Second, relevant agro-ecological maps were used to determine climate-zone dependent Tier 1 IPCC emission factors. Third, the geospatial information was aggregated to produce national statistics of both area and emissions values, using the FAO Global Administrative Unit Layers (GAUL) map of national boundaries. These three steps are described in greater detail in the following sections.
2.1. Soil Layers
Information on the geographical distribution of organic soils was derived from the Harmonized World Soil Database v 1.2 (HWSD) [
12]. The HWSD is a raster dataset with a nominal resolution of 30 arcseconds on the ground (corresponding approximately to 1 × 1 km at the equator). The HWSD compiles more than 40 years of soil information from several sources worldwide, re-classified and harmonized according to the FAO-UNESCO classification [
13,
14]. The standardized structure of the HSWD allowed for easy displaying and querying of soil composition in terms of soil units and soil parameters, such as for instance organic carbon content, pH, and water storage capacity.
Organic soils, unlike mineral soils, are characterized by a high concentration of organic matter, typically above 30% [
7]. They are found primarily in boreal and tropical areas [
13], and occur under climates that favor accumulation of organic matter under anoxic conditions,
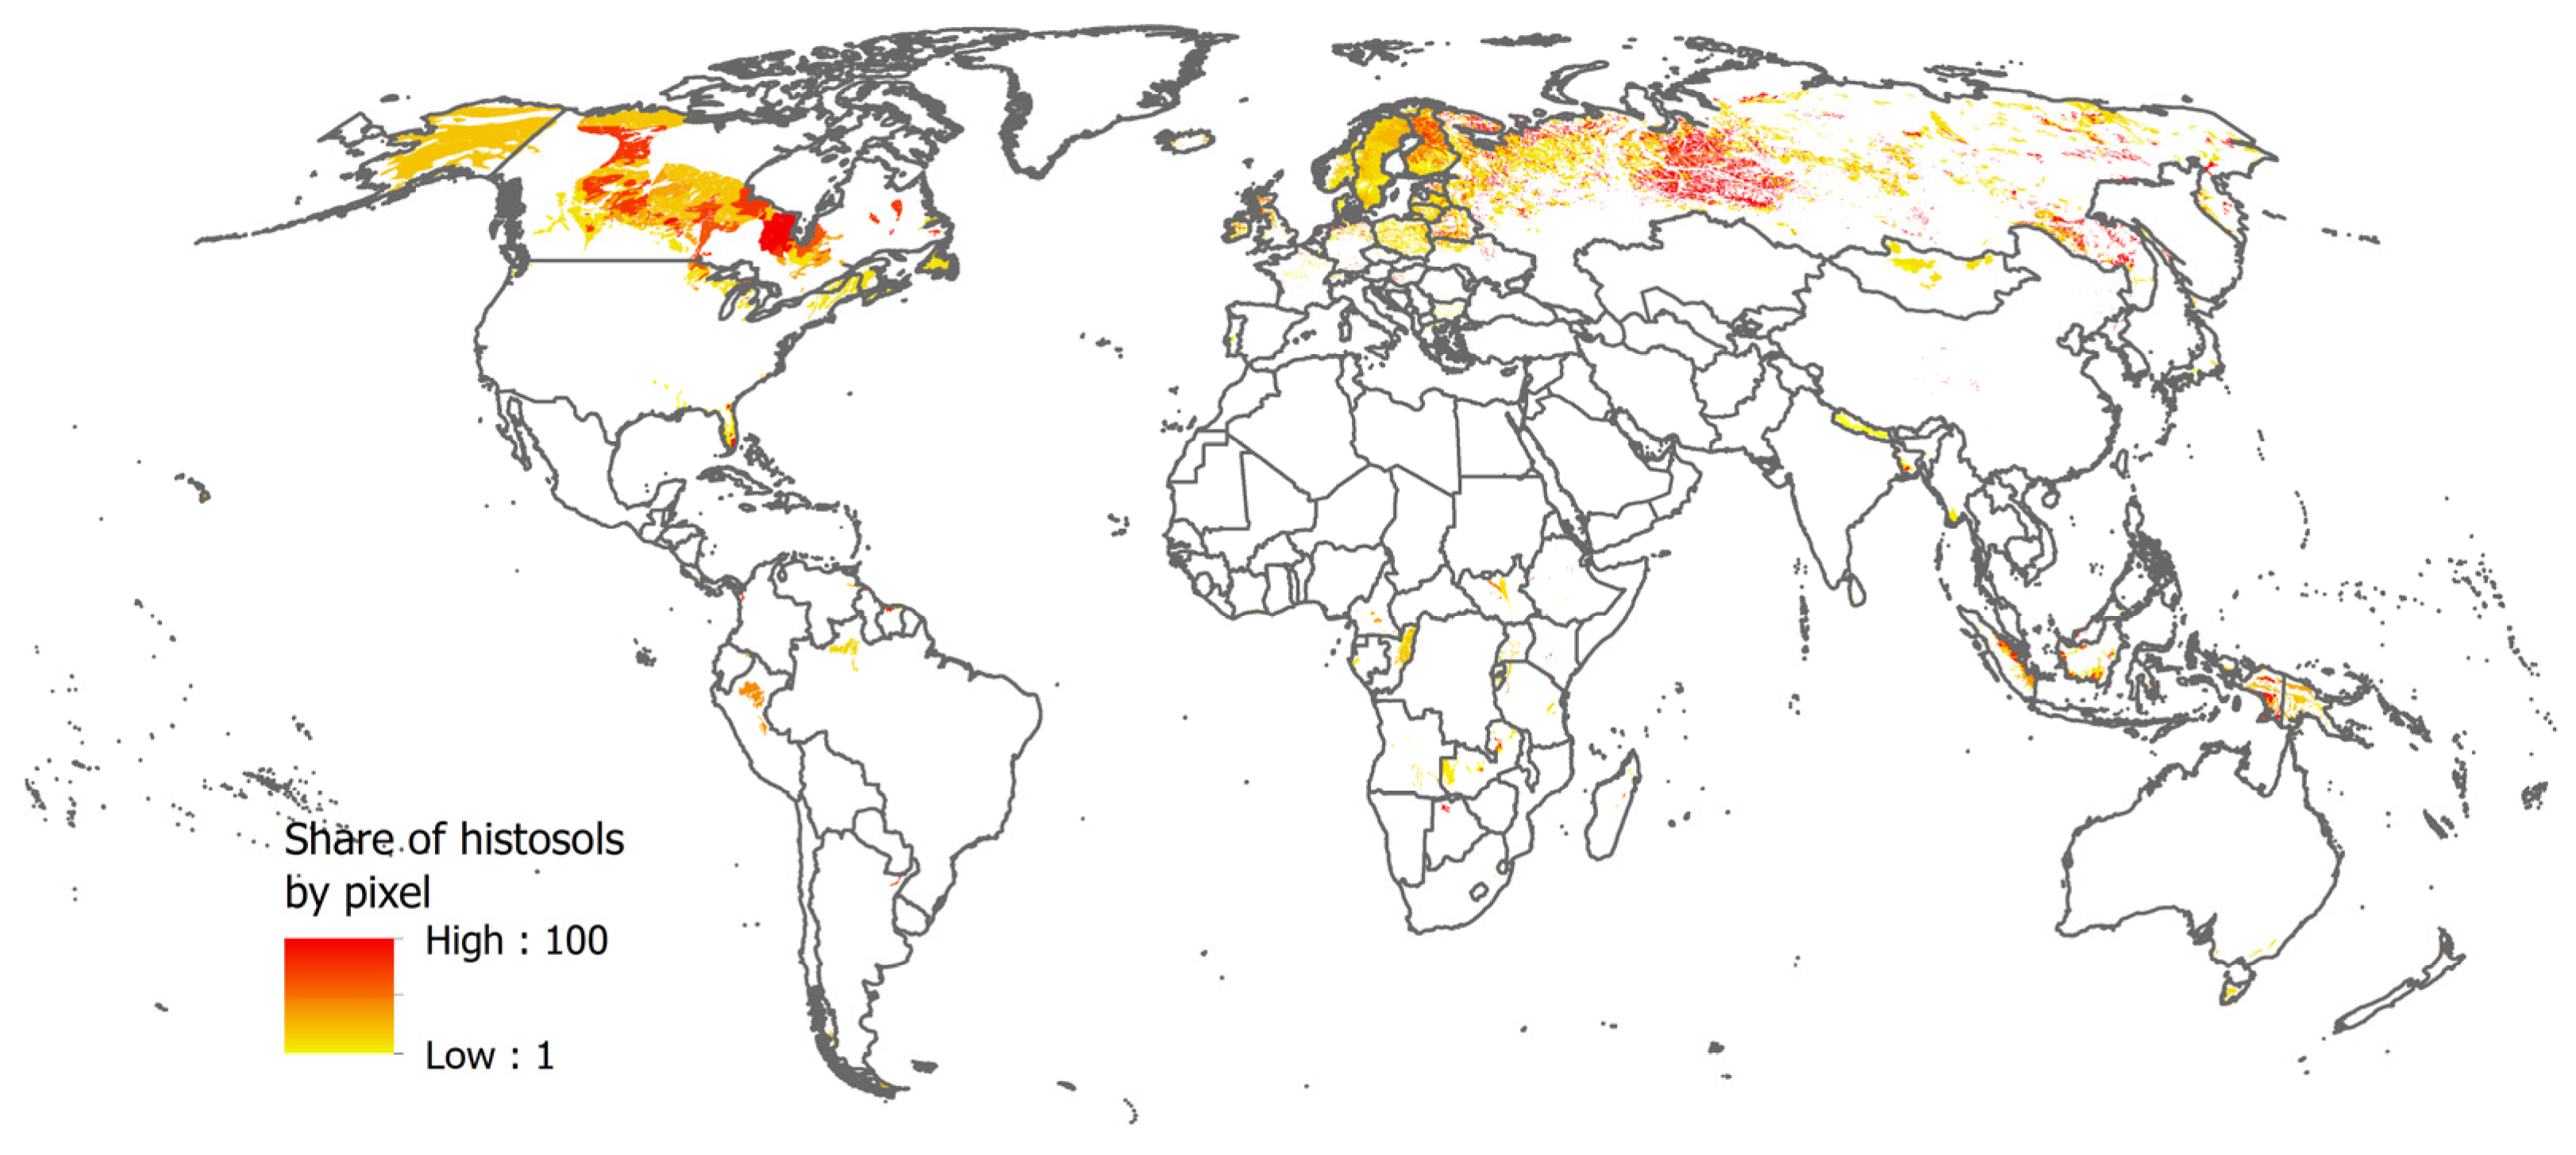
i.e., in conjunction with poorly drained basins and depressions, swamp and marshlands with shallow groundwater, and highland areas with a high precipitation to evapo-transpiration ratio. In the FAO definition, as used in the IPCC 2006 Guidelines, soils are organic if they satisfy requirements 1 and 2, or 1 and 3 from the following list: (1) Thickness of 10 cm or more. A horizon less than 20 cm thick must have 12 percent or more organic carbon when mixed to a depth of 20 cm; (2) If the soil is never saturated with water for more than a few days, and contains more than 20 percent (by weight) organic carbon (about 35 percent organic matter); and (3) If the soil is subject to water saturation episodes and has either: (i) at least 12 percent (by weight) organic carbon (about 20 percent organic matter) if it has no clay; or (ii) at least 18 percent (by weight) organic carbon (about 30 percent organic matter) if it has 60 percent or more clay; or (iii) an intermediate, proportional amount of organic carbon for intermediate amounts of clay. A more precise definition of organic soils, and specifically of peatlands, would require additional information on the thickness of the organic horizon [
14] which is, however, difficult to derive and is not available globally. We followed the International Panel on Climate Change (IPCC) Guidelines [
6], and more simply identified organic soils with the histosols group of the FAO-UNESCO classification [
13,
14] (
Figure 1).
Drained organic soils are organic soils which have been drained permanently or semi-permanently for agriculture use—including for annual or permanent crop cultivation, including tree plantations, or for livestock grazing [
7]. In order to permit cultivation, these soils are usually not only drained through construction of permanent or temporary channels, but also regularly limed and fertilized [
15].
2.2. Land Use/Land Cover
In order to estimate the area of drained organic soils, in agreement with the IPCC definitions defined above, we performed a pixel-by-pixel overlay of the histosols area information in the HSWD, with a land cover map for either cropland or grassland, plus gridded information on livestock density. The land cover map used was the Global Land Cover 2000 (GLC2000) [
16], developed by the Joint Research Centre (JRC) of the European Commission and routinely used by FAO [
17,
18,
19]. The GLC2000 has a nominal ground resolution of 30 arc-seconds and refers to the year 2000. The legend of the GLC2000 follows the UN standard Land Cover Classification System (LCCS
vs.3) [
20,
21,
22]. The choice of the GLC2000 was due to the critical reason that, unlike other available land cover products, it includes palm oil plantations under cropland, a key to estimate realistic data on cropland organic soils in Southeast Asia. Gridded information on livestock density was provided by the FAO Gridded Livestock of the World (GLW) map [
23]. The GLW provides global livestock densities based on sub-national statistics from agricultural and livestock censuses or surveys, and a large dataset of environmental and socio-economic variables as model predictors. The GLW distribution of cattle and sheep was used to assess a minimum presence of livestock density, δ
l, at the pixel level, defined as a value of one head per hectare.
As discussed in greater details in the following sections, those pixels resulting from the overlay of the HSWD histosols and cropland land cover maps were classified as drained cropland organic soils. Similarly, pixels resulting from the overlay of the HSWD histosols and grassland land cover map, but with the added condition of presence in the same pixel of a livestock density δl > 1—from the further overlay of the GLW map—were classified as drained grassland organic soils. This overlay exercise assumed that crop cultivation and/or a minimum livestock density on organic soils is always associated with drainage.
2.3. Drained Cropland and Grassland Organic Soils
The HWSD dataset was queried to extract all pixels with non-zero shares of organic soils (defined as histosols), either as dominant or secondary soil type. The resulting total area of organic soils, approximately 330 million hectares worldwide, was consistent with previous estimates [
15]. For overlay with the GLC2000 cropland land cover information, it was necessary to include three classes, two of which defined as mosaics (
Table 1a). In these classes, cropland is mixed with natural vegetation. The actual proportion of the cropped area in each pixel likely varies by region and agricultural system [
24]. For this study, however, we used constant shares (
Table 1a), considered to be a good approximation for global use in previous studies [
24]. GLC2000 classifies tree and shrub perennial crops as cropland [
16], whereas other land cover classification systems, such as for instance the International Geosphere-Biosphere Program classification, do not [
25]. This characteristic dictated the choice of the land cover layer, given the fact that cropland and the forest (woody) classes are associated with different emission factors and should be considered differently, while assessing the emissions.
For overlaying HSWD histosols and the GLC2000 grassland land cover maps, it was necessary to include two “herbaceous” and two mosaic classes, in line with the FAO Land Cover Classification Scheme (LCCS
vs.3). As done for the cropland case, a fixed share was used based on the same literature [
26] (
Table 1b).
In order to estimate the actual overlay percentage value needed for assessing area extent of cropland and grassland organic soils within each pixel analyzed, it was assumed that the individual soil and land cover characteristics of that pixel, relative to each map used, had equal probability, i.e., they were homogeneously distributed. Thus, within any given pixel with non-zero overlay results, the original percentages of histosols and land cover type were multiplied in order to determine the resulting overlay percentage.
Finally, the GLC2000 and the HSWD applied two different land-water masks. To overcome this problem, an arbitrary buffer of approximately 4 km was applied to the coastal pixels in HSWD. These pixels were subsequently re-classified as having the same soil characteristics of in-land neighboring pixels.
The result of this analysis was a new GIS layer, providing at pixel level information on the percent share of histosols; percent share of drained cropland and grassland organic soils; and pixel area. These data were made freely available on the FAO geospatial data repository GeoNetwork [
27].
2.4. Emission Factors
Specific emission factors (EFs), characterizing N
2O and CO
2 emissions per unit area of either drained cropland or grassland organic soils, and dependency on climatic zone, were taken from the 2006 IPCC Guidelines (
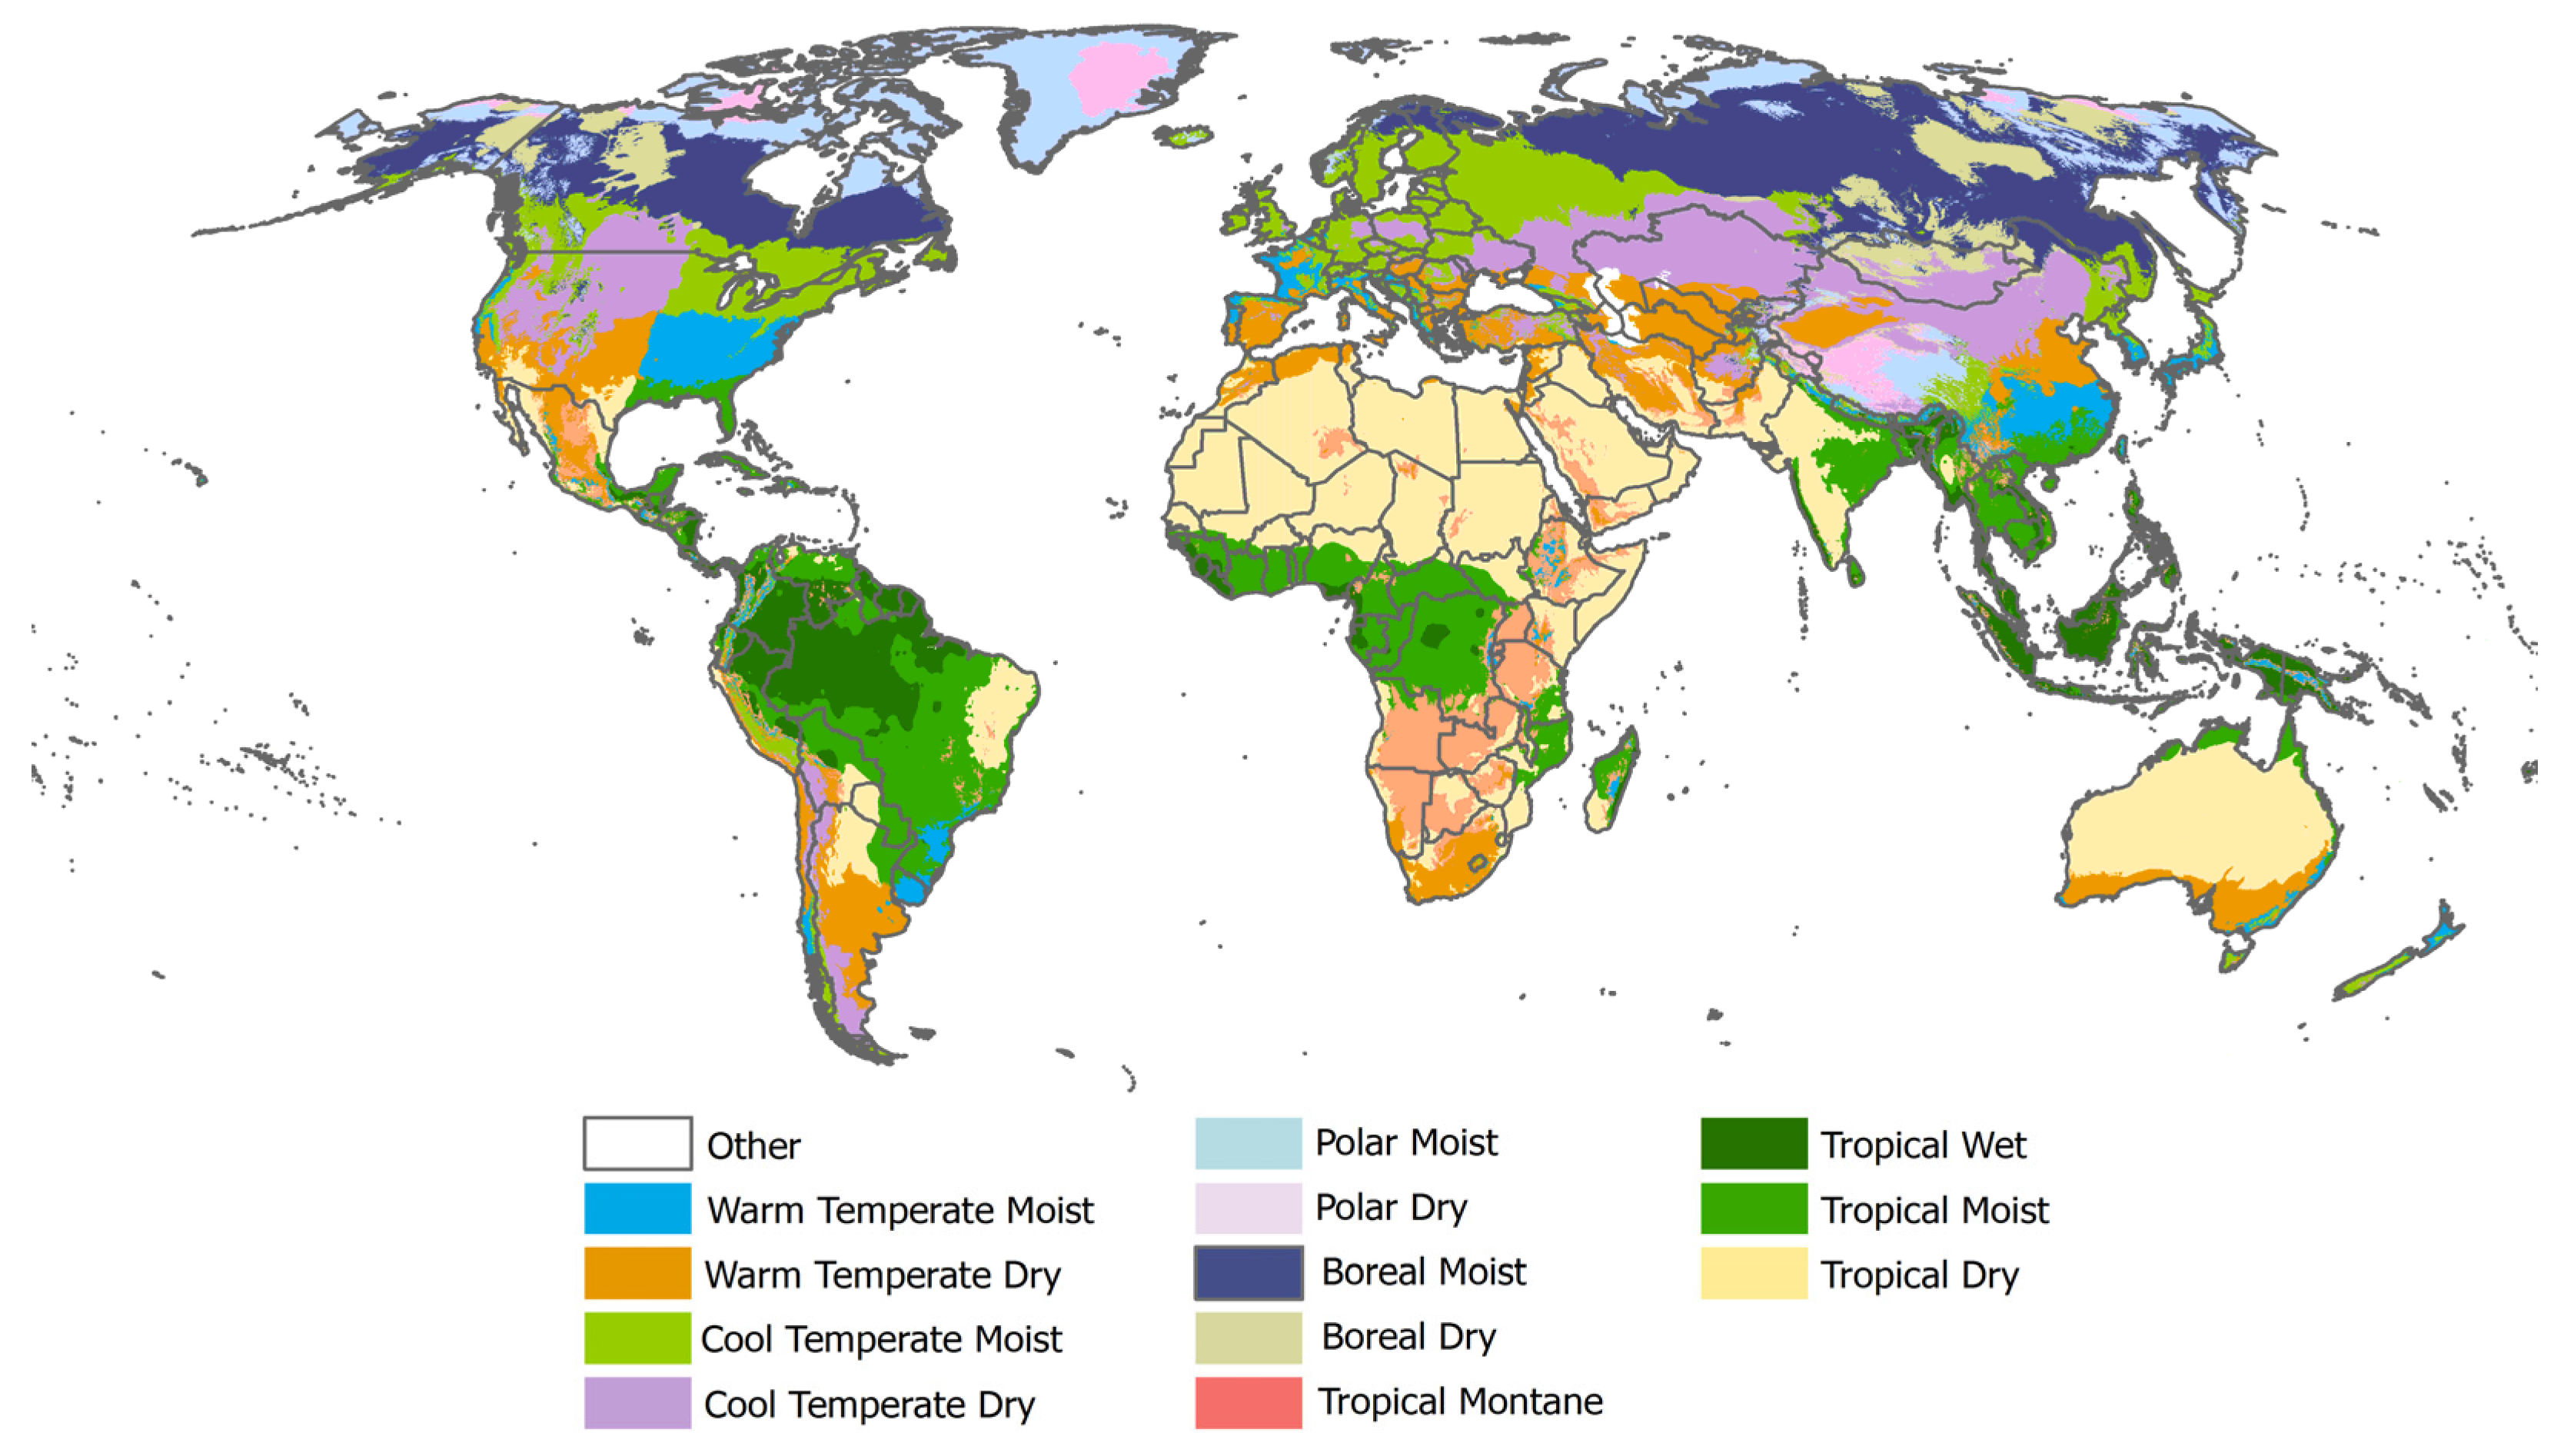
Table 2). For each pixel classified as having either cropland or grassland organic soils, we used the JRC agri-climatic zones map [
28] to assign a given EF value. The JRC map defines climatic zones by considering: (a) annual mean temperature; (b) total annual precipitation; (c) total annual potential evapo-transpiration (PET); and (d) elevation (
Figure 2). At the pixel level, latitude, longitude, and elevation all determine the actual climatic zone. As a result, countries were assigned as many EFs as climatic zones and cropland-grassland distributions. Implied emission factors, computed as the country-aggregated emissions divided by the relevant area of either cropland or grassland organic soils, and distributed in FAOSTAT alongside the national area and emission statistics are, therefore, weighted averages of the various EFs assigned at pixel level.
The final result of this analysis were two new GIS layers, providing at pixel level the distribution of Tier 1 IPCC EFs for both CO2 and N2O emissions. These data will be made available on the FAO GeoNetwork in the near future.
2.5. National Aggregation
The geospatial information generated on organic soils, drained organic soils and emissions was aggregated at country level for dissemination in FAOSTAT, using the Global Administrative Units Layers (GAUL). The GAUL is implemented and maintained by FAO using the best available information on administrative units for all the countries in the world [
29]. In practice, the GAUL vector layer was used to extract national statistics by aggregation of the pixel level information generated above.
2.6. Uncertainties
Uncertainty in the area and emission estimates presented herein were significant, and generated by propagation of: (i) uncertainty in the underlying activity data, involving the individual products used such as soils, land cover, and livestock density distribution; (ii) uncertainty in performing the overlay of maps of different nature; and (iii) uncertainty in emission factors, due to incomplete understanding of biophysical processes associated to the drainage of peatlands, and their up-scaling from field experiment to the national level. We assessed uncertainty in single components and propagated them according to the relevant Tier 1 methodology in the IPCC guidelines [
7,
30], as follows.
The accuracy of the GLC2000 classification was estimated overall at 69% [
31]. More specifically, for the land cover classes used herein, accuracy was 73% for “cultivated and managed areas”; 82% for the mosaic class “cropland/tree cover/other vegetation”; and 0% for the mosaic class “cropland/shrub or grass cover”. The low user’s accuracy of the second mosaic class reflects the difficulty in discriminating, both spectrally and visually, cropland from any other herbaceous layers [
32].
Accuracy of the HWSD was never estimated in the literature. We used an accuracy of 75% for the soil information, based on results from other soil map products [
33] and expert opinion of specialized FAO staff.
Accuracy of the overlay of the histosols and land cover maps could not be easily quantified, since this method is subject to intrinsic errors due to the spatial resolution of the information. Considering the assumptions made above, i.e., of homogeneous distribution of information within a given pixel, we concluded that this would lead to either an over- or under-estimate, depending on the actual surface characteristic of the overlay, but that these would tend to cancel out over sufficiently large intersecting surfaces.
These component uncertainties were used for the calculation of upper and lower limits of the propagated uncertainty, following the Tier 1 approach of the IPCC guidelines [
7,
30]:
where:
U% is the upper limit of the overall uncertainty
L% is lower limit of the overall uncertainty
E is the emission factor uncertainty and
A is the activity data uncertainty
where:
and:
Applying known uncertainty values for E and A into Equations (2) and (3) resulted in an overall uncertainty of ±40% for the area information, and an overall uncertainty range (−14%, +166%) for the CO2 emission estimates. Conversely, the uncertainty values of the N2O emission factors was so large as to prevent use of Equations (2) and (3). For lack of better information, we then assumed uncertainty in the N2O emissions to be the same as for the CO2 emission estimates, and that the uncertainties for grassland estimates were the same as those computed for cropland. We finally assumed, also for lack of better information, that these overall uncertainties, estimated, and thus valid at the pixel level, would be scale-invariant and, thus, also characterize the nationally-aggregated values.
2.7. Limitations
In addition to the inherent uncertainty in estimates described in the previous sections, additional limitations characterized the data presented herein. First, although applied over the time series 1990–present, our estimated data represent in fact a static picture, being based on a single cropland land cover map fixed at the year 2000. Thus, we did not capture important land use changes that may have happened after 2000, associated with more recent peatland drainage or rewetting. Second, we employed a static set of emission factors; thus, we could not capture the changing status of peatlands and their emission potential. Nonetheless, the year 2000 estimates that we performed can be taken as a representative of average emission fluxes from drained peatlands over the period 1990–2010. This means that, assuming that trends in peatland drainage have been increasing over time, our results would be overestimates early in the time series and underestimates towards the later years. Future integration of new emission factors from the 2013 Wetlands Supplement of the IPCC, as well as utilization of more recent land cover products, such as the FAO GLC-Share land cover map [
34], may help discern time-dependent trends in critical land use patterns and may prove useful to addressing some of the above shortcomings.
4. Discussion
The new statistical methodology developed in this work allowed for the generation of new data on organic soils, facilitating a comprehensive analysis of area extent and emissions from drained organic soils for agricultural use, at geospatial, country, regional, and global level. Using our results and information from the IPCC Fifth Assessment Report [
4], we estimated that emissions from drained organic soils represented one third of the total net emissions of CO
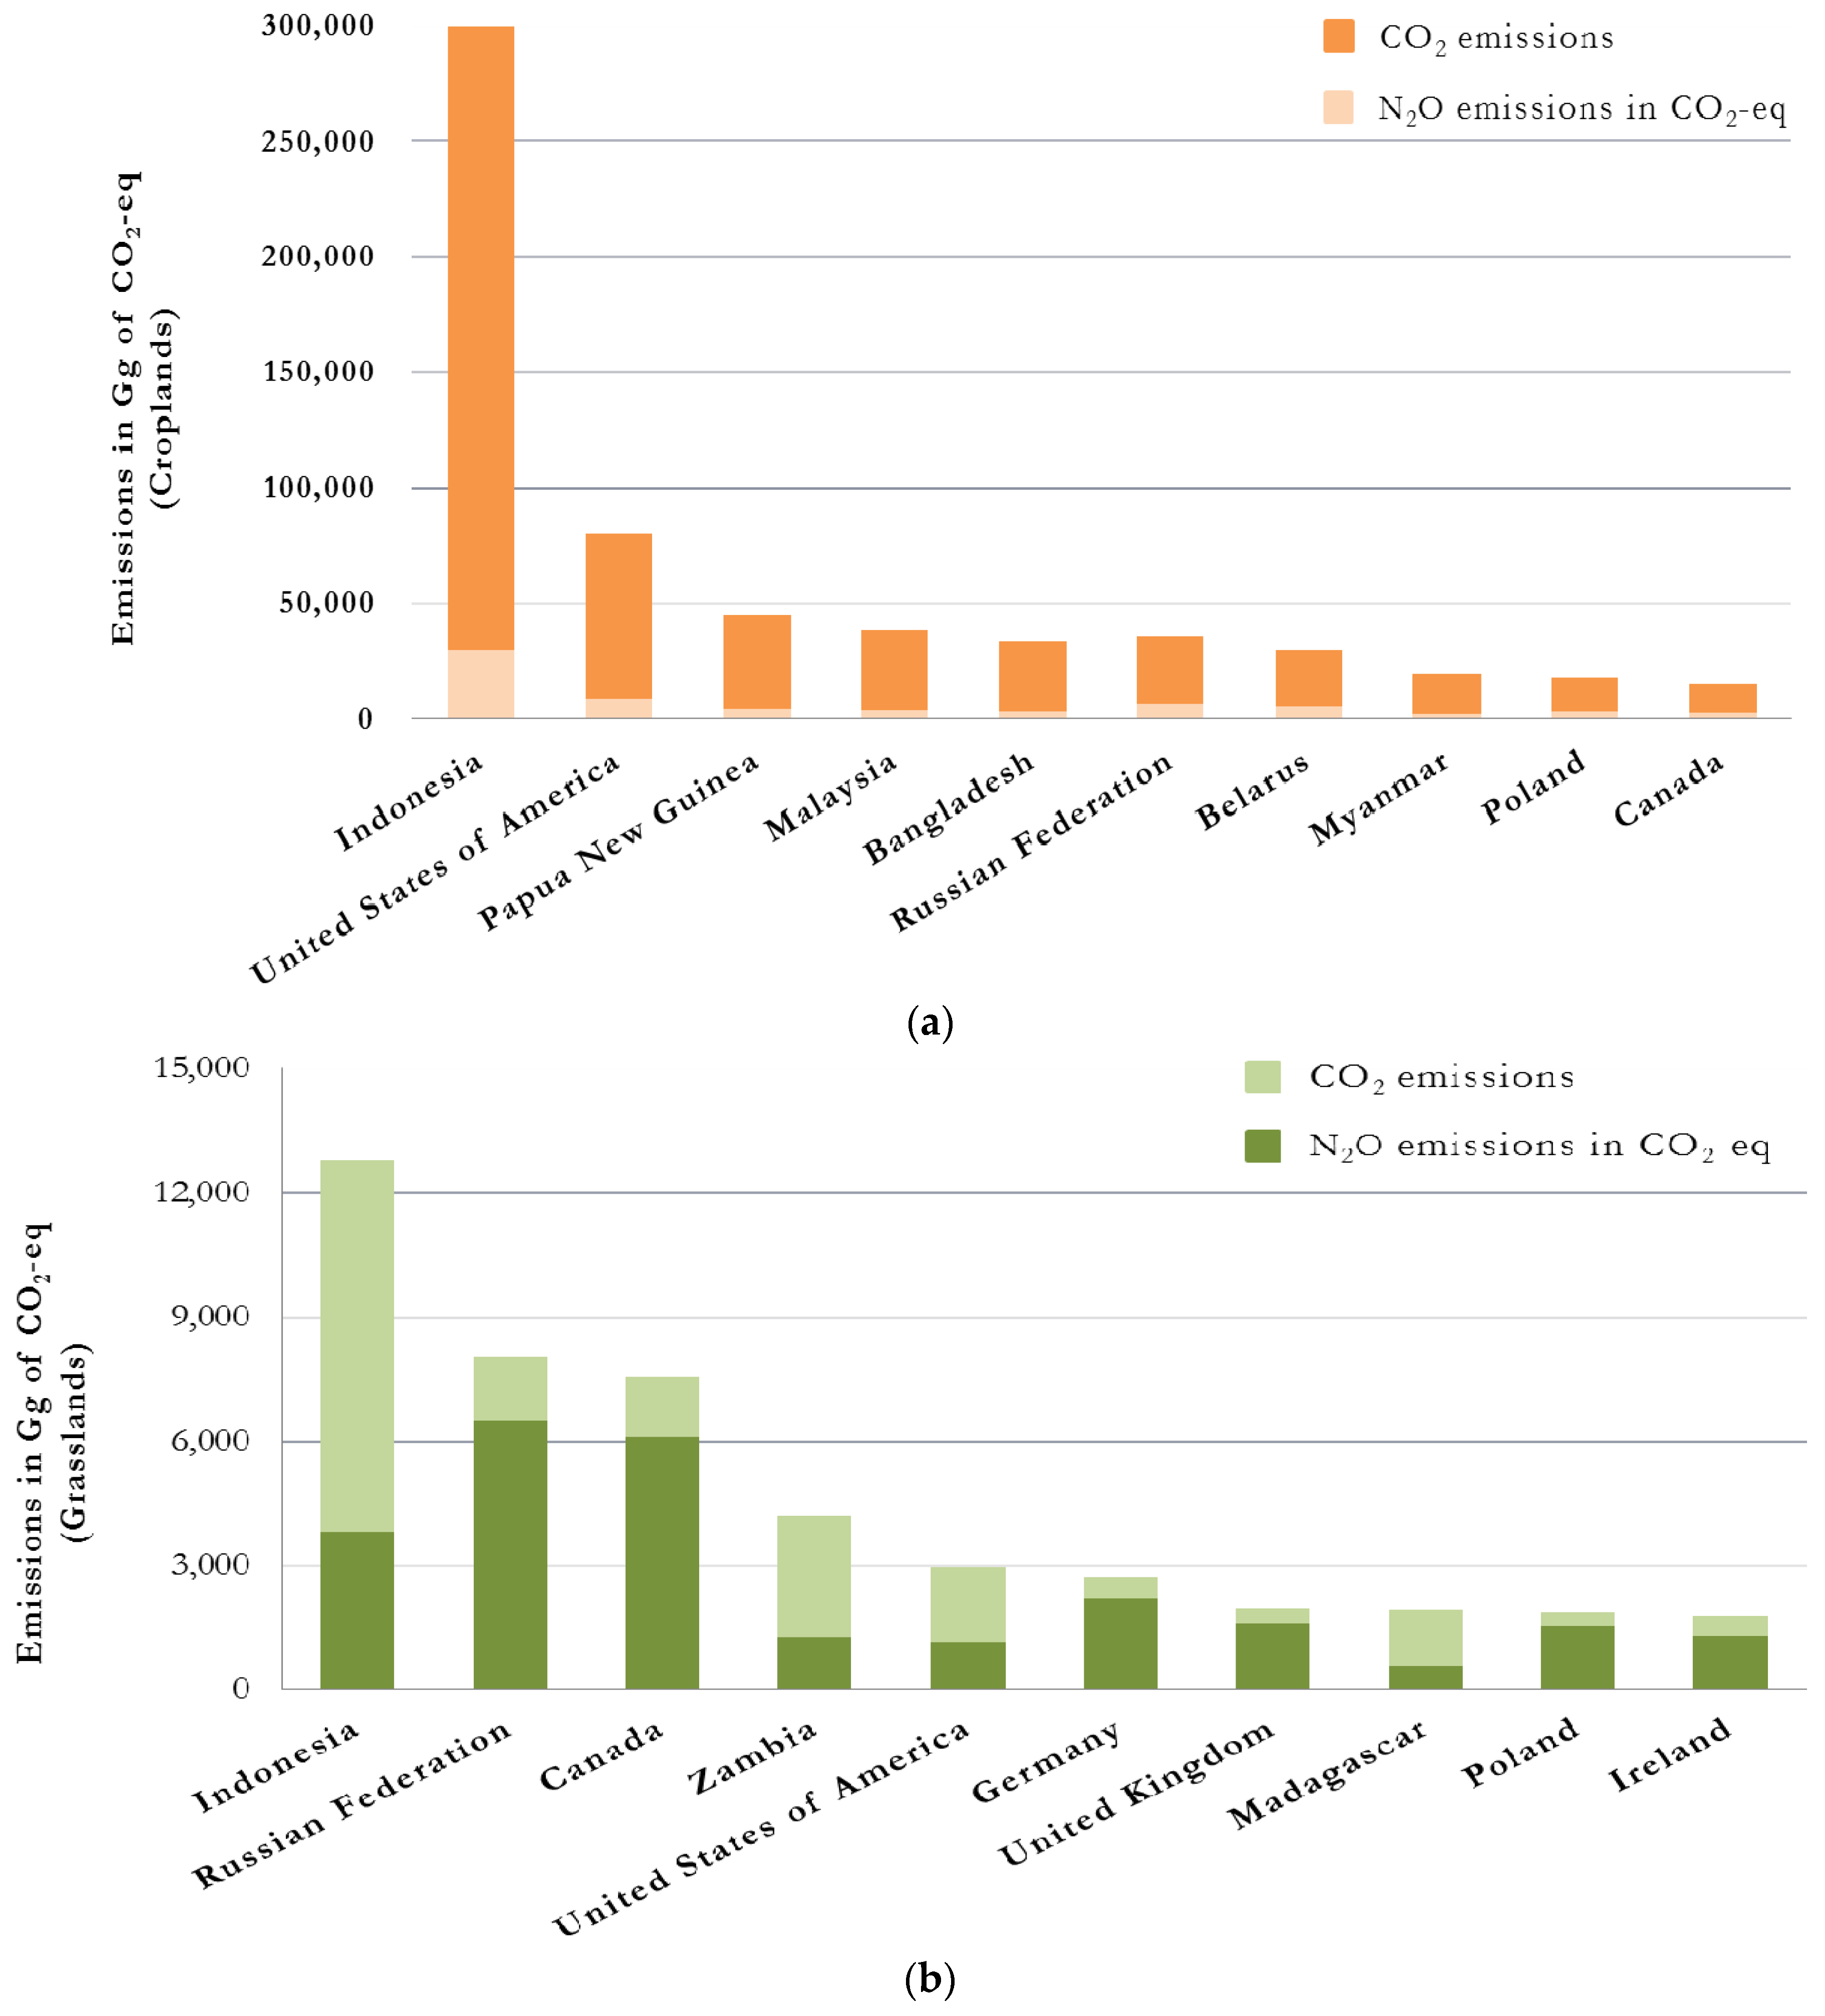
2 from the ‘agriculture, forestry and other land use’ sector (AFOLU), on average over the period 1990–2010. This share, which is remarkably large, likely increased in recent years, since total emissions from other sources within the AFOLU sector declined overall from 2000 to 2010, while drainage of organic soils, especially in tropical Southeast Asia, likely increased—in particular in connection with oil palm cultivation. Global estimates by Wetlands International [
2] and data from the United Nations Framework Convention on Climate Change (UNFCCC) [
5] for Annex I countries were used to complement our analysis and gain insight into potential trends, recognizing at the same time that different underlying definitions of peatlands and organic soils may have limited the value of such comparisons. Wetlands International [
2] reported a 20% increase in global emissions between 1990 and 2008, from 1058 to 1298 Gg CO
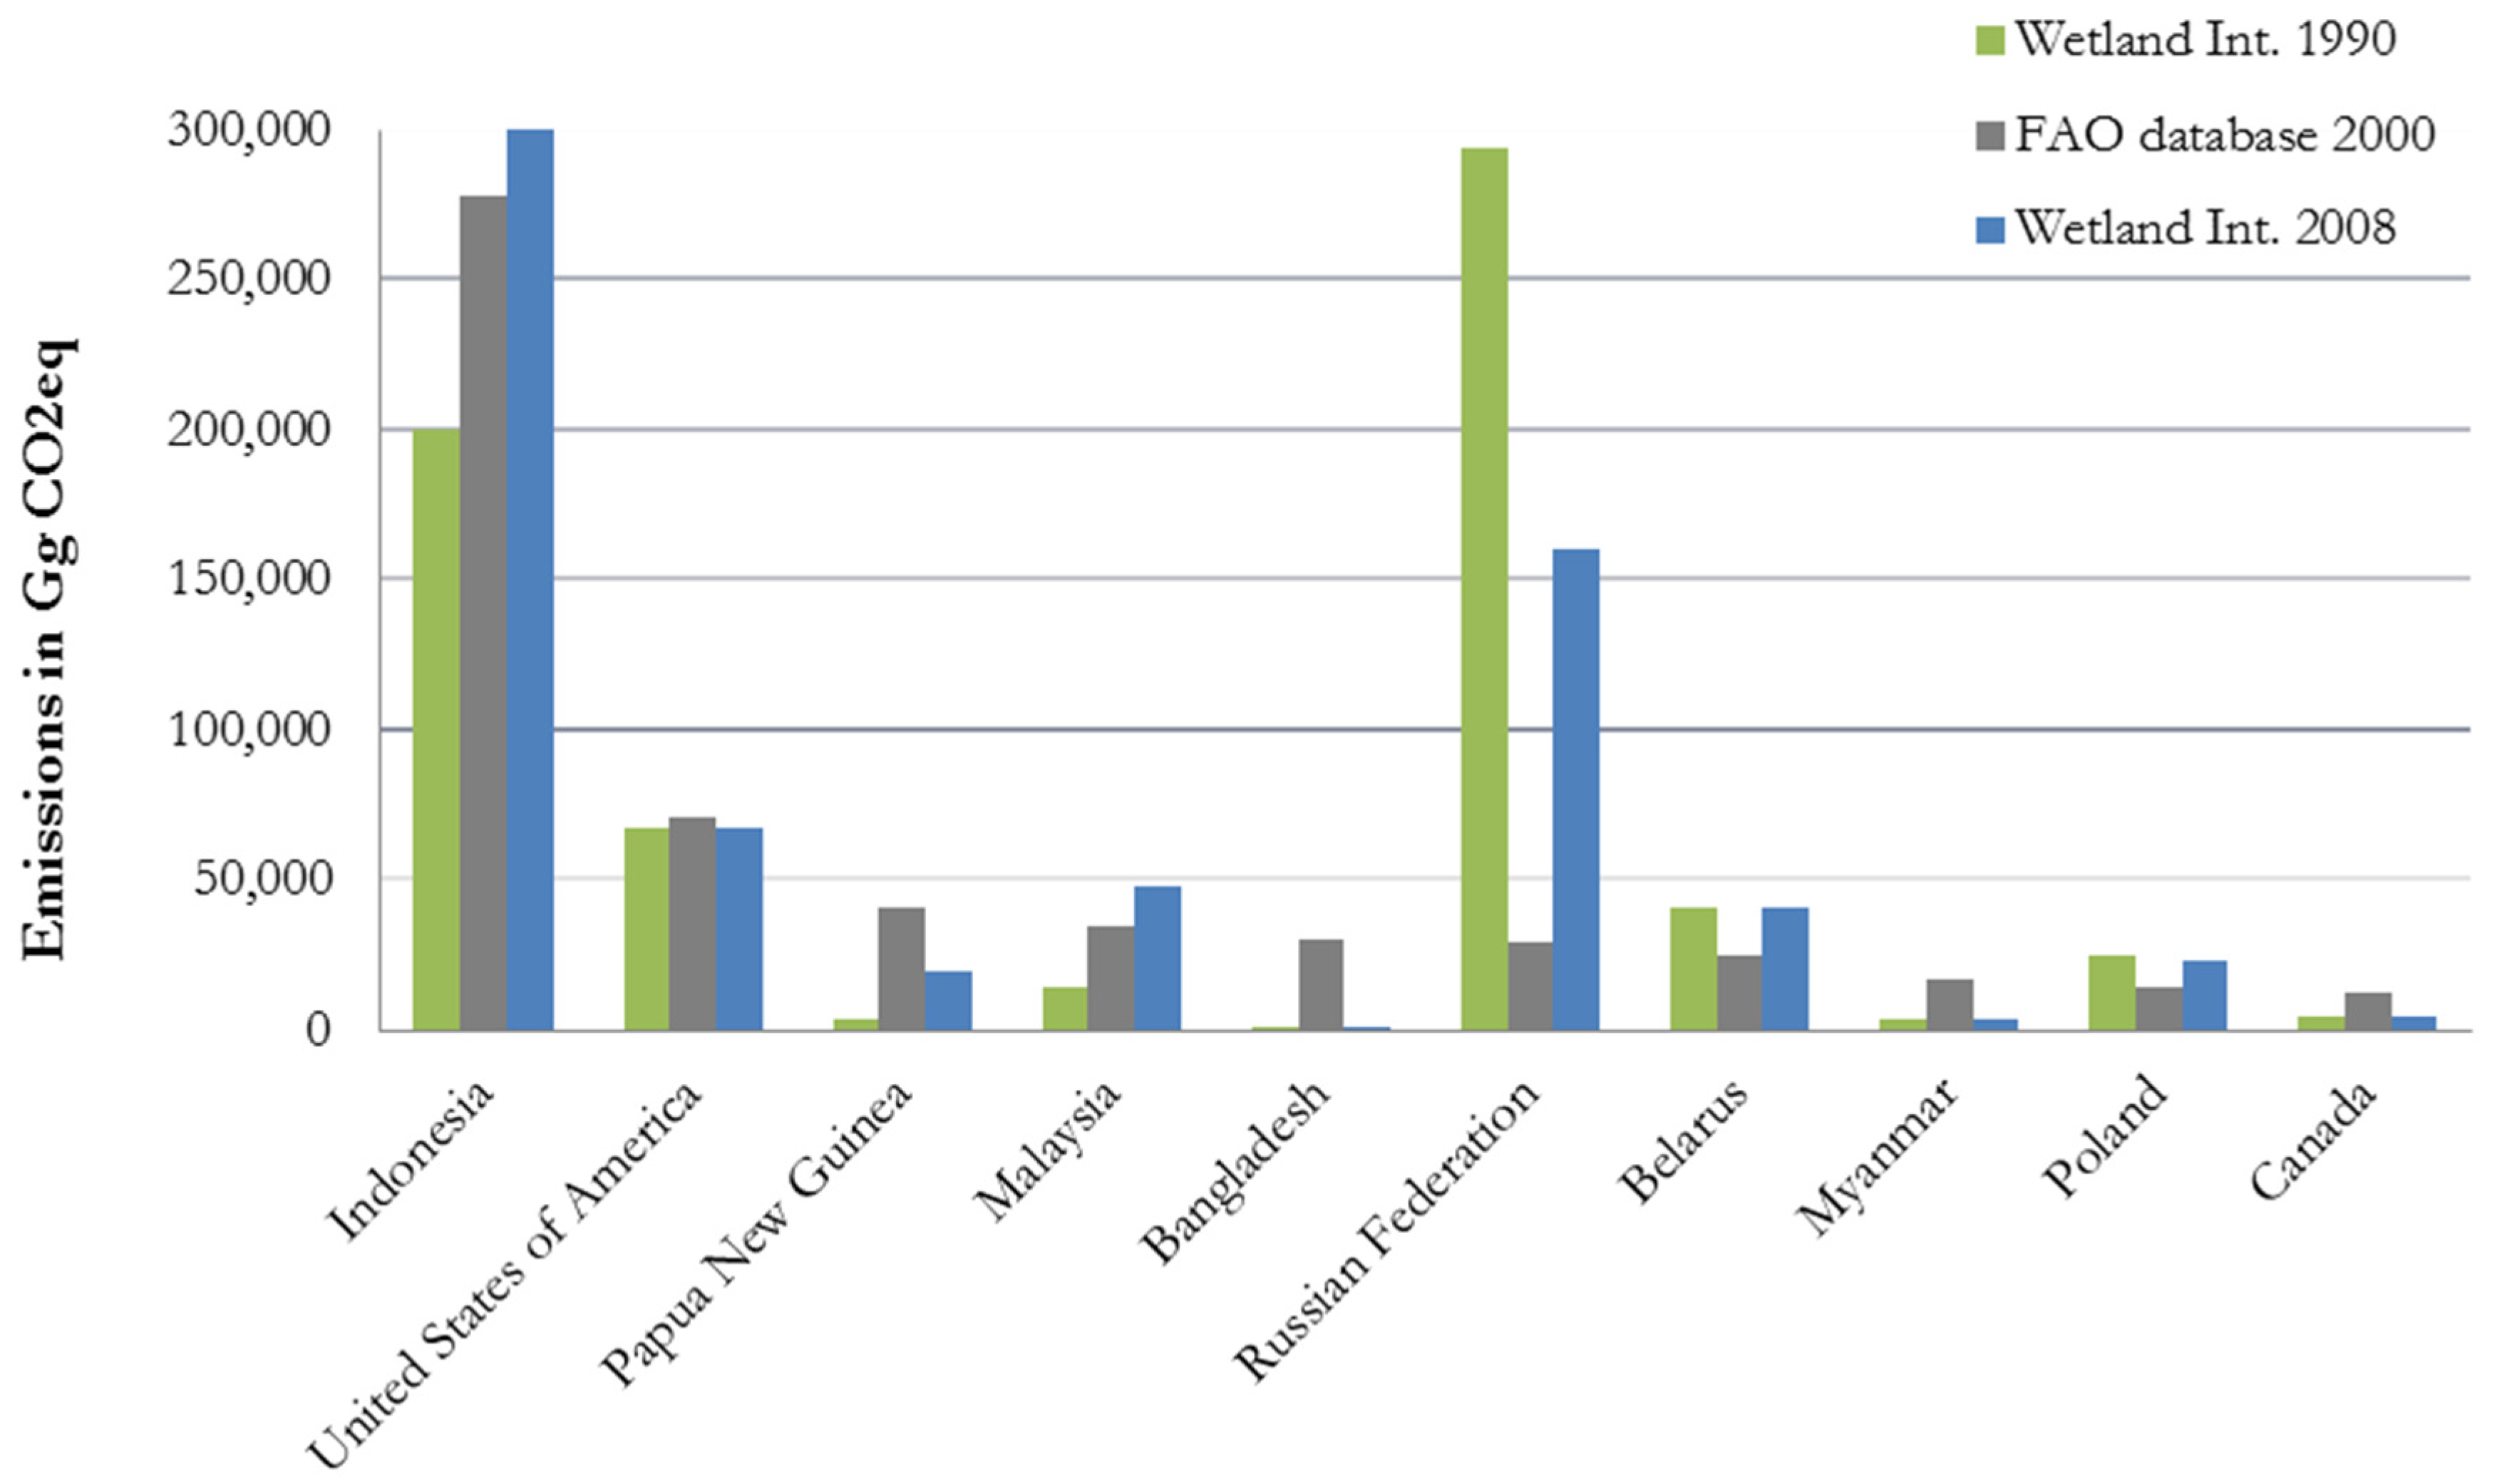
2, largely due to emission increases in Indonesia, China, Malaysia, and Papua New Guinea. FAO estimates were largely consistent with these Wetland International data, certainly within the underlying overall uncertainty computed in earlier sections (
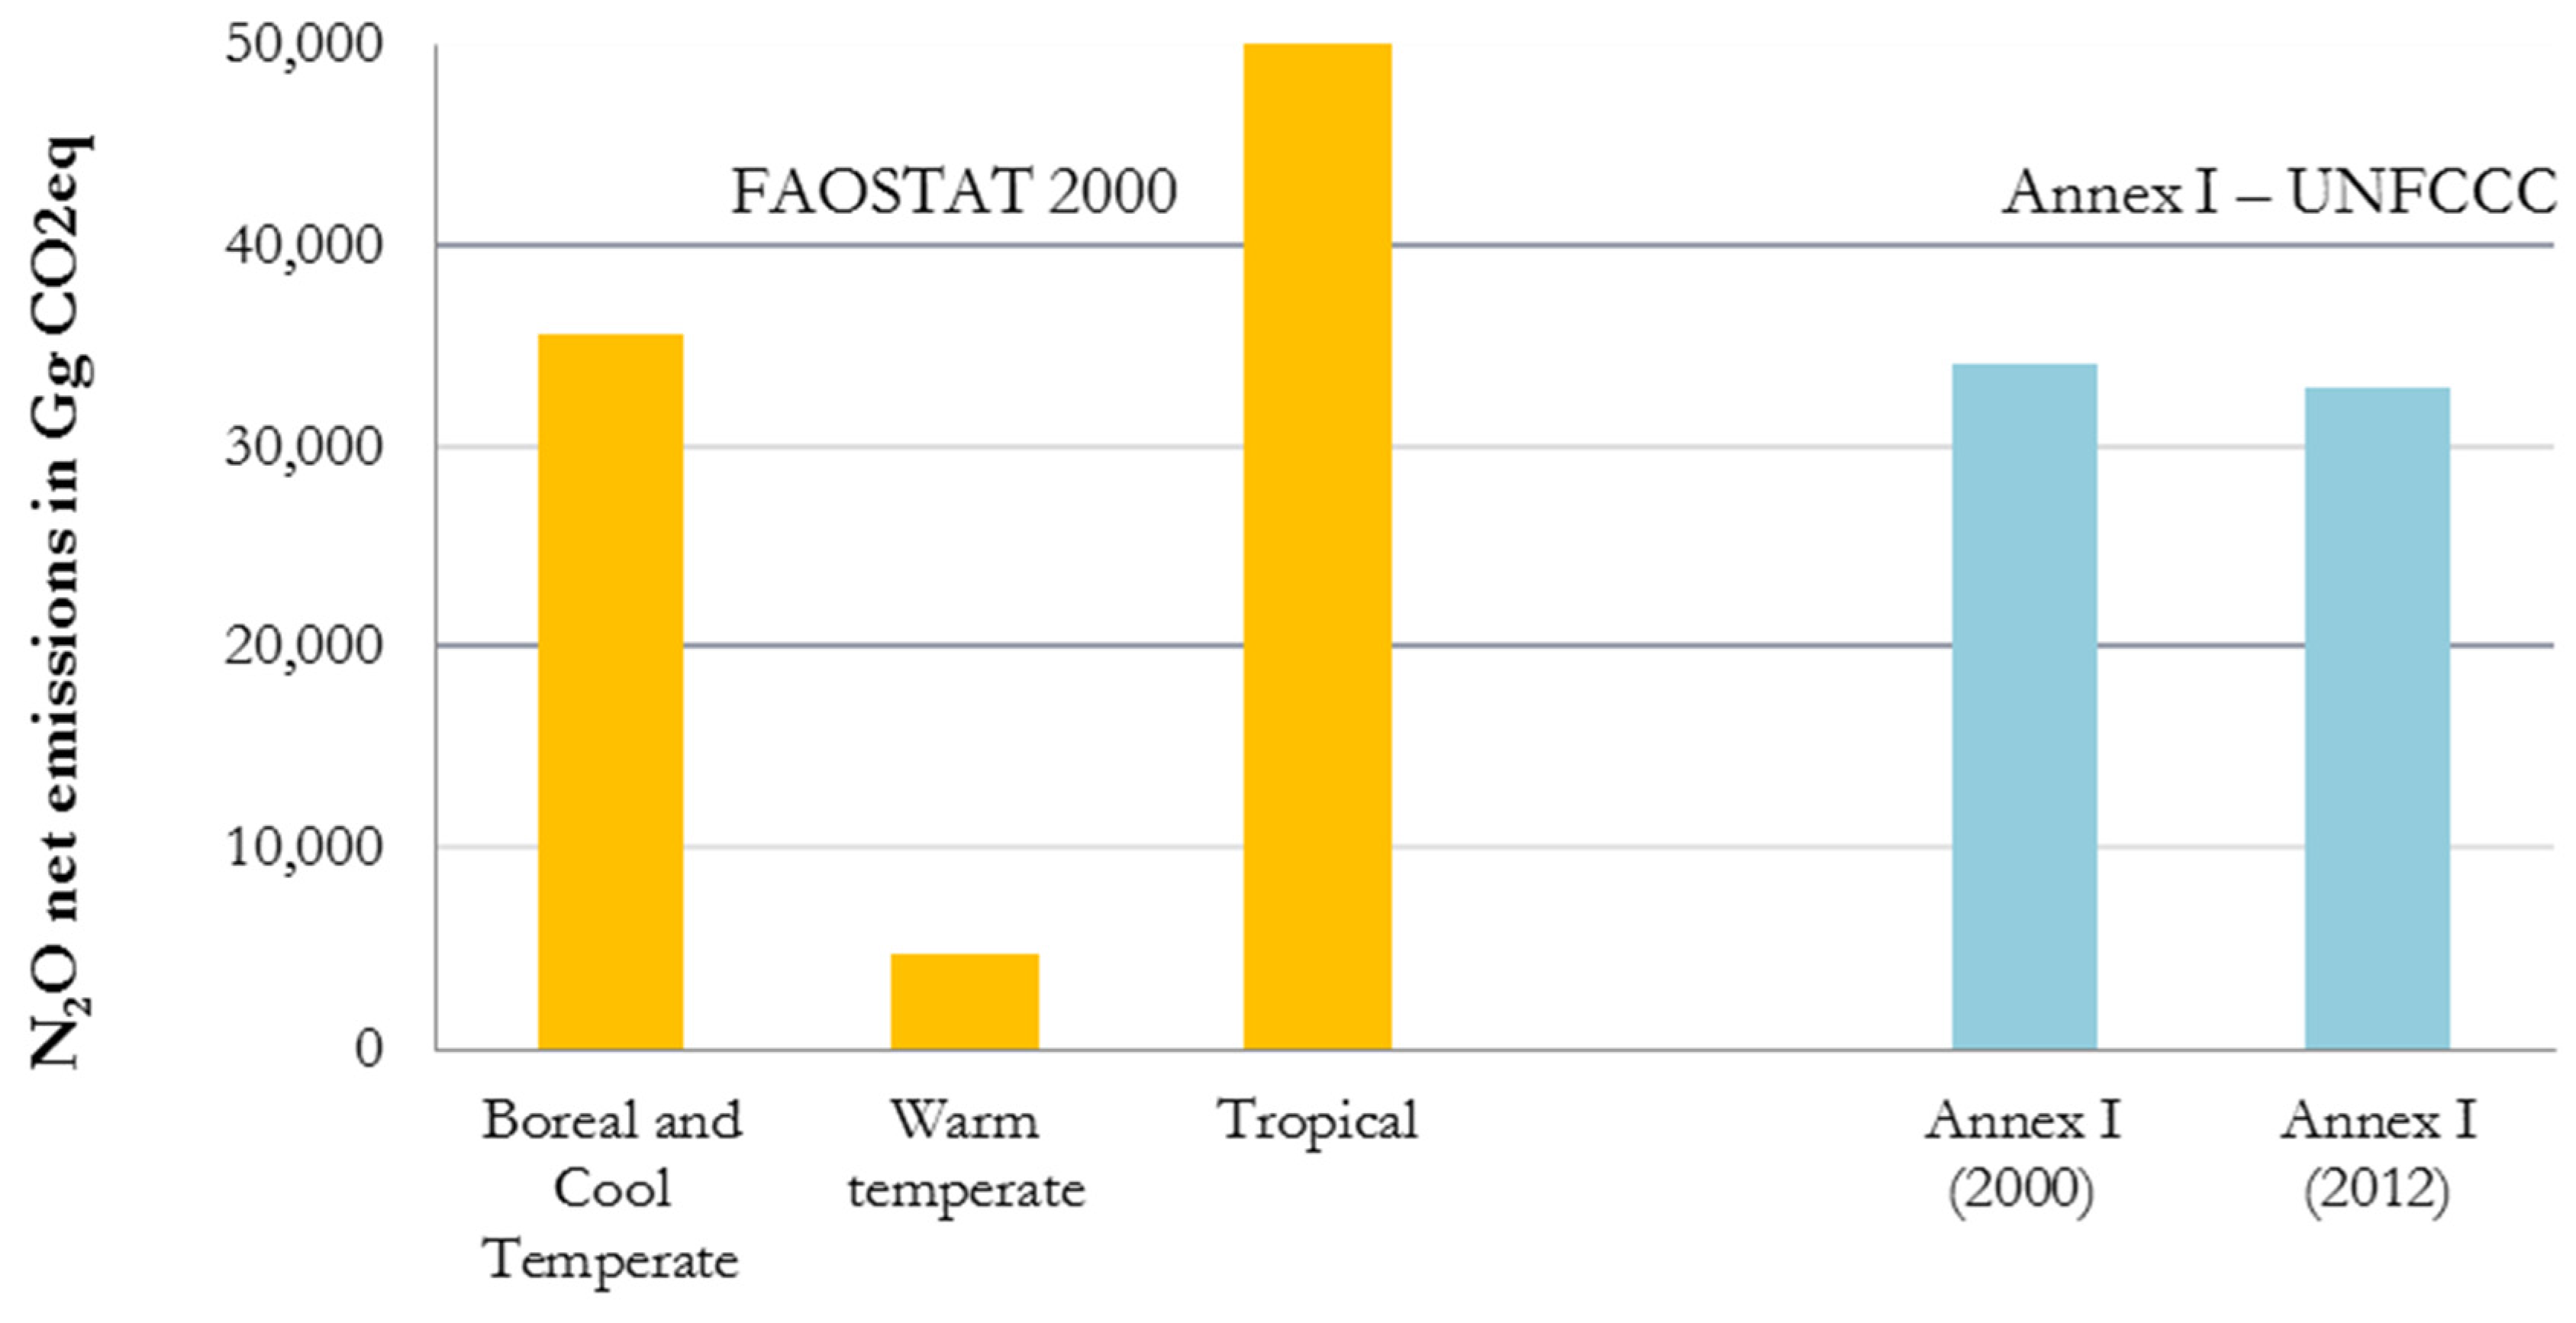
Figure 5). The largest absolute discrepancies, relative to emission estimates for the Russian Federation, were linked to significant differences in the area of histosols and peatland extents reported in the two analyses. Similarly, FAO data were found to be equally consistent with UNFCCC emissions data [
5]. In particular, total emission for Annex I countries, at about 34 Mt CO
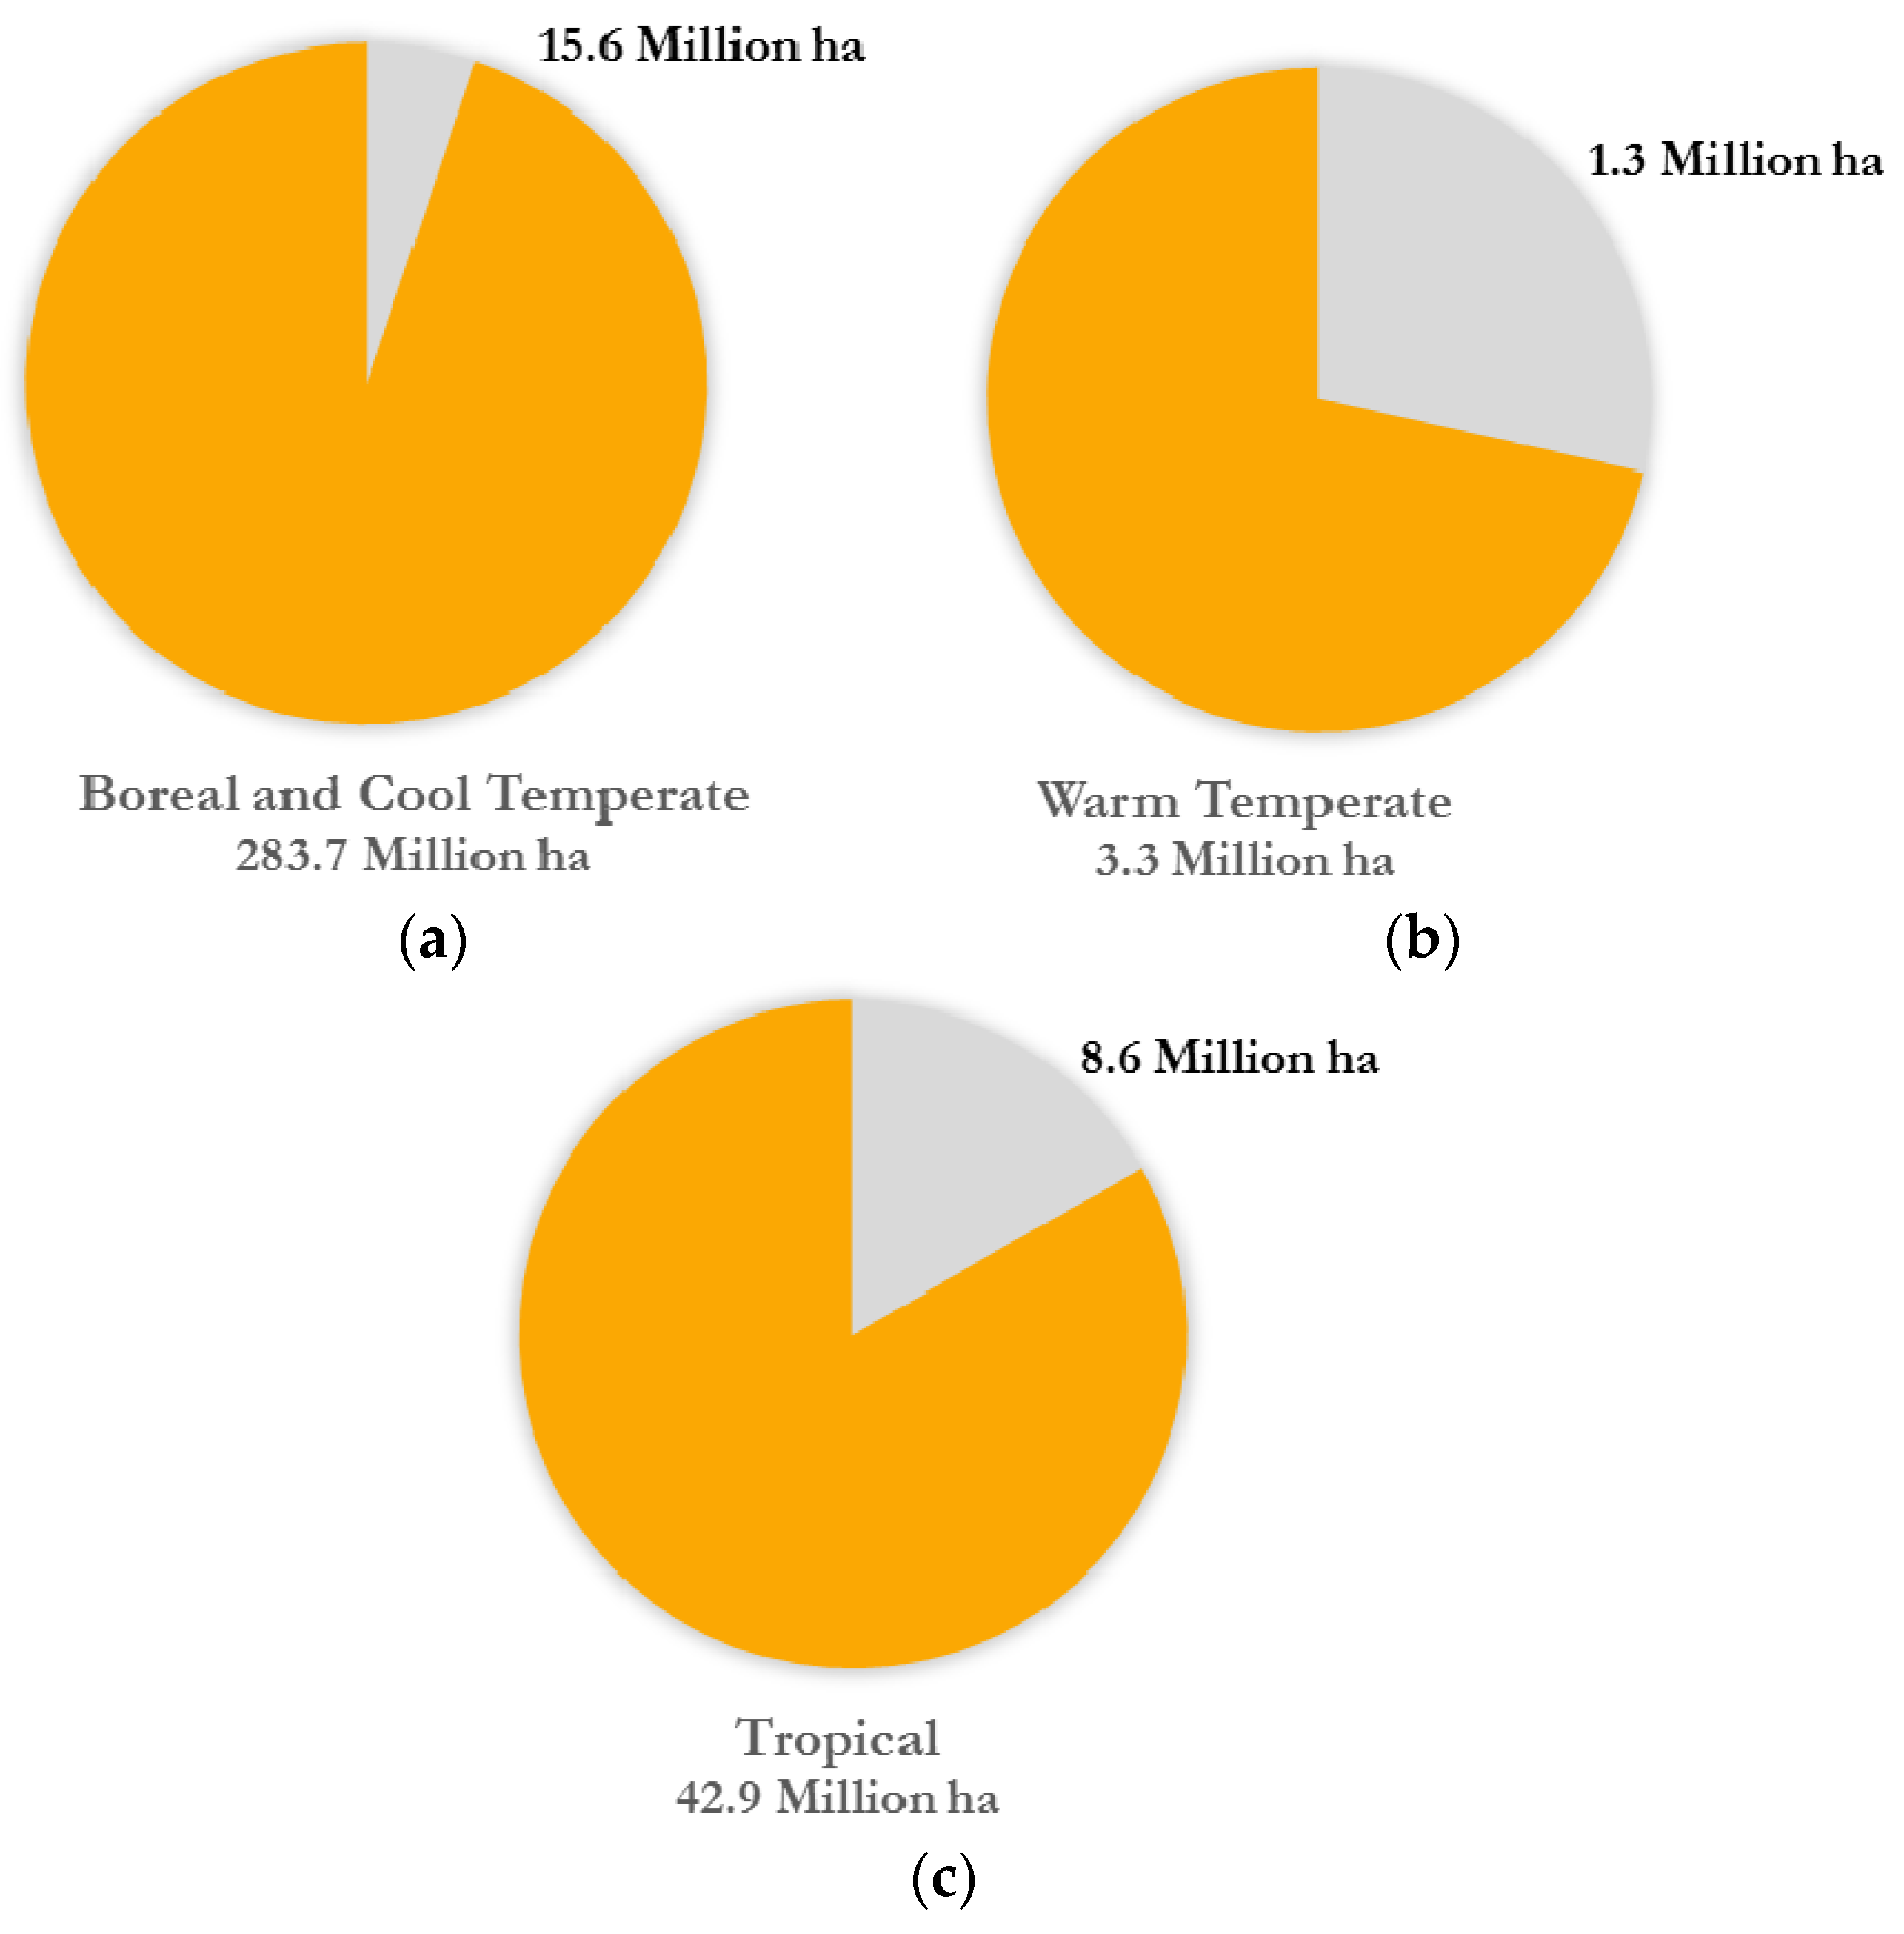
2eq, were similar to FAO estimates for boreal and cool temperate countries, (
Figure 6), the latter corresponding to the climatic zones of developed countries with significant organic soil areas.
5. Conclusions
We produced a comprehensive, worldwide assessment of GHG emissions from drained organic soils under cropland and grassland, based on a new statistical methodology comprising detailed multi-step analyses carried out geospatially, with subsequent country aggregations. All the data produced herein are available freely on relevant FAO data servers, covering information on the areal extent of organic soils and drained organic soils under cropland and grassland, emission factors, and emissions. Dissemination of the statistical data includes both for the underlying geospatial maps through the FAO GeoNetwork [
27] and the aggregated national statistics via FAOSTAT [
6].
Results of our analysis indicated that emissions from drained organic soils in agriculture are significant at present, totaling nearly one billion tonnes of CO2eq annually Of this, the CO2 component, about 780 million tonnes, represented more than one-fourth of the net CO2 emissions from the agriculture, forestry, and land use sector. A few key countries, largely in Southeast Asia, make the largest contribution to the observed global trends.
Organic soils, and peatlands in particular, will furthermore likely continue to be a hotspot of greenhouse gas emissions of global importance, as a function of the underlying agriculture development. To this end, our work highlighted the need to better integrate past, current, and future trends in crop cultivation, including crop plantations, into existing geospatial information, in order to improve current estimates of and better predict the future extent of drained organic soils and their impact on climate.


 and
and 


