Article

Urbanization and Sustainability: Comparison of the Processes in “BIC” Countries

1
Institute of Geographical Sciences and Natural Resources Research, Chinese Academy of Sciences, 100101 Beijing, China
2
Department of Land Management, Huazhong Agricultural University, 430070 Wuhan, China
*
Authors to whom correspondence should be addressed.
Sustainability 2016, 8(4), 400; https://0-doi-org.brum.beds.ac.uk/10.3390/su8040400
Submission received: 8 March 2016 / Revised: 15 April 2016 / Accepted: 15 April 2016 / Published: 22 April 2016
(This article belongs to the Section Sustainable Urban and Rural Development)

Abstract

:
The urbanized world has brought social, economic, and environmental sustainability into challenged surroundings in rapidly rising countries, thereby requiring the exploration of their intertwined relationships. This study regarded Brazil, India, and China as “BIC” countries to be the representative study areas for our investigation of sustainability in the context of rapid urbanization. In general, our work was synthesized into a comparison framework in four aspects: rural–urban relation, industrial development, city development, and urban landscape pattern. We determined that rural–urban dichotomy exists in all study areas, with India and China having a high degree. China was identified as a manufacturing-based country in the past half-century, whereas Brazil and India have the service sector as their primary industry. The distribution of large cities follows a regional pattern, with Brazil being northeast-focused, China being southeast-focused, and India being comparatively balanced. The Amazon forest in the north brings great challenges to Brazil with respect to the conservation of its biodiversity and eco-environment. India and China have encountered tremendous urban expansion or sprawl in the past several decades. The sustainability issues in social, economic, and environmental aspects for Brazil, India, and China were summarized in the context of rapid urbanization to provide references for other countries.

1. Introduction

The urbanized world has brought social, economic, and environmental sustainability into increasingly challenged surroundings, which necessitate the exploration on their intertwined relationships, particularly in the rapidly rising countries [1,2,3]. The urban population has increased from 2.3 billion to 3.9 billion from 1994 to 2014, indicating that more than half of the world’s population currently dwells in urban areas [4]. At the same time, urban ecosystems and landscapes have become increasingly domesticated and vulnerable though urbanization [5]. A series of eco-environmental problems such as resource consumption, biodiversity, climate change, and environmental degradation have emerged and sprawled [6,7]. In the context of rapid urbanization, cities have become the engines of socio-economic development, and resolving such problems in these highly dense urban areas requires further investigation [8].
The relationship between urbanization and sustainability has long been the focus of numerous studies [9]. In the recent surge of interest in sustainability, some scholars believe that urbanization is the key to regional and global sustainability, whereas others regard urban sustainability as an oxymoron [5]. For a long time, the interaction between urbanization and sustainability is embodied in ecological sustainability, which is closely linked to ubiquitous urban sprawl and social sustainability correlated with continuous urban population growth. In an ecological sense, the past several decades have seen a widespread urban expansion in developing countries such as China and India. Such expansion has put enormous strain on its supporting ecological systems. Impervious lands such as settlements and highways have sprawled rapidly with the cost of cropland, forest, wetland, and other lands with high ecological values in urban areas. In this case, although the urban landscape has been transformed into a manageable pattern in terms of its connectivity and compactness [10], the ecological habitat is greatly challenged because the urbanized landscape profoundly affects the related ecological processes and services [11]. In a socio-economic sense, sustainability revolves around two core themes (i.e., “social equity” and “economic balance”) all the way through [11,12]. Social inequality is associated with issues such as social welfare for rural migrants [13], separation of peasants from their land leading to the deterritorialization of the peasantry [14], weak social ties in the urban setting with increasing rural–urban migration [15], and increasing health risks from air pollution, occupational hazards, and traffic injury [16]. In its initial stage, urbanization positively affects the social aspects, including social mobilization, literacy, political participation, education, income, and health. However, these effects become negative when urbanization goes beyond the carrying capacity of the city [17]. Economic balance mainly refers to a holistic framework for industrial development in different sectors [18]. A number of developing countries have experienced rapid industrialization and urbanization [19]. In recent years, the service sector, which requires a variety of manual labor, has rapidly become the leading sector in the industrial structure of many countries [20]. Under this industrial transformation, the requirements for natural resources and energy use have expanded, thereby threatening the carrying capacity in certain areas. Consequently, economic balance is vital to achieving the harmonious development between human activities and the natural environment [21].
In this study, Brazil, India, and China are considered “BIC” countries to be our representative study areas for investigating sustainability and urbanization. Jim O’Neill first introduced the BRIC countries—Brazil, Russia, India, and China—almost one and a half decades ago through a Global Economics Paper of the Goldman Sachs entitled “Building Better Global Economic BICs” [22]. These countries with large geographic and demographic sizes and high economic potential have experienced unprecedented boom in socio-economic development and have occupied increasingly relevant positions in the world economy. However, a series of essential problems in this course, such as increasing socio-economic discrepancies between rural and urban areas as well as air, aquatic, and terrestrial pollution, cannot be disregarded [23]. Distinguishable development trajectories provide characteristic references for exploring the sustainable urbanization pathways. As a result, Brazil, India, and China are chosen as the representative countries of our study to summarize the similarities and differences in the process of urbanization. Russia is excluded from such investigation because it has undergone the remarkable dissolution of the Soviet Union, and the data analysis on the urbanization of this country is inconsistent with those of other countries.

2. Framework of Probing into Urbanization and Sustainability

Urbanization and sustainability are two independent academic terms that have their own definitions. These terms are also two dependent processes that give rise to the combined term “urban sustainability” or “sustainable urbanization”. As illustrated in Figure 1, some important issues in these integrated concepts, including human well-being, urban ecosystem service, urban resilience, and urban planning, have been highlighted for a long time. Looking into the interaction of urbanization and sustainability basically lies in the decomposition of human-oriented and land-dominated urbanization, understanding of social and ecological sustainability, and the approaches to relate them in a suitable and pragmatic manner. Social sustainability is closely associated with human-oriented urbanization, in which coordination and structure are essential components and rural–urban and industrial coordination are the primary reflections. The nexus between ecological sustainability and land-dominated urbanization has been increasingly close. Urban system and urban landscape have been transformed in the context of rapid urbanization; as a result, city development and urban landscape pattern need to be analyzed. In this sense, four aspects, namely, rural–urban relation, industrial development, city development, and urban landscape pattern, are considered the interface that connects urbanization and sustainability. We then synthesized our studies into a comparison framework in these aspects. Given that urbanization and sustainability are evolving processes that include spatial and temporal dimensions, we collected annual data to reflect the temporal variations and implemented our analysis at the city and country levels.
(1)
Rural–urban relation: Urbanization is a rate measured by the percentage of urban population to total population and is a dynamic population shift from rural to urban areas. The proportion of urban and rural population reflects the social structure, and the integrated urban and rural development is the ultimate goal of urbanization. The analysis of the rural–urban relation generally incorporates three elements, namely, demographic comparison, the gap between urban and rural socio-economic developments, and the well-being of the people. Therefore, we investigated the urban–rural relation primarily from the populations of these areas and their related gaps.
(2)
Industrial coordination: Industrial development defines the economic structure of urbanization, which provides opportunities for progress in different industries. In most cases, the agricultural industry appears in rural areas more than other industries, whereas the manufacturing, service, and construction industries are popular in urban areas. The divergence and convergence of industrial development also configure the role of marketing and the economic growth mechanism, which are closely associated with contemporary urban development. Hence, we selected three sectors (i.e., agriculture, manufacturing, and service) that account for a large proportion of the GDP to calculate their proportions and represent economic sustainability. Urbanization is an entangled part of the comprehensive development in each country, indicating the necessity to measure its pace with industrialization. As such, we introduced the coordination ratio to quantify the relation of urbanization with industrial development and urban population growth.
  C R I = I R t 1 I R t 2 U R t 1 U R t 2
where CRI represents the coordination ratio between industrial development and urbanization, URti is the urbanization rate, and IRti refers to the industrialization rate.
(3)
City development: City is the political, cultural, and economic center of a region or country. The urban system of a developing country is reflected in the city’s size and categorization, which has experienced tremendous changes in the past several decades. Urbanization creates unprecedented opportunities for cities, and a series of strategic planning and specific measures have been taken to accommodate these changes. At the city level, we probed into city development by analyzing representative large cities and their changes.
(4)
Urban landscape pattern: Urbanization is also characterized by evident landscape changes, which have been the focus in the context of “land-dominated” urbanization. Here, we first extracted the land use distribution from medium-high resolution images and then employed landscape pattern indices to describe the composition and configuration of an urban land use across a landscape [24,25]. Specifically, we used Shannon’s diversity index (SHDI) and contagion index (CONTAG) to perform landscape analysis at the city level. SHDI is an index based on information theory widely applied in landscape ecology studies [26]. This index indicates the patch diversity in the landscape and equals 0 when the landscape contains only one patch. It increases when there are more patches with different land use categories. CONTAG measures the aggregation level in the landscape; it approaches 0 when the patch types are maximally disaggregated and equals 100 when all patch types are maximally aggregated [27]. Based on the analysis on city development, we selected representative cities to calculate the means and standard deviations of the landscape indices to reveal the landscape pattern of urban areas in each country.
As mentioned previously, the study areas included Brazil, India, and China. The primary datasets from the World Bank were used to analyze socio-economic development. The land use maps from global land use data with a spatial resolution of 30 m and were provided by the Chinese Academy of Sciences were also adopted (GlobaLand 30). Dataset at the city level are retrieved from [28]. Other auxiliary data on housing, migration and related issues in the process of urbanization are obtained from a large amount of literature.

3. Sustainability in the Rural–Urban Relation

Brazil, India, and China have their own characteristics and common features in the urban–rural relation. The baselines of the population in China and India are significantly higher than that in Brazil. Although these countries show unremitting growth in urban population, the growths in Brazil and India were linear and that in China was exponential between 1960 and 2013. Large disparities appear in the rural population among these countries, with Brazil showing a slight declining trend, India showing an obvious increase, and China showing an inverted U-shaped pattern. The growth rate of urbanization is persistently significantly higher than that of the rural population growth in Brazil and India. China embodied a distinct urbanization trajectory with fluctuations of growth rates in the urban and rural populations before 1976. Since the implementation of its Reform and Opening-up Policy, the level of urbanization in China increased to a high level, with a growth rate over 5%.

3.1. “Ambiguous” Rural–Urban Dichotomy in Brazil

Brazil is one of the typical cases of demographic transition in Latin American countries because of its high urbanization level and periodical rural–urban migration over a few decades (Figure 2). Brazil’s total population underwent an explosive growth from 72.8 million in 1960 to more than 200 million today, becoming the fifth most populated country in the world. This population growth is mostly attributed to a high urban growth and rural–urban migration [29]. From a demographic point of view, Brazil saw a high urban growth rate of around 5% annually in the 1960s, which declined to slightly over 1% in the recent decade, although its urban population has undergone a five-fold increase from 35 million in 1960 to 170 million in 2013. By contrast, the rural population of Brazil declined from 40 million to nearly 30 million and underwent a negative growth by the end of the 1970s. Although the rural–urban disparity emerges and remains in demographic aspects, it has not necessarily been regarded as a negative factor of a sustainable rural–urban relation. In Brazil, the ambiguous rural–urban dichotomy is the true threat to social sustainability. In the 1990s, non-farm activities in rural areas increased because of the pseudo migrants. A proportion of the urban residents were members of multi-sited households and participated in rural land use decisions [30,31,32]. In urban areas, poverty stricken or economically lagging areas always exist, giving rise to the favelas. This finding is also evidenced by the higher infant mortality rate in urban areas than in rural areas for certain groups [33]. Fertility and mortality rate, widespread favelas, continued migration, and deconcentration process are key issues that affect the sustainability of rural–urban relations in Brazil [34].

3.2. Growth with Barriers in India

The urban and rural areas in India have shown simultaneous and similar growth, with the urban population growing more rapidly than the rural population (Figure 3). In 1960, the urban population of India was over 80 million, which was less than a quarter of the rural population. In 2013, this number increased to 400 million, which was almost half of the rural population. In the 1970s, the urban population of India experienced an abrupt growth rate that rose to a high level of 4%, which was largely attributed to massive public-sector investment and rapid urbanization. Since 1980, the urban and rural population growth rates of India have started to decline. Although the urbanization in India has brought growth for its urban and rural populations, the obstacles in social mobility and the popularity of squatter developments have limited the population growth and the improvement of living standards in the country. The caste system remains entrenched in spite of government efforts to uproot it, and a considerable portion of the Indian population, particularly dark-skinned Indians, are forced to perform jobs deemed to be inferior with profitless manual labor. Comparable to Brazil, India has slums that are pervasive and have migrated from rural to urban areas. As a result, social sustainability remains a sensitive issue in the context of the traditional hierarchical system in India although its urban and rural populations appear to be changing stably.

3.3. Unprecedented Urbanization with Apparent Discrepancy in China

In China, the urban and rural populations have experienced tremendous changes, with the rural population being five times greater than the urban population in 1960 but with the urban population exceeding the rural population in 2013 (Figure 4). The urban population in China presents a continuous growth, and the margin of this growth is greater since 1980 when the Cultural Revolution ended. In 2013, the urban population reached 721 million, accounting for 53% of the total population. Nonetheless, the rural population increased more rapidly than the urban population in the 1960s and 1970s, but began to undergo a plateau in the 1980s. The rural population started to decline when it reached the peak of 836 million at the beginning of the 1990s. The growth rate of urban population showed an irregular pattern, where an abrupt drop occurred in 1963 and lasted until 1976. This decade corresponded to the Cultural Revolution in China, during which a large number of intellectuals were sent to the countryside for farming. This event brought great social instability and impeded the urbanization process in China since its independence. Thereafter, the growth rate of the urban population in China increased dramatically to the level of approximately 5% before the Cultural Revolution. In the 1980s, the Reform and Opening-up Policy was implemented. Cities, towns, and counties have ushered in a new era of development although the growth rate of the urban population still declined continuously and slightly. The growth rate of the rural population experienced a high level during the Cultural Revolution but began to decline since the 1970s and demonstrated a negative growth in the 1990s. Nowadays, the livelihood of the rural migrants and rural poor remains a difficult problem to solve. The wide gap between the urban residents and rural migrants has led to the social polarization in a number of megacities in China. Remote villages are still highly lagging and suffer from poverty problems. To address these issues and achieve a sustainable rural–urban relation, New Urbanization Planning has been issued in China to promote a harmonious, coordinated, and united rural–urban development.

4. Sustainability in Industrial Development

4.1. Industrial Structure

The importance of Brazil, India, and China in world economy is noticeable, and their sustainability in industrial development is a great concern of the global economy. In 2013, the BRIC economies accounted for one-fifth of the world’s GDP, constituting an irreplaceable proportion of the global economic development. The annual average growth rates of the GDPs of China, Brazil, and India amount to 14.96%, 8.56%, and 8.34%, respectively, significantly higher than those of many developed countries. With regard to the industrial structure, Table 1 summarizes the proportion of the agricultural, manufacturing, and service sectors in GDP from 1960 to 2013.
Despite the generally decreasing share of the agricultural sector in GDP, the process of production transferring to the industrialized and service sectors is inevitable. In general, the service industry dominated the GDP of Brazil since 1960, and India saw a shift in its prominent industry from agriculture to the service industry since 1980. Before 2000, industrialization brought a large proportion of industrial outcome, and the service sector caught up gradually in China. Specifically, the contribution of the agricultural sector to the GDP decreased between twofold and fourfold in the past 50 years, and the service sector increased in the same period by 13.17% in India and by 26.98% in Brazil. The industrial structure determines land use structure, resource consumption, and energy use to some extent. The declining trend of the proportion of the agricultural sector to the GDP is unavoidable considering the demand for high-valued productions. However, such trend is closely related to food security and conservation issues in largely populated countries. As a result, the guarantee of a considerable proportion in agriculture is vital for socio-economic sustainability. Industrialization brought great opportunities for the manufacturing and construction sectors, but these sectors are generally high-resource-consuming industries that produce various pollutants detrimental to the environment. Therefore, the service sector has gradually replaced the manufacturing sector as the dominant sector in the industrial structure in many countries such as India and China. The service sector is usually labor-focused and knowledge-based, requiring stability in human resources. In sum, the changes in the economic structure of Brazil, India, and China conform to the urbanized context, and the requirements for their sustainable development may affect their industrial development profoundly in the future.

4.2. Industrial Coordination with Urbanization

The sustainability in industrial development lies not only in its own structure but also in its coordination with urbanization. According to the formula cited in Section 2, the coordination ratio is calculated, and the result is shown in Table 2. In Brazil, the coordination ratio with the agricultural industry started at 0.45 in 1960, indicating that urbanization grew twice as fast as the development in agriculture. In 2013, the ratio declined to 0.067 largely because of the stagnation of the agriculture sector in recent years. India and China exhibited the same case in the 1990s, with the declining trend of the coordination ratio with agricultural industry. However, the growth rate of agriculture was higher than that of urbanization in India and China before 2000, conforming to the fact that these countries are well known as important agricultural countries. Later, the urbanization ratio increased rapidly, and all coordination ratios with these three sectors declined. Most of these ratios declined to below 1, which implied that industrial development began to lag behind urbanization. In the manufacturing industry, China prevails in the coordination ratio since 1960 because of its unprecedented industrialization. The growth rate of urbanization surpassed the industrial growth rate until the most recent decade. India has topped in the coordination ratio with the service industry from 1960 to 2013. In Brazil, the growth rates of the manufacturing and service sectors were slower than that of urbanization in the past 50 years, indicating that urbanization has helped promote industrial development. In essence, the proposition of coordination ratio is the reflection of a synchronized process between industrial development and urbanization. Although the relationships between various sectors and urbanization differ from one another, a sustainable urbanization requires a relatively stable change. When urbanization grows significantly faster than industrial development, the economy is likely to be incapable of supporting the urbanized population. Contrarily, when industrial development such as the progress in the manufacturing or service sector precedes urbanization to a great extent, city development should be strengthened to improve people’s livelihood and living standards. In general, adjusting industrial development or urbanization is necessary to realize an increasingly sustainable urbanization.

5. Sustainability in City Development

As the spatial agglomeration of production, wealth, and consumption, cities command an increasingly dominant role in the global economy. The rapid urban growth throughout the developing world is seriously outstripping the capacity of most cities to provide adequate services for their citizens. Over the next 30 years, virtually all of the world’s population growth is expected to be concentrated in urban areas in the developing world. Consequently, a sustainable urban system has been highlighted to balance city development at different levels and in different regions.
City developments in Brazil, India, and China experience different trajectories, whereas the crucial roles of large cities are the same. Table 3 lists the number of cities in the BIC countries with populations greater than five million and in the range of one million to five million in 1990, 2000, and 2010. India and China have the most cities with populations over five million and in the range of one million to five million in 1990. In 2010, China ranks first with 14 cities with populations greater than five million and with 70 cities with populations ranging from one million to five million. The population of Brazil lags behind those of India and China, especially in medium-highly populated cities. Table 4, Table 5 and Table 6 list the top 10 cities in Brazil, India, and China with the largest populations in 2010.
Most of the large cities in Brazil, such as Sao Paulo, Rio de Janeiro, Salvador, and Belo Horizonte, are located on the eastern coastal area. Many of the cities in Brazil are located on a coastline of more than 8600 km, which encompasses approximately 20% of the total Brazilian population distributed within 17 states, 395 municipalities, and 16 metropolitan regions [35]. The abundance in natural resources in coastal zones clearly explains this intensive distribution. The urbanization in these cities is also associated with the “spreading” of the historical urban–industrial concentration in the southeast. Historically, Sao Paulo and Rio de Janeiro have become the densest and most dynamic urbanized cities with an integrated urban system in the 1950s, and this superiority remains until now. The population of Sao Paulo peaked at 11.79 million and that of Rio de Janeiro reached 6.45 million in 2014, ranking at 141 and 229, respectively, according to the Global City Competitiveness index in 2011–2012. However, the population growth rates in these megalopolises lagged behind in the past two decades. From 2010 to 2014, the population growth rate in Rio de Janeiro was 2.11%. As found in many other countries, this phenomenon was largely attributed to the economic and industrial decentralization since the 1970s. The readjustment of the regional development strategy gradually made both cities lose the momentum and stimulated the development of Belo Horizonte, Porto Alegre, and other well-equipped selective and externalities-rich areas. Since the 1990s, with the formation of Brasilia’s hinterland and the process of regional metropolization, a new socio-spatial dynamics of the Brazilian urbanization was observed in the Center-West Region [34]. Brasilia saw a noticeable population growth from 1991 to 2010, most of which was attributed to the absorbing of an expressive contingent of northeast immigration. As a large regional center in the north, Manaus exhibited an expressive urbanization expansion and was characterized as a migrant pull center. The population of this city was slightly above one million in 1991 and even doubled at the end of 2014.
The city development in India does not show apparent spatial clustering. Three large cities—Mumbai in the west, Delhi in the north, and Kolkata in the east—with enormous populations, present the economic rewards and unique challenges in urbanization [36]. Since 2000, the populations of all these cities have exceeded 10 million, with Mumbai peaking at 18.39 million, Delhi at 16.35 million, Kolkata at 14.06 million in 2010. The singularity of the distribution of Indian cities was caused not only by the preponderance of these megalopolises but also by the presence of a set of “secondary cities” with large populations such as Chennai, Hyderabad, Bangalore, Ahmadabad, and Pune having populations of between four million and nine million in 2010 [37]. In the past two decades, cities in the west such as Ahmadabad, Pune, and Surat developed rapidly with a population growth rate reaching 85.1% in Surat from 1990 to 2000. Chennai, Bangalore, Hyderabad, and Ahmadabad were cities whose population growth rates were higher in 2000–2010 than those in 1990–2000. In particular, the population of Bangalore increased from 5.7 million to 8.52 million from 2000 to 2010, with a growth rate reaching 49.44%. This finding justified the statement that the region around Bangalore, in the “corridor” linking Hyderabad, Mumbai, Ahmedabad, and Delhi, experienced the most burgeoning city development. In general, city development is a two-tier hierarchy system in India, with Mumbai, Delhi, and Kolkata in the first class originating from the influence of the colonial period (the gateways to India by sea) and the rest of the cities with populations greater than five million as the second class, whose developments are promoted by endogenous urbanization over several centuries [37].
The urban development in China demonstrates an apparent spatial heterogeneity, with the northwestern cities lagging behind the southeastern cities. Beijing (the capital city of China), Shanghai (the harbor city in the east), and Guangzhou (the city in the southern coast) are the most developed cities, with populations of 16.45 million, 20.22 million, and 10.64 million in 2010, respectively. With remarkable economic, social, cultural, and political positions, these cities have also been the ideal destination for trans-city immigration for a long time. In the past two decades, the Chinese cities in the southern part have also experienced unprecedented development in terms of their socio-economic performances. In 1990–2000, the population growth of Dongguan peaked to 600.68%, and Foshan had a high growth rate of 144.47%. As the first economic zone established after the Reform and Opening-up Policy, Shenzhen has expanded at an extraordinary pace, and its population exceeded 10 million by the end of 2010. In 2014, China adjusted its “city categorization standard,” and all the cities listed in Table 6 are the newly defined megalopolises and metropolises according to this new categorization. China has also implemented a series of strategic policies to promote regional development in the middle and western parts of the country, where Wuhan (7.54 million in 2010), Chengdu (6.32 million in 2010), and Chongqing (6.26 million in 2010) are three representative centers driving regional development. In general, the population growth in 1990–2000 is greater than that in 2000–2010. With the rapid population growth in large cities, the eco-environment has been seriously threatened with intensive anthropogenic activities. As a result, cities such as Beijing have issued various population control policies and adjusted their urban planning to promote sustainable city development.
The investigation of city developments in Brazil, India, and China has shown that cities have been categorized into different levels. The coastal areas in Brazil and China have exhibited strengths with respect to city development, whereas Indian cities are spatially balanced. Increased urbanization level and growth rate have accelerated the expansion of cities demographically and spatially. Nevertheless, city development has brought great challenges to these urban agglomerations because the carrying capacity of natural resources is limited. As a result, sustainable urban development is expected to be in a balanced state between concentration and deconcentration, thereby requiring the adjustment of city size.

6. Sustainability in Landscape Pattern

In an urbanized world, landscape pattern has experienced various changes and has been closely linked to biodiversity and other ecological features. Urbanization is not simply a dichotomous diffusion–coalescence switching process but a spiraling process of shifting dominance among multiple growth modes: the wax and wane of infilling, edge-expansion, and leapfrogging across a landscape [11]. Each mode reshapes the urban structure, and landscape metrics have often served as tools for assessing the changes in pattern, process, and function [38]. In our study, land use structure and landscape ecological indices were used to analyze the sustainability in landscape pattern.

6.1. Land Use Structure

Figure 5 illustrates the land use distribution in Brazil, India, and China in 2010. All these countries have abundant natural resources. The dominant land use types in Brazil, Russia, India, and China are forest (49.05%), forest (52.82%), cropland (62.41%), and grassland (29.34%), respectively, corresponding to their particular industrial development characteristics. Compared with Brazil, a large proportion of India (4.44%) and China (1.56%) is composed of impervious lands that constitute the urban areas. Brazil exhibits a dividing line between its southeastern and northwestern parts in terms of the distribution of cropland and forest. The Amazon forest has occupied large areas in Brazil, whose most developed cities are entrenched in the southeastern area. India is a “cropland country,” where croplands are spread in all directions and forests are interspersed or found around the edges. In China, croplands are distributed in the northeastern area, grasslands and forests occupy a considerable area in the southwestern part, and bare land comprises the strip area of land in the northwestern part.
Land use structure is greatly influenced by physical background, especially in large countries such as Brazil, India, and China. Although the sustainability in land use can hardly be measured, a resilient land use structure is considered a more complex and abundant system. In recent years, rapid urbanization has led to the sprawl of urban areas, and the amount of natural resources such as forest and water areas has been seriously reduced. This finding is evidently observed in India and China, where the impervious surface continues to increase. To achieve sustainability in land use structure, vulnerable natural lands must be protected, and urban areas should be monitored and controlled accordingly.

6.2. Landscape Diversity and Aggregation

The most direct approach for measuring landscape pattern is to apply indices in landscape ecology to reveal spatial features for the manifestation of ecological resilience. Section 5 discusses the sustainability in cities, and Section 6.1 explains the sustainability in land use structure. To explore urban landscape patterns, we combined these works and selected sample cities with the largest populations in Brazil, India, and China to measure their landscape pattern using land use data. A total of 113 cities were extracted from Brazil, 102 from India, and 93 from China considering data availability and the consistency in urban boundary. All these cities are either economic and political centers or urban agglomeration with large geographical areas and have experienced noticeable development in recent years. As explained in Section 2, we chose SHDI and CONTAG as representative landscape ecological indices to reflect the land use diversity and contagion degree, respectively. As aforementioned, we selected sample cities for the landscape pattern analysis in each country. Table 7 represents the average value and standard deviation of CONTAG and SHDI of all the cities in different countries. Figure 6 illustrates the scatterplot of the values of SHDI and CONTAG of the sample cities in Brazil, India, and China. Compared with the case in Brazil, the range of the values of the contagion index is larger and the high values appear more in India and China, indicating that the patches in these countries are still aggregated in the urban landscape. SHDI is high in Brazil, implying that the patch types are equitable in urban areas. The disparity among the cities with respect to landscape diversity and aggregation level is the greatest in India and the least in Brazil. In general, when the patch types are increasingly diversified and disaggregated, the urban landscape becomes resilient. As a result, India and China still have a great potential to enrich their urban land use pattern to make it sustainable.

7. Comparison of Sustainable Development in BIC

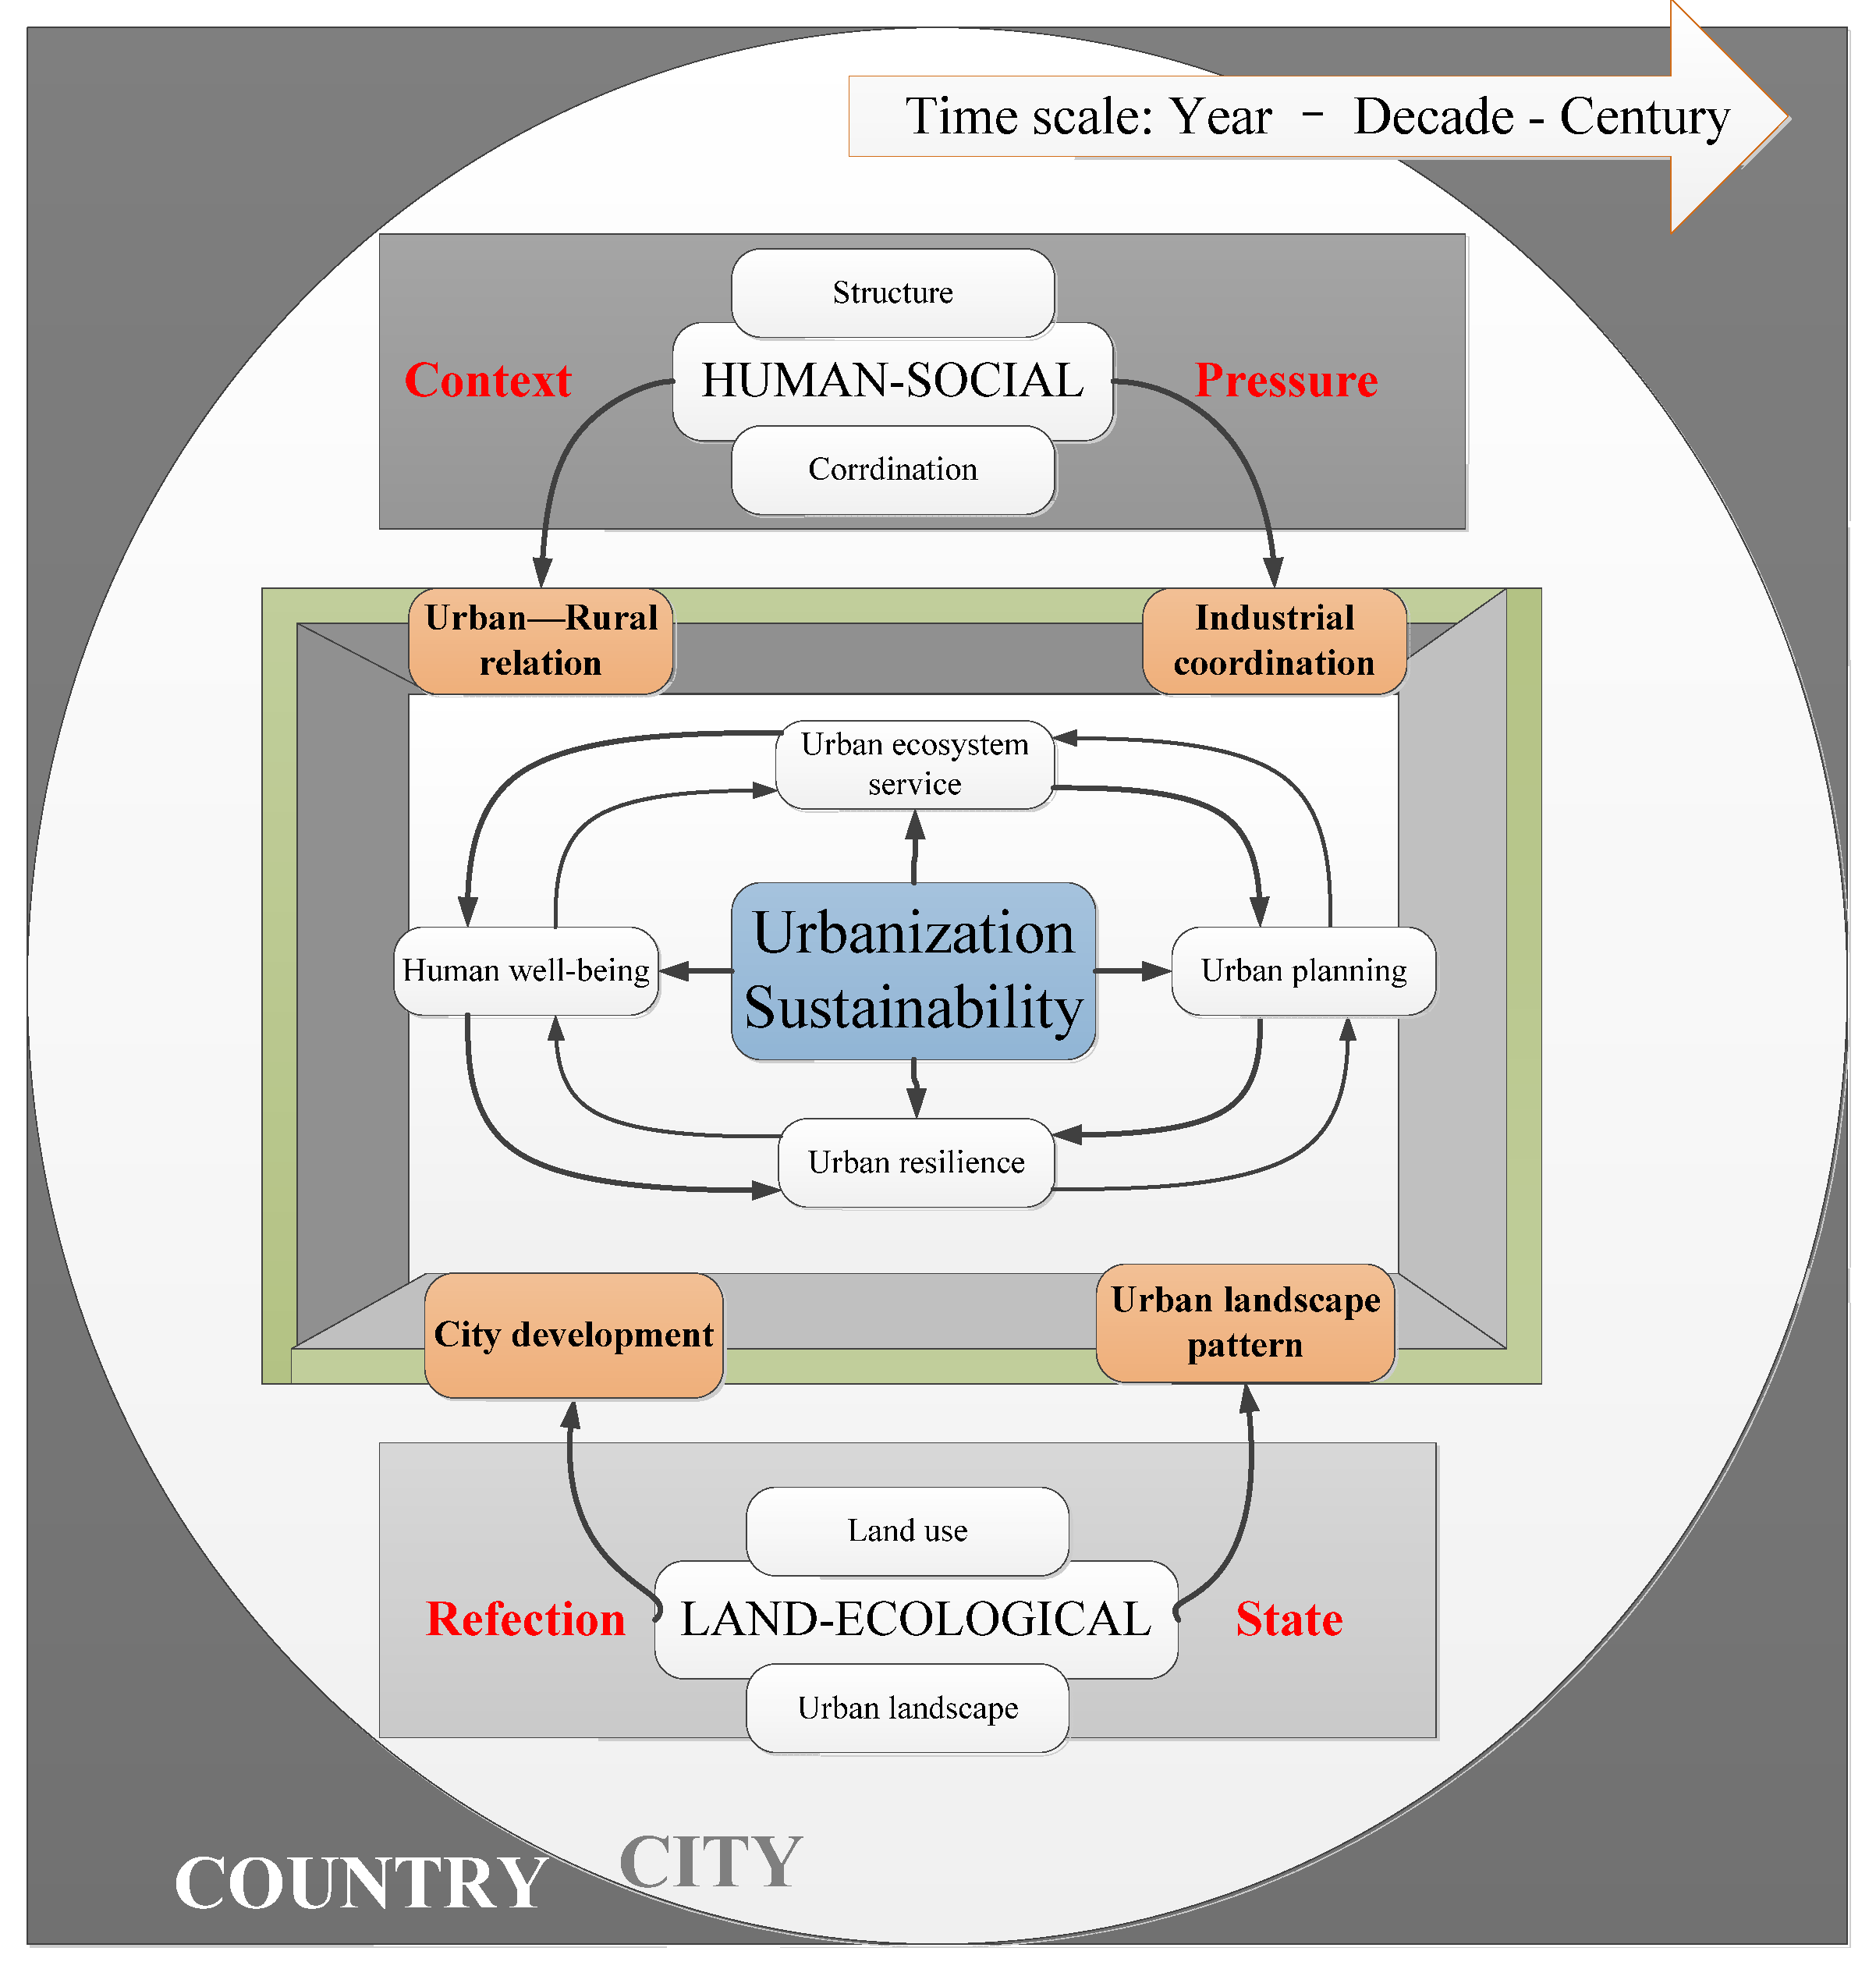
In this section, the sustainability status quo is discussed in the context of rapid urbanization and is decomposed into four parts, namely, rural–urban relation, industry, city development, and landscape pattern in Brazil, India, and China. These countries were selected as research subjects not only because of their identification as “BIC” countries worldwide but also in view of their representativeness as fast-growing, developing countries that encounter various sustainability problems. The distinguishing features were identified for comparisons and policy implications by exploring the trajectories of urbanization and related sustainable issues in these countries (Table 8).
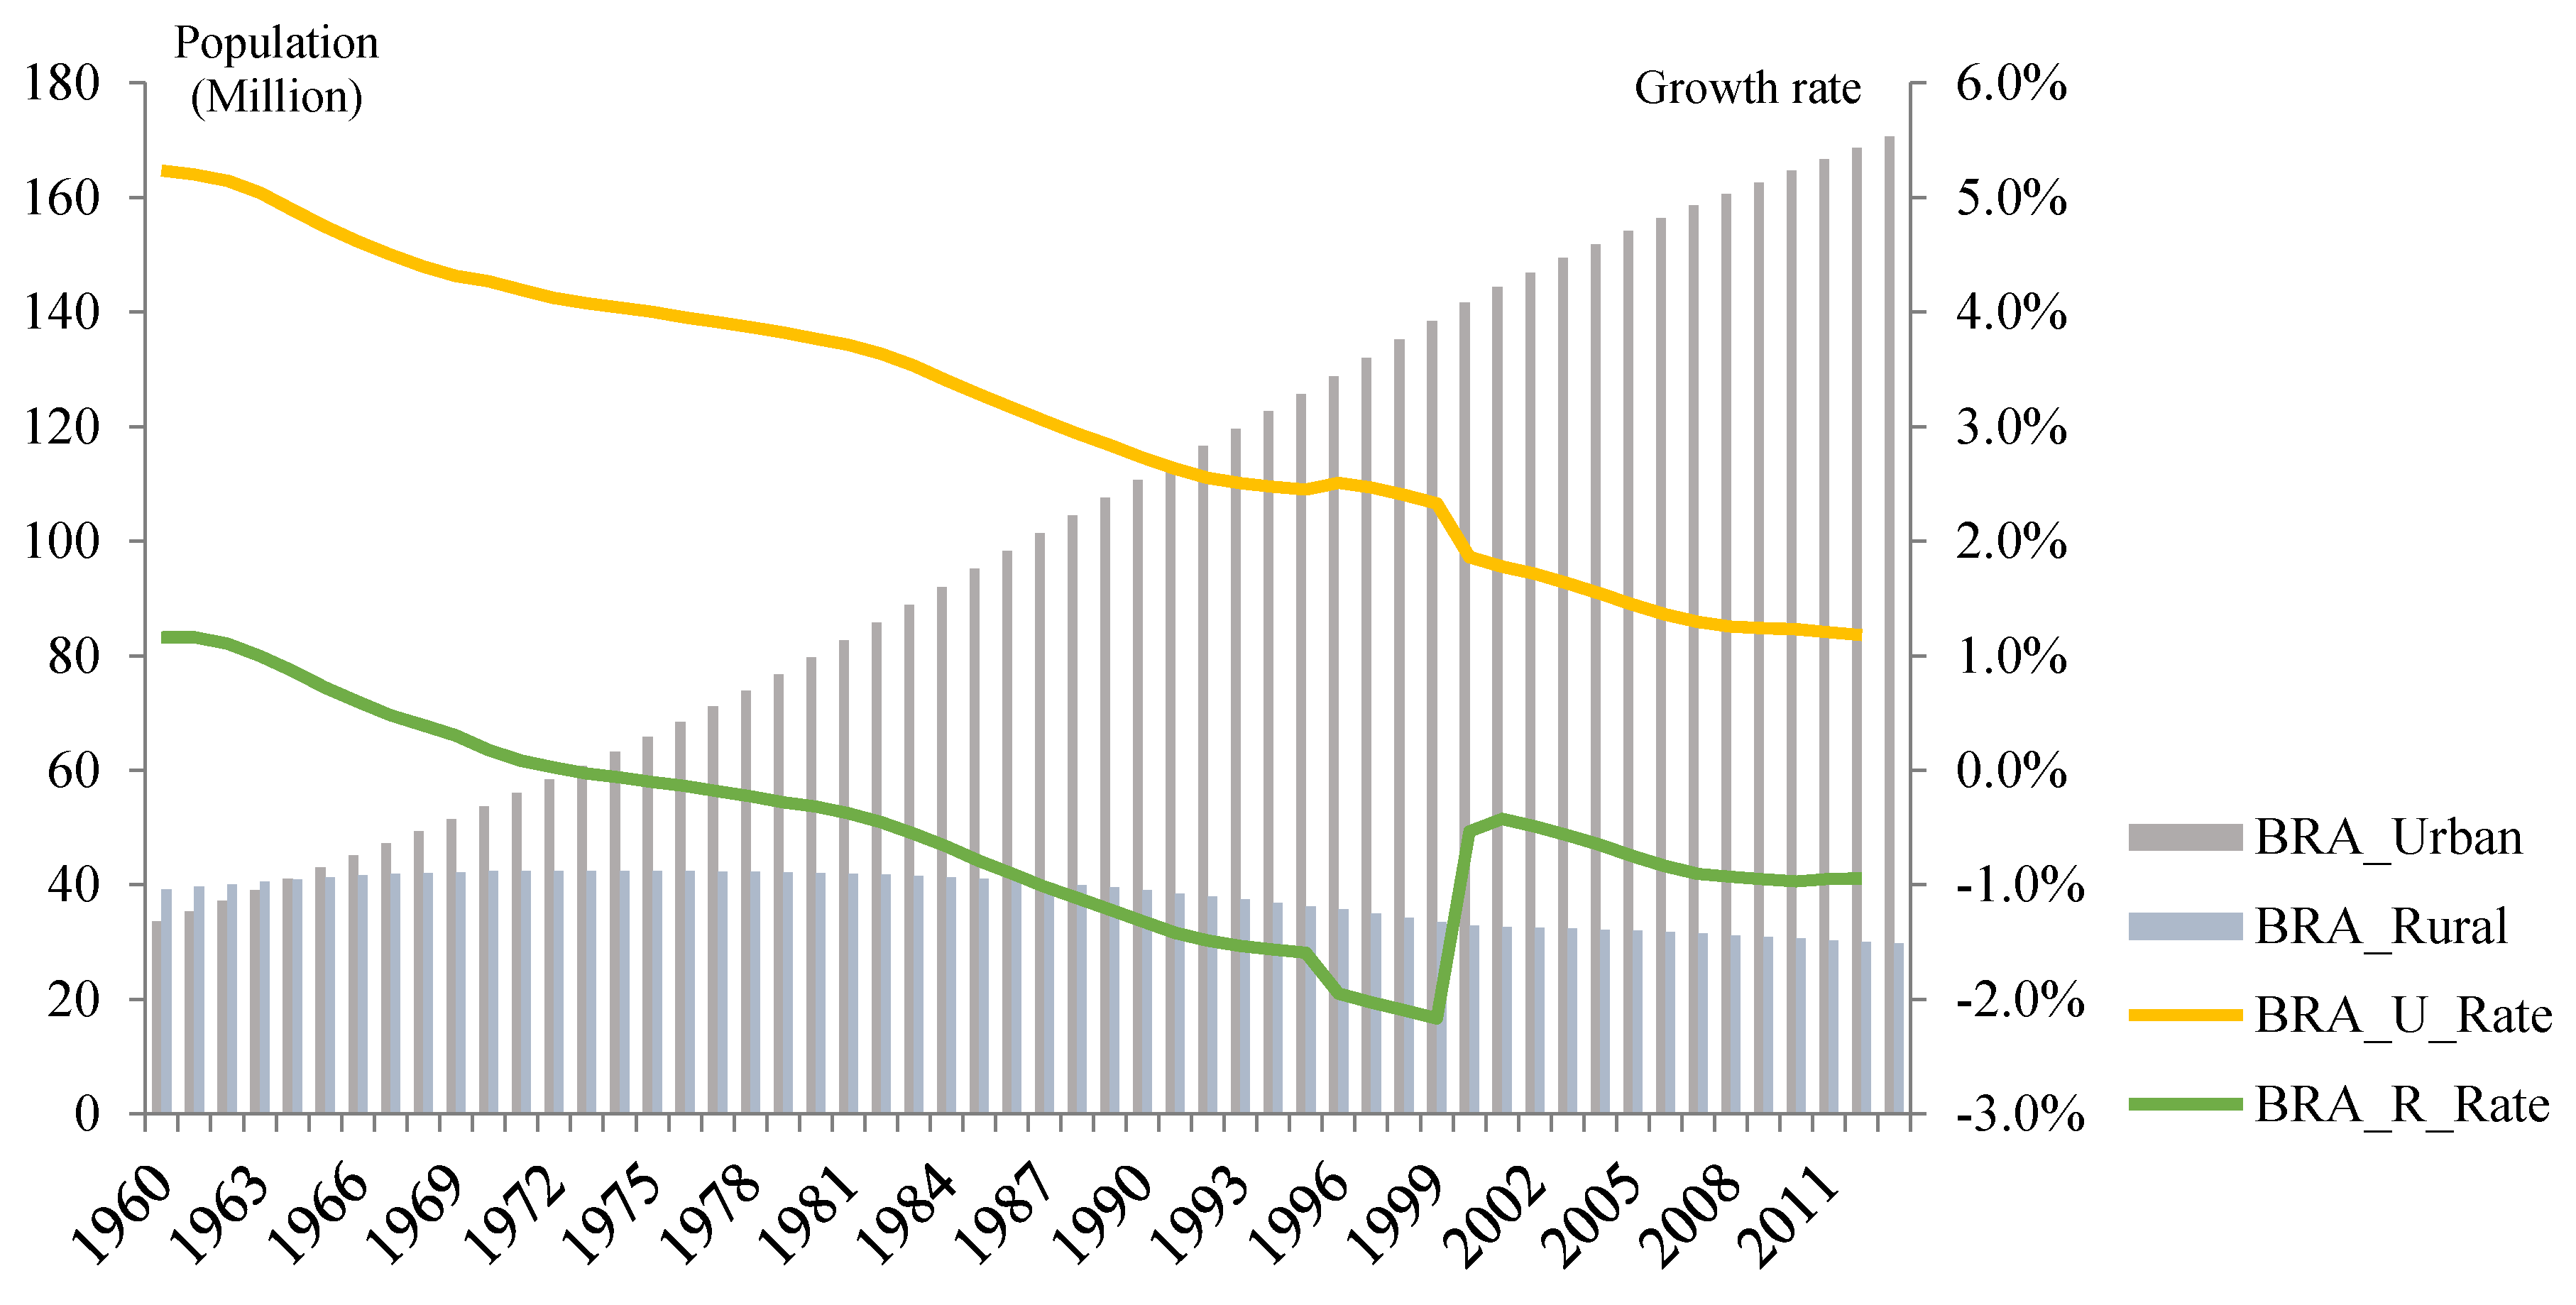
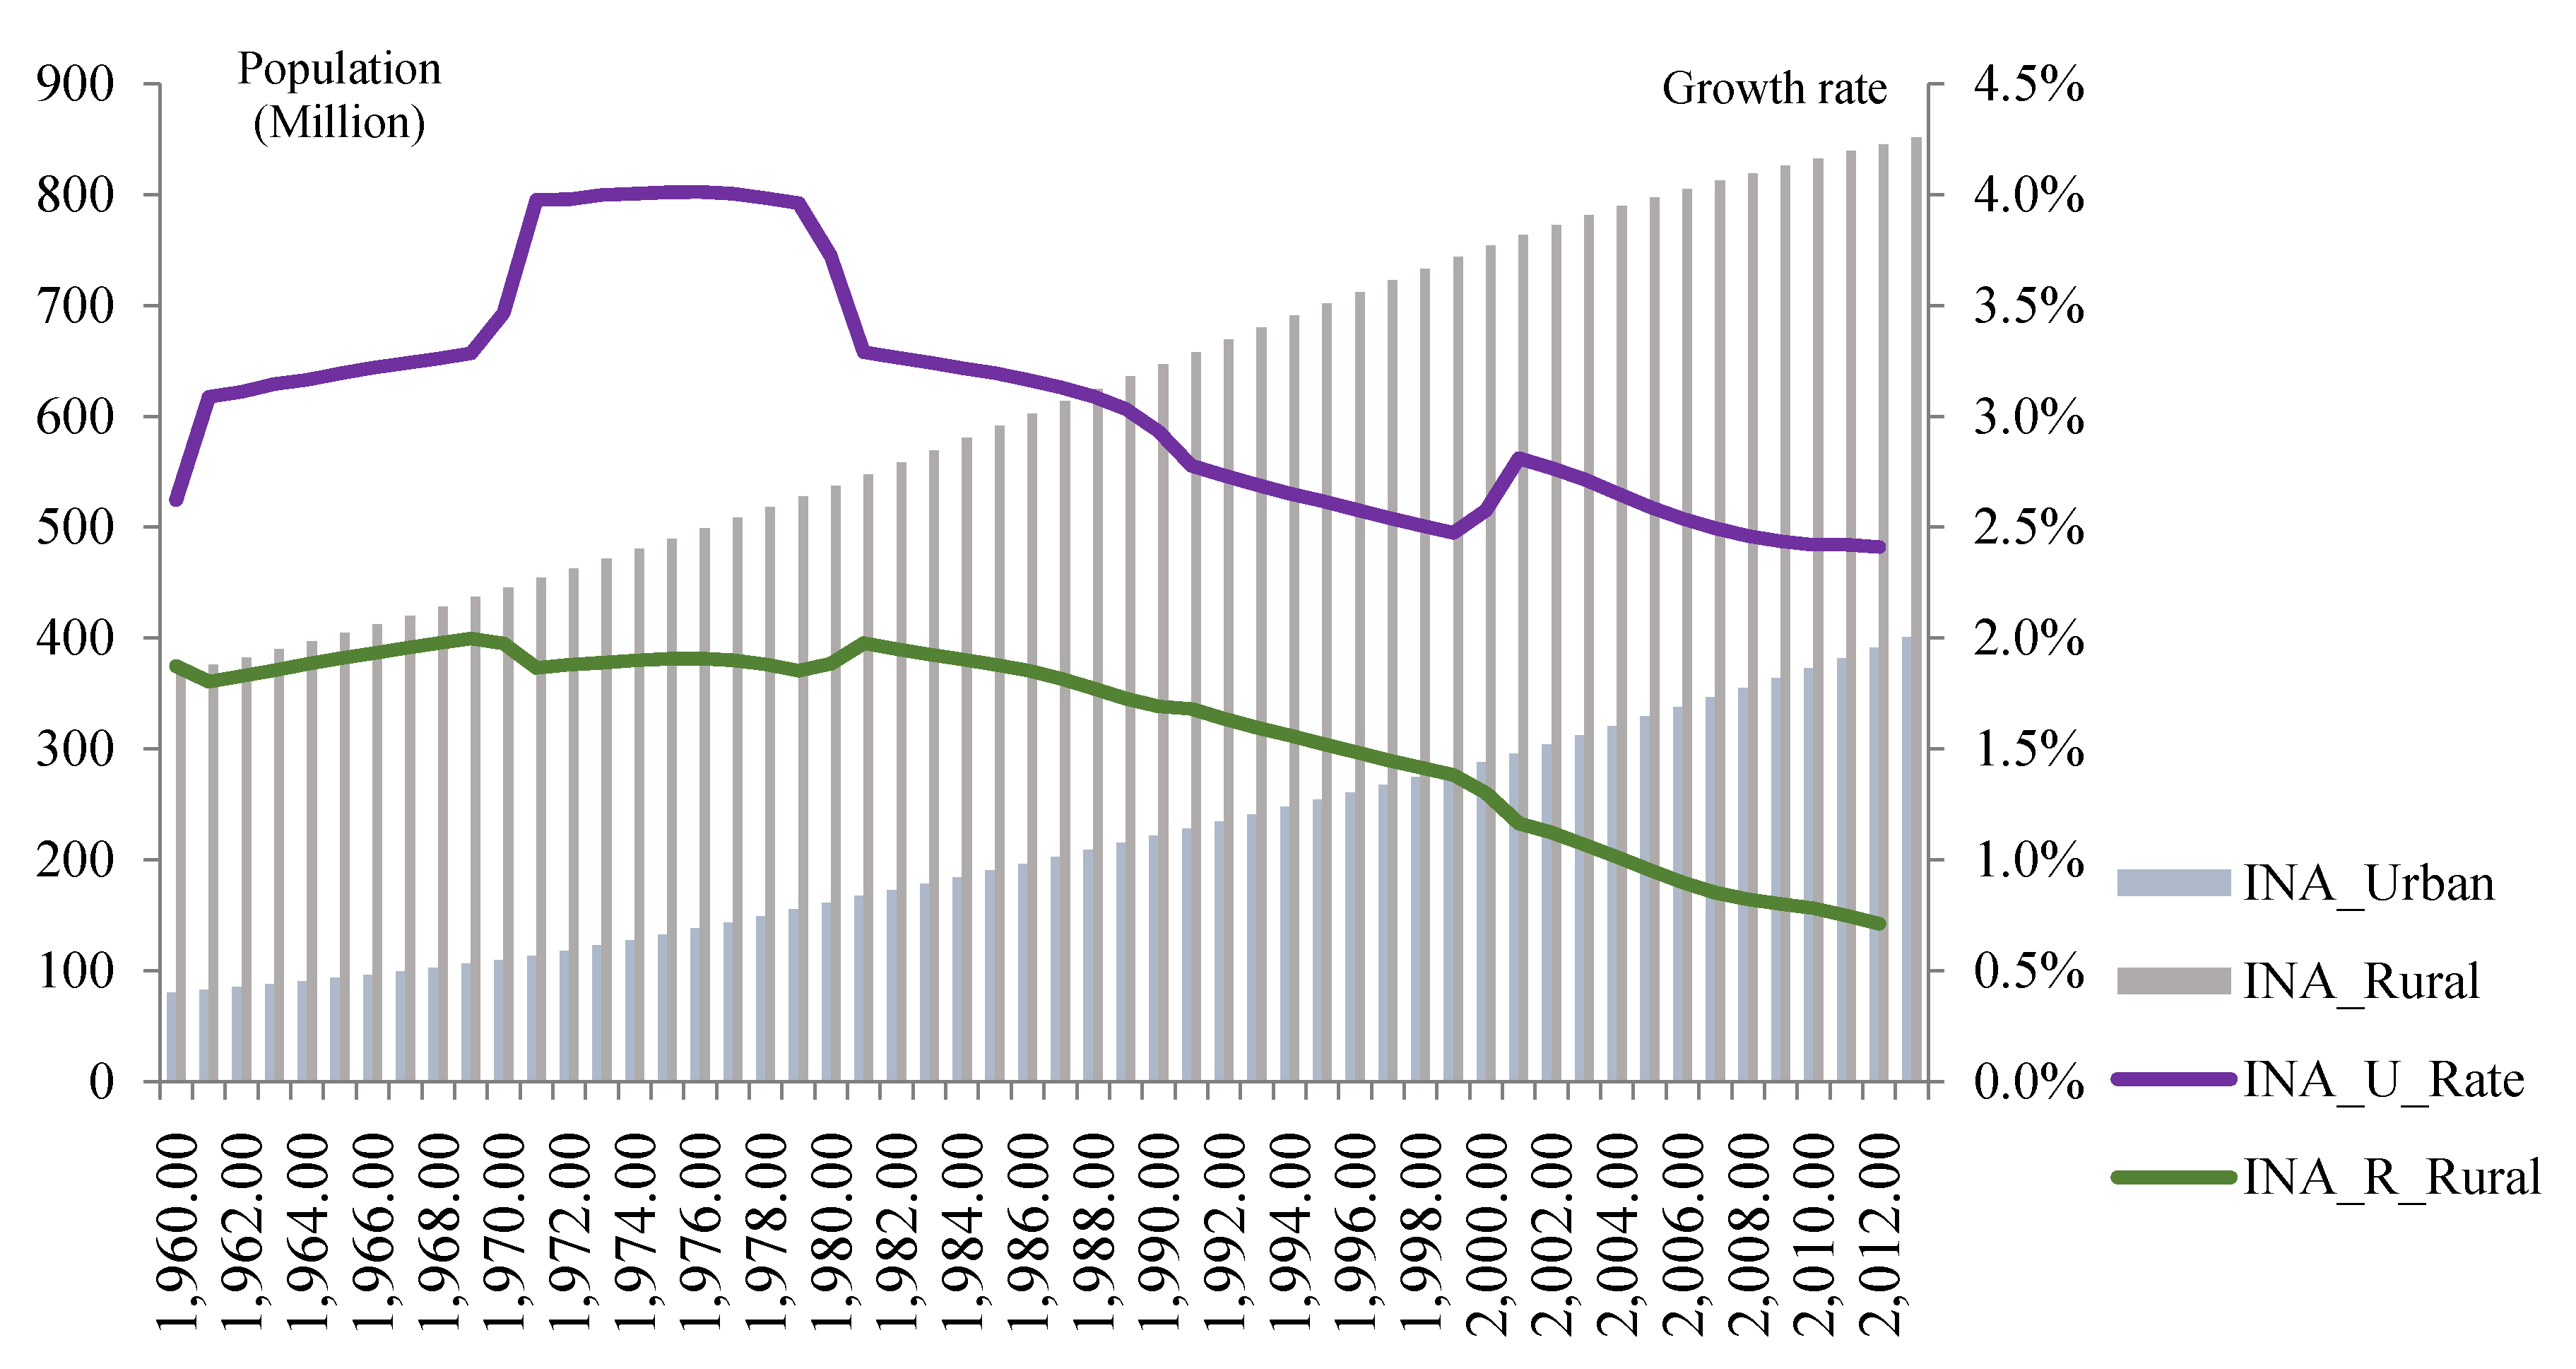
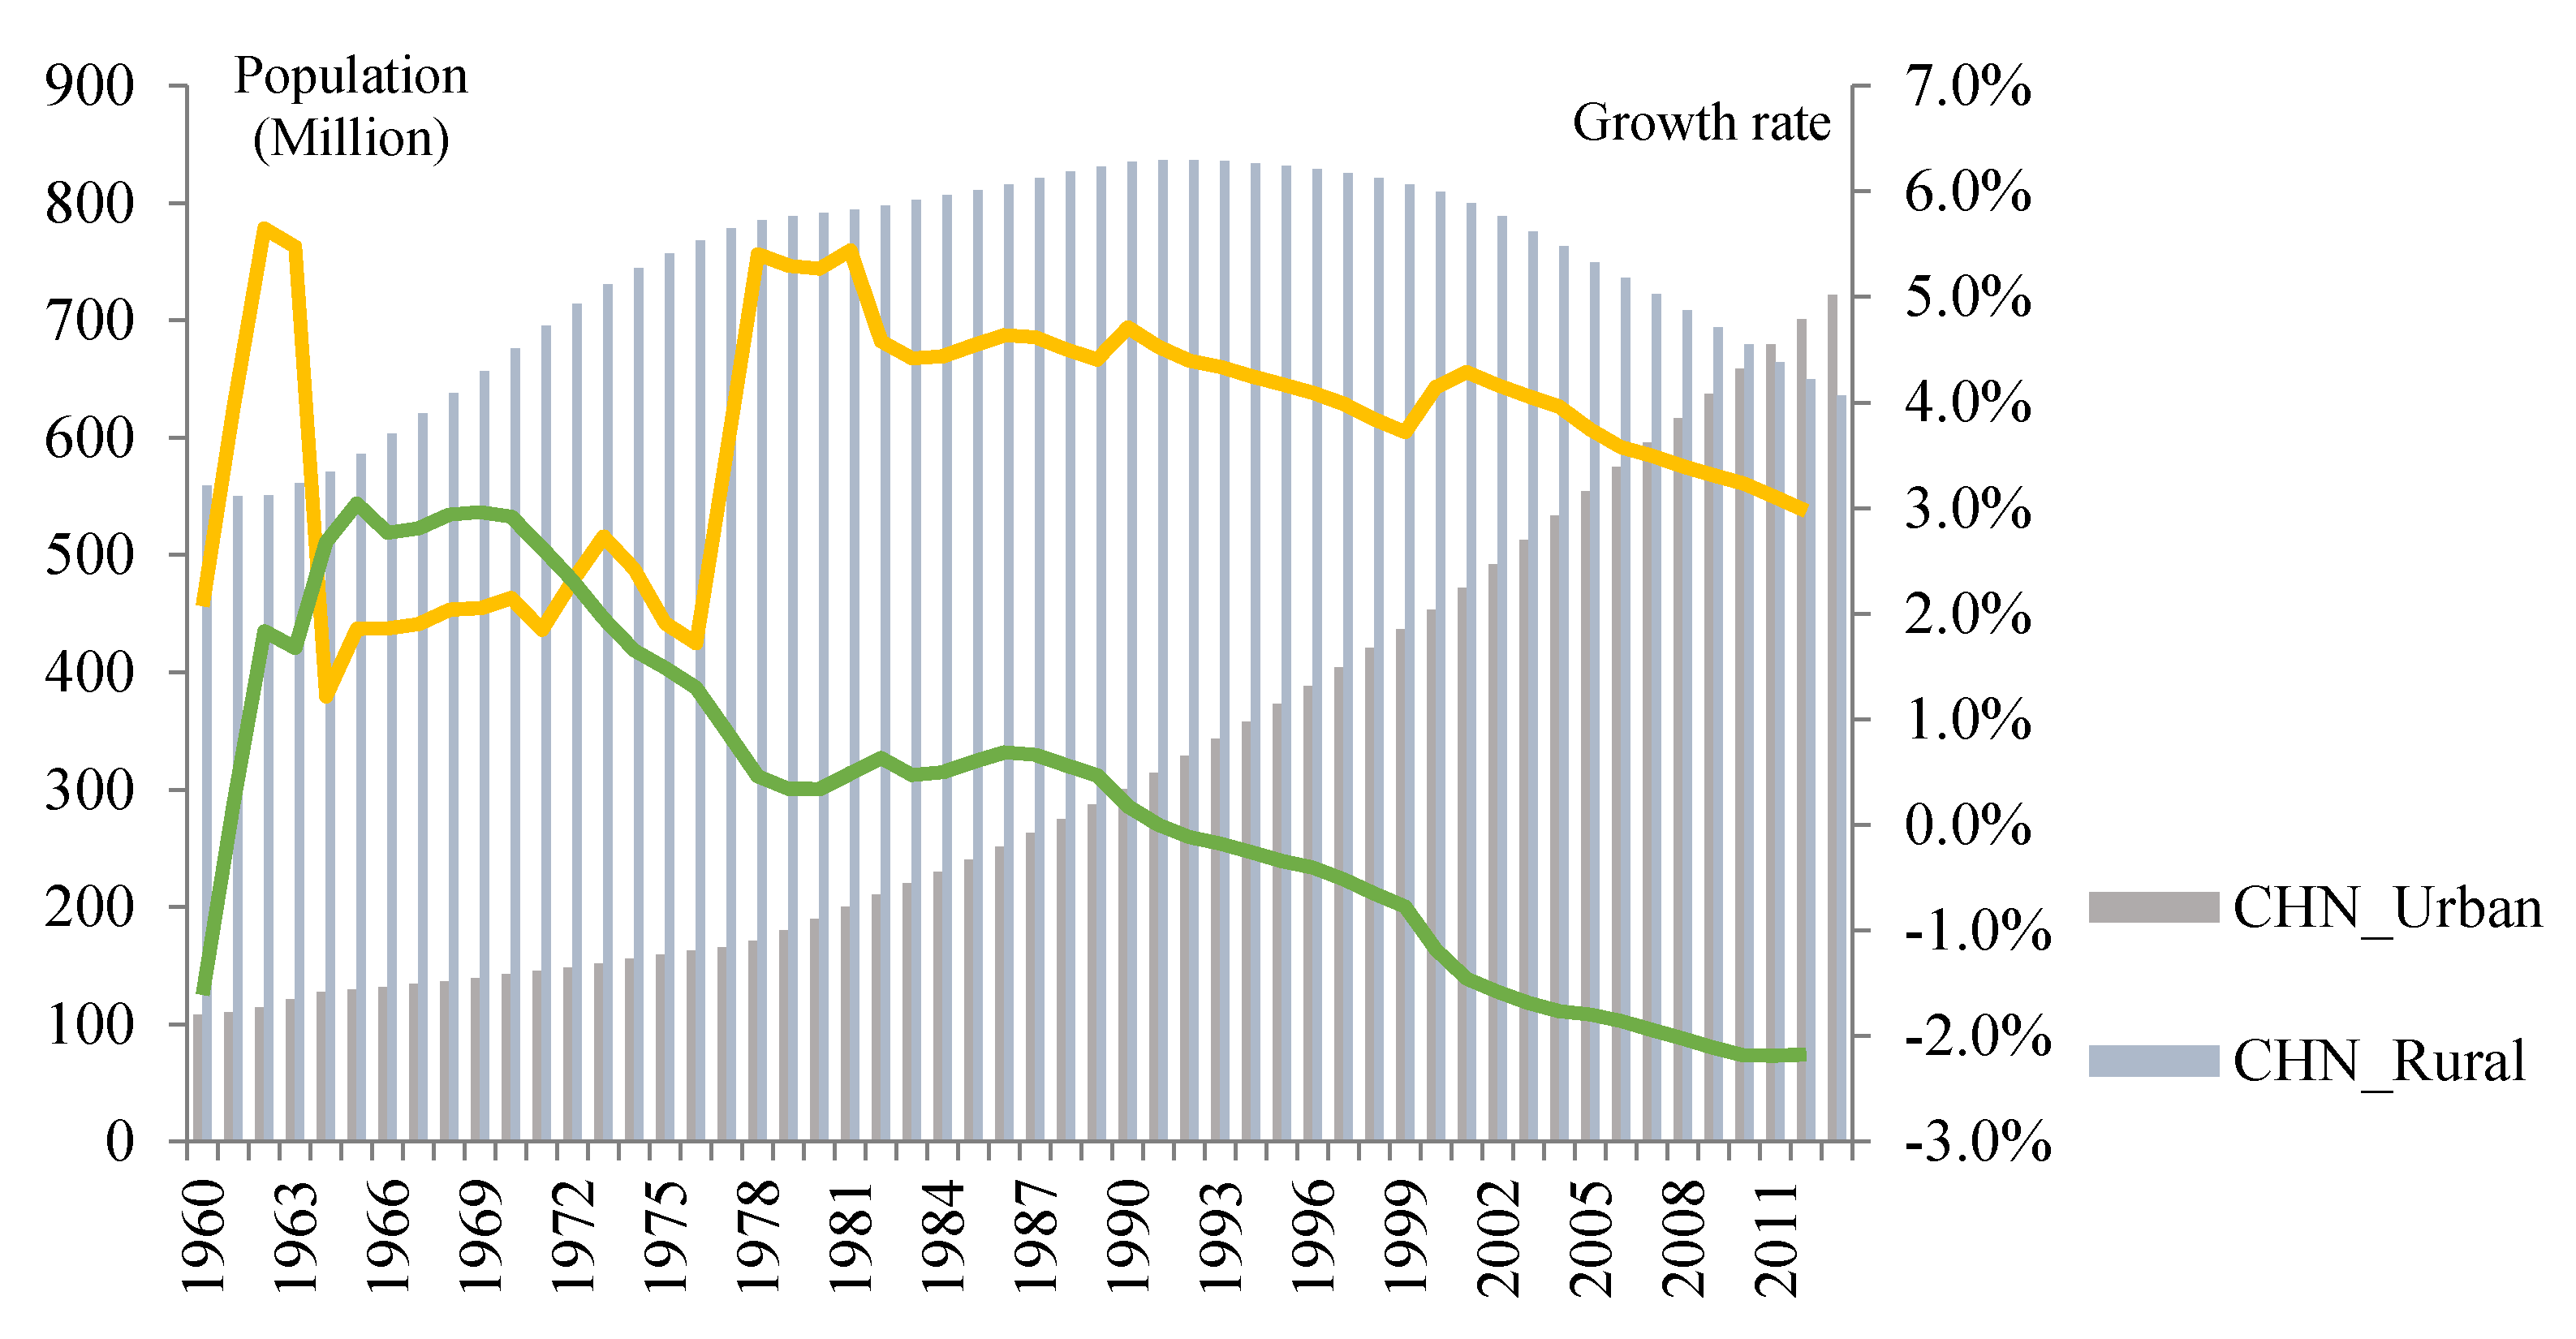
The relationships between urban and rural residents as well as their living conditions determine social sustainability. The urban population of BIC continues to grow, but the changes in their rural population vary from one another. We determined that the rural–urban dichotomy exists in these countries, with India and China having a higher degree than Brazil. In Brazil and India, poverty problems appear in urban and rural areas, and favelas and slums emerge on a large scale. In China, many remote villages are highly impoverished and backward. Even in urban areas, the Chinese characteristic “urban villages” appear to accommodate rural migrants and low-income residents. The number of urban residents in developing countries is predicted to increase, thereby requiring the reduction of the urban–rural gap and the acquisition of the solution to the extreme poverty problem. “Encouraging” policies such as the reform in housing and employment system need to be implemented for rural migrants or rural residents. The coordination of urban and rural development is an indispensable means to relieve the increasing socio-economic pressure and ecological conflicts in urban agglomerations and to improve human well-being in an all-around manner.
The economic outputs in the agricultural, manufacturing, and service sectors demonstrate the sustainability of industrial structure and economic development. The sectors that dominate Brazil, India, and China vary. The service sector is dominant in Brazil, justifying its superior position in economic development among the three countries. The industrial transformation of India is remarkable, and its dominant sector has gradually changed from agriculture to the service sector. Accordingly, a considerable proportion of the agricultural outputs, the number of high-tech products, and its related business have grown tremendously in the country. In the past half-decade, China has been considered an industrial country because its manufacturing sector continues to be the primary economic contributor. However, China’s manufacturing industry is a highly resource-consumed sector and threatens its environmental sustainability to a great extent, whereas its agriculture development is closely associated with food security. In this sense, the industrial transformation in India should be affirmed, and China devotes great efforts to strengthen its service sector and optimize its industrial structure. The relationship between economic development and urbanization growth rate is a useful indicator of a harmonious development. Brazil has a typical economic-lead pattern, but its different sectors show different relationships with urbanization in terms of their growth rate in India and China.
Cities are the aggregation of resources, wealth, and knowledge, and city development is the embodiment of urban sustainability. In the past half-decade, the number of large cities remains stable in Brazil and shows great increases in India and China. The distribution of these large cities follows a regional pattern, with Brazil being northeast-focused, China being southeast-focused, and India being comparatively balanced. The population size of these large cities has continuously increased in the past several decades. In China, the growth is more rapid in the 1990s when counties and towns developed massively than in other periods. In the face of approaching growth limits in mega-cities in countries such as China, urban planning is oriented to be regionally balanced. Medium-sized cities and towns with predictable potential are also encouraged to be supported for development. Sustainability in cities at different levels is an issue of strategic layout in guaranteeing spatial superiority and spatial equilibrium.
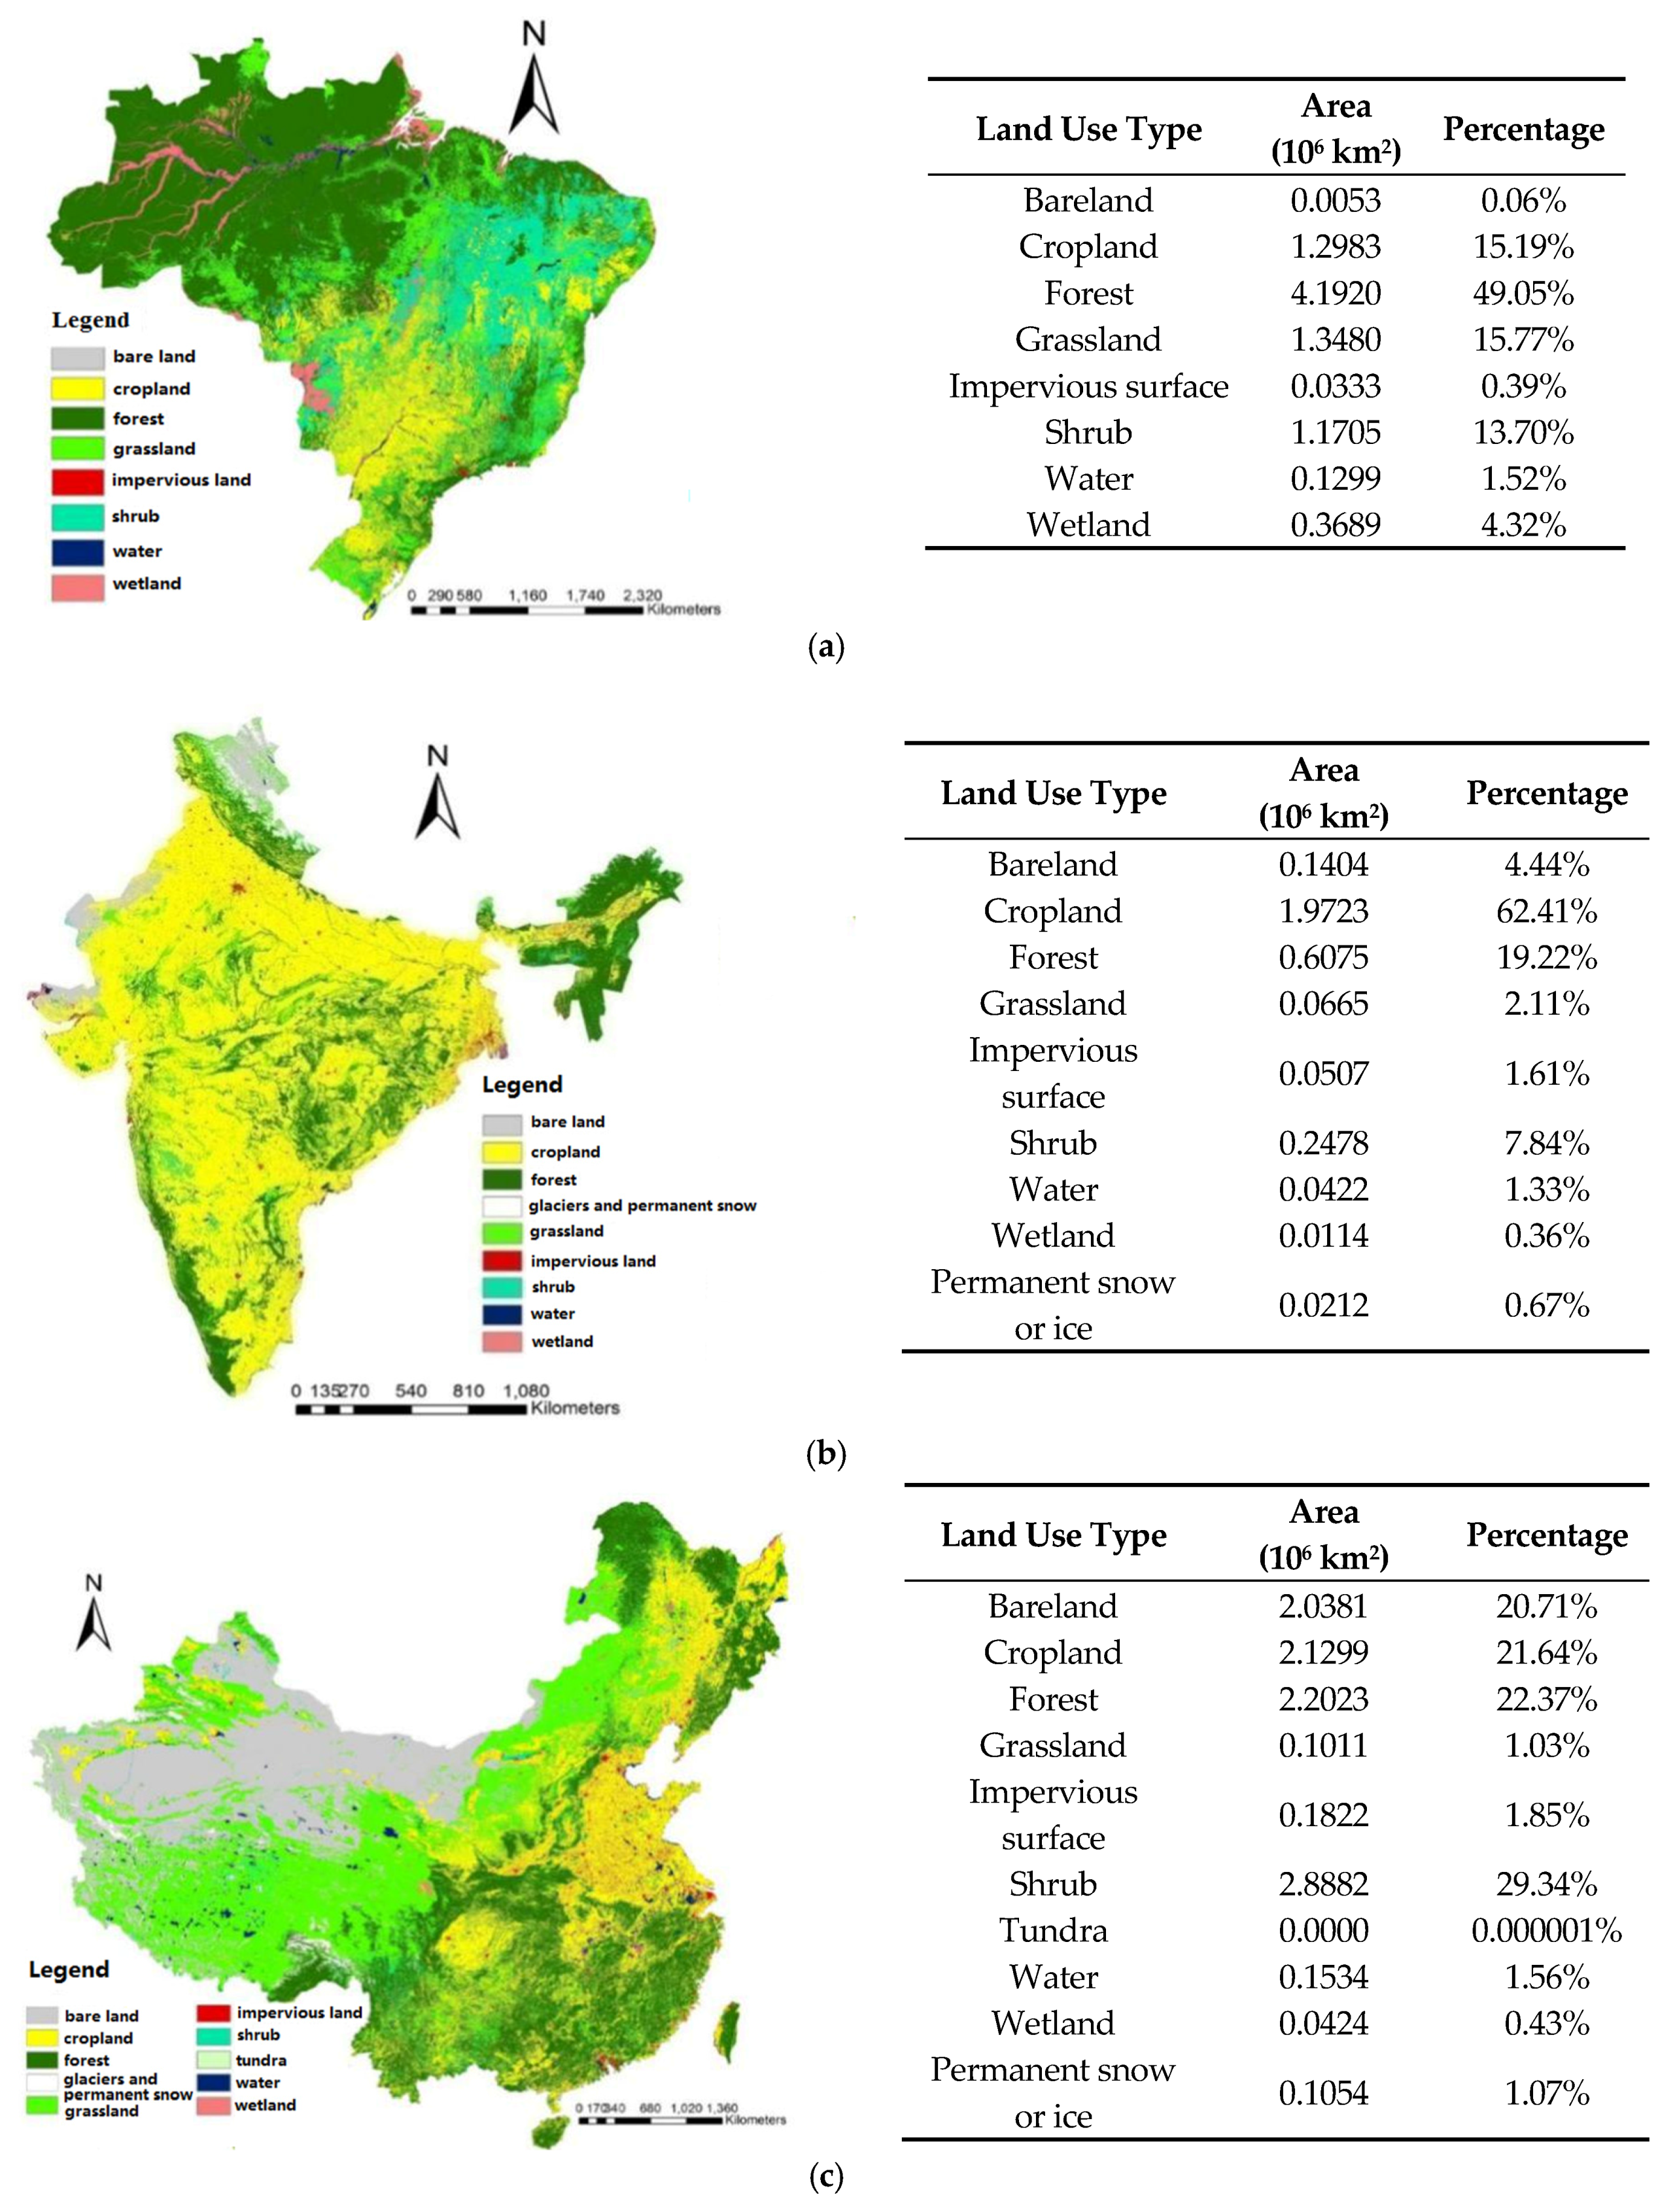
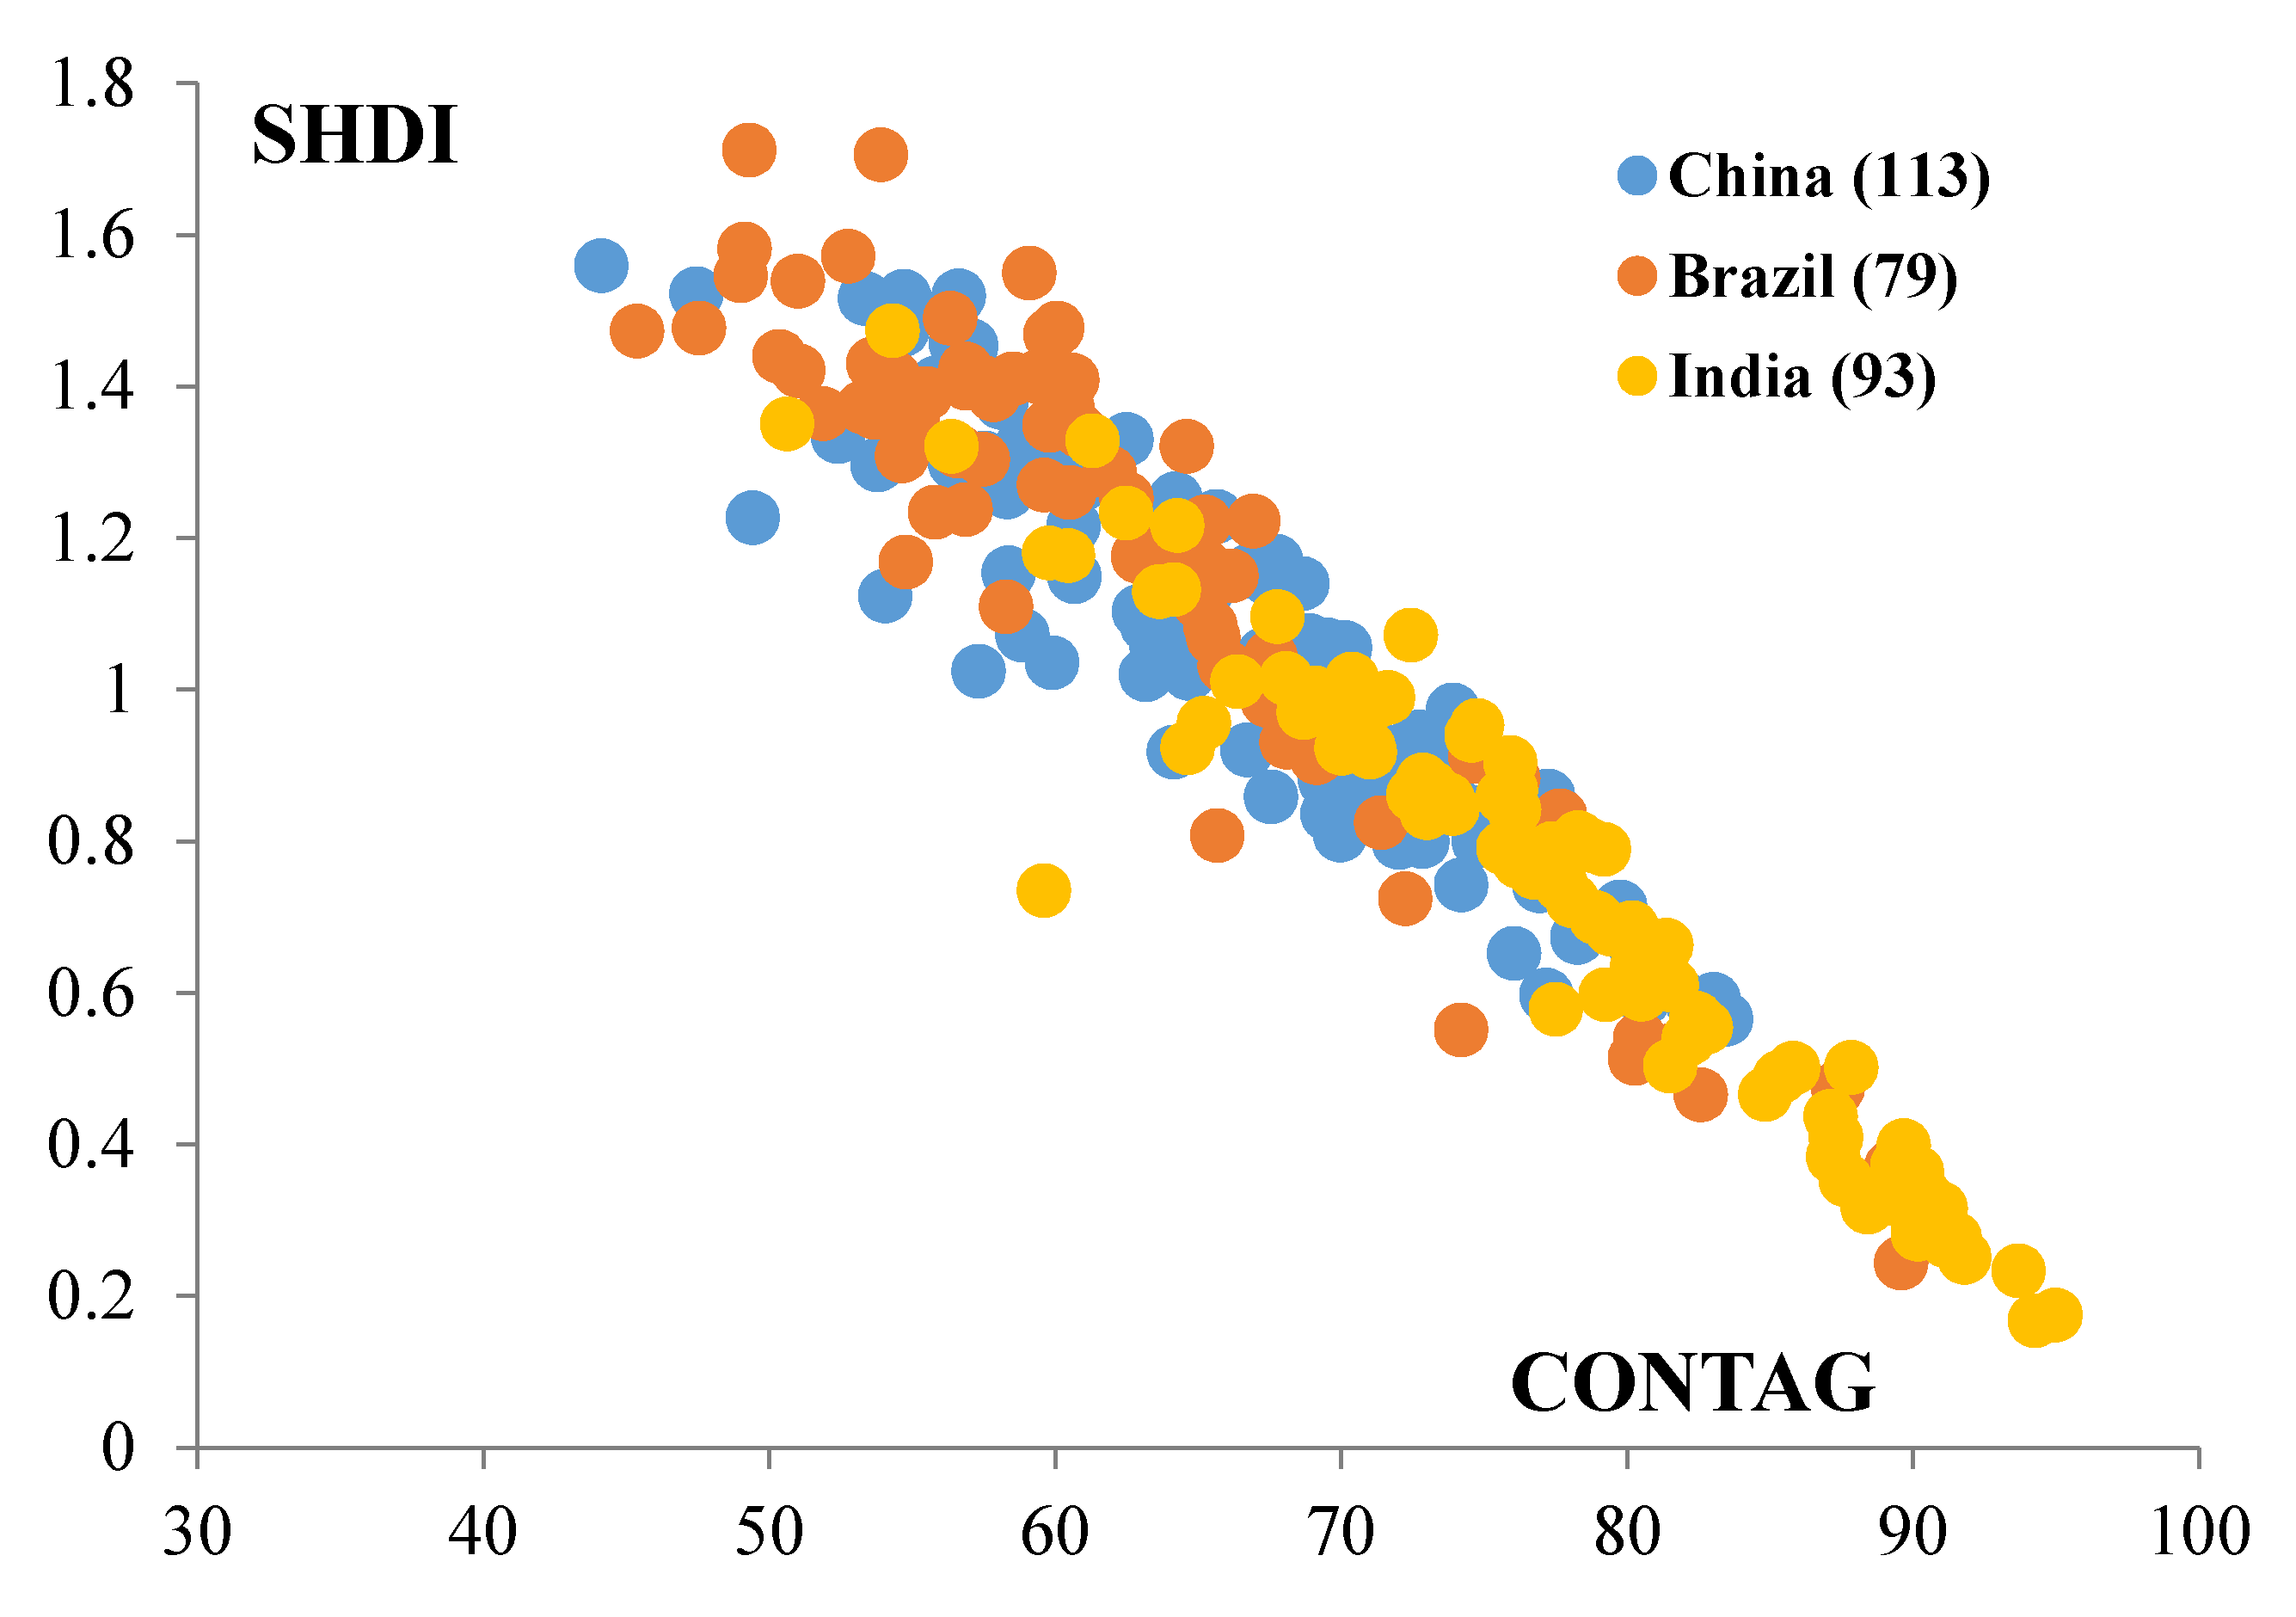
Landscape pattern is an important issue in Brazil, India, and China not only because of their large geographical areas but also on account of their distinctive land use pattern. In general, abundance in resources is conducive to natural resilience and improved ecosystem service. Approximately 60% of Brazil is occupied by the Amazon forest, making this country a special place as “the kingdom of plants and animals.” This distinction also brings great challenges to Brazil with respect to the conservation of biodiversity and eco-environment. Physical difference determines the appearance of the northwest–southeast dividing line in land use distribution, in which human activities concentrate in the southeastern area. In the 1950s and 1960s, Brazil approved the opening of Amazon regions, where new towns and cities began to thrive. In the past half-decade, the conflicts between rapid urbanization and the protection of natural environmental have increasingly become severe, and they have aroused widespread attention on conservation measures. India is a cropland-dominated country whose land distribution is relatively random, whereas the land use in China is primarily mixed with cropland, forest, and grassland. Both of these countries have encountered tremendous urban expansion or sprawl in the past several decades, and the loss of arable land has made food security a critical issue for the growing population. Similar to the land use in Brazil, the land use distribution in India and China also shows a northwest–southeast dividing line because the development is apparently lagging behind the northwestern area. In the future, based on the characteristic physical conditions, adjusting measures are expected to be undertaken to improve resource efficiency and achieve an improved ecological environment. Landscape pattern is a socio-ecological term that measures the spatial aggregation or dispersion in urban areas and reflects the spatial vulnerability and resilience in urban ecosystem. In most cases, the fundamental data sources are considered land use maps in raster format. We chose more than 80 representative cities to explore urban landscape patterns using landscape indices such as CONTAG and SHDI. Among the BIC, China shows the most obvious land use fragmentation, and India has the least. India and China have extremely high population densities, which necessitate intensive land use. Compared with India, China has experienced a significantly faster urbanization with extensive use of urban and rural settlement. In recent years, a series of policies have been implemented to promote the intensive use of resources and energy in cities, towns, counties, and villages. Brazil shows the highest degree of land use diversity, whereas India has the least value. This phenomenon is partly attributed to the difference in biodiversity and ecological resilience among such countries. A healthy urban ecosystem requires the diversity in land use to guarantee ecological balance, especially in “vulnerable” urban environments. In this sense, India and China should take specific measures to protect their urban ecosystem such as delineating the conservation zones to realize urban sustainability.
The urbanized world has brought challenges and opportunities for a sustainable urban environment. This study explores the interaction between urbanization and sustainability from four aspects, namely, rural–urban relation, industrial coordination, city development, and urban landscape pattern. As part of the “BRIC” countries, Brazil, India, and China are used as the study areas to reveal their distinctive trajectories. In general, these countries show obvious rural–urban gaps with characteristic poverty problems threatening social sustainability. The industrial structures of these countries are inclined to be dominated by the service sector, whereas the agricultural sector is important for food security, and the manufacturing sector is still a formidable component in China’s economy. Similar to India, Brazil and China also demonstrate spatial clustering in the distribution of city development, and the most recent decade has seen the decline of the growth rate of these agglomerations largely attributed to the limits of natural carrying capacity. With respect to landscape pattern, China is more dispersed in urban land use than the other two countries, thereby requiring an increasingly pragmatic and intensive land use program. The landscape diversity in Brazil is the highest, increasing the country’s resilience in urban ecosystem. All these qualitative and quantitative analyses are undertaken to compare representative developing countries and provide reference for sustainable urban development in the context of rapid urbanization in the future.

Acknowledgments

This research is supported by the research funds from state key program of National Natural Science Foundation of China (71533004), key program of International Cooperation, Chinese Academy of Sciences (131A11KYSB20130023) and the Innovative Supporting Projects from Huazhong Agricultural University (34115181, 2662015PY166).

Author Contributions

Chen Zeng and Xiangzheng Deng conceived and designed the experiments; Jianing Dong performed the experiments; Peiying Hu analyzed the data; Chen Zeng wrote the paper.

Conflicts of Interest

The authors declare no conflict of interest.

References

  1. Bai, X.; Chen, J.; Shi, P. Landscape urbanization and economic growth in China: Positive feedbacks and sustainability dilemmas. Environ. Sci. Technol. 2011, 46, 132–139. [Google Scholar] [CrossRef] [PubMed]
  2. Douglas, I. Urban ecology and urban ecosystems: understanding the links to human health and well-being. Curr. Opin. Environ. Sustain. 2012, 4, 385–392. [Google Scholar] [CrossRef]
  3. Macomber, J.D. Building sustainable cities. Harv. Bus. Rev. 2013, 91, 40–50. [Google Scholar]
  4. The World Bank. Release of World Development Indicators 2015. Available online: http://data.worldbank.org/news/release-of-world-development-indicators-2015 (accessed on 15 April 2016).
  5. Wu, J. Urban sustainability: An inevitable goal of landscape research. Landsc. Ecol. 2010, 25, 1–4. [Google Scholar] [CrossRef]
  6. Hossain, M.S. Panel estimation for CO 2 emissions, energy consumption, economic growth, trade openness and urbanization of newly industrialized countries. Energy Policy 2011, 39, 6991–6999. [Google Scholar] [CrossRef]
  7. Cumming, G.S.; Buerkert, A.; Hoffmann, E.M.; Schlecht, E.; von Cramon-Taubadel, S.; Tscharntke, T. Implications of agricultural transitions and urbanization for ecosystem services. Nature 2014, 515, 50–57. [Google Scholar] [CrossRef] [PubMed]
  8. Wu, J.G. Urban ecology and sustainability: The state-of-the-science and future directions. Landsc. Urban Plan. 2014, 125, 209–221. [Google Scholar] [CrossRef]
  9. Rogers, D.S.; Duraiappah, A.K.; Antons, D.C.; Munoz, P.; Bai, X.; Fragkias, M.; Gutscher, H. A vision for human well-being: transition to social sustainability. Curr. Opin. Environ. Sustain. 2012, 4, 61–73. [Google Scholar] [CrossRef]
  10. Sakieh, Y.; Amiri, B.J.; Danekar, A.; Feghhi, J.; Dezhkam, S. Scenario-based evaluation of urban development sustainability: an integrative modeling approach to compromise between urbanization suitability index and landscape pattern. Environ. Dev. Sustain. 2014, 17, 1343–1365. [Google Scholar] [CrossRef]
  11. Dempsey, N.; Bramley, G.; Power, S.; Brown, C. The social dimensions of sustainable development: defining urban social sustainability. Sustain. Dev. 2009. [Google Scholar] [CrossRef]
  12. Li, C.; Li, J.; Wu, J. Quantifying the speed, growth modes, and landscape pattern changes of urbanization: a hierarchical patch dynamics approach. Landsc. Ecol. 2013, 28, 1875–1888. [Google Scholar] [CrossRef]
  13. Fu, G. The Sustainability Issues of Chinese Food Security in the Context of Industrialization and Urbanization, 2013. Available online: http://repo.lib.ryukoku.ac.jp/jspui/handle/10519/5030 (accessed on 15 April 2016).
  14. Hsing, Y.T. The great urban transformation: Politics of land and property in China. OUP Catalogue. Available online: https://ideas.repec.org/b/oxp/obooks/9780199644599.html (accessed on 15 April 2016).
  15. Chen, X.; Frank, K.A.; Dietz, T.; Liu, J. Weak ties, labor migration, and environmental impacts: toward a sociology of sustainability. Organ. Environ. 2012. [Google Scholar] [CrossRef]
  16. Li, X.H.; Liu, J.L.; Gibson, V.; Zhu, Y.G. Urban sustainability and human health in China, East Asia and Southeast Asia. Curr. Opin. Environ. Sustain. 2012, 4, 436–442. [Google Scholar] [CrossRef]
  17. Shen, L.; Peng, Y.; Zhang, X.; Wu, Y. An alternative model for evaluating sustainable urbanization. Cities 2012, 29, 32–39. [Google Scholar] [CrossRef]
  18. Pieper, U. Deindustrialisation and the social and economic sustainability nexus in developing countries: Cross-country evidence on productivity and employment. J. Dev. Stud. 2000, 36, 66–99. [Google Scholar] [CrossRef]
  19. Chen, C.; Han, J.; Fan, P. Measuring the Level of Industrial Green Development and Exploring Its Influencing Factors: Empirical Evidence from China’s 30 Provinces. Sustainability 2016, 8, 153. [Google Scholar] [CrossRef]
  20. Carballo-Penela, A.; Castromán-Diz, J.L. Environmental policies for sustainable development: an analysis of the drivers of proactive environmental strategies in the service sector. Bus. Strategy Environ. 2015, 24, 802–818. [Google Scholar] [CrossRef]
  21. Anand, S.; Sen, A. Human development and economic sustainability. World Dev. 2000, 28, 2029–2049. [Google Scholar] [CrossRef]
  22. O’neill, J. Building better global economic BRICs. Available online: http://www.goldmansachs.com/our-thinking/archive/building-better.html (accessed on 15 April 2016).
  23. Gryczka, M. Changing role of BRIC countries in technology-driven international division of labor. Bus. Econ. Horiz. 2010, 21, 89–97. [Google Scholar] [CrossRef]
  24. Lafortezza, R.; Corry, R.C.; Sanesi, G.; Brown, R.D. Quantitative approaches to landscape spatial planning: clues from landscape ecology. In Sustainable Development and Planning II; WIT Press: Southampton, UK, 2005; pp. 239–250. [Google Scholar]
  25. Gu, X.; Dai, B.; Chen, B. Landscape effects of land consolidation projects in Central China—A case study of Tianmen City, Hubei Province. Chin. Geogr. Sci. 2008, 18, 41–46. [Google Scholar] [CrossRef]
  26. Uuemaa, E.; Roosaare, J.; Kanal, A.; Mander, Ü. Spatial correlograms of soil cover as an indicator of landscape heterogeneity. Ecol. Indic. 2008, 8, 783–794. [Google Scholar] [CrossRef]
  27. McGarigal, K.; Cushman, S.A.; Neel, M.C.; Ene, E. FRAGSTATS, Spatial Pattern Analysis Program for Categorical Maps. Computer Software Program Produced by the Authors at the University of Massachusetts, Amherst. Available online: http://www.umass.edu/landeco/research/fragstats/fragstats.html (accessed on 15 April 2016).
  28. City population. Available online: http://www.citypopulation.de/ (assessed on 15 January 2016).
  29. Willaarts, B.; Pardo, I.; Mora, G.D.L. Urbanization, socio-economic changes and population growth in Brazil: dietary shifts and environmental implications. Available online: http://oa.upm.es/25979/ (accessed on 15 April 2016).
  30. Reardon, T.; Berdegué, J.; Escobar, G. Rural nonfarm employment and incomes in Latin America: overview and policy implications. World Dev. 2001, 29, 395–409. [Google Scholar] [CrossRef]
  31. Browder, J.O. The urban-rural interface: Urbanization and tropical forest cover change. Urban Ecosyst. 2002, 6, 21–41. [Google Scholar] [CrossRef]
  32. Padoch, C.; Brondizio, E.; Costa, S.; Pinedo-Vasquez, M.; Sears, R.R.; Siqueira, A. Urban forest and rural cities: multi-sited households, consumption patterns, and forest resources in Amazonia. Ecol. Soc. 2008, 13, 2. [Google Scholar]
  33. Oya-Sawyer, D.; Fernandez-Castilla, R.; Monte-Mor, R.L. The impact of urbanization and industrialization on mortality in Brazil. World Health Stat. Q. 1987, 40, 84–95. [Google Scholar] [PubMed]
  34. Matos, R.; Baeninger, R. Migration and Urbanization in Brazil: Processes of Spatial Concentration and Deconcentration and the Recent Debate. Available online: www.abep.nepo.unicamp.br/iussp2001/cd/Sessao_Especial_Matos_Baeninger_Text.pdf (accessed on 15 April 2016).
  35. Martins, R.D.A.; da Costa Ferreira, L. Governing climate change: urbanization, vulnerability and challenges for the northern coast of the state of São Paulo, Brazil. Sustentabilidade em Debate 2011, 2, 55–82. [Google Scholar]
  36. D’Silva, M.U.; Agarwal, V.; Sohn, S.; Sharma, V. Urbanization and Strategic Health Communication in India. In Strategic Urban Health Communication; Springer: New York, NY, USA, 2014; pp. 159–172. [Google Scholar]
  37. Swerts, E.; Pumain, D.; Denis, E. The future of India’s urbanization. Futures 2014, 56, 43–52. [Google Scholar] [CrossRef] [Green Version]
  38. Renetzeder, C.; Schindler, S.; Peterseil, J.; Prinz, M.A.; Mücher, S.; Wrbka, T. Can we measure ecological sustainability? Landscape pattern as an indicator for naturalness and land use intensity at regional, national and European level. Ecol. Indic. 2010, 10, 39–48. [Google Scholar] [CrossRef]
Figure 1. Framework of probing into urbanization and sustainability.
Sustainability 08 00400 g001
Figure 2. Variations of urban and rural population (growth rates) in Brazil from 1960 to 2013.
Sustainability 08 00400 g002
Figure 3. Variations of urban and rural populations (growth rates) in India from 1960 to 2013.
Sustainability 08 00400 g003
Figure 4. Variations of urban and rural population (growth rates) in China from 1960 to 2013.
Sustainability 08 00400 g004
Figure 5. Land use in the BIC countries in 2010: (a) Brazil; (b) India; and (c) China.
Sustainability 08 00400 g005
Figure 6. Landscape index of cities in the BIC countries.
Sustainability 08 00400 g006
Table 1. Proportion of the different industrial sectors in GDP from 1960 to 2013.
Agricultural Sector (%)Manufacturing Sector (%)Service Sector (%)
BRAINACHNBRAINACHNBRAINACHN
196020.5942.5623.3837.0719.344.4942.3438.1432.13
197012.3541.9535.2238.320.4840.4949.3537.5724.29
198011.0135.3930.1743.8324.2948.2245.1640.3221.6
19908.129.0227.1238.6926.4941.3453.2144.4831.54
20005.623.0215.0627.732645.9266.6750.9839.02
20105.318.2110.128.0727.1646.6766.6354.6443.24
20135.7117.9510.0124.9830.7343.8969.3251.3146.09
Table 2. Coordination ratio for the agricultural, manufacturing, and service sectors from 1960 to 2013.
Coordination Ratio with Agricultural IndustryCoordination Ratio with Manufacturing IndustryCoordination Ratio with Service Industry
BRAINACHNBRAINACHNBRAINACHN
19600.44632.37451.44320.80341.07672.74570.91772.12781.9828
19700.22082.12322.02390.68511.03632.32720.88281.90121.396
19800.16821.53211.55870.66941.05152.49110.68981.74581.116
19900.10961.13611.02550.52341.0371.56340.71981.74121.1929
20000.0690.83210.41990.34160.93971.27980.82111.84261.0876
20100.06290.58860.20510.33280.8780.94810.791.76650.8783
20130.0670.56120.18830.29330.96060.82560.81381.60380.867
Table 3. Number of cities in the BIC countries with large population.
More than 5 Million1 Million to 5 Million
199020002010199020002010
Brazil22291112
India468192942
China2614305670
Table 4. Top 10 cities with the largest population in Brazil (million).
NameLocation1991200020102014rate00_91rate10_00rate14_10
Sao PauloEast9.419.8111.1511.794.25%13.65%5.71%
Rio de JaneiroEast5.485.866.326.456.88%7.90%2.11%
SalvadorEast2.072.442.672.9017.78%9.53%8.49%
BrasiliaMiddle1.521.962.482.7529.40%26.55%10.98%
FortalezaNortheast1.772.142.452.5721.08%14.51%4.88%
Belo HorizonteEast2.012.242.382.4911.19%6.10%4.88%
ManausNorth1.011.401.792.0138.76%28.36%12.11%
CuritibaEast1.321.591.751.8620.71%10.37%6.42%
RecifeEast1.301.421.541.619.60%8.07%4.60%
Porto AlegreEast1.251.321.411.475.87%6.71%4.48%
Table 5. Top 10 cities with the largest population in India (million).
NameLocation199120002010Rate00_90Rate10_00
MumbaiWest12.6016.4318.3930.47%11.93%
DelhiNorth8.4212.8816.3552.96%26.96%
KolkataEast11.0213.2114.0619.81%6.45%
ChennaiSoutheast5.426.568.6520.99%31.91%
BangaloreSouth4.135.708.5238.04%49.44%
HyderabadMiddle4.345.747.6832.17%33.70%
AhmadabadWest3.314.536.3636.62%40.50%
PuneWest2.493.765.0650.79%34.49%
SuratWest1.522.814.5985.10%63.30%
JaipurNorth1.522.323.0552.98%31.15%
Table 6. Top 10 cities with the largest population in China (million).
NameLocation199120002010Rate00_90Rate10_00
ShanghaiEast7.8214.2320.2281.94%42.07%
BeijingNorth5.5210.3016.4586.54%59.67%
GuangzhouSouth3.518.0910.64130.53%31.52%
ShenzhenSouth1.086.4810.36499.13%59.84%
TianjinNorth4.096.769.2965.14%37.52%
WuhanMiddle3.796.797.5479.01%11.11%
DongguanSouth0.553.877.27600.68%87.89%
FoshanSouth0.904.016.77344.47%69.02%
ChengduMiddle-West1.874.276.32128.90%47.83%
ChongqingMiddle-West2.524.916.2695.05%27.50%
Table 7. Means and standard deviations of Shannon diversity index (SHDI) and contagion index (CONTAG).
CountryBrazilIndiaChina
AVEMSDAVEMSDAVEMSD
CONTAG66.518.5853.3221.3976.4912.60
SHDI1.04230.25110.88350.44230.73020.3008
Note: AVE refers to the average value; MSD refers to the mean standard deviation.
Table 8. Comparison of sustainability in Brazil, India, and China.
AspectBrazilIndiaChina
Rural–urban relationRural–urban gap
Medium DichotomyDistinct DichotomyDistinct Dichotomy
Rural–urban population growth
UP growth; RP stableSimultaneous UP and RP growthUP growth; RP grows first and then declines
Poverty problem
FavelasSlumsUrban village
IndustryIndustrial structure
SV dominatedAGC to service sectorMNF dominated
Compared with the growth rate of urbanization
FasterAG and MNF are faster than SV but become slower; SV is slowFaster and then slower
City developmentNumber of large cities
StableIncreaseTremendous increase
Distribution and size variation
Northeast-focusedBalancedSoutheast-focused
Size growth stableSize growth stableExplosive size growth in the 1990s
Urban landscape patternLand use structure
Forest-dominatedCropland-dominatedMixed
Land use distribution
Northwest-southeast dividing lineRandomly distributedNorthwest-southeast dividing line
Spatial distribution
MediumClusteredScattered
Degree of diversification in land use
DiversifiedDominatedDominated

