
Open Economy, Institutional Quality, and Environmental Performance: A Macroeconomic Approach


Abstract
:1. Introduction
2. Research Methodology
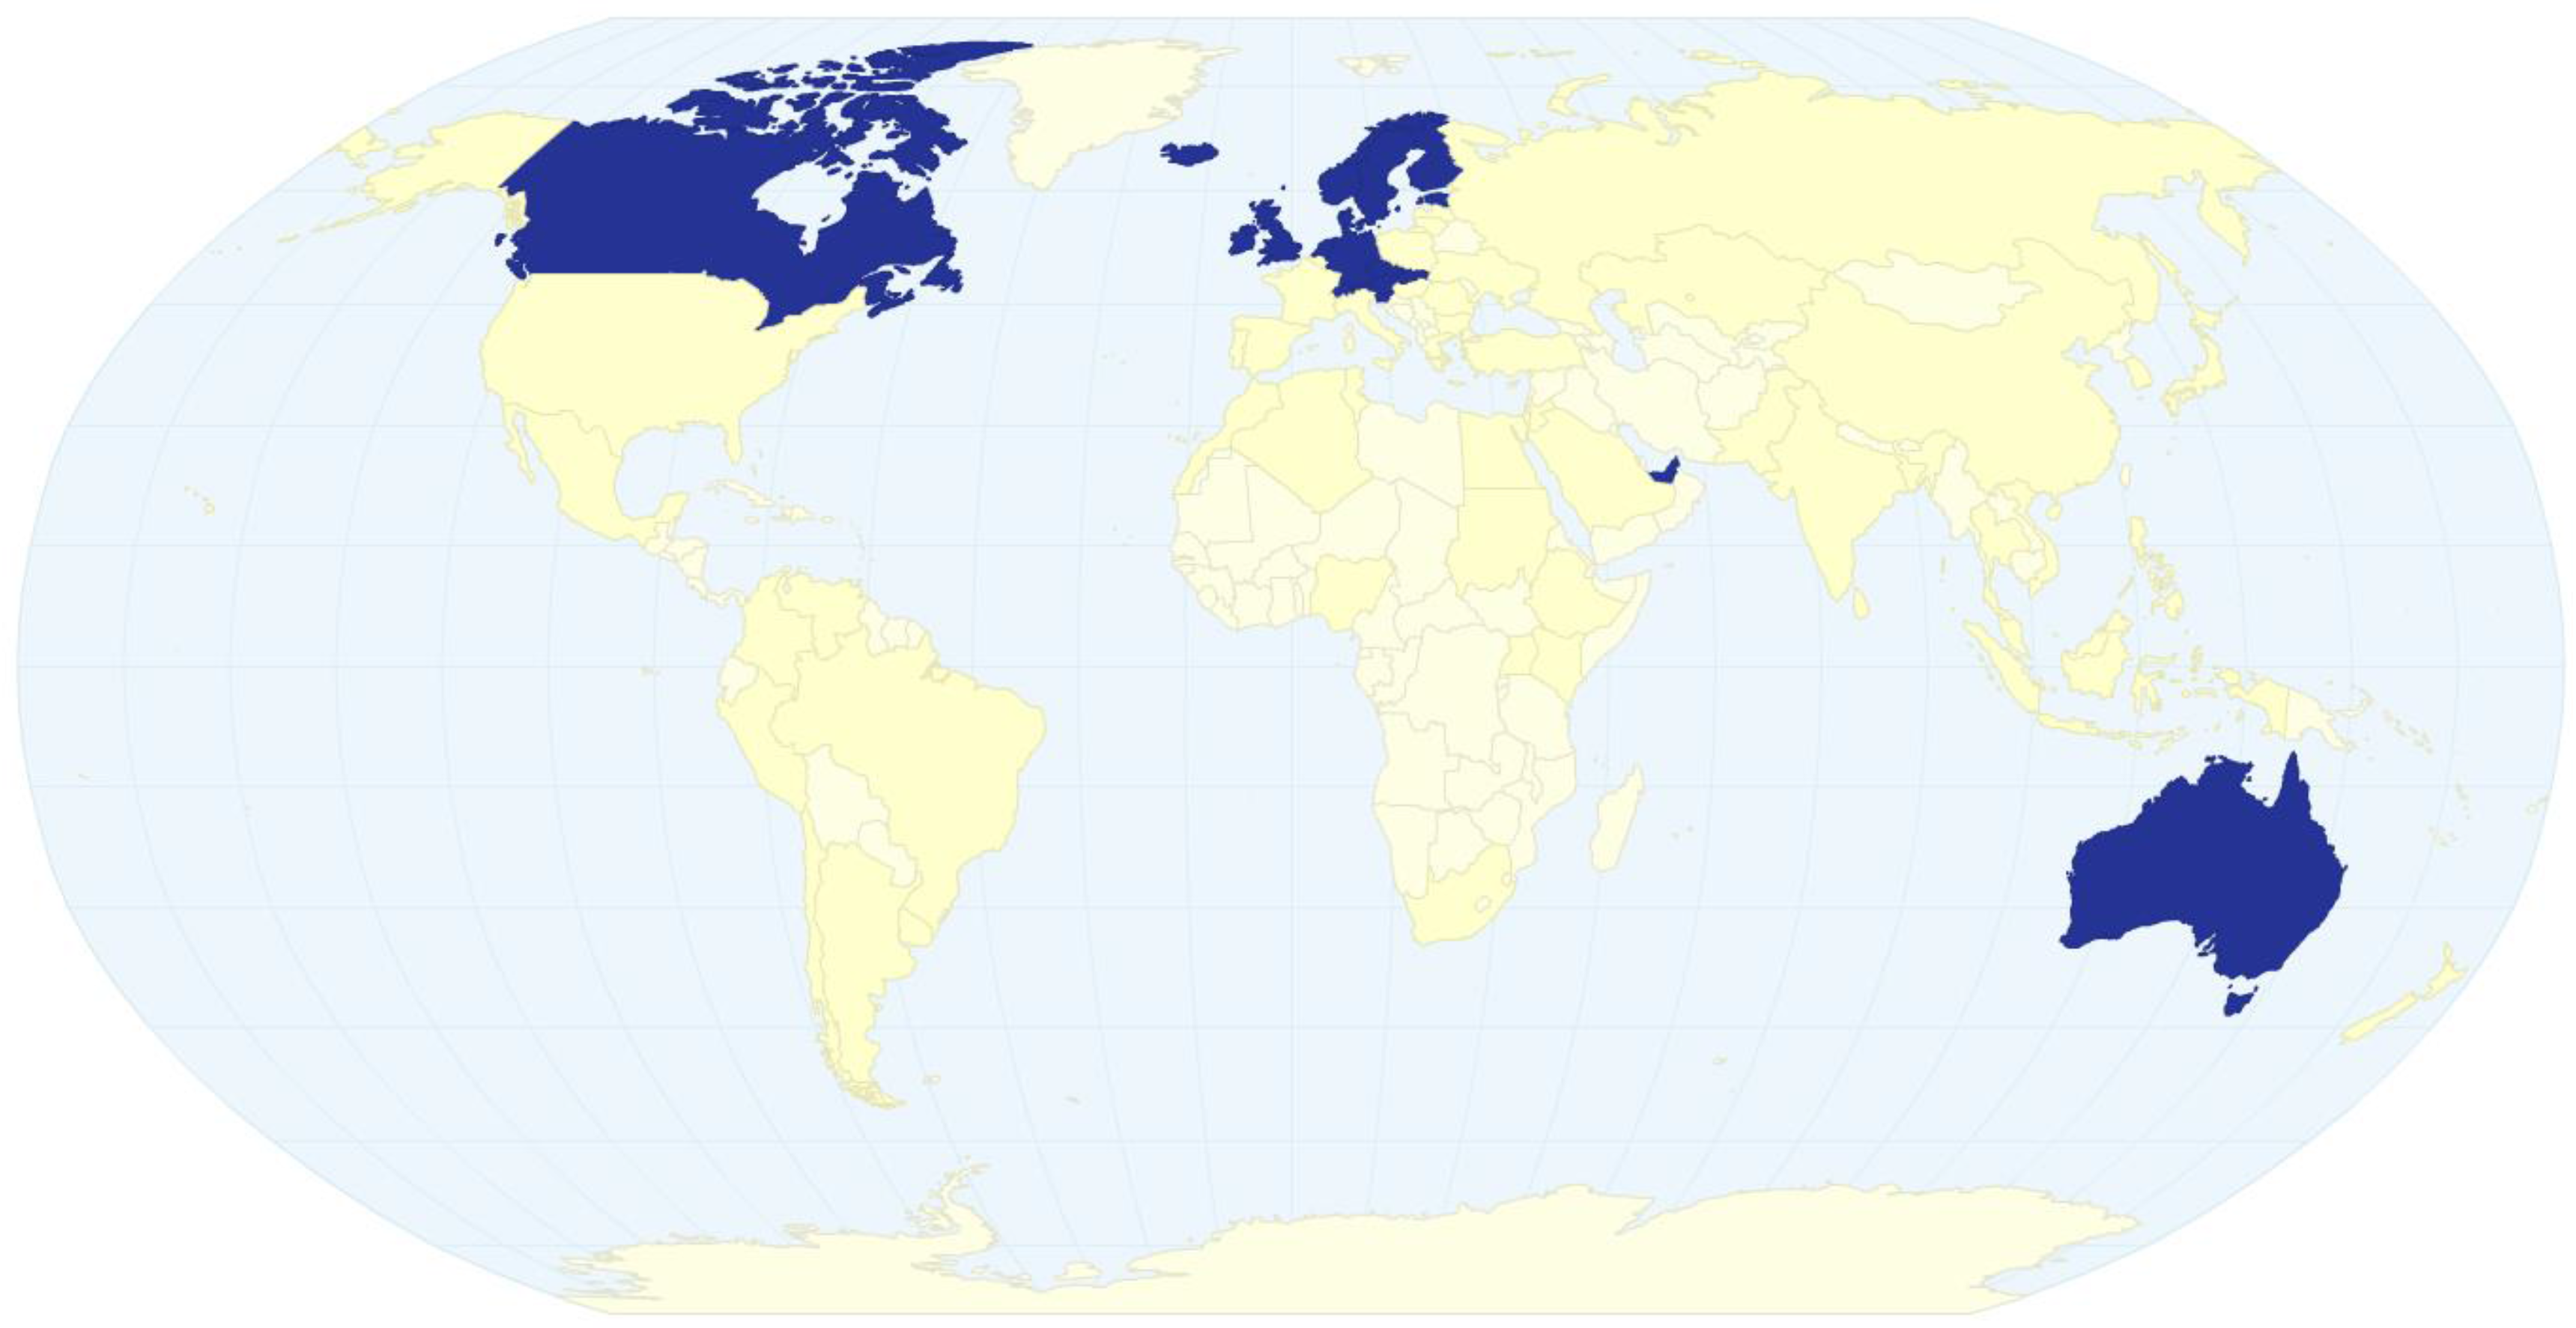
2.1. Country Selection
2.2. Environmental Performance Index
2.3. Open Markets Index
2.4. Worldwide Governance Indicators
2.5. Statistical Analysis
3. Results and Discussion
3.1. Descriptive Statistics
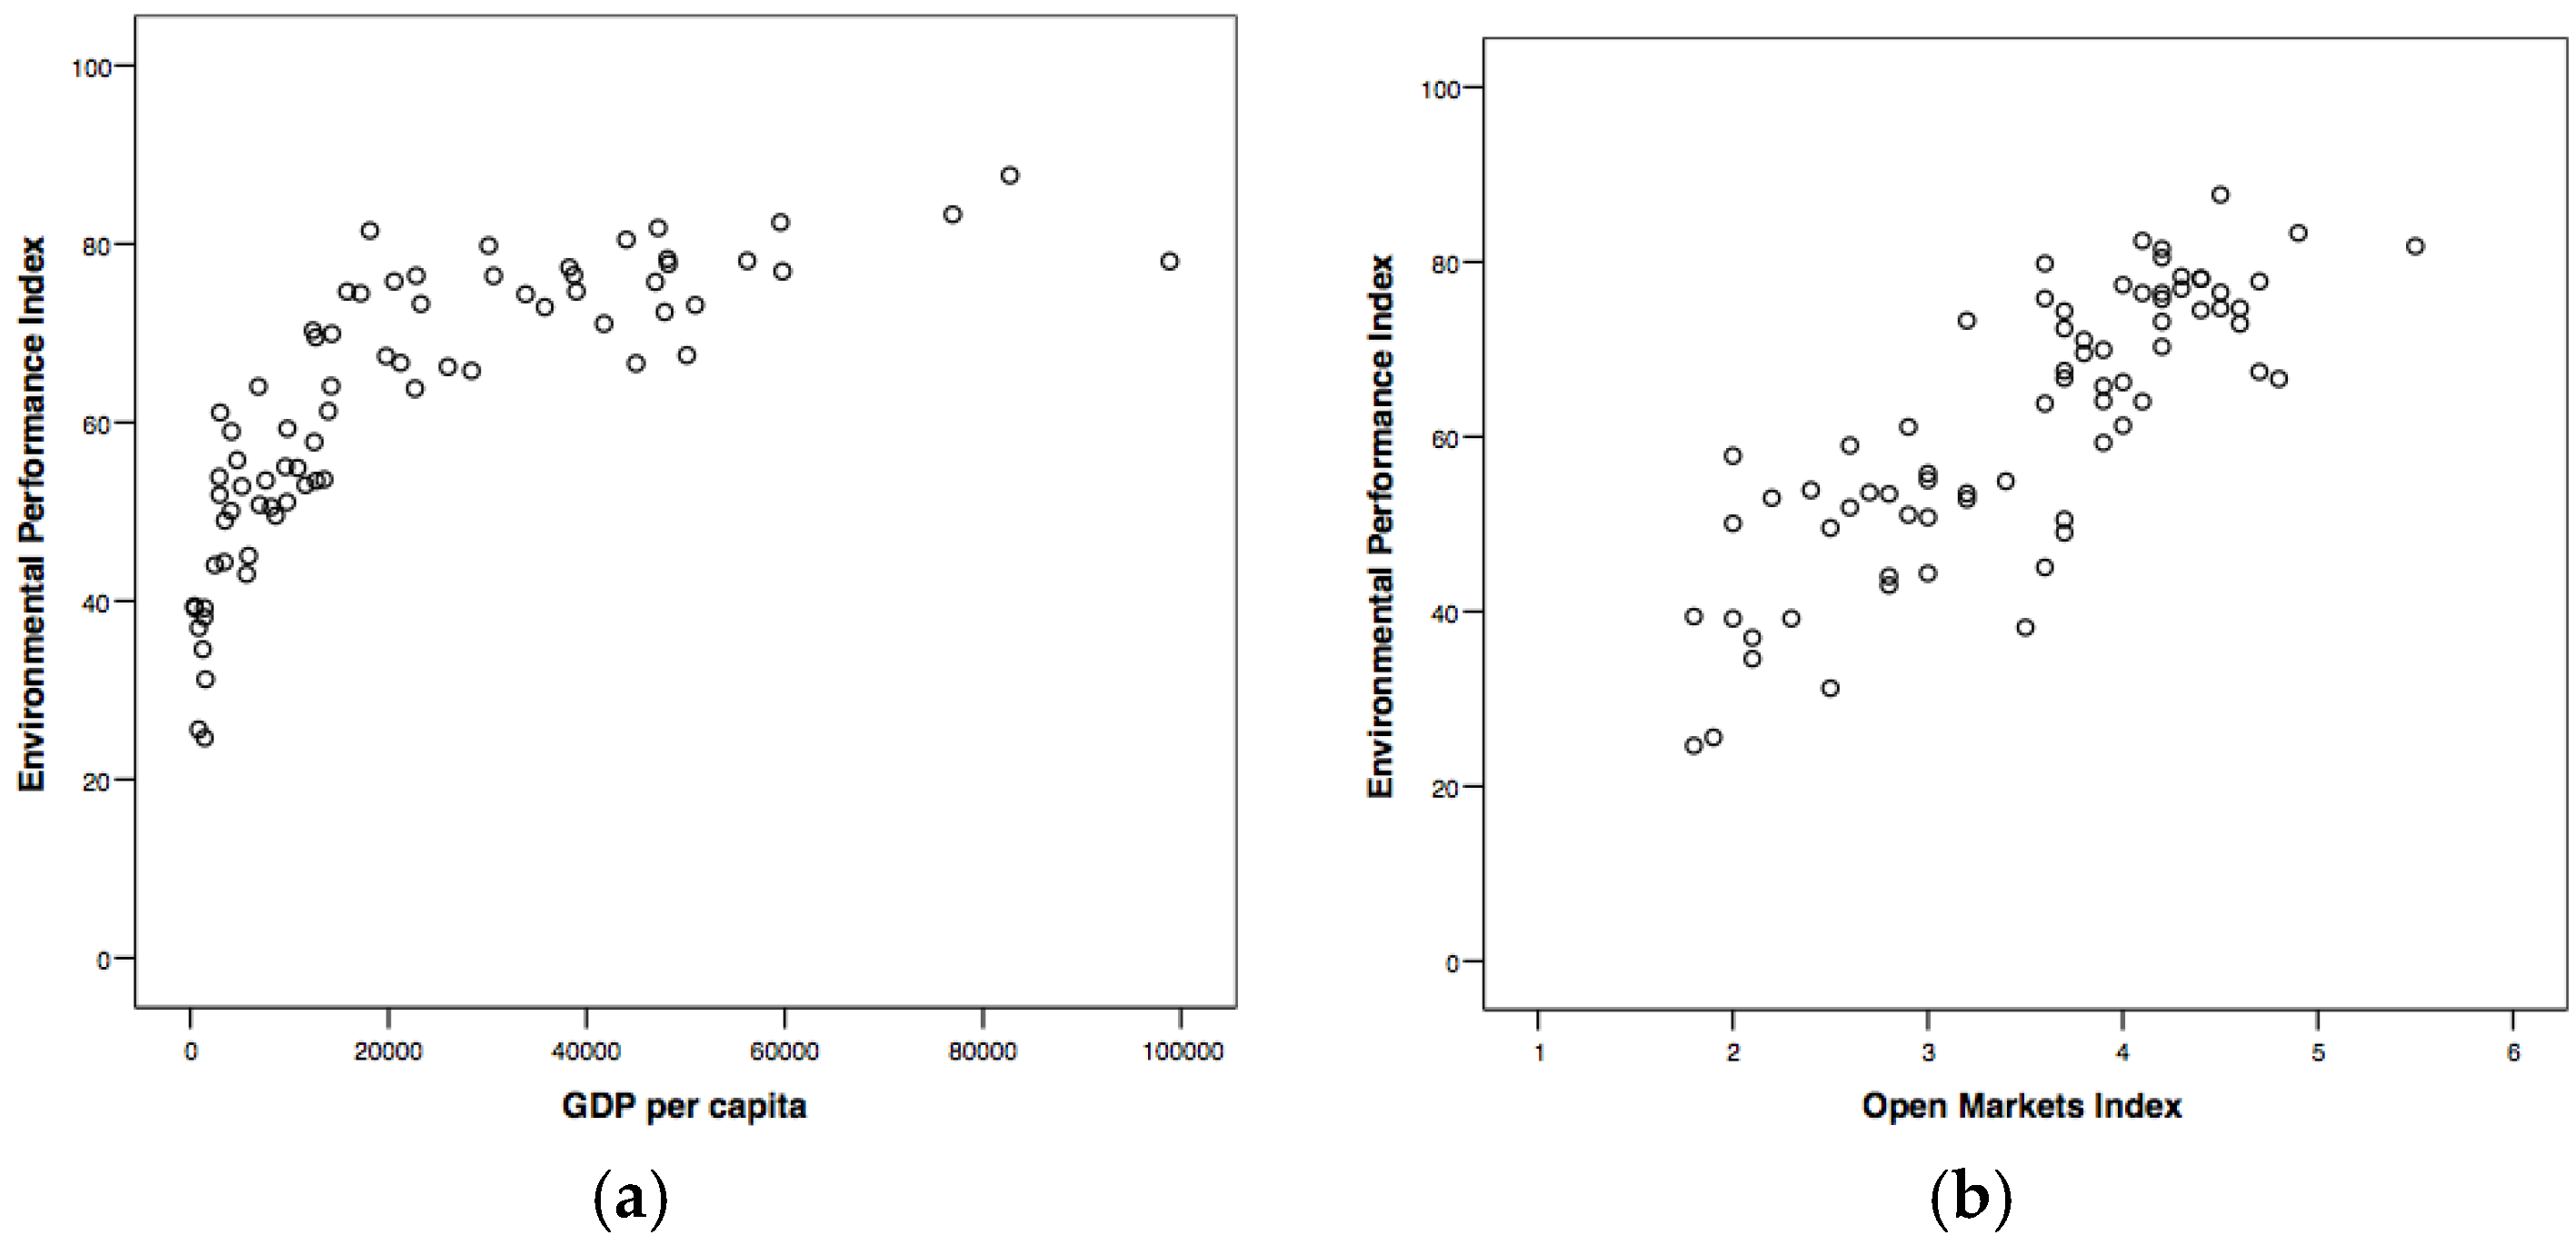
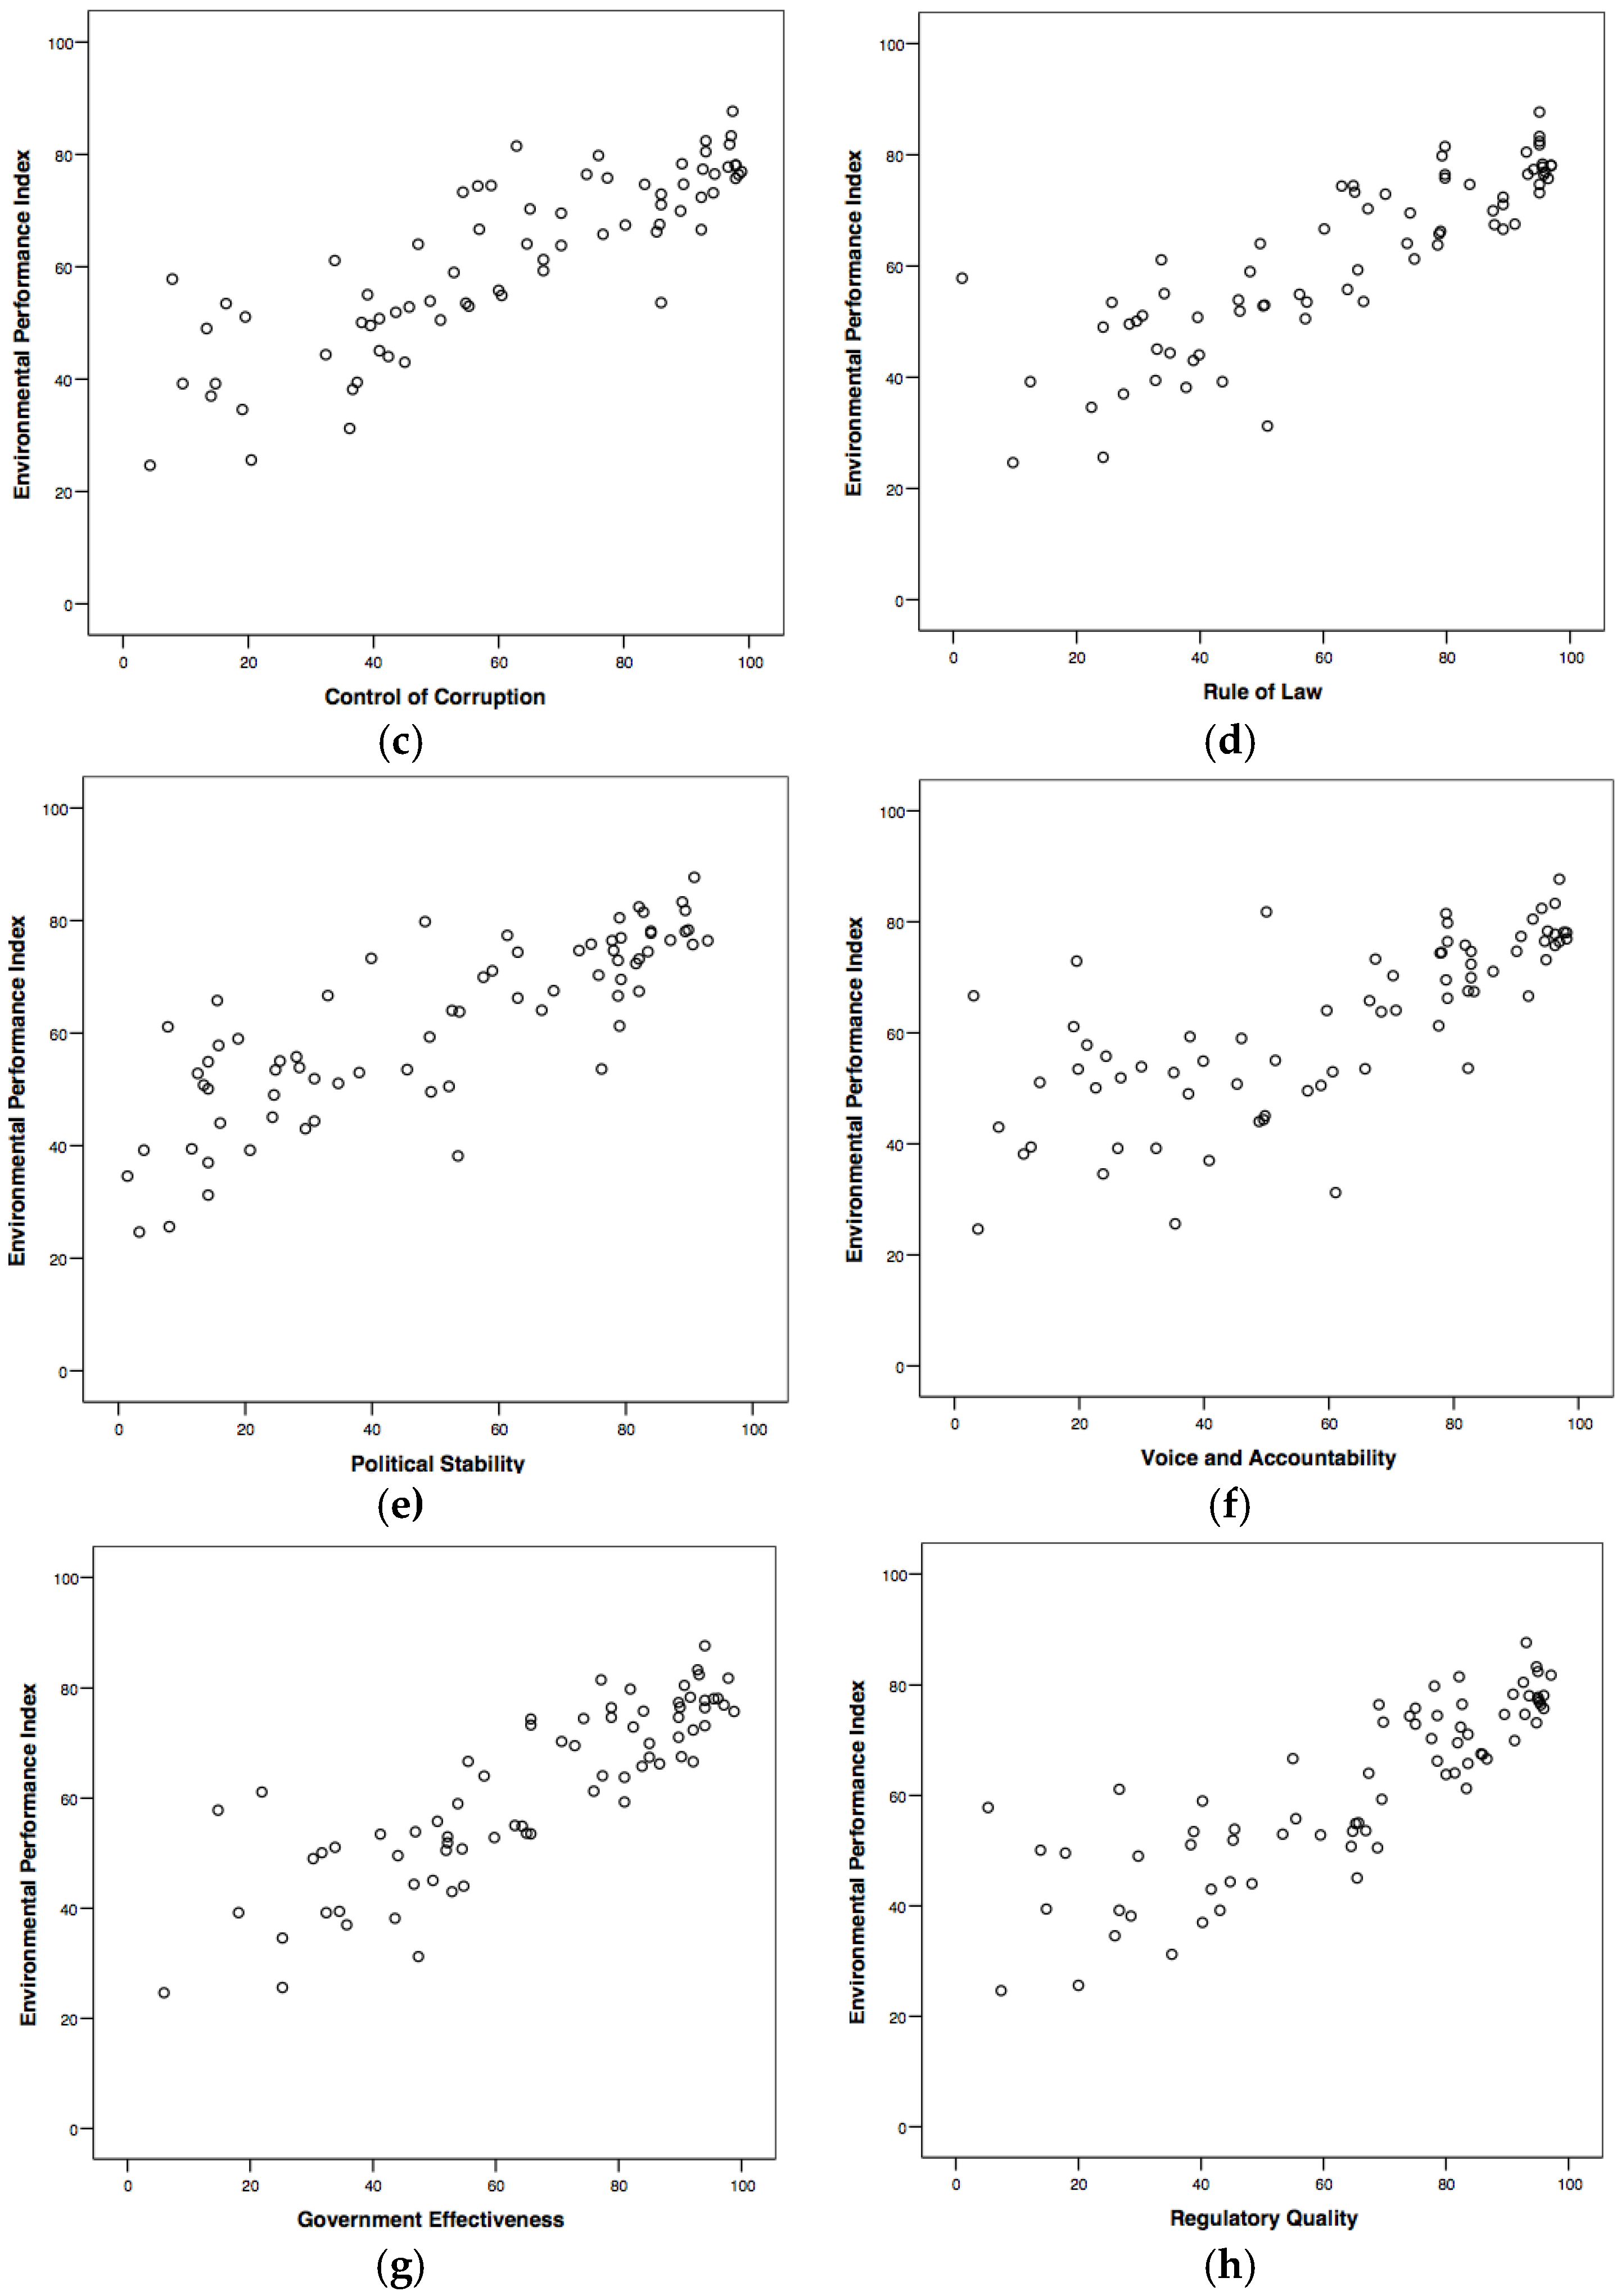
3.2. Relations of EPI and the Indicators
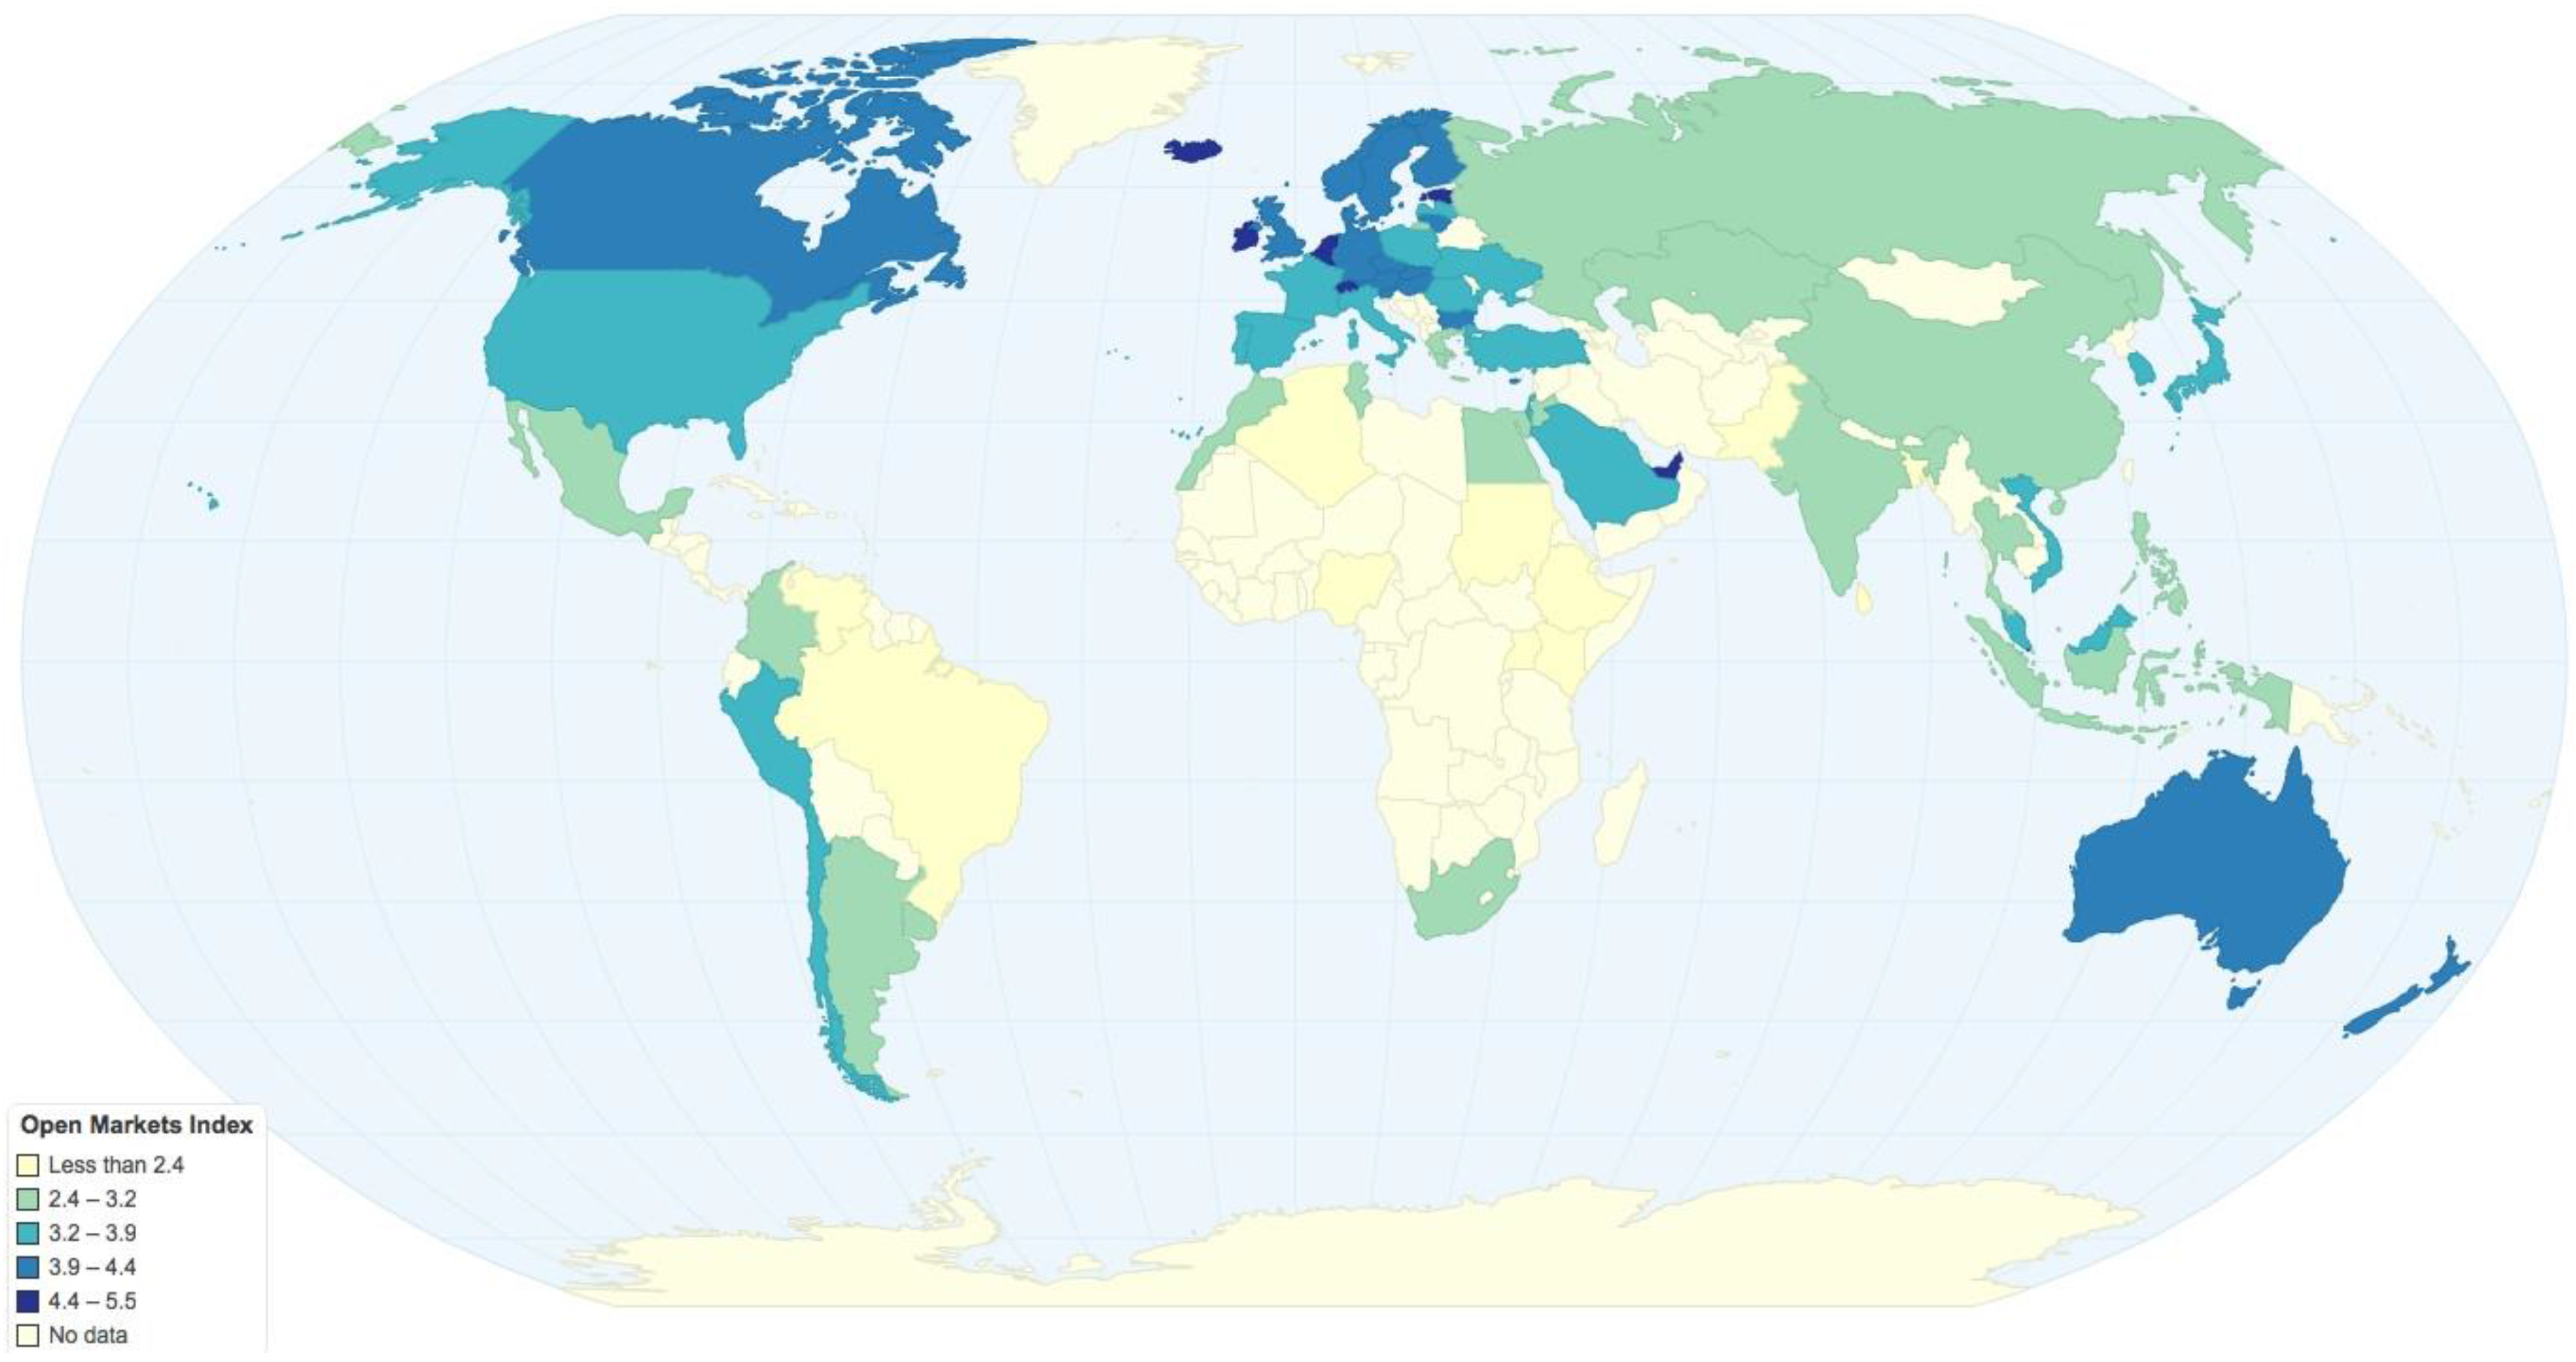
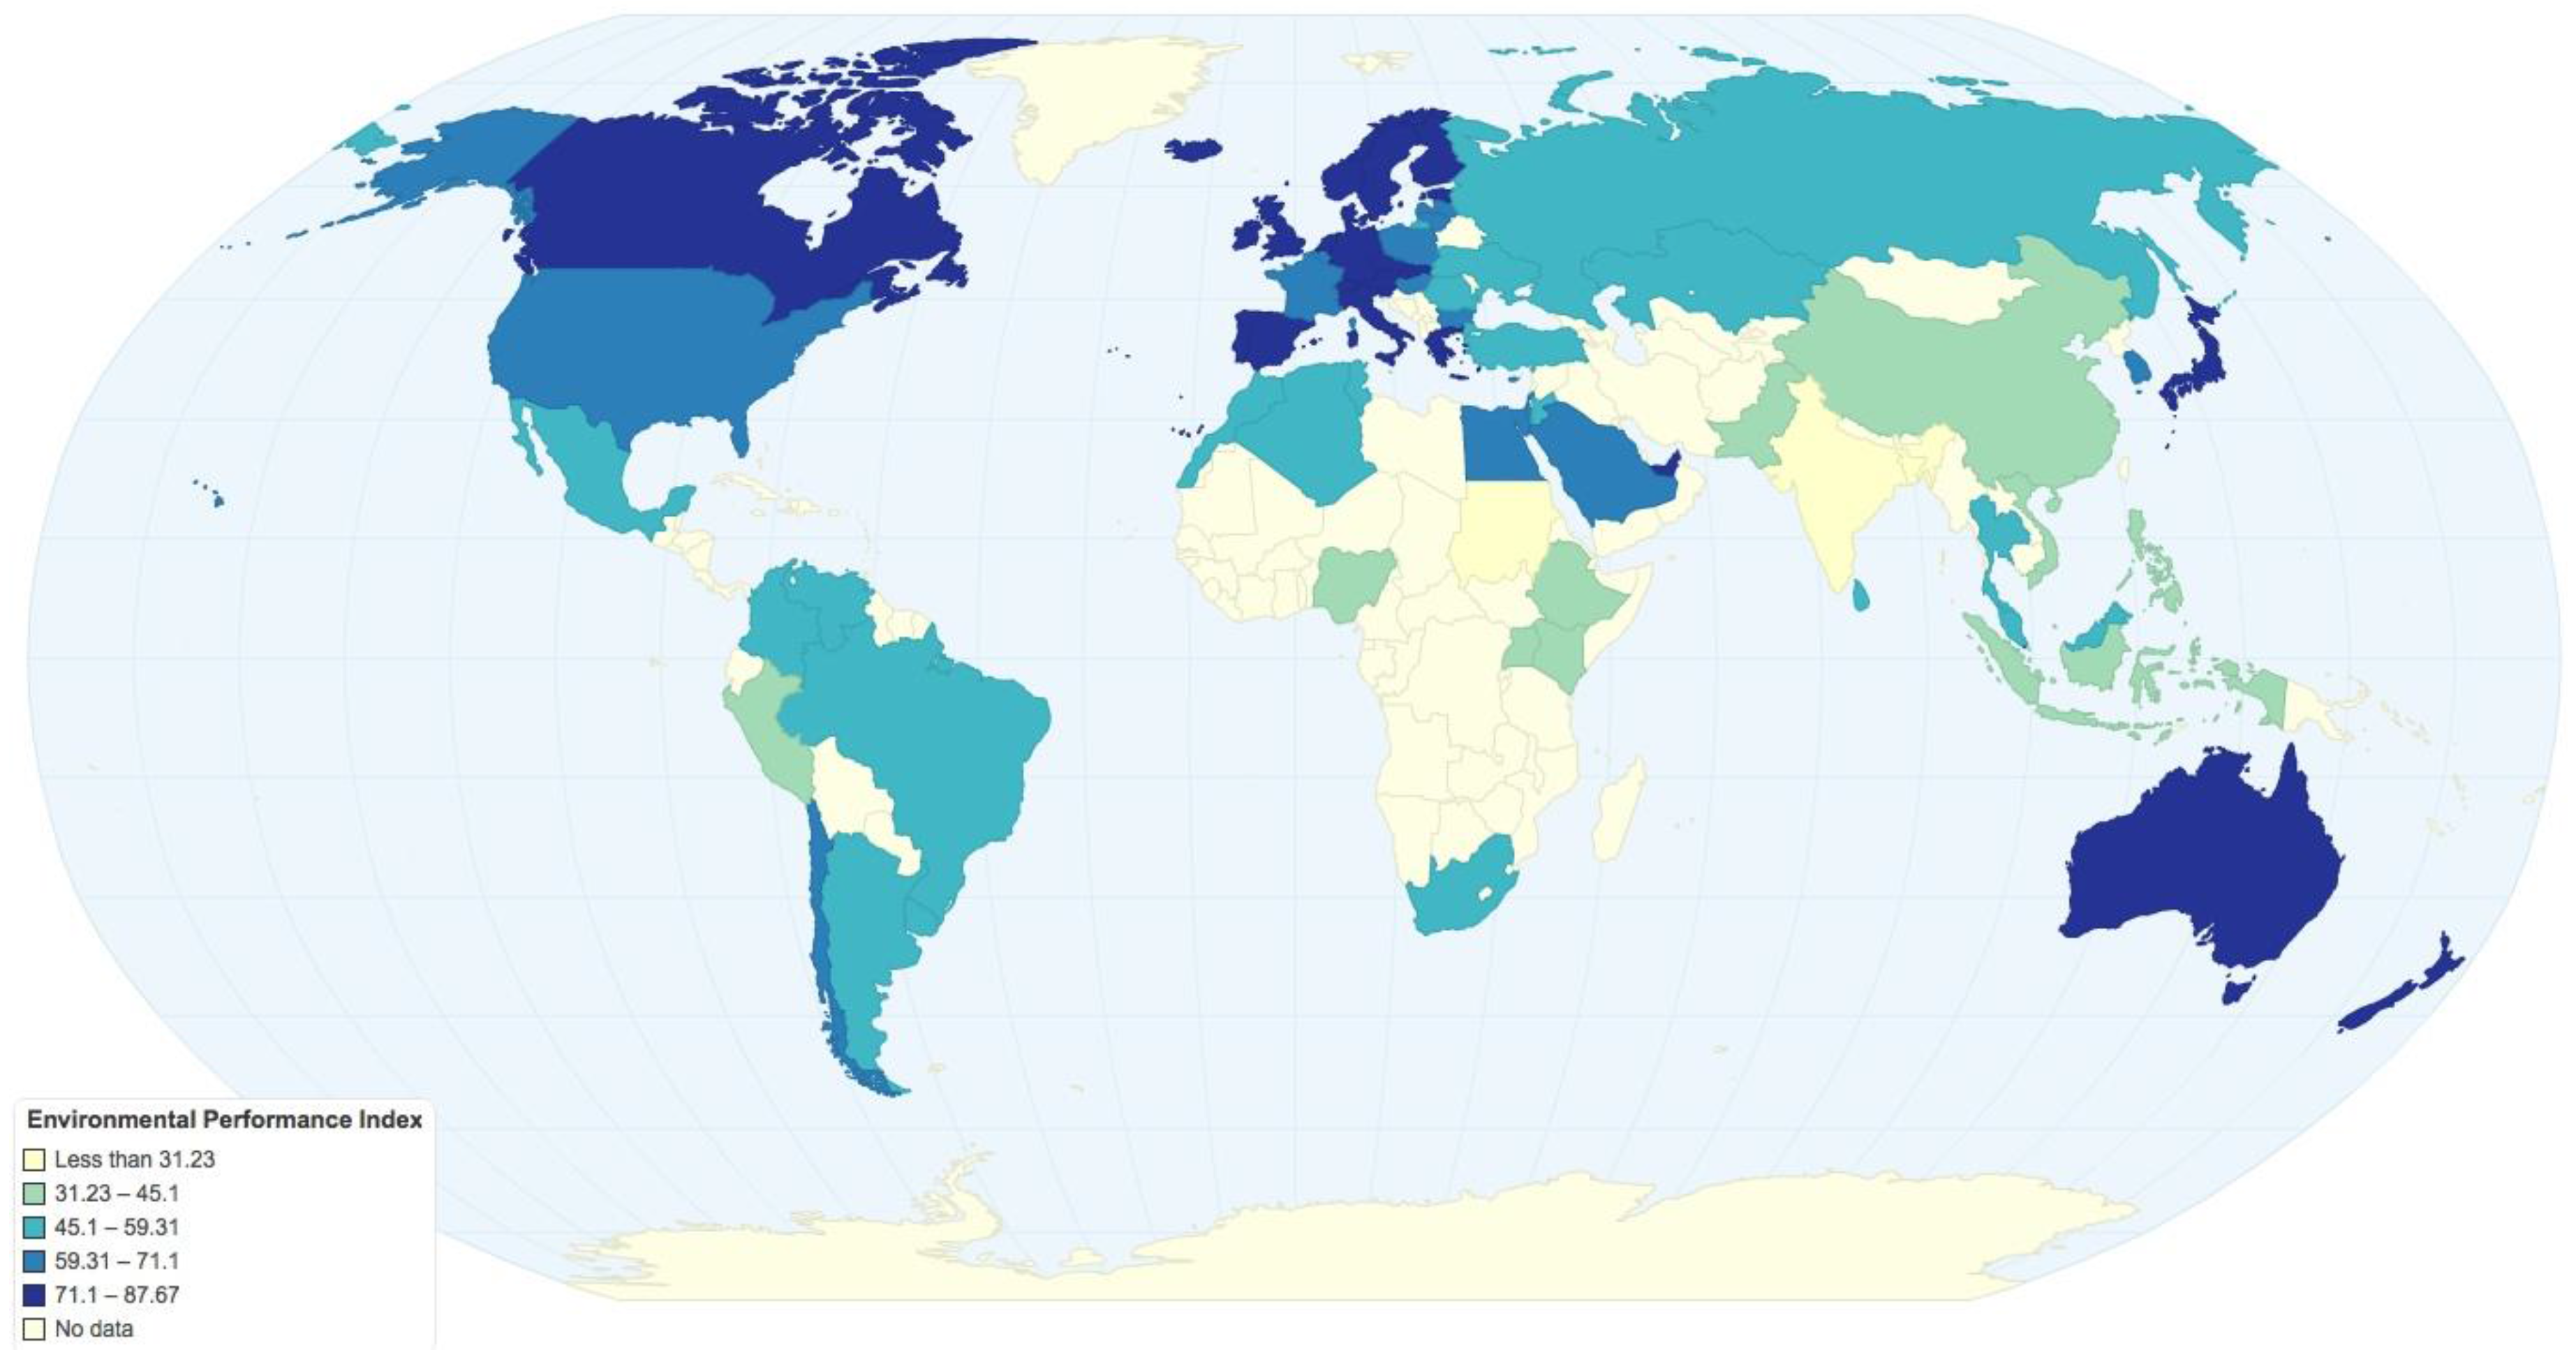
3.3. Visualizations of OMI and EPI
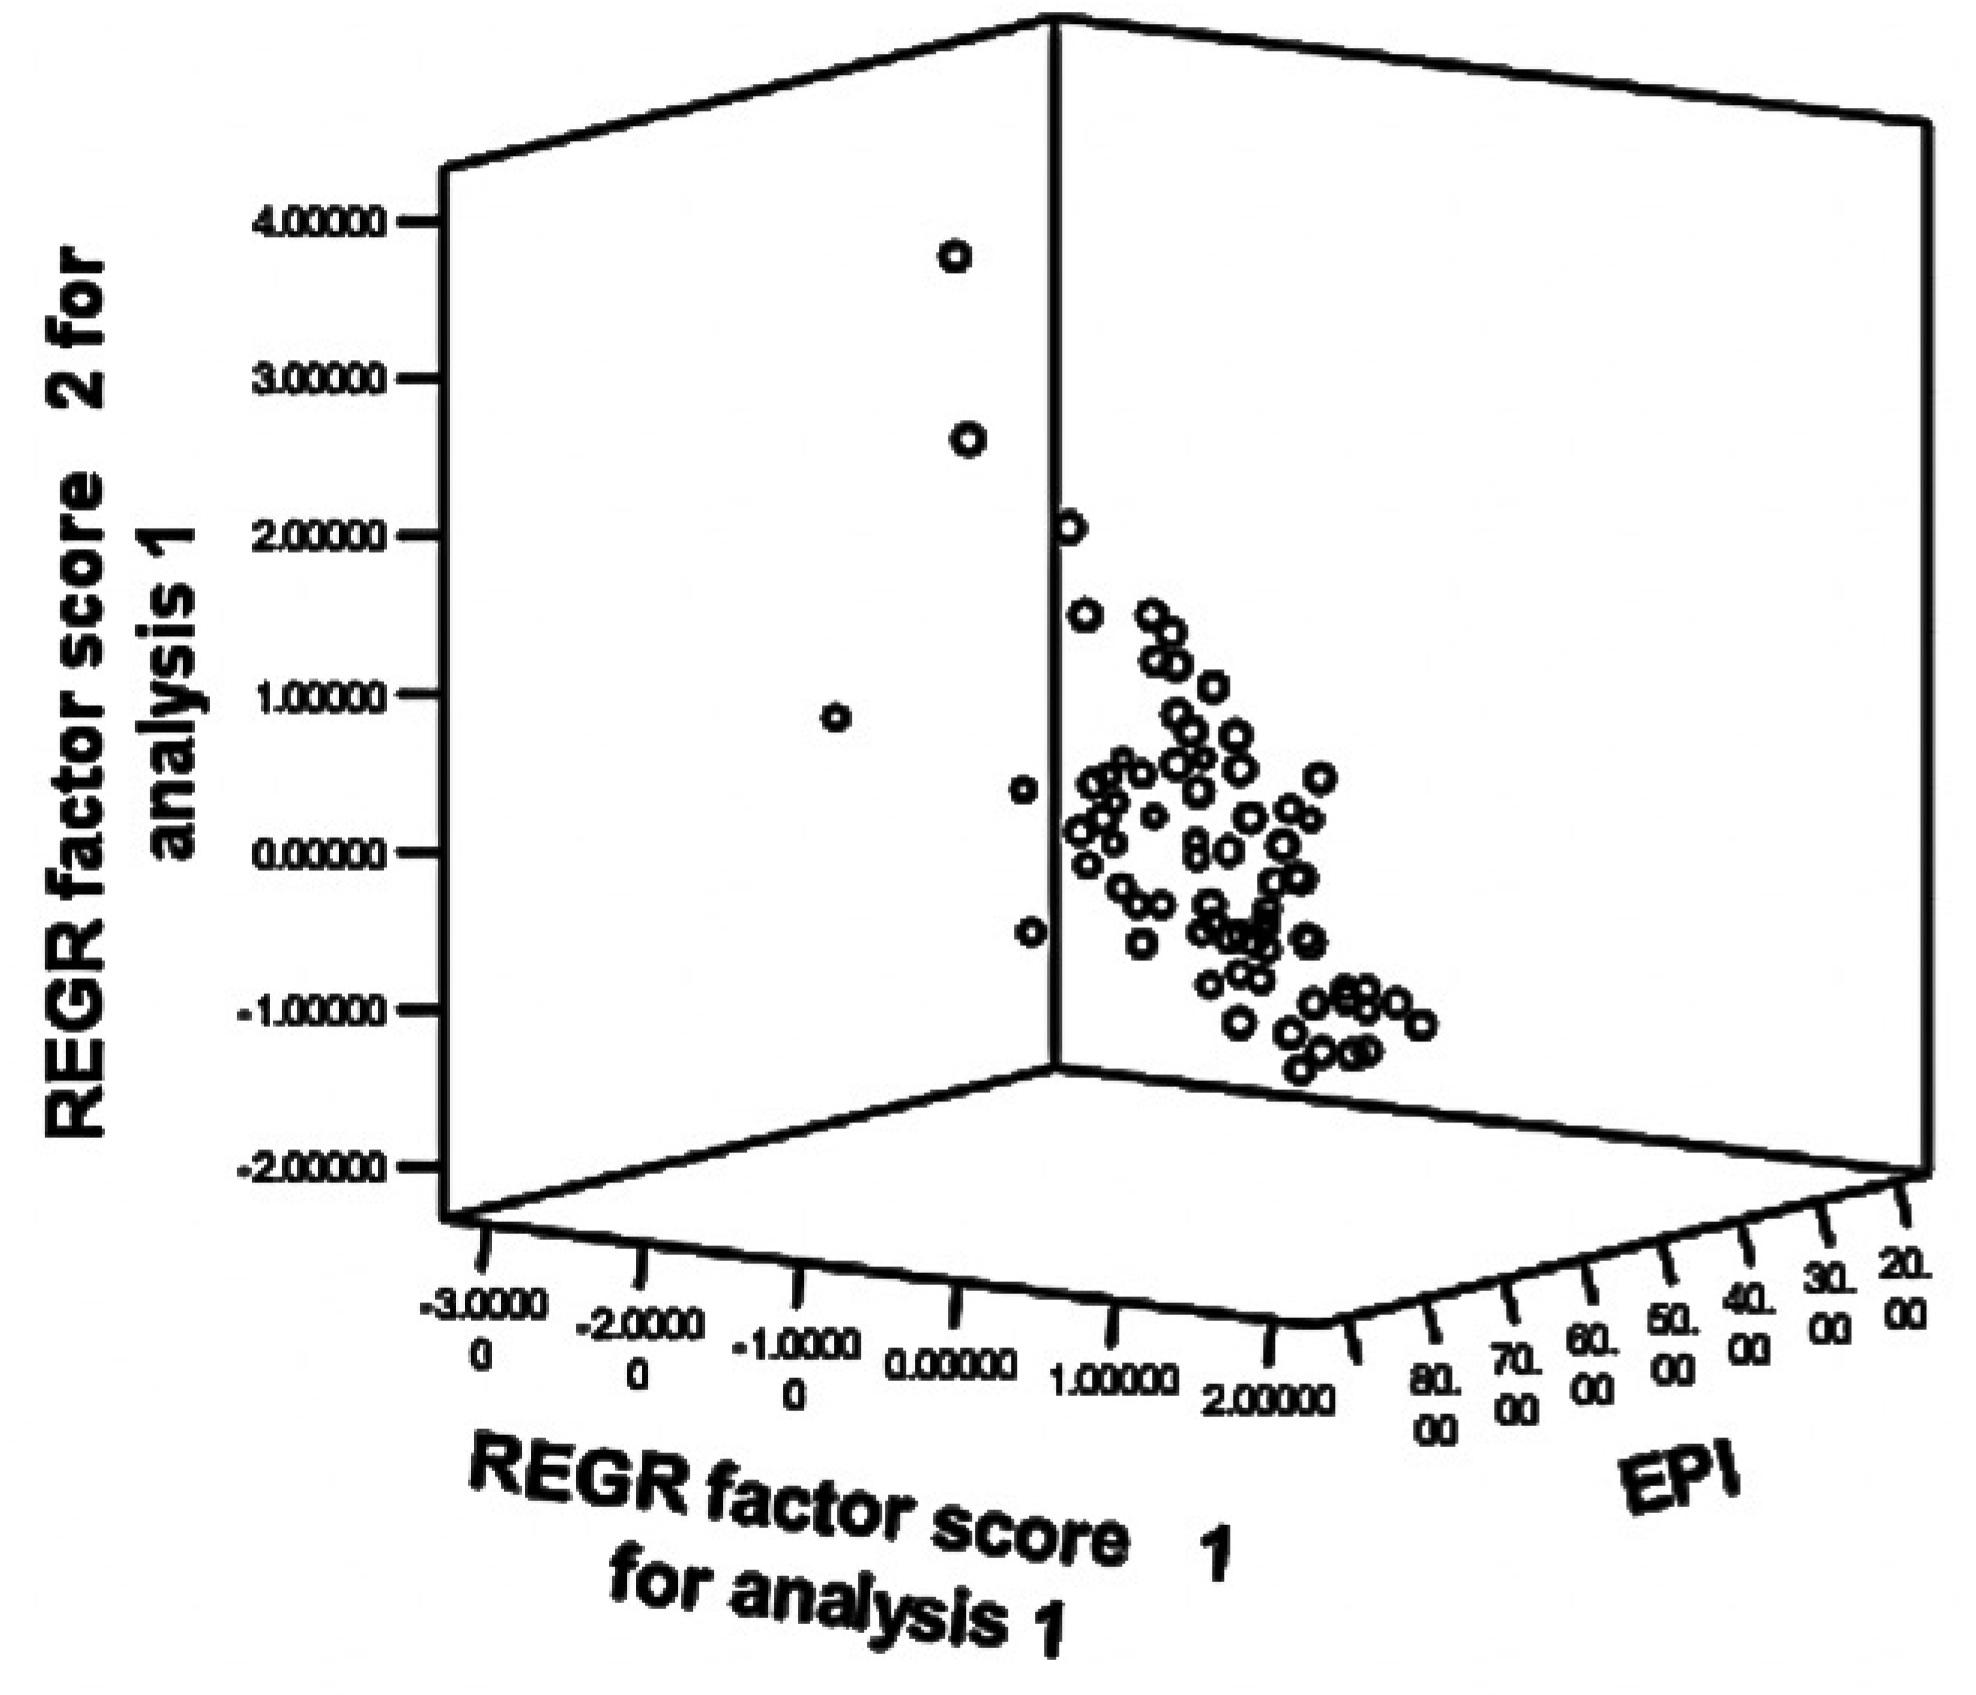
3.4. Model Estimations
4. Conclusions
Acknowledgments
Author Contributions
Conflicts of Interest
Abbreviations
- CC: Control of Corruption
- EPI: Environmental Performance Index
- GDPc: Gross Domestic Product per capita
- GE: Government Effectiveness
- ICC: International Chamber of Commerce
- OMI: Open Markets Index
- PS: Political Stability
- RL: Rule of Law
- RQ: Regulatory Quality
- VA: Voice and Accountability
- WGIs: Worldwide Governance Indicators
- YCELP: Yale Center for Environmental Law and Policy
References
- Ekins, P. ‘Limits to growth’ and ‘sustainable development’: Grappling with ecological realities. Ecol. Econ. 1993, 8, 269–288. [Google Scholar] [CrossRef]
- Illge, L.; Schawarze, R. A matter of opinion—How ecological and neoclassical environmental economics and think about sustainability and economics. Ecol. Econ. 2009, 68, 594–604. [Google Scholar] [CrossRef]
- Arrow, K.; Bolin, B.; Constanza, R.; Dasgupta, P.; Folke, C.; Halling, C.S.; Jansson, B.O.; Levin, S.; Maler, K.G.; Perring, C.; et al. Economic growth, carrying capacity, and the environment. Science 1995, 268, 520–521. [Google Scholar] [CrossRef] [PubMed]
- Cole, M.A. Limits to growth, sustainable development and environmental Kuznets curves: And examination of the environmental impact of economic development. Sustain. Dev. 1999, 7, 87–97. [Google Scholar] [CrossRef]
- United Nations World Commission on Environment and Development (WCED). Our Common Future; Oxford University Press: Oxford, UK, 1987. [Google Scholar]
- Dergiades, T.; Kaufmann, R.K.; Panagiotidis, T. Long-run changes in radiative forcing and surface temperature: The effect of human activity over the last five centuries. J. Environ. Econ. Manag. 2016, 76, 67–85. [Google Scholar] [CrossRef]
- Vehmas, J.; Luukkanen, J.; Kaivo-oja, J. Linking analyses and environmental Kuznets curves for aggregated material flows in the EU. J. Clean. Prod. 2007, 15, 1662–1673. [Google Scholar] [CrossRef]
- Chen, C.C.; Chen, Y.T. Income effect or policy result: A test of the environmental Kuznets Curve. J. Clean. Prod. 2008, 16, 59–65. [Google Scholar] [CrossRef]
- Stern, D.I. The rise and fall of the environmental Kuznet curve. World Dev. 2004, 32, 1419–1439. [Google Scholar] [CrossRef]
- Platteau, J.P. Behind the market stage where real societies exist—Part I: The role of public and private order institutions. J. Dev. Stud. 1994, 30, 533–577. [Google Scholar] [CrossRef]
- Tietenberg, T.H. Economic instruments for environmental regulation. Oxf. Rev. Econ. Policy 1990, 6, 17–33. [Google Scholar] [CrossRef]
- Scott, W.R. Organizations: Rational, National and Open Systems; Prentice Hall: Upper Saddle River, NJ, USA, 1992. [Google Scholar]
- DiMagio, P.J.; Powell, W.W. The iron core cage revisited: Isntitutional isomophism and collective rationality in organizational fields. Am. Sociol. Rev. 1983, 48, 147–160. [Google Scholar] [CrossRef]
- Verbeke, T.; de Clercqa, M. The income-environment relationship: Evidence from a binary response model. Ecol. Econ. 2006, 59, 419–428. [Google Scholar] [CrossRef]
- Mukherjee, S.; Chakraborty, D. Is environmental sustainability influenced by socioeconomic and sociopolitical factors? Cross-country empirical evidence. Sustain. Dev. 2013, 21, 353–371. [Google Scholar] [CrossRef]
- Fihlo, W.L.; Platje, J.; Gerstlberger, W.; Viergis, R.; Kaaria, J.; Klavins, M.; Kliucininkas, L. The role of governance in realising the transition towards sustainable societies. J. Clean. Prod. 2016, 113, 755–766. [Google Scholar]
- Chakraborty, D.; Mukherjee, S. How do trade and investement flows affect environmental sustainability? Evidence from panel data. Environ. Dev. 2013, 6, 34–47. [Google Scholar] [CrossRef]
- Bernauer, T.; Koubi, V. Effects of political institutions on air quality. Ecol. Econ. 2009, 68, 1355–1365. [Google Scholar] [CrossRef]
- Dima, B.; Dima, S.M.; Lobont, O.R. New empirical evidence of the linkages between governance and economic output in the European Union. J. Econ. Policy Reform 2014, 16, 68–89. [Google Scholar] [CrossRef]
- Governance Matters 2009: Learning From Over a Decade of the Worldwide Governance Indicators. Available online: http://www.brookings.edu/research/opinions/2009/06/29-governance-indicators-kaufmann (accessed on 15 October 2014).
- Chira, I. The impact of governance characteristics on the stock price of cross listed companies. J. Econ. Financ. 2014, 38, 53–70. [Google Scholar] [CrossRef]
- Prochniak, M. To what extent is the institutional environment responsible for worldwide differences in economic development. Contemp. Econ. 2013, 7, 17–38. [Google Scholar] [CrossRef] [Green Version]
- Friedman, M. Capitalism and Freedom; University of Chicago Press: Chicago, IL, USA, 1962. [Google Scholar]
- Hayek, F.A. The Constitution of Liberty; University of Chicago Press: Chicago, IL, USA, 1960. [Google Scholar]
- International Chamber of Commerce. Open Markets Index, 2nd ed.; International Chamber of Commerce: Paris, France, 2013. [Google Scholar]
- Measuring Progress: A Practical Guide from the Developers of the Environmental Performance Index (EPI). Available online: http://epi.yale.edu/sites/default/files/ycelp_measuring_progress_manual.pdf (accessed on 10 August 2014).
- Hsu, A.; Lloyd, A.; Emerson, J.W. What progress have we made since Rio? Results from the 2012 Environmental Performance Index (EPI) and Pilot Trend EPI. Environ. Sci. Policy 2013, 33, 171–185. [Google Scholar]
- Srebotnjak, T. The role of environmental statisticians in environmental policy: The case of performance measurement. Environ. Sci. Policy 2007, 5, 405–418. [Google Scholar] [CrossRef]
- Gallego-Álvarez, I.; Vicente-Galindo, P.; Rodríguez-Rosa, M. Environmental performance in countries worldwide: Determinant factors and multivariate analysis. Sustainability 2014, 6, 7807–7832. [Google Scholar] [CrossRef]
- Arndt, C. The politics of governance ratings. Int. Public Manag. J. 2008, 11, 275–297. [Google Scholar] [CrossRef]
- Dinda, S. Environmental Kuznets curve hypothesis: A survey. Ecol. Econ. 2004, 49, 431–455. [Google Scholar] [CrossRef] [Green Version]
- Grossman, G.M.; Krueger, A.B. Economic growth and the environment. Q. J. Econ. 1995, 110, 353–377. [Google Scholar] [CrossRef]
- Chortareas, G.; Magkonis, G.; Moschos, D.; Panagiotidis, T. Financial development and economic activity in advanced and developing open economies: Evidence from panel cointegration. Rev. Dev. Econ. 2015, 19, 163–177. [Google Scholar] [CrossRef]
- Tamazian, A.; Shoosa, J.P.; Vandlannati, C. Does higher economic and financial development lead to environmental degradation: Evidence from BRIC countries. Energ. Policy 2009, 37, 246–253. [Google Scholar] [CrossRef]
- Frankel, J.A.; Rose, A.K. Is trade good or bad for the environment? Sorting out the causality. Rev. Econ. Stat. 2008, 110, 353–377. [Google Scholar]
- Frazin, Y.H.; Bond, C.A. Democracy and environmental quality. J. Dev. Econ. 2006, 81, 213–235. [Google Scholar] [CrossRef]
- Yong, A.G.; Pearce, S.A. Beginner’s guide to factor analysis: Focusing on exploratory factor analysis. Tutor. Quant. Methods Psychol. 2013, 9, 79–94. [Google Scholar]
- Vogel, D. Trading up and governing across: Transnational governance and environmental protection. J. Eur. Public Policy 1997, 4, 556–571. [Google Scholar] [CrossRef]
- Damania, R.; Fredrikssson, P.G.; List, J.A. Trade liberalization, corruption, and environmental policy formation: Theory and evidence. J. Environ. Econ. Manag. 2003, 46, 49–512. [Google Scholar] [CrossRef]
- Castiglione, D.; Infante, D.; Smirnova, J. Environment and economic growth: Is the rule of law the go-between? The case of high-income countries. Energ. Sustain. Soc. 2014, 5, 1–7. [Google Scholar] [CrossRef]


| Statistics | EPI | CC | RQ | PS | VA | GE | RL | GDPc | OMI |
|---|---|---|---|---|---|---|---|---|---|
| Mean | 61.78 | 61.78 | 65.38 | 51.39 | 60.31 | 66.23 | 63.32 | 22466 | 3.52 |
| Std. Dev. | 15.36 | 28.05 | 26.12 | 29.31 | 29.21 | 24.56 | 26.80 | 21910 | 0.89 |
| Minimum | 24.64 | 4.29 | 5.24 | 1.42 | 3.07 | 5.95 | 1.42 | 410 | 1.80 |
| 25% Percentile | 50.92 | 40.24 | 43.93 | 24.41 | 35.26 | 48.57 | 39.27 | 4965 | 2.80 |
| Median | 64.05 | 62.86 | 69.76 | 53.54 | 66.51 | 70.71 | 65.57 | 13920 | 3.70 |
| 75% Percentile | 75.20 | 89.17 | 86.31 | 79.13 | 83.02 | 89.76 | 89.15 | 38480 | 4.20 |
| Maximum | 87.67 | 98.81 | 97.14 | 92.92 | 98.11 | 98.81 | 96.93 | 98860 | 5.50 |
| Variable | CC | RQ | PS | VA | GE | RL | GDPc | OMI |
|---|---|---|---|---|---|---|---|---|
| CC | 1 | - | - | - | - | - | - | - |
| RQ | 0.904 | 1 | - | - | - | - | - | - |
| PS | 0.853 | 0.829 | 1 | - | - | - | - | - |
| VA | 0.814 | 0.843 | 0.801 | 1 | - | - | - | - |
| GE | 0.959 | 0.953 | 0.856 | 0.839 | 1 | - | - | - |
| RL | 0.967 | 0.938 | 0.862 | 0.845 | 0.964 | 1 | - | - |
| GDPc | 0.789 | 0.727 | 0.734 | 0.707 | 0.773 | 0.783 | 1 | - |
| OMI | 0.815 | 0.873 | 0.841 | 0.69 | 0.859 | 0.837 | 0.693 | 1 |
| Variable | α | β | Std. Error | t-statistic | p-value | R-Sq (adj) |
|---|---|---|---|---|---|---|
| GDPc | −36.16 | 10.44 | 0.5940 | 17.574 | <0.001 | 0.8105 |
| OMI | 11.26 | 14.37 | 1.1480 | 12.523 | <0.001 | 0.6840 |
| pcGDPc,OMI | 61.77 | 9.21 | 0.4730 | 19.500 | <0.001 | 0.8404 |
| CC | 33.12 | 0.46 | 0.0350 | 13.440 | <0.001 | 0.7138 |
| RL | 30.70 | 0.49 | 0.0350 | 13.990 | <0.001 | 0.7300 |
| GE | 26.38 | 0.53 | 0.0386 | 13.870 | <0.001 | 0.7266 |
| PS | 39.55 | 0.43 | 0.0351 | 12.320 | <0.001 | 0.6769 |
| VA | 38.15 | 0.39 | 0.0416 | 9.420 | <0.001 | 0.5492 |
| RQ | 29.38 | 0.50 | 0.0376 | 13.200 | <0.001 | 0.7064 |
| pcWGI | 61.78 | 0.21 | 0.0140 | 15.050 | <0.001 | 0.7579 |
| Component | Initial Eigenvalues | Extraction Sums of Squared Loadings | Rotation Sums of Squared Loadings | ||||||
|---|---|---|---|---|---|---|---|---|---|
| Total | % of Variance | Cumulative % | Total | % of Variance | Cumulative % | Total | % of Variance | Cumulative % | |
| 1 | 6.855 | 85.687 | 85.687 | 6.855 | 85.687 | 85.687 | 4.69 | 58.626 | 58.626 |
| 2 | 0.355 | 4.438 | 90.125 | 0.355 | 4.438 | 90.125 | 2.52 | 31.499 | 90.125 |
| 3 | 0.307 | 3.837 | 93.962 | - | - | - | - | - | - |
| 4 | 0.222 | 2.774 | 96.737 | - | - | - | - | - | - |
| 5 | 0.15 | 1.875 | 98.611 | - | - | - | - | - | - |
| 6 | 0.054 | 0.68 | 99.291 | - | - | - | - | - | - |
| 7 | 0.034 | 0.421 | 99.712 | - | - | - | - | - | - |
| 8 | 0.023 | 0.288 | 100 | - | - | - | - | - | - |
| Variable | Component | |
|---|---|---|
| 1 | 2 | |
| CC | 0.779 | 0.563 |
| RQ | 0.866 | 0.432 |
| PS | 0.783 | 0.479 |
| VA | 0.673 | 0.579 |
| GoE | 0.835 | 0.509 |
| RL | 0.811 | 0.541 |
| GDPc | 0.389 | 0.895 |
| OMI | 0.872 | 0.314 |
| Predictors | Coefficients | Std. Error | t-statistic | p-value |
|---|---|---|---|---|
| Constant | 61.776 | 0.838 | 73.721 | <0.001 |
| Factor 1 | 11.057 | 0.844 | 13.104 | <0.001 |
| Factor 2 | 7.983 | 0.844 | 9.461 | <0.001 |
| Summary | R = 0.888; R-Sq = 0.789; R-Sq (adj) = 0.7830; Std. Error Est. = 7.159 | |||
© 2016 by the authors; licensee MDPI, Basel, Switzerland. This article is an open access article distributed under the terms and conditions of the Creative Commons Attribution (CC-BY) license (http://creativecommons.org/licenses/by/4.0/).
Share and Cite
Mavragani, A.; Nikolaou, I.E.; Tsagarakis, K.P. Open Economy, Institutional Quality, and Environmental Performance: A Macroeconomic Approach. Sustainability 2016, 8, 601. https://0-doi-org.brum.beds.ac.uk/10.3390/su8070601
Mavragani A, Nikolaou IE, Tsagarakis KP. Open Economy, Institutional Quality, and Environmental Performance: A Macroeconomic Approach. Sustainability. 2016; 8(7):601. https://0-doi-org.brum.beds.ac.uk/10.3390/su8070601
Chicago/Turabian StyleMavragani, Amaryllis, Ioannis E. Nikolaou, and Konstantinos P. Tsagarakis. 2016. "Open Economy, Institutional Quality, and Environmental Performance: A Macroeconomic Approach" Sustainability 8, no. 7: 601. https://0-doi-org.brum.beds.ac.uk/10.3390/su8070601