1. Introduction
A large number of sustainability assessment tools have been developed to gain insight into the sustainability performance of farms [
1,
2]. These tools generally integrate a wide range of themes and indicators to develop a holistic view on farm-level sustainability and are used for different purposes, such as monitoring, certification, consumer information, farm advice and research [
3]. Applying sustainability assessment tools can help to identify challenges, related to environmental, economic and social impact, in the development of sustainable food production systems in conventional and organic agriculture [
4,
5,
6]. On-farm assessment tools, however, show a large diversity in, for example, data, time and budget requirements, measurement and aggregation methods, output accuracy and complexity [
2,
7]. These differences should become more explicit when choosing a tool [
7,
8]. Moreover, after a sustainability assessment, additional efforts are needed to discuss the assessment outcomes with farmers and other stakeholders and translate them into meaningful decisions for change [
2,
9].
Studies on organic agriculture provide divergent views on its sustainability and potential to contribute to global food security [
10,
11,
12,
13]. Especially yield differences between conventional and organic agriculture are a topic of discussion [
12,
14,
15,
16]. Differences in yields are highly dependent on system and site characteristics (e.g., available nutrients and technology) [
11,
14]. Yields in organic farming are generally lower compared to conventional yields. Lower yields, on the one hand, are associated with a higher land use and, for example, higher global warming potential per kg live weight of pigs [
17]. On the other hand, the restricted use of pesticides and mineral fertilizers in organic agriculture can have a positive effect on biodiversity and enhance ecosystem services [
18,
19]. From an economic and social perspective, organic agriculture is often associated with the use of local resources (i.e., local seed varieties, manure), benefits for animal welfare and opportunities to increase farmers’ income and livelihood [
10,
13,
20,
21].
Organic agriculture in the European Union has increased over the past decades and currently accounts for about 5.7% of the agricultural area [
22]. The consumption of organic products is increasing as well, and is worldwide the highest per capita in Switzerland, Luxembourg and Denmark [
22]. Market shares of organic retail sales are highest in Denmark (7.6%), Switzerland (7.1%) and Austria (6.5%) [
22]. Denmark, therefore, can be considered a pioneer in organic food production, with an expected ongoing growth in organic food consumption [
23]. At the same time, producers and consumers are increasingly interested in getting insight in, and the development of, the sustainability performance of organic production [
24,
25].
The sustainability assessment tool RISE (Response-Inducing Sustainability Evaluation) [
26] is used in Denmark to assess the sustainability performance of organic farms and to guide farmers in producing more sustainably [
24,
27,
28]. This tool was selected based on the European project STOAS (Sustainability Training for Organic Advisors), in which experiences with different sustainability assessment tools were gathered [
29]. The objectives of the present study were to analyze the sustainability performance of organic farms in Denmark using the RISE 2.0 tool and to analyze differences in the performance among a diversity of agricultural sectors (i.e., vegetable, dairy, pigs and poultry production). First, we describe the RISE tool and elaborate on the methods for data collection and assessment. Second, we present the RISE assessment results of Danish organic farms and discuss differences between sectors. Third, we reflect on the approaches in RISE to assess sustainability performance and discuss the implications of our findings for organic agriculture in Denmark and, more generally, for assessing sustainability at the farm level.
2. Materials and Methods
2.1. RISE 2.0
RISE is an indicator-based sustainability assessment tool developed at the Bern University of Applied Sciences (School of Agricultural, Forest and Food Sciences, HAFL) [
30]. The aim of the tool developers is to provide a holistic evaluation of sustainability at the farm level and support the dissemination of sustainable practices [
30]. Since its start in 1999, RISE has been applied in over 2500 farms in 56 countries [
31]. Experiences with RISE 1.0 have been extensively described in the literature [
9,
26,
32,
33,
34]. Studies describing the application of the updated Version 2.0, launched in 2011, however, are limited [
2].
RISE 2.0 assesses the sustainability performance of a farm for 10 themes and 51 subthemes (
Table 1). Although RISE defines the subthemes as indicators, we prefer to call them subthemes as they include the evaluation of various indicators and align the terminology with other sustainability assessment tools and publications, such as, for example, the Sustainability Assessment of Food and Agriculture systems (SAFA) guidelines [
1,
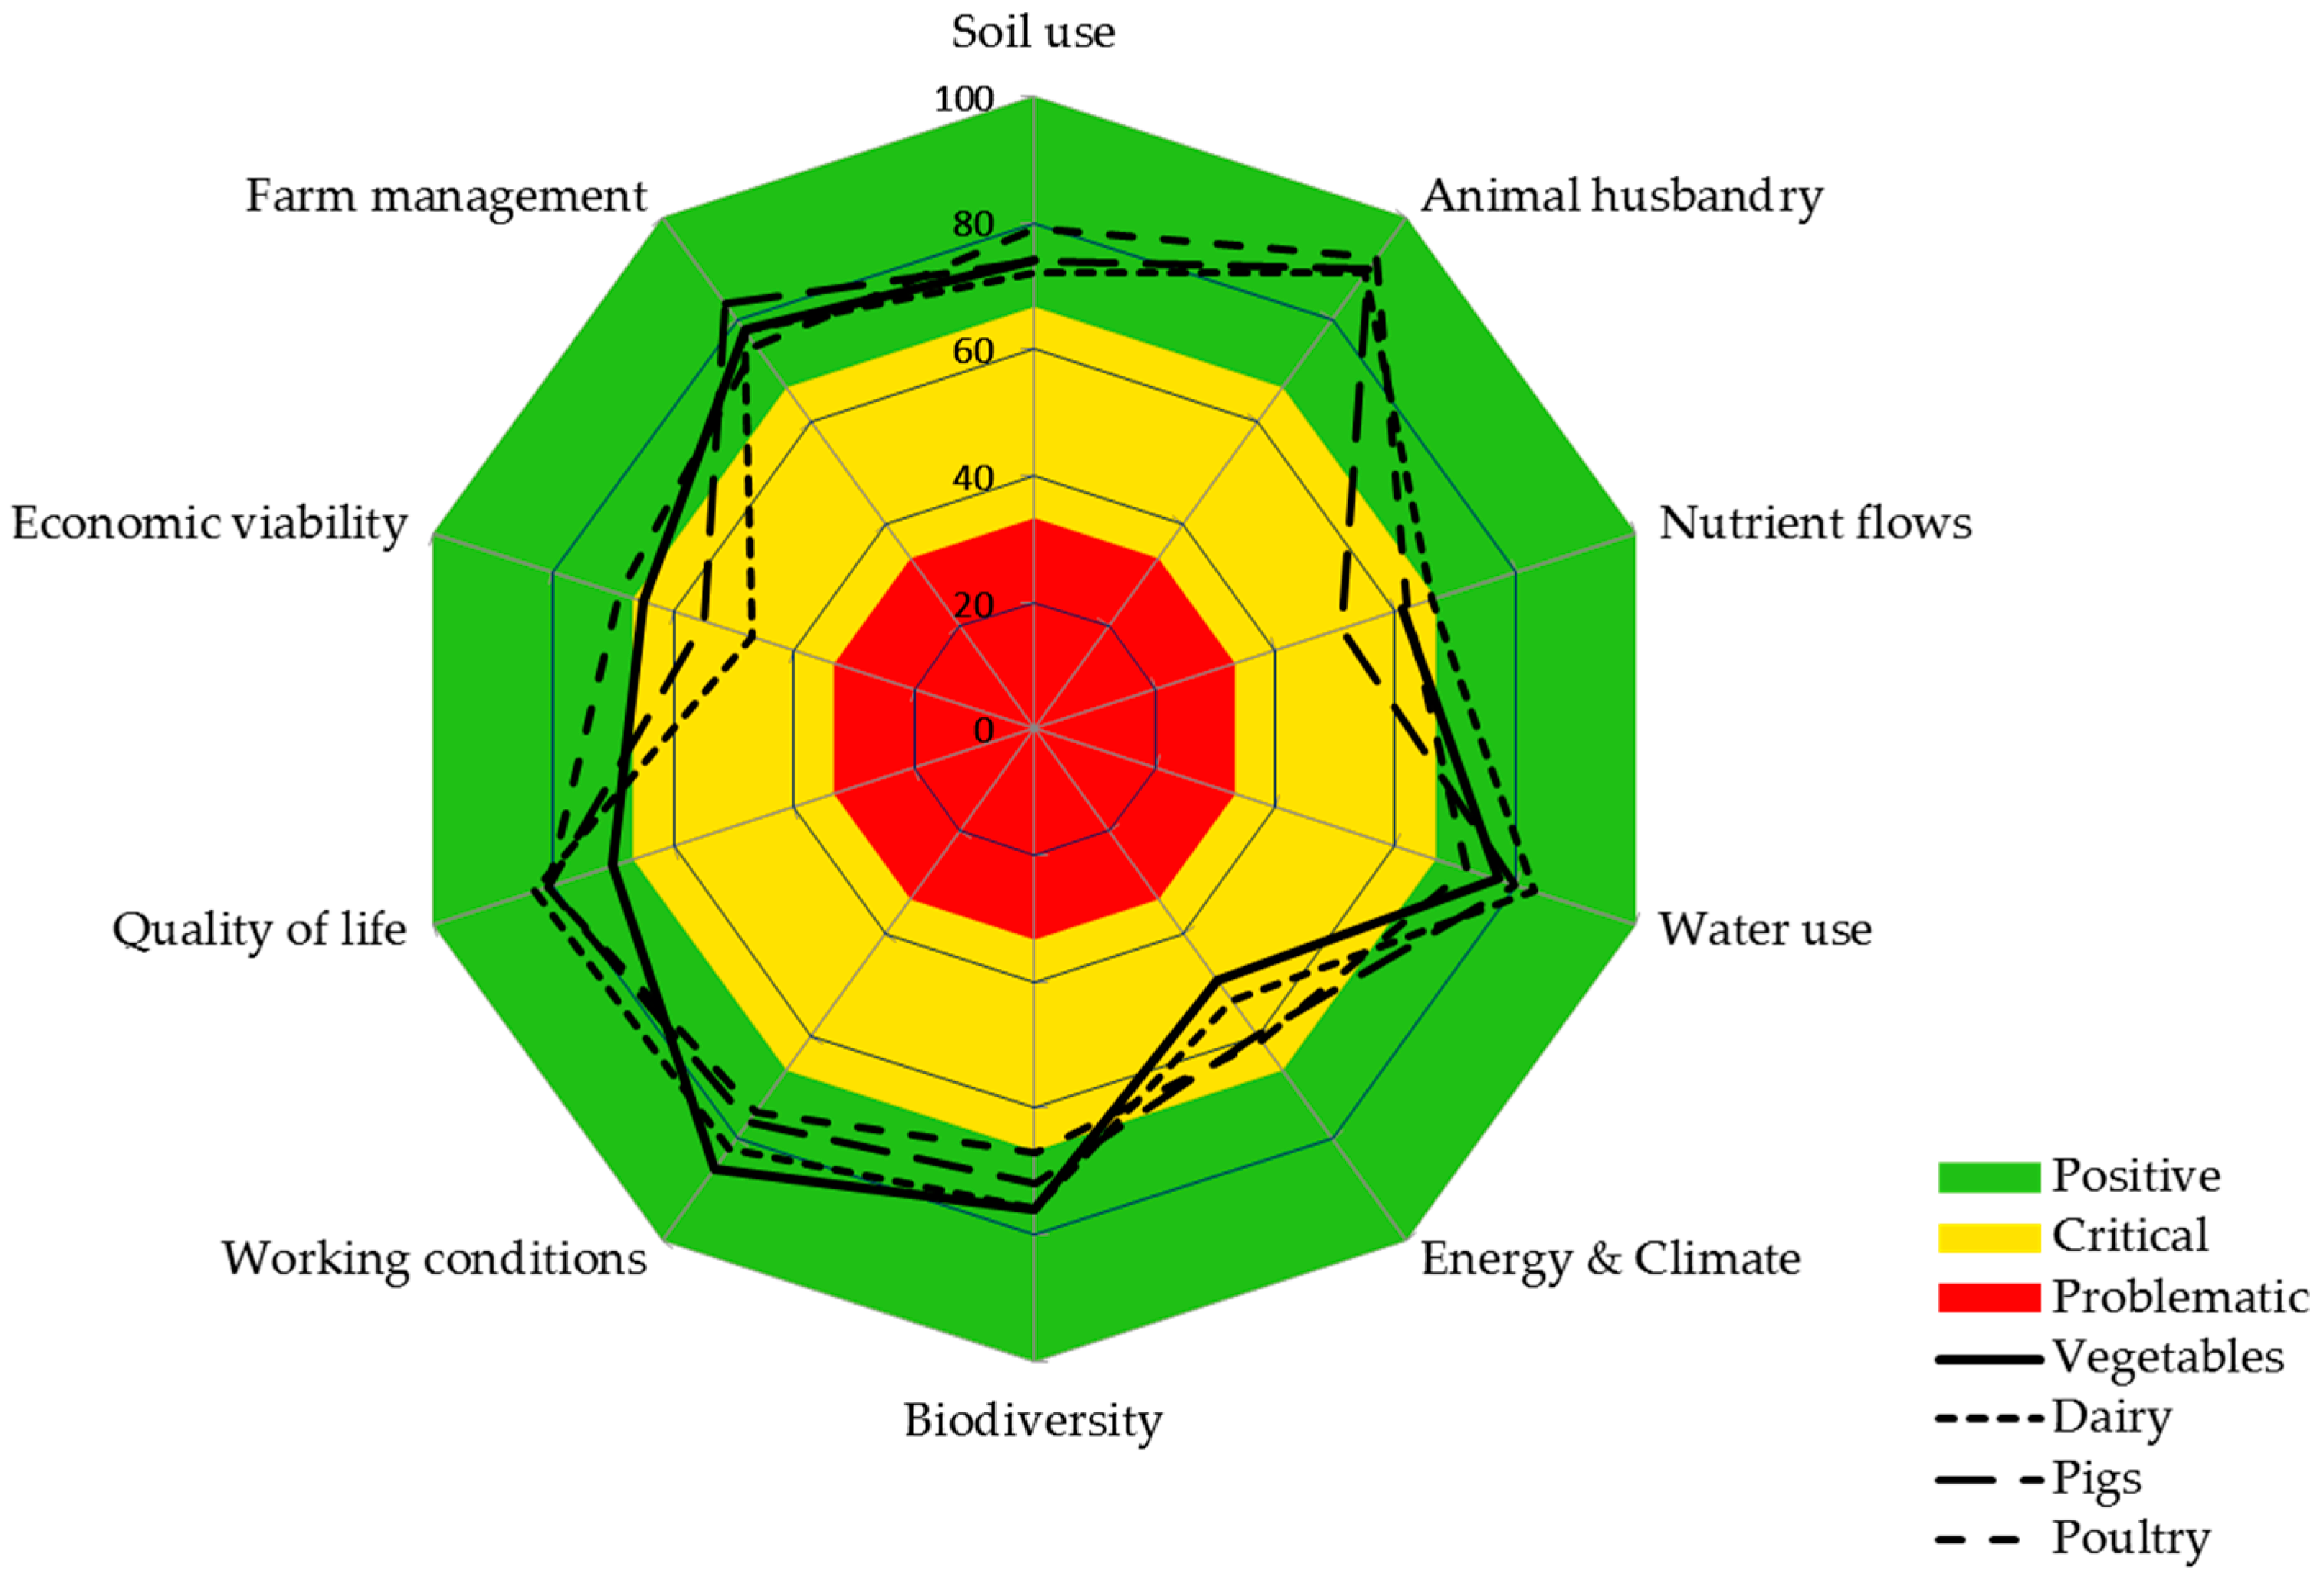
2]. The sustainability performance of each subtheme is based on an aggregation of various indicators. These indicators are normalized (i.e., converted to a 0–100 scale) differently for each subtheme and can include comparisons between farm and reference data. The score at the theme level is based on the average of the scores of the 4–7 subthemes included in each theme. Scores on theme and subtheme level range from 0–100 and are visualized in a polygon. According to RISE, a performance between 0 and 33 is considered problematic, between 34 and 66 critical and between 67 and 100 positive. RISE results are presented in a farm report, which includes the farm’s sustainability polygon, a table with the theme and subtheme scores and an explanation of the calculation and scores. Based on this report, a farmer and auditor define the measures for improvement. The RISE software is available on a license and requires training.
To compute the sustainability performance of a farm, four types of data are used: points allocated to farm practices, quantitative farm data, regional data and master data (global reference data). Information on farm practices and quantitative farm data are gathered through a questionnaire-based interview with the farmer and farm workers, conducted by a trained auditor. For the themes working conditions and quality of life, the farmer decides whether the employees may be interviewed, and if so, who. A certain amount of points (positive or negative) are given based on the answers of the farmer, farm worker and/or auditor to questions on farm management, activities and the on-farm situation (e.g., animal welfare conditions). This way, qualitative information is translated into a quantitative score (see
Box 1). The majority of subthemes (40) integrate this type of data to compute the performance of the farm on the subtheme. Of these subthemes, 19 subthemes are exclusively based on points allocated to certain measures, activities or situations on-farm. These subthemes are related to quality of life (6), farm management (5), animal husbandry (3), soil use (2), water use (1), nutrient flows (1) and working conditions (1). For the remaining 21 subthemes, this type of data is combined with one or more of the other data types.
Quantitative farm data (e.g., energy consumption, crop yields and income) are used in 28 subthemes, especially in combination with other types of data (23 subthemes) (see
Box 2). In five subthemes, quantitative farm data are used exclusively and compared to regional reference values. These subthemes are related to economic viability (4) and biodiversity (1).
Box 1. Example points-based subtheme: farm strategy and planning (10.1).
The score on this subtheme is based on the average score on four questions:
- 1
Is there a clear long-term farm development strategy?
- 2
Are there any short to medium-term measures for improvement on economy, social or ecology? (answered seperately for each dimension)
Each question can be anwered with yes (100 points), partly (50 points) or no (0 points).
Box 2. Example of a subtheme combining points, quantitative farm data, regional data and regional reference values: livestock productivity (2.2).
The subtheme is calculated in four steps.
- 1
The livestock units, per animal category (i) and in total (t), are calculated and corrected for temporarily absent or present animals. The livestock units are derived from regional data (livestock unit factors).
- 2
The productivity of each animal category (e.g., annual milk yield, growth rate, egg production) is compared to regional reference values. The score on the productivity for each animal category is calculated using this formula: productivity/regional productivity × 100 − 33.
- 3
For each animal category, the farmer is asked to give an estimation of the product quality (q1) and of the development of the performance and quality over the last 5 years (q2). For both questions, the farmer can select the answer from five options: significantly above average/improvement (20 points), slightly above average/improvement (10 points), average/stagnation (0 points), slightly below average/decline (−10 points), significantly below average/decline (−20 points).
- 4
The results of Steps 2 and 3 are added and corrected for the share of the animal category in the total livestock units on the farm: sum ((result step 2i + q1i + q2i) × (LUi/LUt)).
Regional data are specific to the respective region, but are not assessed or available at the farm level e.g., nitrogen losses from farm and storage facilities, livestock unit factors and water demand of crops. The regional data can be from a country, in this study Denmark, or from a smaller region. Master data are provided by RISE and cover, for example, the composition of feedstuffs, the toxicity and persistency of pesticides, the energy consumption of machine work, energy density (i.e., energy contained in MJ), the emissions of energy carriers (e.g., coal, wood, natural gas, petroleum) the and nutrient contents of organic fertilizers. Regional and master data are integrated in the calculations of 11 and 14 subthemes, respectively, always in combination with points and/or quantitative farm data. Five subthemes integrate all four data types.
Next to farm, regional and master data, regional reference values are used in 11 subthemes to compare the performance of the farm to the regional average or target (e.g., crop yields, livestock production, share of ecological priority areas, working hours and days per week). In the RISE software, a standard set of crops (i.e., yields, water content and cultivation period) and livestock (i.e., productivity and livestock units) is given that can be adjusted to the region and extended. What should be considered as 0 and 100 points is defined by the tool, except for six subthemes in which a regional reference value is used. In each subtheme, different calculations are used to aggregate data and compute a score. Decisions regarding these calculations, for example on indicators, units (i.e., hectares, MJ), weights and the use of an average or minimum score of the indicators, influence the result on the subtheme. These calculations are mostly fixed within RISE, except for quality of life-related subthemes, in which the interviewee determines the weight of each indicator within the subtheme and can include an additional subtheme.
2.2. RISE Assessments of Danish Organic Farms
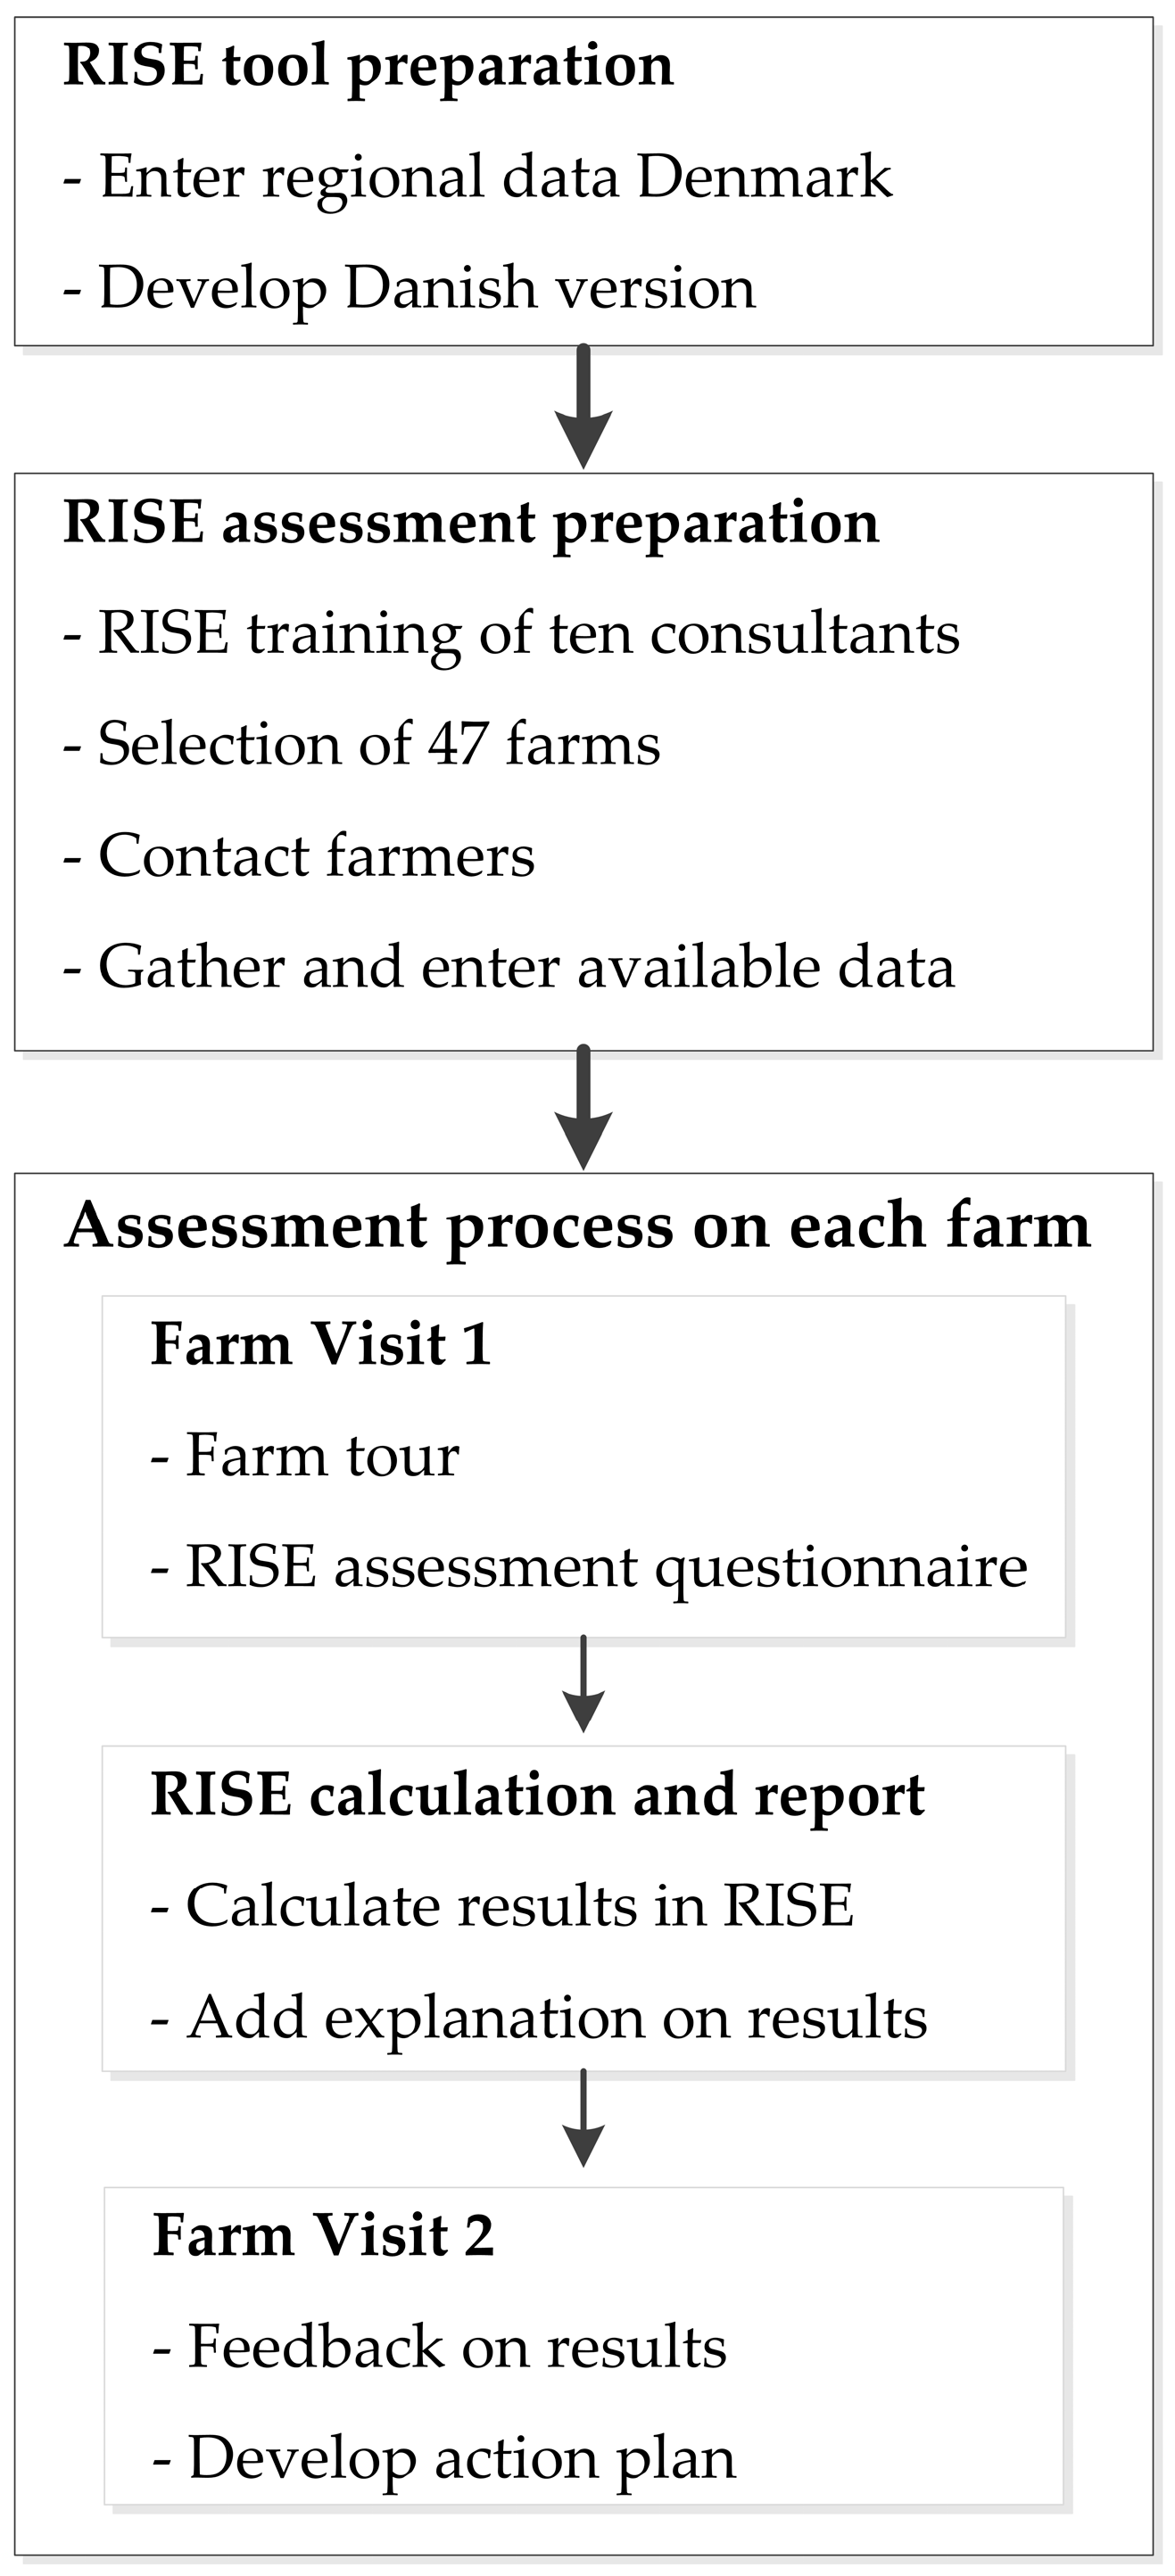
The sustainability performance of organic farms in Denmark was assessed and analyzed in three phases (
Figure 1). In the first phase, the RISE software had to be prepared for application in the Danish context. This preparation included entering regional data and regional reference values for Danish agriculture in RISE and translating the tool and questionnaire to Danish. These data were gathered from different sources, including databases and software on Danish farm management (e.g., Mark Online, Farmtal Online (SEGES)), expert consultation and discussions with the RISE tool developers. Regional reference values are based on Danish standards (e.g., weather, income levels and working hours) and the performance of Danish agriculture (not specifically organic agriculture).
In the second phase, the assessment process was prepared by training auditors, selecting farms, contacting farmers and entering available data in RISE. Ten consultants from Danish advisory services were trained as RISE 2.0 auditors by the tool developers from Switzerland. This training included a joint assessment and discussion of assessment procedures. Six food processing companies were involved in the selection of farmers for the assessments. This transdisciplinary approach, in which stakeholders from farming practice (i.e., farmers, advisors and processing companies) and research collaborate, can help to address sustainability challenges [
35,
36,
37]. Farms out of four sectors (vegetables, dairy, pigs and poultry) were selected by six food processing companies. These food processing companies were involved as stakeholders in communication on the sustainability of food products. Each company freely selected 7 or 8 of their supplying farmers to participate voluntarily in the sustainability assessment. Although this selection of farms is not a representative sample of the Danish organic farmers, an analysis of the results might give insight into generic sustainability challenges in Danish organic farming and differences in the sustainability performance of four agricultural sectors.
Before the actual assessment, each farmer was contacted and asked to provide available data (i.e., farm accounts, crop rotation plan, fertilization plan). These data were entered in RISE beforehand to reduce on-farm assessment time.
Finally, assessments of organic farms were carried out and involved two farm visits, calculation and reporting. Each farm assessment started with a short farm tour. After this introduction, the questionnaire-based interview with the farmer was carried out by one or two auditors. In case a farmer did not have all data needed available at the moment of assessment, these data were emailed later to the auditor and entered in the RISE software. When all data needed for the assessment were gathered, the outcomes were calculated in RISE, and a report was made. This report included an explanation given by the auditor(s) on the outcomes and was discussed with the farmer during a second farm visit. Based on the outcomes of the tool and priorities of the farmer, a brief action plan for improvement was made.
2.3. Analysis of RISE Assessment Results
In total, 47 farms were assessed in the period 2013–2014. Six assessments had to be excluded from the data analysis due to insufficient data and errors in data storage. To compare the sectors, a farm was considered specialized in a particular sector if more than 50% of the total output and coupled subsidies resulted from that sector. Although the food processing companies selected supplying farmers, this branch was not in all cases the most important output of the farm. Four farms that were initially selected as poultry farms appeared specialized in other sectors and therefore were excluded from the analysis.
Data of 37 RISE assessments were analyzed. Seven farms were assessed based on data from 2012 and 30 with data from 2013. General characteristics of the farms are given in
Table 2. Vegetable producers included in this study produce vegetables for vegetable and meal boxes. To compare farms with different species and ages of animals, livestock units (LU) are used as a reference unit. A dairy cow, for example, represents 1 LU; a heifer between 1 and 2 years old is 0.4 LU; while a fattening pig is 0.17 LU; and a laying hen is 0.01 LU [
38].
Assessment outcomes of the individual farms were analyzed in SPSS 22 to identify significant differences (
p < 0.05) using nonparametric tests. Differences between sectors for themes and subthemes were analyzed using the Kruskal–Wallis test. In case of significant differences, additional analysis was carried out using the Mann–Whitney U test for pairwise comparisons [
39,
40].
3. Results
3.1. Soil Use
The score on the theme soil use is based on the average score of seven subthemes (
Table 3). No difference between sectors was found for the theme soil use, while for the subtheme soil compaction, a difference was found (
Table 3).
The subtheme soil management combines quantitative farm data on the loss of agricultural land in the past ten years and points for knowledge and information about soil fertility. Erosion, salinization or building activity has caused losses in agricultural area on 24% of the farms (0.3%–1.4% of the farm area). Soil analyses for fertilization planning were applied regularly by 65% of the farmers, nutrient balances by 95% of the farmers, whereas soil organic matter balances were used by 5% of the farmers.
Crop productivity compares the farm yield of each crop per hectare to regional reference values. In addition, points are allocated based on the farmer’s perception of product quality compared to the regional quality and the development of the quality over the past five years. The productivity differed strongly between farms and per crop, but was generally lower than the Danish reference values, which were not specifically for organic farms.
Soil organic matter supply determines the share of farm area with a high humus content and the soil organic matter balance in arable crops. It includes the share of permanent grassland and crops, removal and burning of crop residues and the use of organic fertilizer. The median share of farm area with a high humus content was 19%, with a range from 0%–100%.
Soil reaction focuses on the chemical condition and management of the soil (i.e., pH level, use of acidifying fertilizers, liming, irrigated soils without adequate drainage). Acidifying fertilizers were used by 14% of the farms, 80% of which apply liming.
The subtheme soil pollution evaluates farm practices to reduce the risk of chemical soil pollution. Organic fertilizers that may contain heavy metals were used by 11% of the farmers; residues (e.g., compost) without pollutant analyses were used by 3% of the farmers; and a risk of pollution from highways or industry was recognized by 8% of the farmers. The majority of farmers (60%) used farm manure (either from conventional or organic farms) that may contain antibiotic residues.
The subtheme soil erosion assesses the wind and water erosion risks and evaluates measures implemented to reduce soil erosion (e.g., ploughing, ground cover, hedges). Farmers observed water erosion on 5% of the farms and affected 1%–5% of the agricultural land. Wind erosion was observed by farmers on 16% of the farms and affected 1%–15% of their land.
Soil compaction evaluates practices that can positively or negatively affect soil compaction. Harmful soil compaction was observed by farmers on 35% of the farms. Heavy machines (i.e., machines with a wheel load above 2.5 tons) were used on 78% of the farms. Of the farms using heavy machines 22% also used them on arable land with clayey soils; 22% used them on wet soils; and 60% applied intensive cultivation of such soils (e.g., plowing, root crops). Soil conservation measures (e.g., dual tires, low tire pressure or controlled traffic farming) when using heavy machines were implemented by 65% of the farms, and 70% implemented measures to improve soil stability (e.g., liming, interim greening or reduced tillage). The score on soil compaction was higher for poultry farms compared to dairy farms. Of the poultry farms, 64% used heavy machines, compared to 92% of dairy farms. Moreover, poultry farmers did not observe harmful soil compaction at all, while 54% of the dairy farmers did observe harmful soil compaction.
3.2. Animal Husbandry
The theme animal husbandry consists of five subthemes (
Table 4). Vegetable farmers included in this study did not have livestock; the scores are therefore based on 32 farms with livestock. No difference between sectors was found for this theme, while for the subthemes livestock productivity and quality of housing, a difference between sectors was found (
Table 4).
In the subtheme herd management, a farmer receives points for answers on questions related to information about livestock, health management and criteria for the selection of breeding animals. Of the farmers, 97% answered that they regularly observe the animals and information about the animals is documented and used for management. On health management, all farmers answered that they cleaned the barns properly, frequently and thoroughly and used preventive measures, such as separating animals with infectious diseases and regular claw trimming. Selection of breeding animals was generally made consciously considering robustness, adaptedness and expected life performance (78%).
The score on livestock productivity is computed by comparing the productivity of the animal category to the regional average and by taking into account farmers’ perception of product quality and developments in performance and quality over the last five years (
Box 2). Livestock productivity, without the scores on the perception of quality (development), was lower for dairy farms compared to pig and poultry farms (
Table 4). The median livestock productivity at dairy farms (of all animal categories) was 90% of the regional reference values, while the productivity at pig and poultry farms was 108% and 105%.
The subtheme possibilities for species-appropriate behavior combines points for the possibility for the animal to express behavioral needs and the livestock density on the farm. Both aspects are evaluated by the auditor for each animal category separately. For each species, RISE defined certain behavioral needs to be scored on-farm (e.g., outdoor access, free moving space, clean floors).
Scores on the subtheme quality of housing are based on the auditor’s observation of the cleanliness and amount of drinking places, protection from heat, light, air quality and protection from noise, for each animal category. Poultry farms had a lower score compared to dairy and pig farms on this subtheme. This difference is mainly due to an ammonia odor in the barns observed at 67% of the poultry farms.
The score on the subtheme animal health is based on the farm data of each animal category on animal treatment products used (i.e., share of animals treated curatively), mortality and mutilation (e.g., dehorning in cattle, debeaking in laying hens, castration in pigs).
3.3. Nutrient Flows
The theme nutrient flows consists of five subthemes (
Table 5). No difference between sectors was found for the theme nutrient flows, while the scores differed between sectors for the subthemes N and P self-sufficiency and ammonia emissions.
The score on nitrogen balance is calculated by first calculating the nitrogen demand at the farm level (based on the nitrogen demand of each crop and, if relevant, exported organic material) and comparing this to the nitrogen supply (i.e., animal husbandry, organic material and crops (through nitrogen fixation)). An optimum nitrogen balance (100 points) is according to RISE between 90% and 110%, and a poor balance (zero points) is lower than 30% or more than 180% of the demand.
Phosphorus balance scores are calculated using a similar approach and the optimum as for nitrogen balance. RISE compares the demand of crops with the supply from animals and imported organic material.
The subtheme N and P self-sufficiency compares the nitrogen and phosphorus demand of livestock (i.e., feed) and crops to the on-farm supply. The scores of dairy farms were higher compared to all other sectors as a result of a high degree (90% median) of self-sufficiency in N and P in both feed and fertilizer in dairy farms (
Table 5).
The subtheme ammonia emissions calculates emissions from animal husbandry, imported organic fertilizers and includes points for farm practices related to manure storage, manure spreading and slurry injection. The absence of livestock on vegetable farms resulted in lower ammonia emissions, hence a higher score compared to dairy, pig and poultry farms (
Table 5). In addition, dairy and pig farms scored higher compared to poultry farms, which is related to a lower livestock density in dairy farms (
Table 2).
In the subtheme waste management, the environmental risks of the disposal of twelve types of waste are assessed. Points are allocated to the different ways of disposing waste. The scores varied between farms indicating different approaches to dispose the various types of waste.
3.4. Water Use
The theme water use is based on the average score of four subthemes and differed between sectors with a lower score for poultry farms compared to dairy and pig farms (
Table 6).
The score on the subtheme water management is based on points received for farm practices related to water management (i.e., information on water availability and quality, technical water-storing measures and hygienic recycling of waste water) and the implementation of water-saving measures. Whereas 95% of the farmers had access to information on water availability and quality and 87% recycled waste water hygienically, only 11% implemented measures to increase the water storage capacity. Vegetable and dairy farms scored higher compared to pig and poultry farms, as a result of differences in the amount and type of water saving measures applied on the farms. Moreover, pig farms scored higher than poultry farms.
The subtheme water supply evaluates problems on the farm related to water supply (through minus points) and includes the regional value for water stress. A decrease of water availability was observed by 3% of the farmers; 8% observed a lowering of the ground water level; 5% observed a decrease of water quality; and 3% were confronted with water conflicts. Fossil groundwater was used by 14% of the farmers.
Water use intensity compares the water demand for agricultural production (i.e., crops, livestock and service) per hectare (in m
3/year) with the regional moisture index (a regional value for the availability of water, calculated from the FAO Moisture Index [
41]). The median water use intensity was 82 (0–100), and the regional value for the moisture index was 51.
The subtheme risk to water quality evaluates risks to water quality caused by storage facilities and effluent disposal and risks of nutrient input into the water. Scores were lower for poultry farms compared to vegetable and pig farms (
Table 6). Of the poultry farmers, 45% indicated that areas with high nutrient input (e.g., as a result of the outdoor run) are present, compared to 0% of farmers in the other sectors. Moreover, 82% of the poultry farms had buffer strips along open water, compared to 92% of dairy farms and 100% of vegetable and pig farms. Frequent (at least once a week) access of livestock to open water occurred on 9% of the poultry farms, 15% of the dairy farms and 0% on pig farms and could cause local eutrophication or water contamination.
3.5. Energy and Climate
The energy and climate theme covers four subthemes (
Table 7). No difference between sectors was found for the theme energy and climate, while a difference was found for the subthemes energy intensity of agricultural production and greenhouse gas balance (
Table 7).
The score on energy management is based on points for energy saving measures applied on the farm and monitoring of energy consumption. Energy consumption was monitored on all farms. The type and number of energy saving measures, however, varied strongly between farms.
Energy intensity of agricultural production is a comparison of the farm’s energy consumption with the regional average. The energy consumption of the farm (in MJ per ha) is a sum of all energy carriers multiplied with the energy density in MJ given in the master data and is corrected for imported or exported contract machinery work. Farm energy consumption of 25% or less of the regional average results in a score of 100; a consumption of 175% or more results in a score of zero points. The Danish reference value was 11,000 MJ per hectare. The score of vegetable farms was lower compared to dairy farms and pig farms. In addition, poultry farms scored lower compared to dairy farms (
Table 7).
The subtheme share of sustainable energy carriers determines the share of energy from renewable sources in comparison to the total energy consumption of the farm (in MJ). On average, 25% of the energy consumption on the farms was renewable. Although 44% of the electricity in Denmark is from renewable sources, non-renewable energy from diesel and gas represented a large share of the energy used on farms.
The greenhouse gas balance is calculated per hectare and includes emissions from livestock, fuel and fertilizer use (i.e., energy consumed, imported and exported machine work, N mineralization), carbon sequestration and afforestation and forest clearing. Greenhouse gas emissions were higher for dairy farms compared to pig and poultry farms, as a result of higher livestock related emissions in dairy farms (
Table 7).
3.6. Biodiversity
The theme biodiversity consists of five subthemes (
Table 8). No difference between sectors was found for score on theme-level, while for the subthemes intensity of agricultural production and diversity of agricultural production, differences were found (
Table 8).
Plant protection management aggregates points for implemented biodiversity conservation practices and the degree of toxicity and persistency of plant protection products used. Crop rotation and selection of varieties based on resistance to pests were implemented on all farms. Of the farms, 73% participated in biodiversity programs. Plant protection products permitted in organic agriculture were used by 5% of the farmers.
Ecological priority areas is the share of land (including agricultural area, forest, courtyard, open water, unused land) with a high ecological quality. The share on-farm is compared to the regional target for the share of ecologically-protected areas (9% in Denmark). The median share of land with ecological quality was 10%, with a range from 2%–62%.
Intensity of agricultural production aggregates the calculated intensity of nitrogen fertilization, livestock density and intensity of plant protection products and points for biodiversity promoting measures applied on the farm. Dairy farms scored higher compared to pig and poultry farms, which is related to the number and type of biodiversity-promoting measures implemented and a higher livestock density in LU/ha in pig and poultry farms (
Table 2 and
Table 8).
The score on landscape quality is based on points allocated to the development of ecological elements that structure the landscape and the share of agriculture areas in the vicinity of ecological landscape elements (i.e., within a buffer of 50 m around all ecologically-valuable habits, e.g., trees bushes, hedges, stone heaps and ecological priority areas). The farms’ median share of areas in the vicinity of ecological landscape elements was 37% with a range of 10%–100%; the regional target was 100%.
In the subtheme diversity of agricultural production, a farm receives points for diversity in land use types, crop species and varieties in cultivation, old and endangered crop species, livestock breeds, old and endangered breeds and bee keeping. Vegetable farms scored higher compared to all other sectors. In addition, pig farms have a higher score compared to poultry farms. Old and endangered crop species were grown on 19% of the farms of which 57% was on vegetable farms. On 57% of the farms, bees were kept. For livestock farms, the presence of old and endangered livestock breeds is considered. As old and endangered livestock breeds were absent on 97% of the farms, the score of these livestock farms is lower.
3.7. Working Conditions
The theme working conditions covers four subthemes (
Table 9). No differences were found in the scores between sectors for the theme working conditions or for the four subthemes (
Table 9).
In the subtheme personnel management, fifteen aspects are evaluated by all interviewees (farmer and farm workers). Based on their answers, points are allocated to reflect the farm performance on aspects such as housing of employees, education of apprentices, working contracts, assurance of replacement of work forces, illness benefit, equality and forced labor. In the aggregation, the minimum scores on three aspects (equality (gender), equality (other e.g., age, religion or origin) and forced labor are taken, while for the other aspects, the average score is used. All farm workers interviewed had a work permit; 97% participated in ongoing training; and on 38% of the farms apprentices were trained.
In the subtheme working times, the working time (i.e., hours, days, holidays) of employees and self-employed farm workers are compared to regional reference values. In addition, compensation of overtime is considered. Scores on working time for employees were 93 (39–100), whereas for family members, this was 34 (1–97). A cause for the lower score for family members is a higher number of working hours and working days per week for family workers.
Safety at work covers farm-related incidents (i.e., accidents and illnesses), implementation of a safety strategy, safety of pesticide use and veterinary treatments and child welfare. On 73% of the farms, no occupational accidents or illnesses occurred in the last five years, and 67% had implemented a professional safety strategy.
The subtheme salaries and income level determines the salaries and income level of employees and self-employed workers. It calculates the attractiveness of the hourly wage paid to employees and family members compared to minimum hourly wage. An attractive income in Denmark is set at double the minimum wage. Based on this regional target, an attractive hourly wage for both employees and family members was reached on 8% of the farms.
3.8. Quality of Life
Scores for the theme quality of life are derived from five subthemes. The farmer or farm-worker can define an additional sixth subtheme if he/she considers it important for his/her quality of life. In total, 15 of the 37 assessments included a score on this sixth subtheme further aspects of life. For the other assessments, the score was based on the five subthemes given in
Table 10. No difference between sectors was found for the theme quality of life, while for the subtheme occupation and education, a difference was found (
Table 10). The voluntary evaluation of the theme quality of life is based on one or more farm workers. The procedure for the assessment of each subtheme is the same; the interviewee is asked to rate the importance (i.e., weight) and his or her satisfaction on aspects related to the subtheme. The importance and satisfaction are both evaluated on a five-level Likert scale. The procedure for each subtheme is similar; therefore, we do not discuss all subthemes in detail, except for the one in which differences were found.
The subtheme occupation and education covers the importance and satisfaction on occupation, education and ongoing training. Scores were lower for vegetable farms compared to dairy and poultry farms. Vegetable farmers were less satisfied with regard to their ongoing training.
3.9. Economic Viability
The theme economic viability covers six subthemes (
Table 11). No difference was found between sectors for the theme; however, a difference was found between sectors for four out of six subthemes (
Table 11). As not all farmers were able or willing to share their economic results, assessment results of 32 farms were included (
Table 11).
The score on the subtheme liquidity reserve is calculated by comparing the liquid assets to the total farm expenditure (including private expenditure) and is the average of the examined financial year. The liquidity reserve that can be used to meet financial obligations is expressed in weeks and compared to regional reference values. In Denmark, a minimum liquidity reserve is 15 weeks (33 points); optimal is 25 weeks (66 points); and ideal is 40 weeks (100 points). The liquidity reserve was lower for pig farms compared to vegetables, dairy and poultry farms (
Table 11). This could be related to the generally lower economic results for pig farms in 2013 [
42].
In the subtheme level of indebtedness, the total borrowed capital (short and long debts) and liquid assets are compared to the operational cash flow to determine the number of years required to pay off debts with the current cash flow. The Danish reference values consider a low level of indebtedness of 10 years (66 points); medium is 20 years (33 points); and a high level is 50 years (zero points). Dairy farms had a higher level of indebtedness (median 16 years) resulting in a lower score compared to vegetable farms (median one year).
Economic vulnerability evaluates the vulnerability of each revenue source (i.e., secondary activities, direct payments and operation branches) based on the farmers’ perception of market trends, infrastructure condition and income security. In addition, the main income source (percentage of total business value) is determined to evaluate the concentration risk. Pig farmers evaluated the market trends, infrastructure condition and income security less positive, resulting in lower scores on economic vulnerability compared to vegetable, dairy and poultry farms.
The subtheme livelihood security compares the private household expenditure to the household expenditure target (poverty threshold; basic household needs of a single person or family in Denmark (e.g., food, clothes, health, housing, transport costs)). An income sufficient to meet the basic needs (100%) is awarded 34 points. An attractive income of 200% or more than the basic needs is awarded 100 points. Based on these reference values, 13% of the farmers did not have an income sufficient to meet the basic needs, while 28% of the farmers had an attractive income.
The subtheme cash flow-turnover ratio evaluates the profitability of the farm. It compares the operational cash flow to the business turnover (i.e., farming income, secondary activities and success of financial investments). A cash flow-turnover ratio of 20% results in a score of 33 points, 35% in 66 points and 55% in 100 points. The scores were lower for dairy farms compared to vegetable, pig and poultry farms.
The debt service coverage ratio compares the debt service (interest and mandatory amortization) to the operational cash flow. If the short-term debt service exceeds the operational cash flow (110%) zero points are awarded; a medium debt service ratio of 85% results in 33 points; and a low ratio of 50% in 66 points. On 16% of the farms, the short-term debt service exceeded the operational cash flow.
3.10. Farm Management
The theme farm management includes five subthemes (
Table 12). No difference between sectors was found for the theme farm management, while for the subtheme planning instruments and documentation, a difference was found.
In the subtheme farm strategy and planning, a farmer receives points for having a farm strategy and formulated measures for improvements on economic, environmental and social aspects (
Box 1). Although the majority of farmers had a farmer strategy (65% yes, 32% “partly”), not all farmers defined short- or medium-term measures for improvements on economic (14% “no”), environmental (16% “no”) and social aspects (35% “no”).
In the subtheme supply and yield security, a farmer evaluates aspects that negatively affected the supply and yield in the last five years (i.e., shortages in energy, work force, water, nutrients or problems related to marketing, equipment or diseases and pests). The main problems that negatively affected yield and farm income were “diseases, pests, weeds or fungi” (8% “yes”, 27% “partly”) and “marketing” (8% “yes”, 19% “partly”).
The subtheme planning instruments and documentation evaluates the use of planning tools and documentation for personnel management and production. It covers documentation on farm performance, personnel management, livestock production, soil management, energy, water, as well as risk insurance and expert consultation. Scores were higher in pig farms compared to poultry farms and vegetable farms as a result of higher scores on personnel management and product (
Table 12).
Quality management evaluates the control of product quality, bookkeeping quality, work safety and waste management. Product quality and bookkeeping quality were fully and regularly controlled on all farms. Scores on the subthemes waste management and work safety were lower, as discussed in
Section 3.3 and
Section 3.7.
The score on the subtheme farm cooperation is based on the level of cooperation with other farmers on land use, machines, buildings, work force, collective purchase of inputs and sale of products. Cooperation was mainly focused on sales of products (78% “yes” and 19% “partly”), land use (54% “yes” and 27% “partly”) and machines (51% “Yes” and 30% “partly”) and least on buildings (49% “no”).
3.11. RISE Polygon
To summarize, the median scores on the theme level per sector are presented in the RISE 2.0 polygon (
Figure 2). The sustainability performance of vegetable, dairy and pig farms is positive (>67 points) for seven out of 10 themes and in poultry farms for eight themes. The performance on nutrients flows and energy and climate is critical (34–67 points) for all sectors, according to RISE. The performance of vegetable, dairy and pig farms is also critical for the theme economic viability. None of the sectors has problematic (<33) median scores at the theme level, while at the subtheme level, the scores of 6%–11% of the subthemes (dependent on the sector) can be considered problematic. The share of subthemes in the category critical ranges from 20%–31% and in the category positive 63%–70%. The sustainability performance on one theme (water use) and 33% of subthemes differed between sectors.
4. Discussion
We used RISE 2.0 to analyze the sustainability performance of organic farms in Denmark and to analyze differences in the performance between sectors. Participation of farms was based on a selection by processing companies and voluntary participation. Generalizations based on this not necessarily representative sample should be taken with care. Next to the sustainability performance of the farms, the results provided insight into the assessment approach of RISE. RISE facilitates the assessment of a wide variety of themes and subthemes and aggregates different types of data: points, quantitative farm data, regional and master data. By allocating points to possible answers, the tool facilitates qualitative data to be included in the assessment. This normalization process is needed to transform the data into units (e.g., 0–100) that can be integrated in the tool and aggregated with other indicators [
43,
44]. This procedure enables the assessment of issues that tend to be left out of sustainability assessments due to the challenge in assessing and quantifying such information [
45]. Transforming such qualitative data into scores, however, requires decisions on the number of answers and the allocation of points to each answer. In the example mentioned in
Box 1, the farmer has three possible answers: yes, partly or no, with 100, 50 and 0 points, respectively. This has an influence on the possible score a farmer can obtain. Moreover, for an auditor, it can be challenging to decide when an answer corresponds to, for example, yes or partly [
2]. In RISE, 37% of the subthemes are exclusively based on points, and an additional 41% of subthemes use points in addition to other data types. In the interpretation and communication of the results, the role of decisions made in the development of a tool, such as the number of possible answers and allocated points, needs to be acknowledged [
46].
The analysis of the assessment results showed differences in the sustainability performance between sectors on subthemes, such as N and P self-sufficiency, ammonia emissions, greenhouse gas emissions, energy intensity and diversity of agricultural production related to differences in farming systems (e.g., presence/absence of livestock). This raises the question of whether the use of a generic approach, without sector-specific comparisons, is valid. A sector-specific comparison would, however, disable a comparison between the performances of sectors. Differences in the performance on the subthemes water management, occupation and education and planning instruments and documentation could not be explained and might be related to the selection of farms and/or auditors involved in the assessment. Due to the relatively high number of auditors involved in this study, their role could not be assessed. Experiences with other tools, however, indicate that the auditor plays a role in the assessment result [
2,
47].
Next to decisions related to the point-based data and the assessment approach, also decisions made in the selection of indicators, reference values, weights and aggregation methods have an impact on the assessment results. In the selection of reference values, for example, we used Danish reference values that were not specific for organic farming. This had an impact on the scores because of the generally lower productivity in organic farming, as shown by results on crop productivity [
11,
14]. Whereas the comparison of farm productivity to regional reference values makes the tool more context specific, it also increases the dependency on the quality of regional reference values and reduces the possibility to compare the performance between regions [
48].
To summarize the datasets and clarify the assessment results, different aggregation functions are used in sustainability assessment tools [
49]. In RISE, the score at the theme level is determined by the average score (arithmetic mean) of the subthemes; as a result, all subthemes become equally important. Although this aggregation allows a quick overview of the sustainability performance, it can result in the compensation of poor scores. For example, in the subtheme crop productivity, the median scores of all sectors are considered as critical, whereas the scores at the theme level (soil use) are positive. Without the consideration of the underlying data, the aggregated scores can lead to simplistic conclusions [
44]. At the subtheme level, this type of aggregation is used, as well; however, in several subthemes, a ‘risk-based approach’ is used, for example in the subtheme personnel management; instead of the average, the minimum score on indicators related to equality and forced labor is taken to reduce the compensation of poor scores.
To select indicators, different criteria can be used, such as sensitivity, precision, affordability and time demand [
46,
50]. How these criteria are prioritized is dependent on the context and perspectives of those involved in developing the tool [
46]. A recent study showed that even amongst sustainability experts, a lack of consensus on what is most important in selecting sustainability indicators can be observed [
46]. Once indicators are selected, methods for data collection and calculation are defined. Again, these decisions, for example to express greenhouse gas emissions per hectare instead of per kg product, have an influence and can lead to different conclusions [
51]. In addition, the assessment of indicators related to, for example, the subthemes farm management, working conditions and quality of life, farm size is not taken into account, whereas this might play a role. This emphasizes the need for transparency and reflection on the role of decisions and value judgements in sustainability assessment tools and is important to be able to explain their implications for the assessment results [
46,
52,
53,
54].
As the concept of sustainable development is evolving, so are sustainability assessment tools. Some of the comments made in this paper may therefore already be addressed in new versions of the tool and reference values. For example, in the new version of RISE (RISE 3.0, available since 2016), direct input of data from other tools, such as greenhouse gas calculations, is enabled. This could allow more precise data to be entered and reduce time investments; yet, also here, transparency in how these data were calculated and what has been included and excluded is crucial.
Marchand, Debruyne, Triste, Gerrard, Padel and Lauwers [
7] identified a continuum from rapid to full sustainability assessments. Rapid sustainability assessment tools are, for example, self-evaluations of farmers based on their knowledge and can be characterized by a limited time investment, low costs, low complexity, high subjectivity, transparency and user-friendliness. Full sustainability assessments are expert-based assessments with high time investment and costs, high complexity and scientifically underpinned output accuracy, with lower transparency and user-friendliness. Given these characteristics, rapid sustainability assessment tools are particularly applicable to raise awareness and interest in sustainability among larger groups of farmers [
7]. Full sustainability assessment tools are more focused on monitoring and support farmers interested in sustainability and willing to invest time and money [
7]. RISE can be positioned in between these extremes and is confronted with the challenge of balancing in between the characteristics of a rapid and full sustainability assessment tool, for example by combining subjective and more scientifically underpinned data, and combining precise and accurate measurements with user-friendliness and transparency. Similarly, Marchand, Debruyne, Triste, Gerrard, Padel and Lauwers [
7] indicated that combining functions (i.e., learning and monitoring) in a sustainability assessment tool can cause tensions.
In a recent study comparing different sustainability assessment tools, RISE was considered by farmers as a relevant tool to gain insight into their sustainability performance [
2]. The use of a context-specific approach using regional reference values, the input of quantitative farm data and the user-friendliness were aspects contributing to the perceived relevance. Additional efforts, however, are needed to support farmers in translating the sustainability assessment results into sustainable development at the farm level [
2,
54]. Further research is needed to evaluate the implementation of the sustainability assessment results and to reflect on the contribution of RISE to the learning and monitoring of sustainability at the farm level.


 ,
, 


