Review

Urban Resilience: A Civil Engineering Perspective

1
Department of Structures for Engineering and Architecture, University of Naples Federico II, 80125 Naples, Italy
2
Department of Civil Engineering, Pegaso University, 80125 Naples, Italy
*
Author to whom correspondence should be addressed.
Sustainability 2017, 9(1), 103; https://0-doi-org.brum.beds.ac.uk/10.3390/su9010103
Submission received: 15 July 2016 / Revised: 16 December 2016 / Accepted: 5 January 2017 / Published: 12 January 2017

Abstract

:
The concept of resilience is used in multiple scientific contexts, being understood according to several different perspectives. Essentially, resilience identifies the capability to recover, absorb shocks, and restore equilibrium after a perturbation. Recently, resilience is triggering increasing interest in engineering contexts, referring to communities and urban networked systems, as the capability to recover from natural disasters. The approach to the engineering resilience dates back to the early 1980s, when Timmerman defined resilience as “the ability of human communities to withstand external shocks or perturbations to their infrastructure and to recover from such perturbations”. In this paper, a literature review of the existing methodologies to quantify urban resilience is presented according to a civil engineering perspective. Different approaches, for diverse applications, are examined and discussed. A particular focus is done on the studies from Cavallaro et al. and Bozza et al., approaching disaster resilience of urban environments to natural hazards according to the complex networks theory.

1. Introduction

The advent of the concept of resilience was derived from an increasing need for a response to new and more intense threats to modern societies. Particularly, increasing exposure and vulnerability of contemporary cities are pushing the civil engineering community to focus on natural hazard risks on an urban scale.
The definition of resilience is highly variable depending on the subject area, which it is applied to. Essentially, the general requisites that bring together the different literature definitions of resilience pertain to the capacity of a system to absorb, adapt and recover from an external stress, while limiting disruptions to its normal functioning [1]. Hence, depending on the subject area, different aspects contributing to resilience can be considered, i.e., infrastructure systems, safety management systems, organizational systems, social-ecological systems, economic systems and social systems. Table 1 shows the different definitions of resilience with reference to diverse systems.
These are all aspects, which emerge to be embedded in the modern definition of community resilience, merging engineering indicators with population wellness, quality of life, and pre- and post-disaster community functioning.
Despite the diverse definition in the scientific literature, a general definition can be identified for the concept of resilience. It is the capability of a system to face an external stress and bounce back to an equilibrium condition. In keeping with this, so far two main theories have been recognized: the resilience of ecosystems and the engineering resilience. According to the former, a system is resilient if it recovers from a shocking event and reconfigures in a new equilibrium condition. Conversely, according to the latter such equilibrium should be the same as before the event occurred for a system to be resilient.
In light of complex dynamics that rule contemporary real systems, these two definitions can be merged in the engineering resilience according to the ecosystem theory. Hence, resilience can be defined as the capability of a system to face an external stress and recover to an equilibrium condition that can be the same as the pre-event or a new one. In this context, a further difference can be recognized. In fact, when dealing with ecosystems it is noticed that their resilience is related to their response and their capability to adapt in the case of the occurrence of an adverse event, and to reconfigure the equilibrium. Conversely, engineering systems are managed by communities. Hence, their resilience can be recognized also in the pre-event phase, as the capability to prevent external stresses, to plan to mitigate their effects and to recover from them.
Recently, researchers paid great attention to the methodology that should be used to quantify resilience. Particularly, recent literature addresses the resilience quantification of networked systems subjected to natural hazards. Essentially, most of studies focus on the resilience quantification aimed at planning for mitigation, adaptation and recovery of a physical urban system. Nonetheless, diverse applications of the resilience concept can be used. In fact, resilience can be assessed in peacetime too. For instance, land use and urban development can be planned for resilience [2], as it can ensure higher urban efficiency, considering all the single components contributing to it. In keeping with this, transdisciplinary approaches to disaster resilience suggest to model the system studied, by considering its components. The importance of this approach emerged because of the intrinsic complexity of physical systems (cities, ecosystems, lifelines, etc.) and the multiplicity of aspects that contribute to resilience. The behaviour of such systems in fact is governed by the interactions and interrelations standing between their components. In this paper, frameworks proposed for the quantification of resilience of physical systems are analysed, according to a civil engineering perspective. Most authors quantify resilience as a function of the degradation suffered by the physical system investigated, when subjected to an external stress [3,4]. Conversely, in some cases disaster resilience is assessed as the probability of the system to contextually meet robustness and rapidity standards [5,6,7]. Furthermore, researchers also dealt with the chance to account for multiple events’ type [8,9], because of the high variability of hazard’s typologies, which can potentially occur.
Most recent approaches deal with the resilience of networked systems, enabling us to account for both single system’s components and their mutual interrelations [10,11,12,13,14,15]. Accordingly, disaster resilience can be quantified by using rigorous metrics of the complex networks theory [16]. As a result, assessing resilience implies encompassing variables and dynamics, which derive from the most disparate scales: from the single social actor, to the whole urban infrastructural system, and to the merger of the two, until the highest scale, as is the urban scale. Such an approach is fundamental in dealing with disaster resilience, because of the increasing urbanization and because of the need to share knowledge and best practices around resilience, both on the local and on the global scale. The proposed studies assess resilience, referring to the scale of the urban environment, namely the city, and being evaluated according to a multi-scale approach (from the single physical subsystem, to the mutual interrelations between such subsystems, to the whole city functioning).
Challenges arise from the deep analysis of such methodologies. These are mainly related to the tackling of multiple hazards being very tricky and to the issue of integrating modern approaches into traditional disaster management and decision-making processes.
The main goal of this paper is to review studies dealing with the resilience quantification of networked infrastructure systems, proposed in the literature.

2. Novel Understandings around Resilience Quantification

The increasing interest in resilience requires methodological frameworks to be developed to assess it. Measuring disaster resilience might help understanding and improving the capability of urban systems to withstand risks, and implement effective strategies to recover. To this end, different studies have been developed, which propose operational frameworks to quantify disaster resilience and other properties related to it.
In addition, disaster resilience is directly related to the management of urban environments that is to the field of civil engineering. In fact, urban systems are mainly constituted by physical subsystems, which are built and managed according to civil engineering concepts and methodologies. Figure 1 shows the correlation between resilience and civil engineering.
Civil engineering plays a crucial role in the recovery of a complex system, made of physical subsystems, as is an urban environment. Consequently, whether techniques and technologies used in civil engineering for the recovery of an urban system are effective, it is restored quickly and efficiently. Hence, the urban system is resilient.
Essentially, resilience is assessed according to two main approaches: qualitative and quantitative.
Paralleling this, methodologies in research literature can be divided in two categories: (a) the physical resilience approach; and (b) the social-economic resilience approach. In the approach to physical resilience, attention is focused on the physical systems’ performances, e.g., single buildings, urban lifelines, transportation systems. In this circumstance, resilience is measured as the capability of the physical systems to effectively function and to recover their functionality in the case of disruption. Mainly, these methods are developed and proposed within the engineering community [2,3,4,5,6,7,8,9,10,11,12,13,14,15,17,18,19,20,21]. Conversely, according to the approach to the social-economic resilience, attention is focused on social systems and resilience is measured as the capability of communities to recover a good life quality level. These methods are mainly proposed in social sciences community [22,23,24,25,26,27,28,29,30,31,32,33,34,35,36,37,38,39,40,41].
Furthermore, novel approaches have been recently proposed within the modern scientific debate. These are based on a novel understanding of real systems, as the merger between their main constituents, and by accounting for their mutual relationships. This is the case of the graph theory, which enables to model the systems investigated as complex networks. In this paper, the most cited studies focused on this approach are described; particularly, those that aimed at quantifying resilience according to the complex networks theory. Hence, the studies presented in Section 2.1 propose methodologies to quantify resilience of networked systems accounting for the capability of physical systems to recover from external stresses that is directly related to the effectiveness of techniques and technologies in civil engineering. Studies presented in Section 2.2 propose to quantify resilience by modelling physical systems as complex networks. In addition, they model the correlation between the human components and the physical components of urban environments. In this circumstance, resilience is assessed by considering a deep correlation between the social dynamics and the urban functioning.

2.1. Resilience Assessment According to the Graph Theory

In the field of civil engineering, the resilience assessment has been recently approached according to the graph theory. Accordingly, different components of a system can be accounted for, also considering their mutual interrelations. Diverse systems can be investigated with this approach. For instance, complex systems typically studied in civil engineering such as transportation networks, power grids and water distribution networks.
Leu et al. [42] proposed an approach for quantifying resilience in transportation networks, being modelled as graphs. Based on GPS data, they have modelled a network as composed of three interacting layers, representing the physical structure, the service functioning, and the cognitive properties that is the human dimension. Consequences and effects of network disruption are assessed through the graph theory, by performing degree, betweenness and clustering coefficient measures, which are typical of the complex networks approach. In this study, the need for integrating the metrics evaluated for the diverse layers and combining them in a unique resilience indicator, which is quite complicated, is highlighted.
The use of graph theory for quantifying resilience has also been proposed by other researchers.
Murray-Tuite [43] focused on the resilience of transportation networks too. She proposed multiple metrics, by measuring adaptability, mobility, safety, and recovery. In each of these dimensions, a large set of different metrics for each dimension is considered. In this circumstance, a major issue is related to the understanding of obtained results. In fact, resilience is defined by a multiplicity of indicators, whose integration and interpretation might be tricky.
Berche et al. [44] analysed the resilience of public transportations networks (PTN) under different attack scenarios. Authors mapped the PTN as graphs. Hence, they have used network connectivity metrics to define random attack scenarios, similarly to the work of Leu et al. [42]. By using the percolation theory basics, they provided graph indicators as proxies of PTN resilience. Hence, the resilience quantification is performed in an indirect fashion, by implementing robust mathematical models. In this circumstance, there is no need to integrate diverse metrics and resilience dimensions. On the other hand, resilience is a proxy for the mathematical feature of the graph, and no information about the vulnerability of the physical system are integrated. Consequently, the assessment of the urban resilience is not performed in view of civil engineering principles. On the one hand, this enables for additional aleatory variables to be not embedded in the methodology. On the other hand, it is very important to take into account the vulnerability of the single building and infrastructure, as it characterizes the probability of the disruption of the urban network.
Further attempts have been made to perform the resilience assessment according to a probability-based procedure, based on the aleatory uncertainty in the hazard’s variables for natural disasters. This is the case of Ouyang et al. [9] that analysed two typical complex network based models for power grid networks. A purely topological model (PTM) and a betweenness based model (BBM) are included, as well as a direct current power flow model (DCPFM). The main goal of the study was to simulate the vulnerability of power grids according to their topology and flow under degree, betweenness, maximum traffic and importance based intentional attacks.
They proposed an expected, time-dependent, annual resilience metric (Equation (1)) that measures the system’s preparedness and capacity to confront and recover from the occurrence of hazards of different types. The metric provides a performance curve that plotted in a two-axis graph defines with time an area that expresses the system’s resilience
A R = E [ 0 T P ( t ) d t 0 T T P ( t ) d t ] = E [ 0 T T P ( t ) d t n = 1 N ( T ) A I A n ( t n ) 0 T T P ( t ) d t ]
where E[*] is the expected resilience value; T is a 1-year time interval (T = 365 days); P(t) represents the actual performance curve, which is a stochastic process; TP(t) is the target performance curve, which can be both a stochastic process or a constant line (TP) and, in this case, leads to the simplification of the abovementioned relationship for AR assessment; n is the event occurrence number, including event co-occurrences of different hazard types; N(T) is the number of the total event occurrences in T; tn the occurrence time of the nth event, which is a random variable; and AIAn(tn) is the impact area, that is the area between the real performance curve and the targeted performance curve, for the nth event occurrence at time tn. AIAn(tn) can be diversely computed depending on the need to account for single or multiple joint hazard’s types occurrence.
The probabilistic approach proposed couples four different model’s typologies taking into account: the hurricane hazard, the components’ fragility, the power system performance, and the system restoration. Ouyang and Dueñas-Osorio [9] outlined the chance to recognize three different stages within a typical response cycle of a networked system, which respectively reflects resistant, absorptive and restorative capacities of the system: the disaster prevention ( 0 t t 0 ) , the damage propagation stage ( t 0 t t 1 ) , and the assessment and recovery stage ( t 1 t t E ) . Several diverse response cycles may take place over an interval period [0, T]. The system behaviour is investigated in a two-dimensional space P-T, where P is the performance level and T the time, hence two time-dependent curves are recognized. PT(t), that is the target performance curve (typically constant), and PR(t), that is the real performance curve, describing changes under disruptive events and efforts towards the system recovery.
The metric developed to quantify resilience is shown in Equation (2), as the ratio of the areas between PT(t) and the time axis, and PR(t) and the time axis within the time interval [0, T]
R ( T ) = 0 T P R ( t ) d t 0 T P T ( t ) d t
being defined in the range [0, 1].
According to Ouyang and Dueñas-Osorio [9], such metric is conceptually similar to others, in terms of its functional form. It is based on the stochastic modelling of a hazard occurrence-restoration actions-recovery iterative process. However, it differs from other metrics in that it introduces the quantification of a system’s resilience under multiple hazards. To take this point further, a very important difference lies in the time interval that the relationship refers to. In fact, the integration of the performance level refers to the interval [0, T], as shown in Figure 2, while other authors integrate in [t0, tE].
As a result, the proposed metric enables us to have an overview of the entire life cycle of a system. In fact, to effectively evaluate the resilience level of a system the pre-event condition has to be known too. In the case of the occurrence of an adverse event, a system can reconfigure in several different configurations, and the measure of the “goodness” of such configurations is given by the comparison with the pre-event condition.
The method’s weaknesses are that it focuses only on the technical dimension of resilience and introduces the multiple hazards effects in a non-correlated manner.
A valuable application for the resilience quantification of networked urban facilities is also presented in the study of Mensah and Dueñas-Osorio [46]. They proposed a framework for quantifying resilience of electric grids and distributed wind generation to hurricane hazards, highlighting the dependence of societies’ economy on high quality electricity. The proposed framework is based on five models: (1) a hurricane demand model generating wind intensities, which are specific to each considered site; (2) component performance models, providing winds fragility; (3) a new Bayesian Network (BN)-based approach, enabling to evaluate the outage probability in the transmission system; (4) a system response model, to evaluate outages in 1 km2 blocks, recognized as distribution nodes; and (5) a restoration model, to simulate recovery processes based on resources mobilization and time allocations from historical data.
Influence network pre-processing strategy via DC power flow analyses, Minimum Spanning Trees (MSTs), and the Recursive Decomposition Algorithm (RDA) are integrated within the framework to reduce computational complexity and time. Distribution networks are modelled as minimum spanning trees (MSTs). According to the author, the framework can be used for exploring a wide range of what-if scenarios, also in large real systems.
Authors evaluated the resilience of networked systems with a particular focus on social issues. As a result, resilience is assessed with the same functional form proposed by Ouyang and Dueñas-Osorio [12], being particularized with reference to the fraction of customers served or not served by the electrical power systems, after a hurricane event occurrence.
Todini [47] considered instead urban water distribution systems and designed them as a series of interconnected closed and undirected loops, through which water flows are analysed. The problem is formulated as a vector optimization problem with cost and resilience as two objective functions. This produces a Pareto set of optimal solutions, as trade-offs between cost and resilience. In addition, the water supply is used to characterize the resilience of the looped network, representing its capability to overcome sudden failures. This heuristic design approach begins with a target value of the resilience index, and then identifies the pipe diameters for each node–to–node connection.
The work of Bruneau and the MCEER research group [6] is one of the most popular in the research literature. They have developed a conceptual framework, which defines and quantifies seismic resilience of communities. Accordingly, resilience is characterized by four main properties: robustness, rapidity, redundancy, and resourcefulness (4 R’s), to be managed and computed as proxies for it. Along with this, resilience is also conceptualized according to four interrelated dimensions (TOSE): technical, describing system functioning under earthquake hazards; organizational, describing response; social, the reduction capacity of social impacts because of the loss of critical services; and economic, representing the reduction capacity of direct and indirect economic losses.
Bruneau et al. moved from a qualitative to a quantitative and comprehensive conceptualization of resilience, by integrating TOSE dimensions through the concept of “resilience triangle”. In keeping with this, a unified framework is developed based on three complementary and quantifiable factors within systems’ resilience: reduction of the failure probability, reduction of the cascade effects of failure and reduction of time to recover [3].
According to this approach, resilience is computed as the ability to cope with the degradation of the system’s performance over time, Q(t), being evaluated as (Equation (3)):
Q ( t ) = Q ( Q Q 0 ) e b t
where Q represents the capacity of the structural system when it is fully functioning; Q 0 represents the post-event capacity; b is an empirically derived parameter that represents the rapidity of the recovery process; and t is the post-event time (in days). Usually, Q(t) is normalized by Q . The upper bound and the lower bound of the interval, which Q(t) is defined in, enable us to recognize limit cases. Q(t) = 1 indicates a fully operational system and Q(t) = 0 an inoperative one. Values in-between these two, represent varying degrees of system operability.
Finally, resilience can be quantified through the integration of the area under the curve Q(t) [19], divided by the time to restore the pre-event performance [3,4], as shown in Equation (4):
R = t 0 t 1 [ 100 Q ( t ) ] d t
where t0 and t1 are the endpoints of the time interval considered.
The illustrated framework has not been developed to be applied to networked systems. It is a performance-based approach that enables to quantify resilience, according to the main properties affecting it. Nonetheless, this approach is used in many studies, having a good potential of applicability to different problem’s typologies.
This is the case of Dorbritz [48] that combines the approach of Bruneau et al. [3], with the network analysis suggested by Berche et al. [44] for quantifying resilience. Consequences of node removals in transportation networks are modelled according to a topological and operational perspective. Software is used to quantify such consequences, and to measure resilience, according to Cimellaro et al. [6], or by measuring values of the initial impact of disruption, the system performance and the time for recovery. Hence, these are associated to the four dimensions of resilience according to Bruneau et al. [3]. According to the author, based on the dynamic nature of the network, topological measures are not sufficient to characterize the disruption in networks. To take this point further, the transition to the four resilience dimensions is rather vague, because of the incompatibility between the two methods.
Paredes and Dueñas-Osorio [49] developed an integrated resilience-based modelling approach for assessing the seismic resilience of coupled networked lifeline systems. Herein capacity, fragility, and response actions, including those informed by engineering and community-based policies, are considered as inputs.
A time-dependent seismic resilience metric is used to perform the connectivity assessments of lifelines. Lifeline systems (e.g., power and water networks) are modelled as graphs G(N, A), with N being the set of all infrastructures nodes and A the set of arches linking all the infrastructures. In addition, sensitivity assessments of redundancy, robustness, and resourcefulness in the context of interdependent lifelines are performed, according to Bruneau et al. [6]. Short and long term management effects are analysed, to capture the relative time scale between time for restoration logistics and decision making.
Technical resilience is quantified according to Equation (4), even if, according to the authors, this is a metric which does not supply evidence about the ability of a system to recover. Based on this observation, a time-dependent resilience is introduced and examined [9].
Similar studies have been developed, which focus on the post-event behaviour of the system, to assess its resilience. In this circumstance, no attempts have been made to account for progress in the post-event recovery.
In keeping with this, Omer et al. [50] proposed a quantitative approach to define and measure resilience by using a network topology model. They defined the “base resiliency”, as the ratio of the value delivery of the network after a disruption, to the value delivery of the network before a disruption. The value delivery is defined as the amount of information to be carried through the network. Miller-Hooks et al. [51] quantified resilience as the maximum expected system throughput to enhance preparedness and recovery activities against potential system disturbances. Two stages are considered within the problem: the pre-disaster for preparedness and the post-disaster for recovery. Miller-Hooks et al. [51] recognized the method to be computationally unaffordable for real systems and being applicable only for small benchmark problems.
Davis [52] understood the resilience of a water system as its ability to provide post-earthquake services to other lifelines and emergency operations—such as hospitals, emergency operation centres, and evacuation centres. This is a novel approach to the infrastructure assessment and enables to take into account interrelations between critical infrastructures, which might be fundamental to achieve an efficient response of the urban system. He outlined that a water system resilience cannot be measured only by the service-time lost, but also by how it helps to improve the overall community resilience. Reed et al. [20] outlined a methodology to characterize the behaviour of networked infrastructures under hurricanes and earthquakes, and to assess resilience and interdependencies. Particularly, authors focused on the contribution of the power delivery systems to the post-event infrastructure recovery. Resilience measures are understood as the lifelines’ fragility and the quality of the studied system, as defined by the MCEER group in the work of Bruneau et al. [3].
While most of the works presented approached the resilience quantification by analysing a single system, although they claim the applicability of such methodologies to the city scale, this study considers an 11-system interdependent infrastructure (electric power delivery, telecommunication, transportation, building support, utilities, business, emergency services, financial systems, food supply, government, and health care). Reed et al. assessed the resilience of this networked lifeline with reference to the performance data obtained from the system.
In general, the system resilience Rs for a set of n total subsystems is appraised as a function of the individual Ri, as highlighted in Equation (5):
R S = g ( R 1 ,   ,   ,   R i ,   ,   ,   R n )
where g() is a function, to be determined, that combines the individual resilience values, reflecting for interdependencies between them.
Heaslip et al. [52] developed a methodology to assess and quantify resilience using Fuzzy Inference Systems (FIS). They introduced two main concepts: (a) the resilience cycle, which represents a system condition flow under a disruptive event; and (b) the system performance hierarchy, a structure that defines and ranks the performance levels according to the hierarchy schema introduced by Maslow in his theory for the hierarchy of human needs. The combination of these concepts in a Cartesian plane results in a time-dependent curve, representing the system’s performance level over the resilience cycle. The resilience metric is defined by developing a diagram of the variables’ hierarchy. Hence, FIS is introduced to quantify the variables described both in linguistic and numerical terms. Doing so permits the interdependent problem’s variables to be modelled and assessed without the need of much data. Problems might arise when trying to refine the assessment, by adding fuzzy rules, hence a greater number of variables, and consequently a higher computational burden.
Freckleton et al. [53] developed a framework similarly to Heaslip et al. [52], but they built the dependency diagram between the indicators describing a system’s critical attributes. These metrics are classified according to their area of interest: the individual, the community, the economic, and the recovery metric groups. This type of framework is also proposed by Bozza et al. [3] that integrated complex networks theory with social perspectives, to assess life quality indicators. In this study, fuzzy logic methodologies are proposed to integrate the indicators that refer to different aspects of resilience.

2.2. Resilience Assessment According to an Engineering and Human Centric Perspective

Besides the importance of assessing resilience of systems by considering interdependencies and connectivity features, recently a further attempt has been made to complete this information with a human centric perspective. In particular, recent studies focused on the response of the urban environment in light of the behaviour and the life quality level of its inhabitants. In fact, social actors represent the main drivers of urban dynamics, being “sensors” of the life quality level.
In this regard, the PEOPLES Resilience Framework [54] has been developed to integrate physical and social economic perspectives on resilience, linking different resilience dimensions and properties, as proposed by Bruneau et al. [3]. It is a holistic framework defining and measuring community disaster resilience on various scales. Seven dimensions characterizing the community functionality have been identified: Population and Demographics, Environmental/Ecosystem, Organized Governmental Services, Physical Infrastructure, Lifestyle and Community Competence, Economic Development, and Social-Cultural Capital. The Framework has been developed to provide the basis for the development of quantitative and qualitative models, enabling to measure the functionality and the resilience of communities to extreme events in any or a combination of the above-mentioned dimensions. Each dimension and the related indicators are represented in a GIS layer of the area investigated, being all terms a function of the location, r, and of time, t.
As a result, a global community resilience index is proposed, that is calculated according to Equation (6). Such index depends on the system’s total functionality Q T O T ( r , t ) , which combines all the community dimensions:
R = r L C ( t ) R ( r ) d r = r L C ( t ) T L C ( t ) Q T O T ( r , t ) / T L C d t d r
where Q T O T ( r , t ) is the global functionality, r L C is the selected geographic area, and T L C is the control time.
In analogy with the law of total probability, different functionalities are combined through Equation (7):
Q T O T = j = 1 n Q j i = 1 n j = 2 n Q i Q j + i = 1 n j = 2 n k = 3 n ( Q i Q j Q k ) + ( 1 ) n 1 i = 1 n j = 2 n k = 3 n j = 1 n ( Q i Q j Q k Q l Q n )
Furthermore, to account for diverse weights of the considered functionalities, the mathematical expectation is used as shown in Equation (8):
Q T O T = E { Q ( r , t ) } = i = 1 n p i ( r , t ) Q i ( r , t )
Major attempts in this field have been done by Cavallaro et al. [10] and Franchin and Cavalieri [14,15] to assess resilience of urban systems to seismic catastrophes. They considered the physical and the human components of an urban system and modelled social-physical graphs. Hence, to measure the performance of the studied urban system, they refer to Q(t), the efficiency of the network in the “social” nodes, aimed at measuring the capability of the physical system to serve its end-users. This understanding of civil infrastructure systems according to a human-centric perspective, enables to evaluate contextually the performance level of the physical infrastructures and its outcome on the peoples’ life quality level.
In particular, Franchin and Cavalieri [14,15] proposed a simulation framework for civil infrastructures, which is extended to the resilience assessment through a network-based resilience metric. The recovery process is also included within the evaluation process, to focus on community resilience related to the restoration of houses. The global model includes buildings, being modelled as a set of mutually connected infrastructural systems, and streets, which are modelled as networks, and are analysed in terms of their forms and flows.
The proposed model also includes a taxonomy of a subset of systems and their components, and the related fragility curves and functional data, selected from the SYNER-G project [55]. An Object-Oriented model (OO) is used to take into account interdependencies between the considered systems. Groups of objects are considered as classes and interrelations are represented graphically by class diagrams through the implementation of the Unified Modelling Language (UML). Such information are projected onto a set of “mutually exclusive and collectively exhaustive geocells using simple area ratio rules” [14].
The methodology is developed for a case study analysis, referring to an artificially drawn city, modelled by authors as an Object-Oriented one, as shown in Figure 3.
The city’s area is discretized in cells, and residential, commercial, industrial and green areas are also identified and computed to each cell. Furthermore, the seismicity of the area is accounted for by considering a discrete number of seismic zones. Figure 3 shows the Object-Oriented model proposed by authors. As a result, the synthetic city is described as composed of diverse interacting classes of objects. In particular, BDG represents the class of buildings; EPN, represents the electric power network; WSS, the water supply system, and RDN, the road network. The components of these subsystems are listed and their vulnerability and functional data are also included. In each layer, black dots represent the demand nodes and empty circles represent the sources. The final model is constituted by overlapped layers, whose interrelations are also identified.
Resilience is assessed following the approach of Asprone et al. [13], based on the notion of global efficiency of a hybrid social-physical network, according to Latora and Marchiori [16].
Resilience is computed, by using the fraction of the displaced population, Pd, which has been reallocated, Pr, as a measure of the progress in the recovery process, instead of considering time, to avoid economic and time-dependent considerations to be performed.
Analogously, Cavallaro et al. [10] and Bozza et al. [12] assessed, respectively, the seismic resilience of the real case study of the city of Acerra (Naples, Italy) and of synthetic city models with diverse sizes and shapes. In both the studies, cities are modelled as spatial networks, embedded in a two-dimensional space, whose typical metric is the Euclidean distance. A system of typical street patterns is created to model each urban geometry into a GIS environment.
Each investigated urban centre is modelled as a hybrid social-physical network (HSPN). HSPNs’ is a novel approach based on the complex network theory, which enables us to account for all the city components. To take this point further, interrelations between urban physical—buildings and infrastructures—and social components—citizens—can be characterised, to understand the city’s physiological behaviour with a human-centric perspective.
Essentially, the infrastructure and the social network are first individually modelled as graphs and then they are overlaid in the global network, the HSPN [10,12].
Particularly, in these studies, the infrastructure network is represented through the modelling of the street network. This is because of most of urban services being typically arranged along urban street patterns. Consequently, this simplification enables to study the interactions between the city inhabitants and the services, by simply modelling only two planar graphs. A complex network is, in fact, always represented by a graph Γ = (Ɲ, L), being constituted by a discrete set of nodes, Ɲ = {1, 2, …, n} and a discrete set of links L Ɲ U Ɲ.
In the case of the HSPN modelling, two sets of links and two sets of nodes are modelled to create the social and the physical network.
The former is given by the set of nodes representing the residential buildings, Ɲb, and the set of the door links, Lb, connecting each building to the street junction’s nodes. Meanwhile the latter is constituted by the set of nodes, Ɲs, which represent the street junctions, and the set of links, Ls, which represent the urban street patterns, where also the number and the length of links representing streets are taken into account.
Finally the city’s HSPN is obtained and denoted as G(ƝbsULbULs). A further simplification is done to take into consideration the vehicular and inhabitant’s flow that is assumed to be bidirectional in each street to bypass traffic modelling issues. As a result, the HSPN is defined as an undirected graph, implying for each arch linking the generic nodes i and j, the converse arch also exists.
The proposed approach enables to model any kind of city, provided the availability of information about the location, the number and the typology of buildings and streets. These data can be acquired from national databases and surveys.
Different case analyses are presented and seismic scenarios are run, also simulating the recovery process after the event occurrence.
The recovery process is simulated though n discrete stages. Each stage provides for a fraction 1/n of the displaced citizens to be progressively relocated. Paralleling this, also the street links, that were interrupted, are reactivated within the HSPN, provided that the buildings that caused their interruption are reconstructed.
In these studies, the global efficiency is evaluated as it is understood by Latora and Marchiori [16], by accounting for the distances between the nodes of the network feeding the city inhabitants and for the number of citizens living in each building.
Finally, resilience is evaluated with reference to diverse recovery strategies, focusing on multiple social aspects, such as: the connectivity between pair of citizens, between citizens and schools and between citizens and shops; being defined in [0, 1] (Equation (9)).
R = 0 C max y ( C ) d C C max c = 0 C max y ( C ) × C C max
being y(C) the recovery function that is defined as the normalised ratio between the global efficiency, as it is before the event occurrence and in the aftermath of it.
In keeping with this, two alternative approaches are proposed to evaluate resilience. In the former resilience is evaluated as independent on the initial state of damage of the HSPN, and in the latter resilience is evaluated as dependent on it. The main difference is related to the evaluation of the recovery function, as it is, respectively, totally or partially normalised with respect to the initial state of damage in the two cases.
The studies described in this section have the common feature of considering the human component as a fundamental part of a city functioning. All of them highlight the importance of considering the urban scale of resilience. In fact, resilience can be understood as the outcome of virtuous behaviours on diverse scales. From the single citizen, to the functioning of physical infrastructures (roads, power grid networks, water supply networks, etc.) that are managed by groups of citizens, to the whole urban network, that is the city.
As a result, on the one hand these methodologies enable to consider different aspects contributing to resilience, and to quantify it as a multidimensional parameter. On the other hand, when dealing with large urban centres it can be very tricky to collect all the information needed about the built environment. In example, nowadays there are several databases available on the Internet, collecting information about the spatial distribution of buildings, streets and infrastructures. Hence, in keeping with this, real networks can be easily modelled as graphs. Conversely, fragility models are needed to compute the vulnerability of the built environment according to the civil engineering, but they might not be available for all the infrastructure typologies and hazard’s typologies to be studied. In addition, the city inhabitants can be computed by using census data, but their behaviours are not always predictable. Hence, the integration of behavioural models is needed to truly account for the human component when modelling the urban environment.

3. Discussion

There are different studies in the research literature, which focus on the quantification of resilience to natural hazards. Many of these are focused on the development of multidisciplinary frameworks, integrating civil engineering and graph theory basics.
Table 2 presents a summary of the studies investigated in this paper, and shows the main features of each of them.
One of the main aspects to be considered is related to the time slot these studies refer to. Most of the studies investigated refer to a period time, which goes from the event occurrence to the end of the recovery process. As a result, the real drop between the pre-event and the post-event system’s efficiency level is not taken into account. Paralleling this, efforts for the recovery are not considered, which is fundamental to an effective resilience assessment. Obviously, the higher is the efficiency drop suffered because of the event occurrence, the higher are efforts needed to recover. Consequently, whether these efforts are made, the overall resilience of the system is higher.
The work of Bruneau et al. [3] proposed a functional form for the resilience quantification that is used by many authors and can effectively assess the system’s performances in the case an extreme event occurs. This study does not consider the pre-event phase and does not propose a particular model of the physical system to be investigated. As a result, it can be used for investigating the performances of single physical components (in example a single building), being a very comprehensive approach, which embeds the diverse dimensions of resilience. Nonetheless, in this work it is highlighted the importance of approaching resilience on the urban scale, because of the need of considering complex dynamics, which are typical of cities. In keeping with this, the study of Bruneau et al. [3] does not enable to do this. Mutual relationships cannot be modelled using this framework; hence, the complexity of contemporary real world systems cannot be considered.
In this view, it is highlighted that when dealing with real systems it is very important to consider their complex structure and to assess resilience by accounting for the pre-event condition. Studies that enable achieving this [8,9,10,12,13,14,15,45,46,49,51] are suggested to be used when dealing with real systems. In fact, resilience is understood as the capability of a system to resist and to recover from an adverse event. Hence, such capability cannot effectively be assessed being unknown the pre-event condition of the system.
Analogously, monitoring progress of the recovery process is also fundamental to the resilience assessment.
In addition, although diverse recovery strategies can be undertaken after an extreme event occurrence, scenario analyses are needed to prove the feasibility of a resilience framework. This finding is strictly related to the definition of resilience, as it is given by most of authors in civil engineering. In fact, it is defined as the area under the performance curve of a system over the recovery. The higher or lower slope of such curve influences the final resilience of the system. Hence, it can be concluded that all the stages before and after an extreme event occurrence need to be considered when assessing resilience. In keeping with this, also all stages marking the system recovery, towards the achievement of the equilibrium, should be considered [10,12,14,15].
In particular, dealing with engineering systems requires several components and dynamics to be accounted for. In fact, most of the current practices related to the resilience assessment refer to the complex network theory. This approach enables to evaluate the behaviour of different systems (street networks, critical infrastructure networks, services, urban networks, etc.) by contextually accounting for their performances. For instance, studying electric power grids as complex networks can be done by accounting for their infrastructural vulnerability, network robustness and connectivity, by merging robust engineering and mathematical metrics. According to Ouyang and Dueñas-Osorio [9] this can be effectively done. The framework they proposed is a very versatile one. It enables to embed fragility functions, multiple hazards and complex networks metrics within the same model. Hence, it has the potential to be applied to diverse systems, enabling to assess unique, probability-based resilience indices. In contrast, such framework implies a heavy computational burden. Hence, it may be used in the pre-event phase, as a support tool for disaster manager to plan for mitigation. Conversely, when an extreme event occurs, a prompt response is needed and more rapid methodologies are needed.
In addition, frameworks that need a lesser number of information to be collected can be preferable [10,12,14,54]. This is because of the need to develop prompt solutions in the case of an extreme event occurrence, in light of the potential applicability of the examined frameworks, in ordinary disaster management processes.
Besides, many authors modelled engineering systems as planar graphs and assessed them only according to robust mathematical models [42,44]. Hence, the assessment of the generic network’s robustness and connectivity is valuable from a strictly mathematical point of view. Conversely, fragility models are usually not integrated. Hence, the potential disruption of the network’s components might not be performed according to their real structural vulnerability. In fact, dealing with the functioning of real systems, people and materials flows, and connectivity between them, are very important to be modelled, as these models enables to do. Nonetheless, it is also necessary to know in detail the vulnerability of the physical components of the network. This issue can be easily addressed by integrating civil engineering metrics [8,9,10,12,14,15,18,45,54].
A further attempt in this field is related to the integration of the human component in complex networks models. The stakeholders of engineering systems can have different perception of the systems’ functioning. According to this, some authors that have dealt with this aspect developed holistic frameworks, accounting for people’s life quality level [54]. Some of them employed fuzzy logic, to translate social indexes into numerical results, and to enable the comparison amongst them [11,53,56]. There are also authors, who developed methodologies that account for human behaviour by computing a certain number of citizens to each urban infrastructure, according to the spatial extent of the modelled systems [10,12,14]. Doing so permits to understand the people life quality as the capacity of the infrastructure networks to feed the urban stakeholders.
As a result, the approach of complex networks can help to effectively address the goal of modelling real world systems. Doing so permits to assess resilience on the urban scale, helping to manage underlying risks and complexities. In addition, it is underlined, that all the methodologies modelled the urban networks from a topological point of view. Hence, such approach can be valuable, but it cannot capture in detail the real dynamic nature of a city functioning [48]. Consequently, further attempts are needed in this field, to ensure for modelling and simulation to be more realistic.
To date, a unique framework embedding and addressing all the issues considered has not been developed yet. In fact, it is not possible to recognize a unique framework that can be employed to quantify resilience in any case. This is also because of the novelty of the concept of resilience and the huge quantity of its applications. There are some theoretical approaches, which effectively developed this kind of frameworks. However, still real and comprehensive applications have not been implemented.
Along with this, an issue is related to the importance of integrating these frameworks in traditional disaster management processes and to guarantee a shared understanding of disaster resilience. Some institutions are already embracing resilience assessment frameworks, such as the World Bank or the Rockefeller Foundation. Nonetheless, there is still a huge need for national and international governments to follow this approach and to foster knowledge around resilience.

Author Contributions

Anna Bozza, Domenico Asprone and Francesco Fabbrocino collected scientific articles on the topic of urban resilience. Francesco Fabbrocino filtered and studied the selected papers according to their approach to the quantification of resilience. Anna Bozza and Domenico Asprone studied and analyzed parallelisms and differences between the studies aimed at quantifying the resilience of networked systems. Anna Bozza wrote the paper.

Conflicts of Interest

The authors declare no conflict of interest.

References

  1. Timmerman, P. Vulnerability, Resilience and the Collapse of Society: A Review of Models and Possible Climatic Applications, Environmental Monograph N. 1; University of Toronto: Toronto, ON, Canada, 1981. [Google Scholar]
  2. Makana, L.O.; Jefferson, I.; Hunt, D.V.L.; Rogers, C.D.F. Assessment of the future resilience of sustainable urban sub-surface environments. Tunn. Undergr. Space Technol. 2016, 55, 21–31. [Google Scholar] [CrossRef]
  3. Bruneau, M.; Chang, S.; Eguchi, R.; Lee, G.; O’Rourke, T.; Reinhorn, A.; Shinozuka, M.; Tierney, K.; Wallace, W.; von Winterfeldt, D. A framework to quantitatively assess and enhance seismic resilience of communities. Earthq. Spectra 2003, 19, 733–752. [Google Scholar] [CrossRef]
  4. Bruneau, M.; Reinhorn, A. Overview of the resilience concept. In Proceedings of the 8th US National Conference on Earthquake Engineering, San Francisco, CA, USA, 18–22 April 2006; pp. 18–22. Available online: http://www.eng.buffalo.edu/~bruneau/8NCEE-Bruneau%20Reinhorn%20Resilience.pdf (accessed on 30 May 2016).
  5. Chang, S.E.; Shinozuka, M. Measuring improvements in the disaster resilience of communities. Earthq. Spectra 2004, 20, 739–755. [Google Scholar] [CrossRef]
  6. Cimellaro, G.P.; Reinhorn, A.M.; Bruneau, M. Framework for analytical quantification of disaster resilience. Eng. Struct. 2010, 32, 3639–3649. [Google Scholar] [CrossRef]
  7. Bocchini, P.; Frangopol, D.M. Resilience-driven disaster management of civil infrastructure. In Proceedings of the COMPDYN 2011: 5th Thematic Conference on Computational Methods in Structural Dynamics and Earthquake Engineering, Corfu, Greece, 26–28 May 2011; Available online: http://congress.cimne.com/eccomas/proceedings/compdyn2011/compdyn2011_full/473.pdf (accessed on 30 May 2016).
  8. Ouyang, M.; Dueñas-Osorio, L. Multi-dimensional hurricane resilience assessment of electric power systems. Struct. Saf. 2014, 48, 15–24. [Google Scholar] [CrossRef]
  9. Ouyang, M.; Dueñas-Osorio, L. Time-dependent resilience assessment and improvement of urban infrastructure systems. Chaos Interdiscip. J. Nonlinear Sci. 2012, 22. [Google Scholar] [CrossRef] [PubMed] [Green Version]
  10. Cavallaro, M.; Asprone, D.; Latora, V.; Manfredi, G.; Nicosia, V. Assessment of urban ecosystem resilience through hybrid social–physical complex networks. Comput.-Aided Civ. Infrastruct. Eng. 2014, 29, 608–625. [Google Scholar] [CrossRef]
  11. Bozza, A.; Asprone, D.; Manfredi, G. Developing an integrated framework to quantify resilience of urban systems against disasters. Nat. Hazards 2015, 78, 1729–1748. [Google Scholar] [CrossRef]
  12. Bozza, A.; Asprone, D.; Fiasconaro, A.; Latora, V.; Manfredi, G. Catastrophe resilience related to urban networks shape: Preliminary analysis. In Proceedings of the COMPDYN 2015: 5th ECCOMAS Thematic Conference on Computational Methods in Structural Dynamics and Earthquake Engineering, Crete, Greece, 25–27 May 2015; Available online: https://0-www-scopus-com.brum.beds.ac.uk/record/display.uri?eid=2-s2.0-84942288061&origin=inward&txGid=0# (accessed on 30 May 2016).
  13. Asprone, D.; Cavallaro, M.; Latora, V.; Manfredi, G.; Nicosia, V. Urban network resilience analysis in case of earthquakes. In Proceedings of the 11th International Conference on Structural Safety and Reliability, New York, NY, USA, 16–20 June 2013; Available online: https://www.iris.unina.it/handle/11588/581035#.V0xTVfmLSUk (accessed on 30 May 2016).
  14. Franchin, P.; Cavalieri, F. Probabilistic assessment of civil infrastructure resilience to earthquakes. Comput.-Aided Civ. Infrastruct. Eng. 2015, 30, 583–600. [Google Scholar] [CrossRef]
  15. Franchin, P. Cavalieri, F. Seismic vulnerability analysis of a complex interconnected civil infrastructure. In Handbook of Seismic Risk Analysis and Management of Civil Infrastructure Systems; Tesfamariam, S., Goda, K., Eds.; Woodhead Publishing Limited: Cambridge, UK, 2013; Available online: https://books.google.it/books?hl=it&lr=&id=xZVwAgAAQBAJ&oi=fnd&pg=PA465&dq=Seismic+vulnerability+analysis+of+a+complex+interconnected+civil+infrastructure&ots=2qV7bxHcyo&sig=ckpnvHXbtNWahUvh-E31swugyt4#v=onepage&q=Seismic%20vulnerability%20analysis%20of%20a%20complex%20interconnected%20civil%20infrastructure&f=false (accessed on 30 May 2016).
  16. Latora, V.; Marchiori, M. Efficient behavior of small-world networks. Phys. Rev. Lett. 2011. [Google Scholar] [CrossRef] [PubMed]
  17. Decò, A.; Bocchini, P.; Frangopol, D.M. A probabilistic approach for the prediction of seismic resilience of bridges. Earthq. Eng. Struct. Dyn. 2013, 42, 1469–1487. [Google Scholar] [CrossRef]
  18. Francis, R.; Bekera, B. A metric and frameworks for resilience analysis of engineered and infrastructure systems. Reliab. Eng. Syst. Saf. 2014, 121, 90–103. [Google Scholar] [CrossRef]
  19. O’Rourke, T.D. Critical infrastructure, interdependencies, and resilience. Bridge 2007, 37, 22–29. [Google Scholar]
  20. Reed, D.A.; Kapur, K.C.; Christie, R.D. Methodology for assessing the resilience of networked infrastructure. IEEE Syst. J. 2009, 3, 174–180. [Google Scholar] [CrossRef]
  21. Vugrin, E.D.; Warren, D.E.; Ehlen, M.A. A resilience assessment framework for infrastructure and economic systems: Quantitative and qualitative resilience analysis of petrochemical supply chains to a hurricane. Process Saf. Prog. 2011, 30, 280–290. [Google Scholar] [CrossRef]
  22. Vugrin, E.D.; Warren, D.E.; Ehlen, M.A.; Camphouse, R.C. A framework for assessing the resilience of infrastructure and economic systems. In Sustainable and Resilient Critical Infrastructure Systems; Springer: Berlin/Heidelberg, Germany, 2010; pp. 77–116. [Google Scholar]
  23. Adger, W.N. Social and ecological resilience: Are they related? Prog. Hum. Geogr. 2000, 24, 347–364. [Google Scholar] [CrossRef]
  24. Cardona, O.D.; Ordaz, M.G.; Marulanda, M.C.; Barbat, A.H. Estimation of probabilistic seismic losses and the public economic resilience—An approach for a macroeconomic impact evaluation. J. Earthq. Eng. 2008, 12, 60–70. [Google Scholar] [CrossRef]
  25. Chang, S.E.; Chamberlin, C. Assessing the Role of Lifeline Systems in Community Disaster Resilience. In Research Progress and Accomplishments 2003–2004; Multidisciplinary Center for Earthquake Engineering Research: Buffalo, NY, USA, 2004; pp. 87–94. [Google Scholar]
  26. Cutter, S.L.; Barnes, L.; Berry, M.; Burton, C.; Evans, E.; Tate, E.; Webb, J. A place-based model for understanding community resilience to natural disasters. Glob. Environ. Chang. 2008, 18, 598–606. [Google Scholar] [CrossRef]
  27. Attoh-Okine, N.O.; Cooper, A.T.; Mensah, S.A. Formulation of resilience index of urban infrastructure using belief functions. IEEE Syst. J. 2009, 3, 147–153. [Google Scholar] [CrossRef]
  28. Frazier, T.G.; Thompson, C.M.; Dezzani, R.J.; Butsick, D. Spatial and temporal quantification of resilience at the community scale. Appl. Geogr. 2013, 42, 95–107. [Google Scholar] [CrossRef]
  29. Gotangco, C.K.; See, J.; Dalupang, J.P.; Ortiz, M.; Porio, E.; Narisma, G.; Dator-Bercilla, J. Quantifying resilience to flooding among households and local government units using system dynamics: A case study in Metro Manila. J. Flood Risk Manag. 2015. [Google Scholar] [CrossRef]
  30. Henry, D.; Ramirez-Marquez, J.E. Generic metrics and quantitative approaches for system resilience as a function of time. Reliab. Eng. Syst. Saf. 2012, 99, 114–122. [Google Scholar] [CrossRef]
  31. Kimhi, S.; Shamai, M. Community resilience and the impact of stress: Adult response to Israel’s withdrawal from Lebanon. J. Commun. Psychol. 2004, 32, 439–451. [Google Scholar] [CrossRef]
  32. Li, Y.; Lence, B.J. Estimating resilience for water resources systems. Water Resour. Res. 2007, 43. [Google Scholar] [CrossRef]
  33. Miles, S.B. Foundations of community disaster resilience: Well-being, identity, services, and capitals. Environ. Hazards 2015, 14, 103–121. [Google Scholar] [CrossRef]
  34. Olick, K.J.; Robbins, J. Social Memory studies: From collective memory to the historical sociology of mnemonic practices. Annu. Rev. Soc. 1998, 24, 105–140. [Google Scholar] [CrossRef]
  35. Rose, A. Measuring Economic Resilience: Recent Advances and Future Priorities. 2015. Available online: http://opim.wharton.upenn.edu/risk/conference/pprs/Rose_Measuring-Economic-Resilience.pdf (accessed on 30 May 2016).
  36. Rose, A.; Krausmann, E. An economic framework for the development of a resilience index for business recovery. Int. J. Dis. Risk Reduct. 2013, 5, 73–83. [Google Scholar] [CrossRef]
  37. Rose, A.Z. Economic Resilience to Disasters. 2009. Available online: http://research.create.usc.edu/cgi/viewcontent.cgi?article=1015&context=published_papers (accessed on 30 May 2016).
  38. Rose, A. Economic resilience to natural and man-made disasters: Multidisciplinary origins and contextual dimensions. Environ. Hazards 2007, 7, 383–398. [Google Scholar] [CrossRef]
  39. Rose, A. Defining and measuring economic resilience to disasters. Dis. Prev. Manag. 2004, 13, 307–314. [Google Scholar] [CrossRef]
  40. Ruitenbeek, H.J. Distribution of ecological entitlements: Implications for economic security and population movement. Ecol. Econ. 1996, 17, 49–64. [Google Scholar] [CrossRef]
  41. Tyler, S.; Moench, M. A framework for urban climate resilience. Clim. Dev. 2012, 4, 311–326. [Google Scholar] [CrossRef]
  42. Leu, G.; Abbass, H.; Curtis, N. Resilience of Ground Transportation Networks: A Case Study on Melbourne. 2010. Available online: http://www.worldtransitresearch.info/cgi/viewcontent.cgi?article=5056&context=research (accessed on 30 May 2016).
  43. Murray-Tuite, P.M. A comparison of transportation network resilience under simulated system optimum and user equilibrium conditions. In Proceedings of the IEEE Winter Simulation Conference (WSC 06), Monterey, CA, USA, 3–6 December 2006; pp. 1398–1405.
  44. Berche, B.; Von Ferber, C.; Holovatch, T.; Holovatch, Y. Resilience of public transport networks against attacks. Eur. Phys. J. B 2009, 71, 125–137. [Google Scholar] [CrossRef]
  45. Ouyang, M.; Dueñas-Osorio, L.; Min, X. A three-stage resilience analysis framework for urban infrastructure systems. Struct. Saf. 2012, 36, 23–31. [Google Scholar] [CrossRef]
  46. Mensah, A.F.; Dueñas-Osorio, L. Efficient Resilience Assessment Framework for Electric Power Systems Affected by Hurricane Events. J. Struct. Eng. 2015, 142. [Google Scholar] [CrossRef]
  47. Todini, E. Looped water distribution networks design using a resilience index based heuristic approach. Urban Water 2000, 2, 115–122. [Google Scholar] [CrossRef]
  48. Dorbritz, R. Assessing the resilience of transportation systems in case of large-scale disastrous events. In Proceedings of the 8th International Conference on Environmental Engineering, Vilnius, Lithuania, 19–20 May 2011; pp. 1070–1076.
  49. Paredes, R.; Dueñas-Osorio, L. A time-dependent seismic resilience analysis approach for networked lifelines. In Proceedings of the 12th International Conference on Applications of Statistics and Probability in Civil Engineering (ICASP12), Vancouver, BC, Canada, 12–15 July 2015.
  50. Omer, M.; Nilchiani, R.; Mostashari, A. Measuring the resilience of the trans-oceanic telecommunication cable system. IEEE Syst. J. 2009, 3, 295–303. [Google Scholar] [CrossRef]
  51. Miller-Hooks, E.; Zhang, X.; Faturechi, R. Measuring and maximizing resilience of freight transportation networks. Comput. Oper. Res. 2012, 39, 1633–1643. [Google Scholar] [CrossRef]
  52. Davis, C.A. Water system service categories, post-earthquake interaction, and restoration strategies. Earthq. Spectra 2014, 30, 1487–1509. [Google Scholar] [CrossRef]
  53. Freckleton, D.; Heaslip, K.; Louisell, W.; Collura, J. Evaluation of resiliency of transportation networks after disasters. Transp. Res. Rec. J. Transp. Res. Board 2012, 2284, 109–116. [Google Scholar] [CrossRef]
  54. Renschler, C.S.; Frazier, A.E.; Arendt, L.A.; Cimellaro, G.P.; Reinhorn, A.M.; Bruneau, M. Developing the ‘PEOPLES’ resilience framework for defining and measuring disaster resilience at the community scale. In Proceedings of the 9th US National and 10th Canadian Conference on Earthquake Engineering (9USN/10CCEE), Toronto, ON, USA, 25–29 July 2010.
  55. Pitilakis, K.; Crowley, H.; Kaynia, A. SYNER-G: Typology definition and fragility functions for physical elements at seismic risk. Geotech. Geol. Earthq. Eng. 2014, 27, 111–356. [Google Scholar]
  56. Heaslip, K.; Louisell, W.; Collura, J.; Urena Serulle, N. A sketch level method for assessing transportation network resiliency to natural disasters and man-made events. In Proceedings of the Transportation Research Board 89th Annual Meeting (No. 10-3185), Washington, DC, USA, 10–14 January 2010.
Figure 1. Flowchart showing the underlying relationship between resilience and civil engineering.
Sustainability 09 00103 g001
Figure 2. Typical performance curve of an infrastructure system after the occurrence of a disruptive event [8,45].
Sustainability 09 00103 g002
Figure 3. Object-Oriented civil infrastructure model, according to Franchin and Cavalieri [14].
Sustainability 09 00103 g003
Table 1. Literature definitions of the resilience concept, according to the systems investigated.
System TypologyDefinition of Resilience
Complex and infrastructural systemsAbility to anticipate, to respond, to adapt, to recover, and to guarantee minimum level of service while undergoing changes.
Overcome negative consequences of a disaster, getting back to normal operations (original state or an adjusted state) as quickly as possible.
Safety management systemsAbility to anticipate, to circumvent threats, to resist preserving identity and goals, to absorb, to recover, to adapt to harmful events and to recover quickly.
Organizational systemsAbility to recognize unanticipated perturbations, to efficiently adjust, to prepare for future protection efforts, to reduce likely risks. Capacity to evaluate existing model of competence and improve, balance stability and flexibility, self-control.
Social-ecological systemsAbility to retain system identity (structure, interrelationships and functions), persistence to change maintaining a steady ecological state related to the functioning of the system, rather than the stability of its component populations, retain relationships between people or state variables.
Economic systemsAbility to recover, resourcefulness, ability to adapt, to withstand without losing the capacity to allocate resources efficiently.
Social systemsAbility to cope with stress, capability to maintain current function and structure degrade gracefully.
CommunitiesQuality of individuals, groups and organizations, and systems as a whole to respond productively to significant change, to cope with unanticipated dangers, learning to bounce back.
Ability to expeditiously design and implement positive adaptive behaviours, while enduring minimal stress, diminished productivity or quality of life and without a large amount of assistance from outside the community.
Robustness, Redundancy, Resourcefulness, and Rapidity.
Economic, Social and Environmental Sustainability of the phase of extreme event occurrence within the urban life cycle, for all the present and future actors, directly and indirectly involved in the recovery process.
Table 2. Summary of the literature review on the resilience quantification.
AuthorsSystem ModelResilience Metric
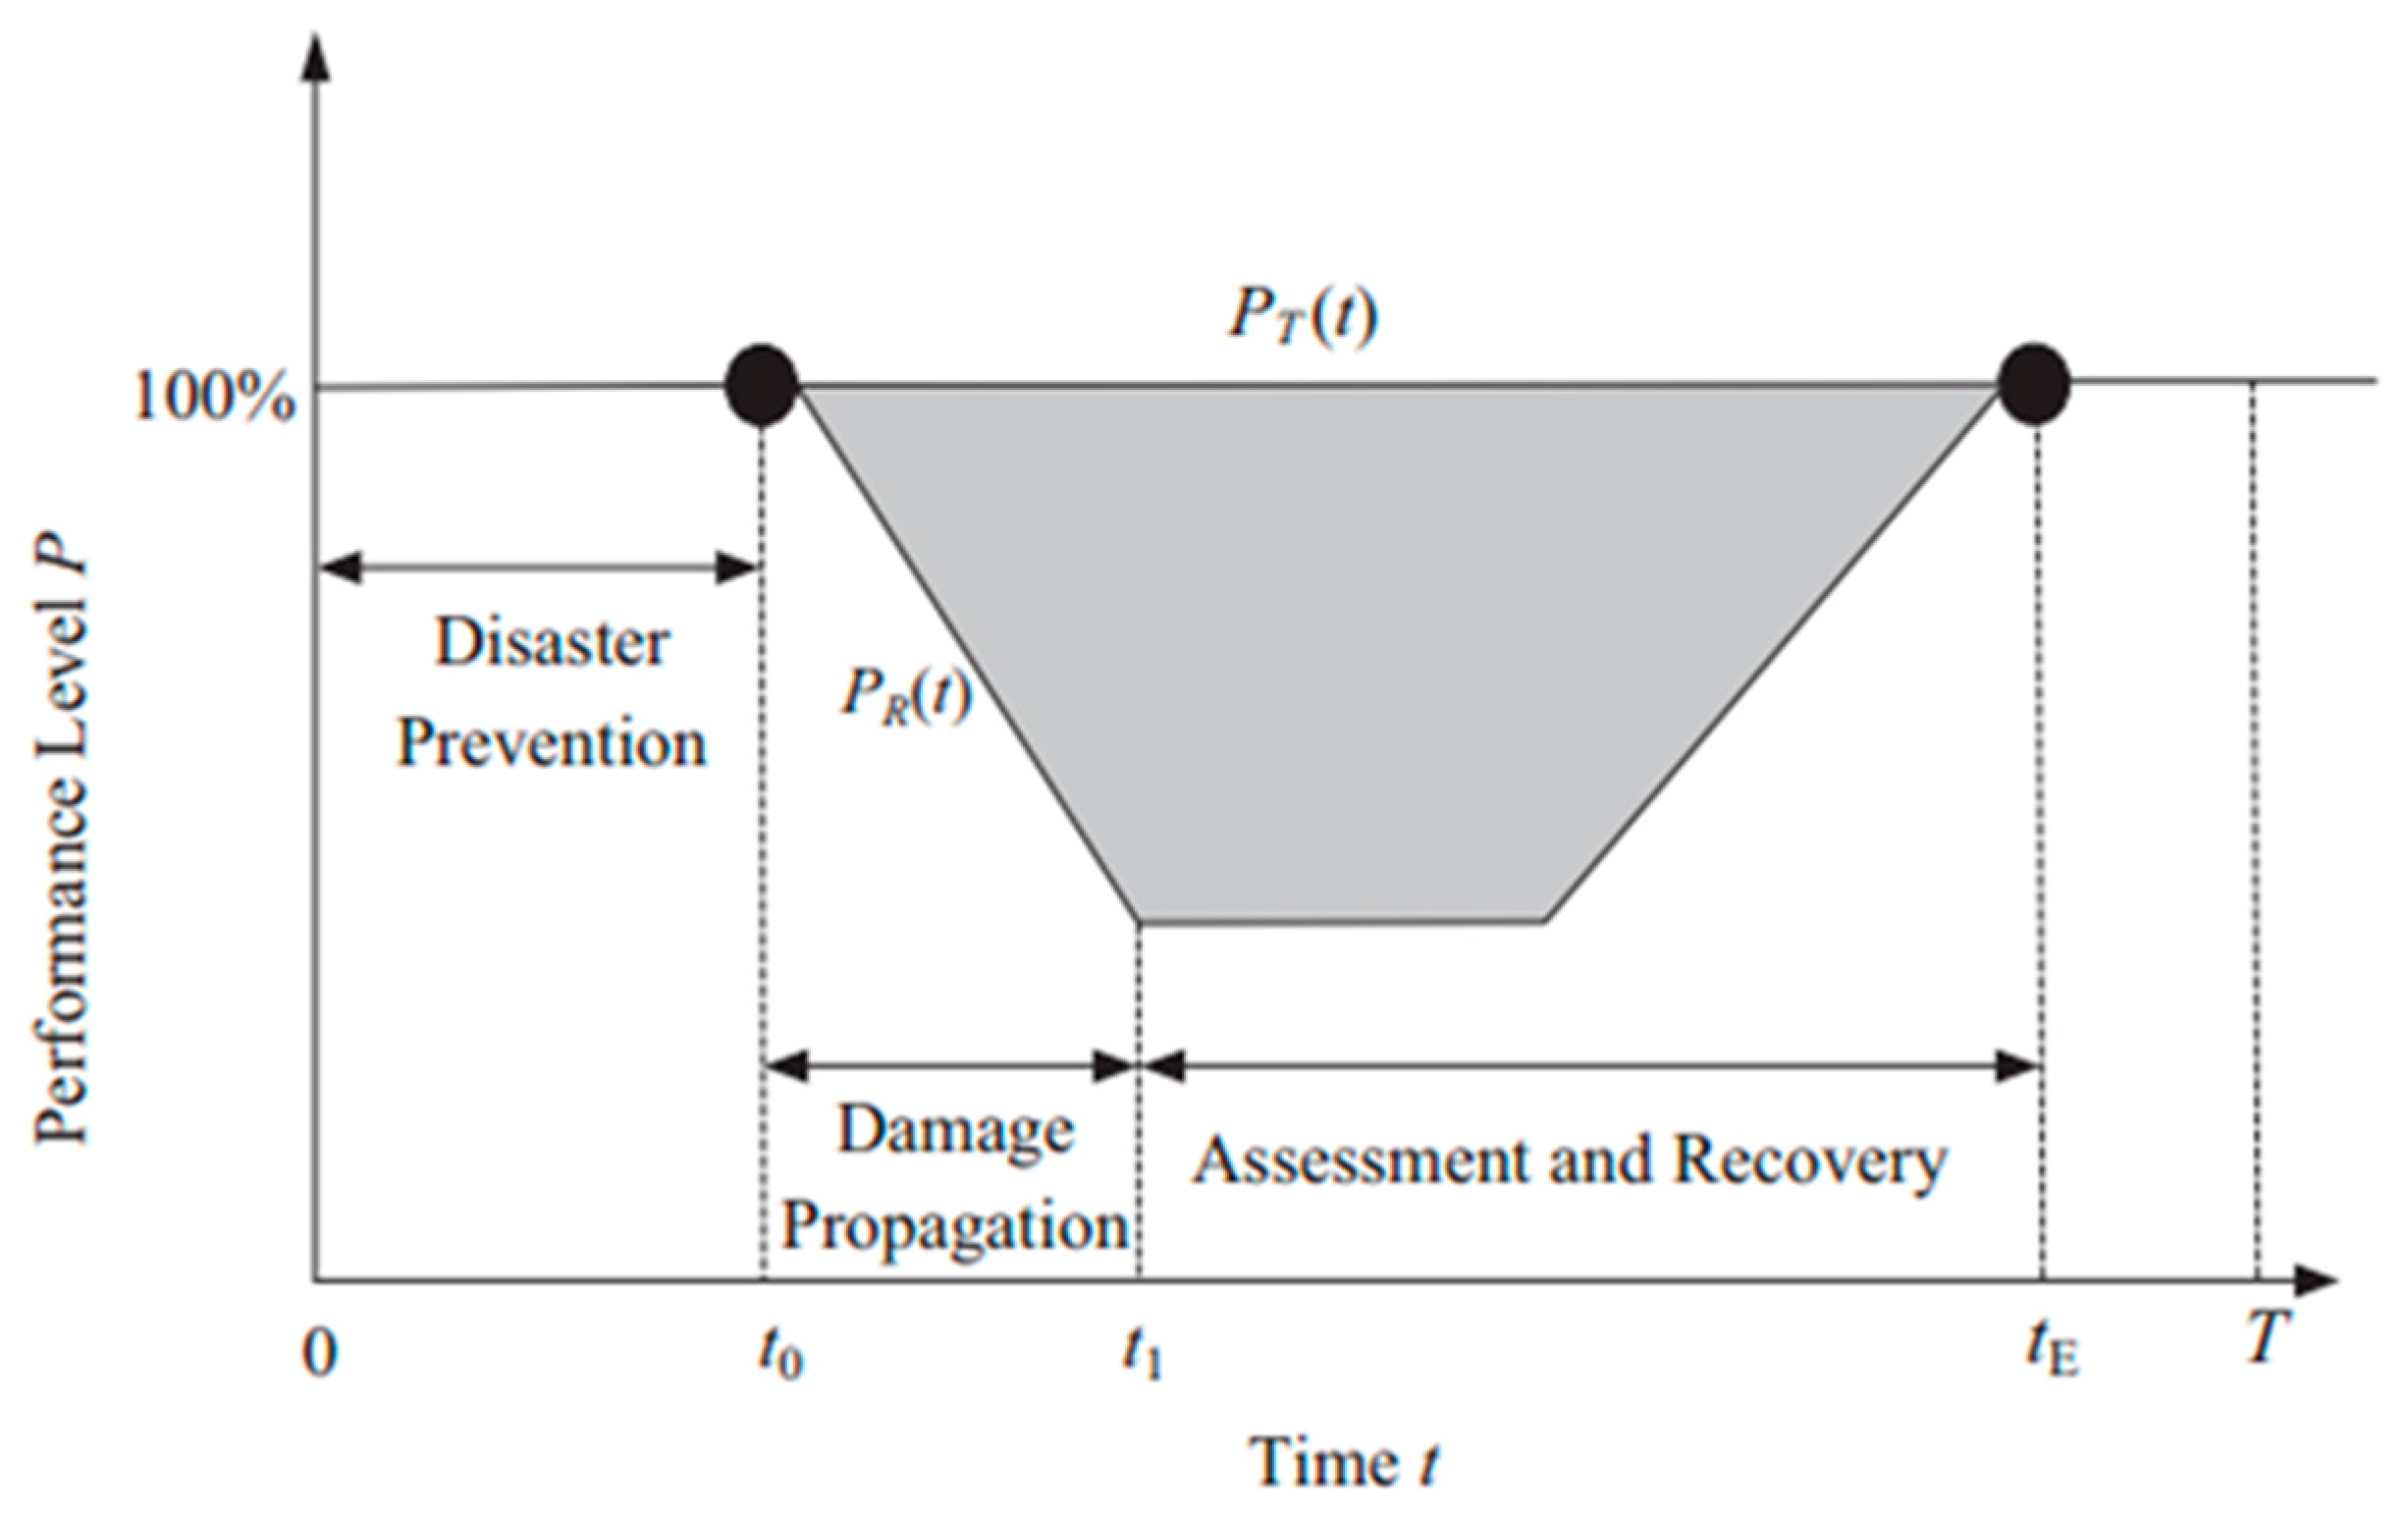
Bruneau et al., 2003 [3]
Bruneau and Reinhorn, 2006 [4]
Cimellaro et al., 2010 [6]
Bocchini and Frangopol, 2011 [7]
Dobritz, 2011 [48]
None—the performance curve of the system is studiedPerformance-based conceptual framework to quantify resilience as the degradation suffered by the system studied.
R = R (robustness, redundancy, resourcefulness, rapidity).
Davis, 2014 [52]None—the performance curve of the system is studiedTheoretical approach to resilience as related to communities through the identification of the water system service categories.
Reed et al., 2009 [20]Power delivery and telecommunication systems modelled as interdependent networked systemsResilience is quantified as the quality of the system studied [6].
Chang and Shinozuka, 2004 [5]Water system modelled as a networked systemResilience is quantified as the joint probability of meeting robustness and rapidity standards.
Ouyang and Dueñas-Osorio, 2014 [8]
Ouyang and Dueñas-Osorio, 2012 [9]
Electric power grids modelled through topological, betweenness and direct current power flow modelsTechnical resilience is computed as the time-dependent annual resilience metric through a probability-based framework accounting for multiple non-correlated events.
Paredes and Dueñas-Osorio, 2015 [49]Electric power grids and water system modelled as coupled networked lifelinesResilience is computed according to Ouyang and Dueñas-Osorio, 2012 [12].
Mensah and Dueñas-Osorio, 2015 [46]Electric power grids and distributed wind generation modelled as a Bayesian networkResilience is computed according to Ouyang and Dueñas-Osorio, 2012 [12], using Minimum Spanning Trees (MSTs) for distribution networks to reduce computational complexity.
Todini, 2000 [47]Water distributions networks modelled as closed loopsHeuristic approach to compute resilience as the water supply through a vector optimization problem.
Leu et al., 2012 [42]
Berche et al., 2009 [44]
Transportation networks modelled as complex networksResilience is computed as a function of the network connectivity metrics (betweenness, clustering, etc.).
Murray-Tuite, 2006 [43]Transportation networks modelled as graphsDiverse metrics are used to compute each dimension contributing to resilience (adaptability, safety, mobility and recovery).
Omer et al., 2009 [50]Telecommunication cable system modelled through a network topology modelResilience is assessed as a function of the system’s power flows.
Miller-Hooks, 2012 [51] Freight transportation network modelled as a graphResilience is computed as the expected system throughput through a two-stage stochastic program.
Heaslip et al., 2010 [56]
Freckleton et al., 2012 [53]
NoneA methodology is proposed to assess resilience through fuzzy inference systems using a hierarchy of the variables involved: the individual, the community, the economic, and the recovery metrics.
Renschler et al., 2010 [54]Social-physical systems modelled as interacting layersHolistic framework to quantify resilience as the system quality [6].
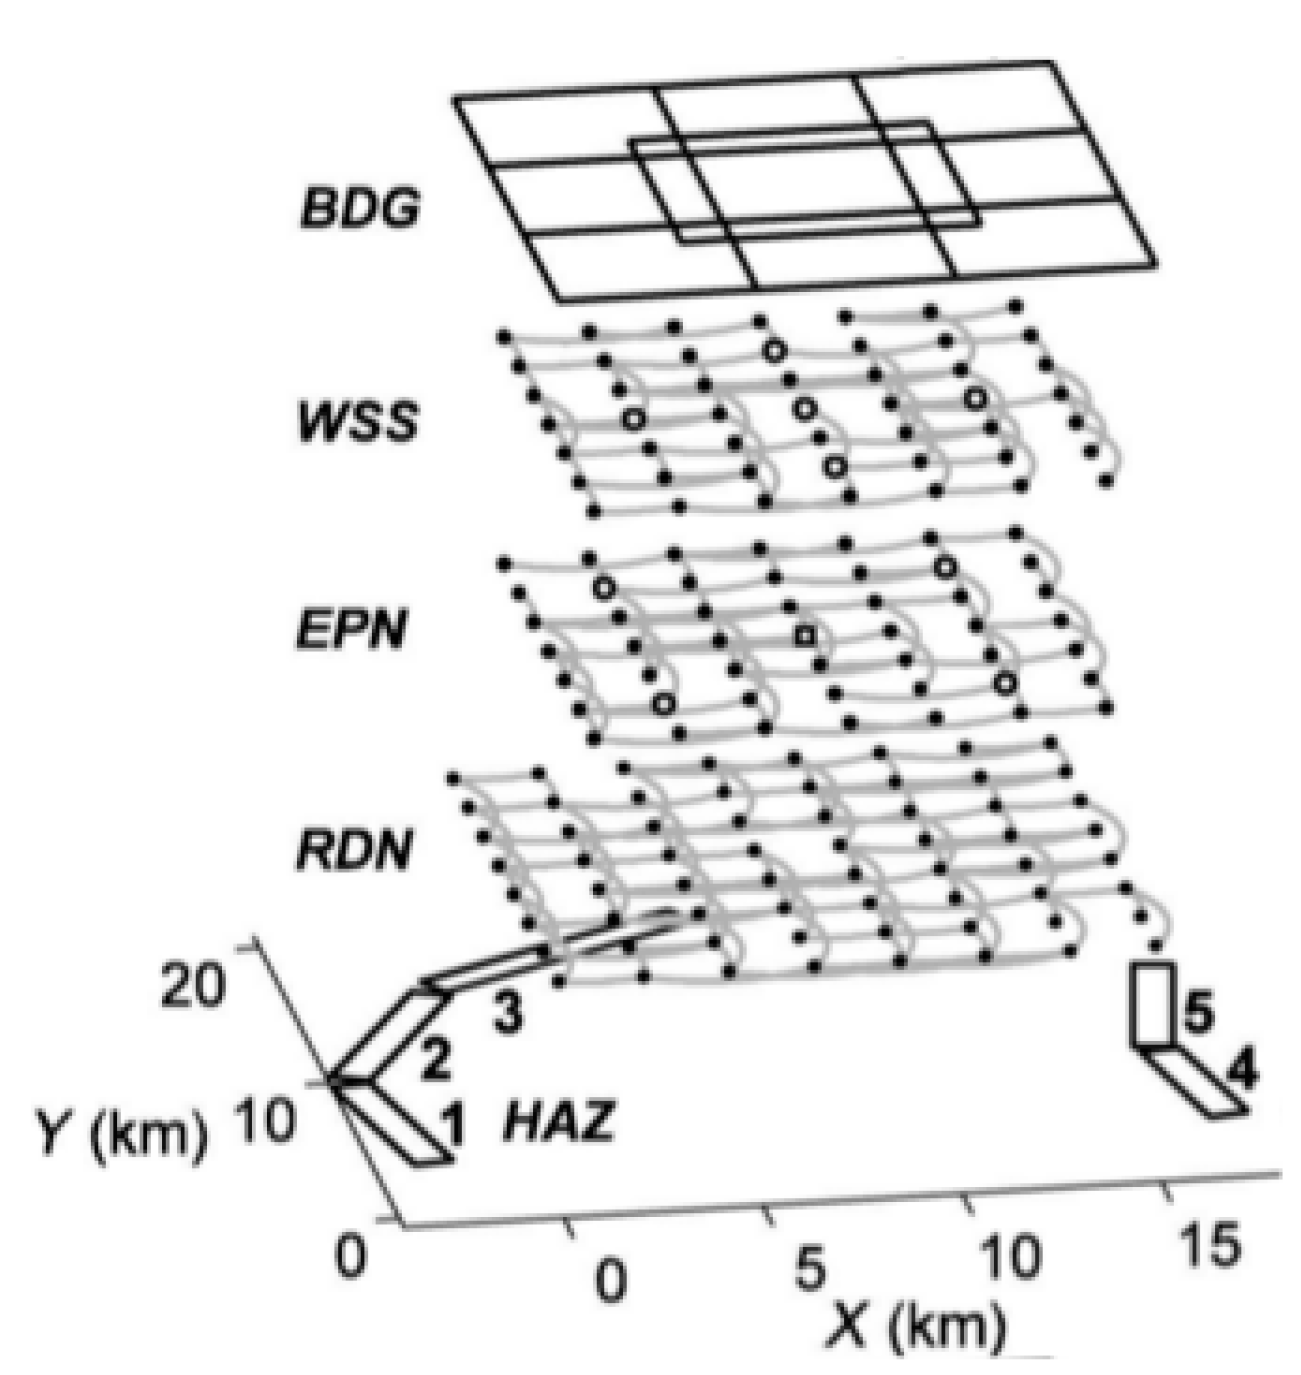
Cavallaro et al., 2014 [10]
Bozza et al., 2015 [12]
Asprone et al., 2013 [13]
Franchin and Cavalieri, 2013 [14]
Franchin and Cavalieri, 2015 [15]
Hybrid social-physical networks modelled as complex networksResilience is quantified as the variation in the global efficiency of the network, from the pre-event phase to the final recovery.

