Article

A Grey Water Footprint Assessment of Groundwater Chemical Pollution: Case Study in Salento (Southern Italy)

by
Pier Paolo Miglietta
1,
Pierluigi Toma
1,
Francesco Paolo Fanizzi
2,3,
Antonella De Donno
2,
Benedetta Coluccia
1,
Danilo Migoni
2,3,
Francesco Bagordo
2 and
Francesca Serio
2,*
1
Department of Economics and Management, University of Salento, Prov. le Lecce-Monteroni, 73100 Lecce, Italy
2
Department of Biological and Environmental Sciences and Technologies, University of Salento, Prov. le Lecce-Monteroni, 73100 Lecce, Italy
3
Consorzio Interuniversitario di Ricerca in Chimica dei Metalli nei Sistemi Biologici, via Celso Ulpiani 27, 70125 Bari, Italy
*
Author to whom correspondence should be addressed.
Sustainability 2017, 9(5), 799; https://0-doi-org.brum.beds.ac.uk/10.3390/su9050799
Submission received: 5 April 2017 / Revised: 3 May 2017 / Accepted: 9 May 2017 / Published: 11 May 2017

Abstract

:
The worsening of groundwater quality is a huge problem for some regions, especially where a karst aquifer system is the most important water resource because of the deficiency of a well-developed superficial water supply. In this study the chemical quality of a deep aquifer of the Salento peninsula (Southern Italy), where a shallow aquifer and an extensive deep aquifer are exploited as a source of drinking water and irrigation water, was monitored. The indicator used to assess the sustainability of pollution produce by human activities is the “grey water footprint” (GWF) which measures the amount of water required to assimilate a polluting load produced from anthropic activity. The GWF, calculated for each chemical parameter, shows a widespread contamination by Mercury (Hg), Vanadium (V) and Ammonium (NH4+) with concentrations above the limits (Lgs. D. 31/2001). The high Mercury and Vanadium concentrations may thus be associated with anthropic pressures on the aquifer, while Ammonium derives mainly from fertilizers used in agriculture. The situation that emerged involves reflections on the continuous human pressure on natural resources. Therefore, the management of groundwater quality requires a multidisciplinary approach focused on identifying the measures necessary to protect our water resources.

1. Introduction

Water is drawn from the ground for a variety of uses, principally community water supply, farming and industrial processes. Groundwater is widely used for drinking [1], as it is characterized by a high degree of chemical and microbiological purity, because of the slow filtration processes that occur in the various layers of the subsoil, in which contaminants are retained and/or degraded [2]. However, these mechanisms are sometimes not sufficient to ensure water safety, especially when pollutants can easily reach aquifer [3].
Groundwater resource management is often limited by the presence of brackish or saline water that endangers, irreversibly, the future of these resources [4]. Since groundwater often occurs in association with geological materials containing soluble minerals, higher concentrations of dissolved salts are normally expected in groundwater with respect to surface water. The type and concentration of salts depends on the geological environment and the source and movement of the water. Indeed, the potential contamination risk is specific to the geographical area, depending on the soil vulnerability and the amount and type of pollutants released into the environment by human activities [5]. Soil type, climate, specific nature of groundwater resources, the high intrinsic vulnerability of aquifers to anthropogenic pollution and the effects of seawater intrusion, make proper use and management complex and significant. The worsening of groundwater quality is a huge problem, especially for some regions, like Salento (a subarea of the Puglia region, southern Italy), where a karst aquifer system represents the most important water resource because of the deficiency of a well-developed superficial water supply.
The study area, the Salento peninsula, indeed, has geological characteristics quite distinct from those of other Italian regions [6]. The karstic nature of the soil results in a lack of superficial watercourses and a highly developed subterranean hydrology. This is characterized by the presence of two distinct systems: a multilevel shallow aquifer, occupying only 35% of the territory and an extensive deep aquifer, intensively exploited as a source of drinking [7] and irrigation water [8] consistently threatened by salt water intrusion. As recently described [9,10,11], groundwater quality in Salento has been continuously worsening due to excessive and uncontrolled pumping and to point and diffuse sources of pollution.
In this study, the indicator used to assess the sustainability of pollution produce by human activities in Salento is the Water Footprint (WF). The latter offers a better and wider perspective on how human activities affect freshwater resources. It is a volumetric measure of water consumption and pollution. It does not capture the severity of the impact at the local level, but it provides an indication of the spatial-temporal sustainability of water resources used for anthropic purposes.
The overall calculation of the water footprint is the sum of three fractions: the blue fraction, which refers to the withdrawal of surface and groundwater used for agricultural, domestic or industrial purposes [12]; the green fraction referring to the consumption of water resources contained in plants and soil in the form of moisture, without being part of any surface or groundwater body (one example is rainwater that does not stagnate in the soil and is able to filter into the ground); and the grey fraction, which quantifies water pollution and consists of the volume of water required to dilute pollutants to achieve or overcome the water quality standards.

2. Materials and Methods
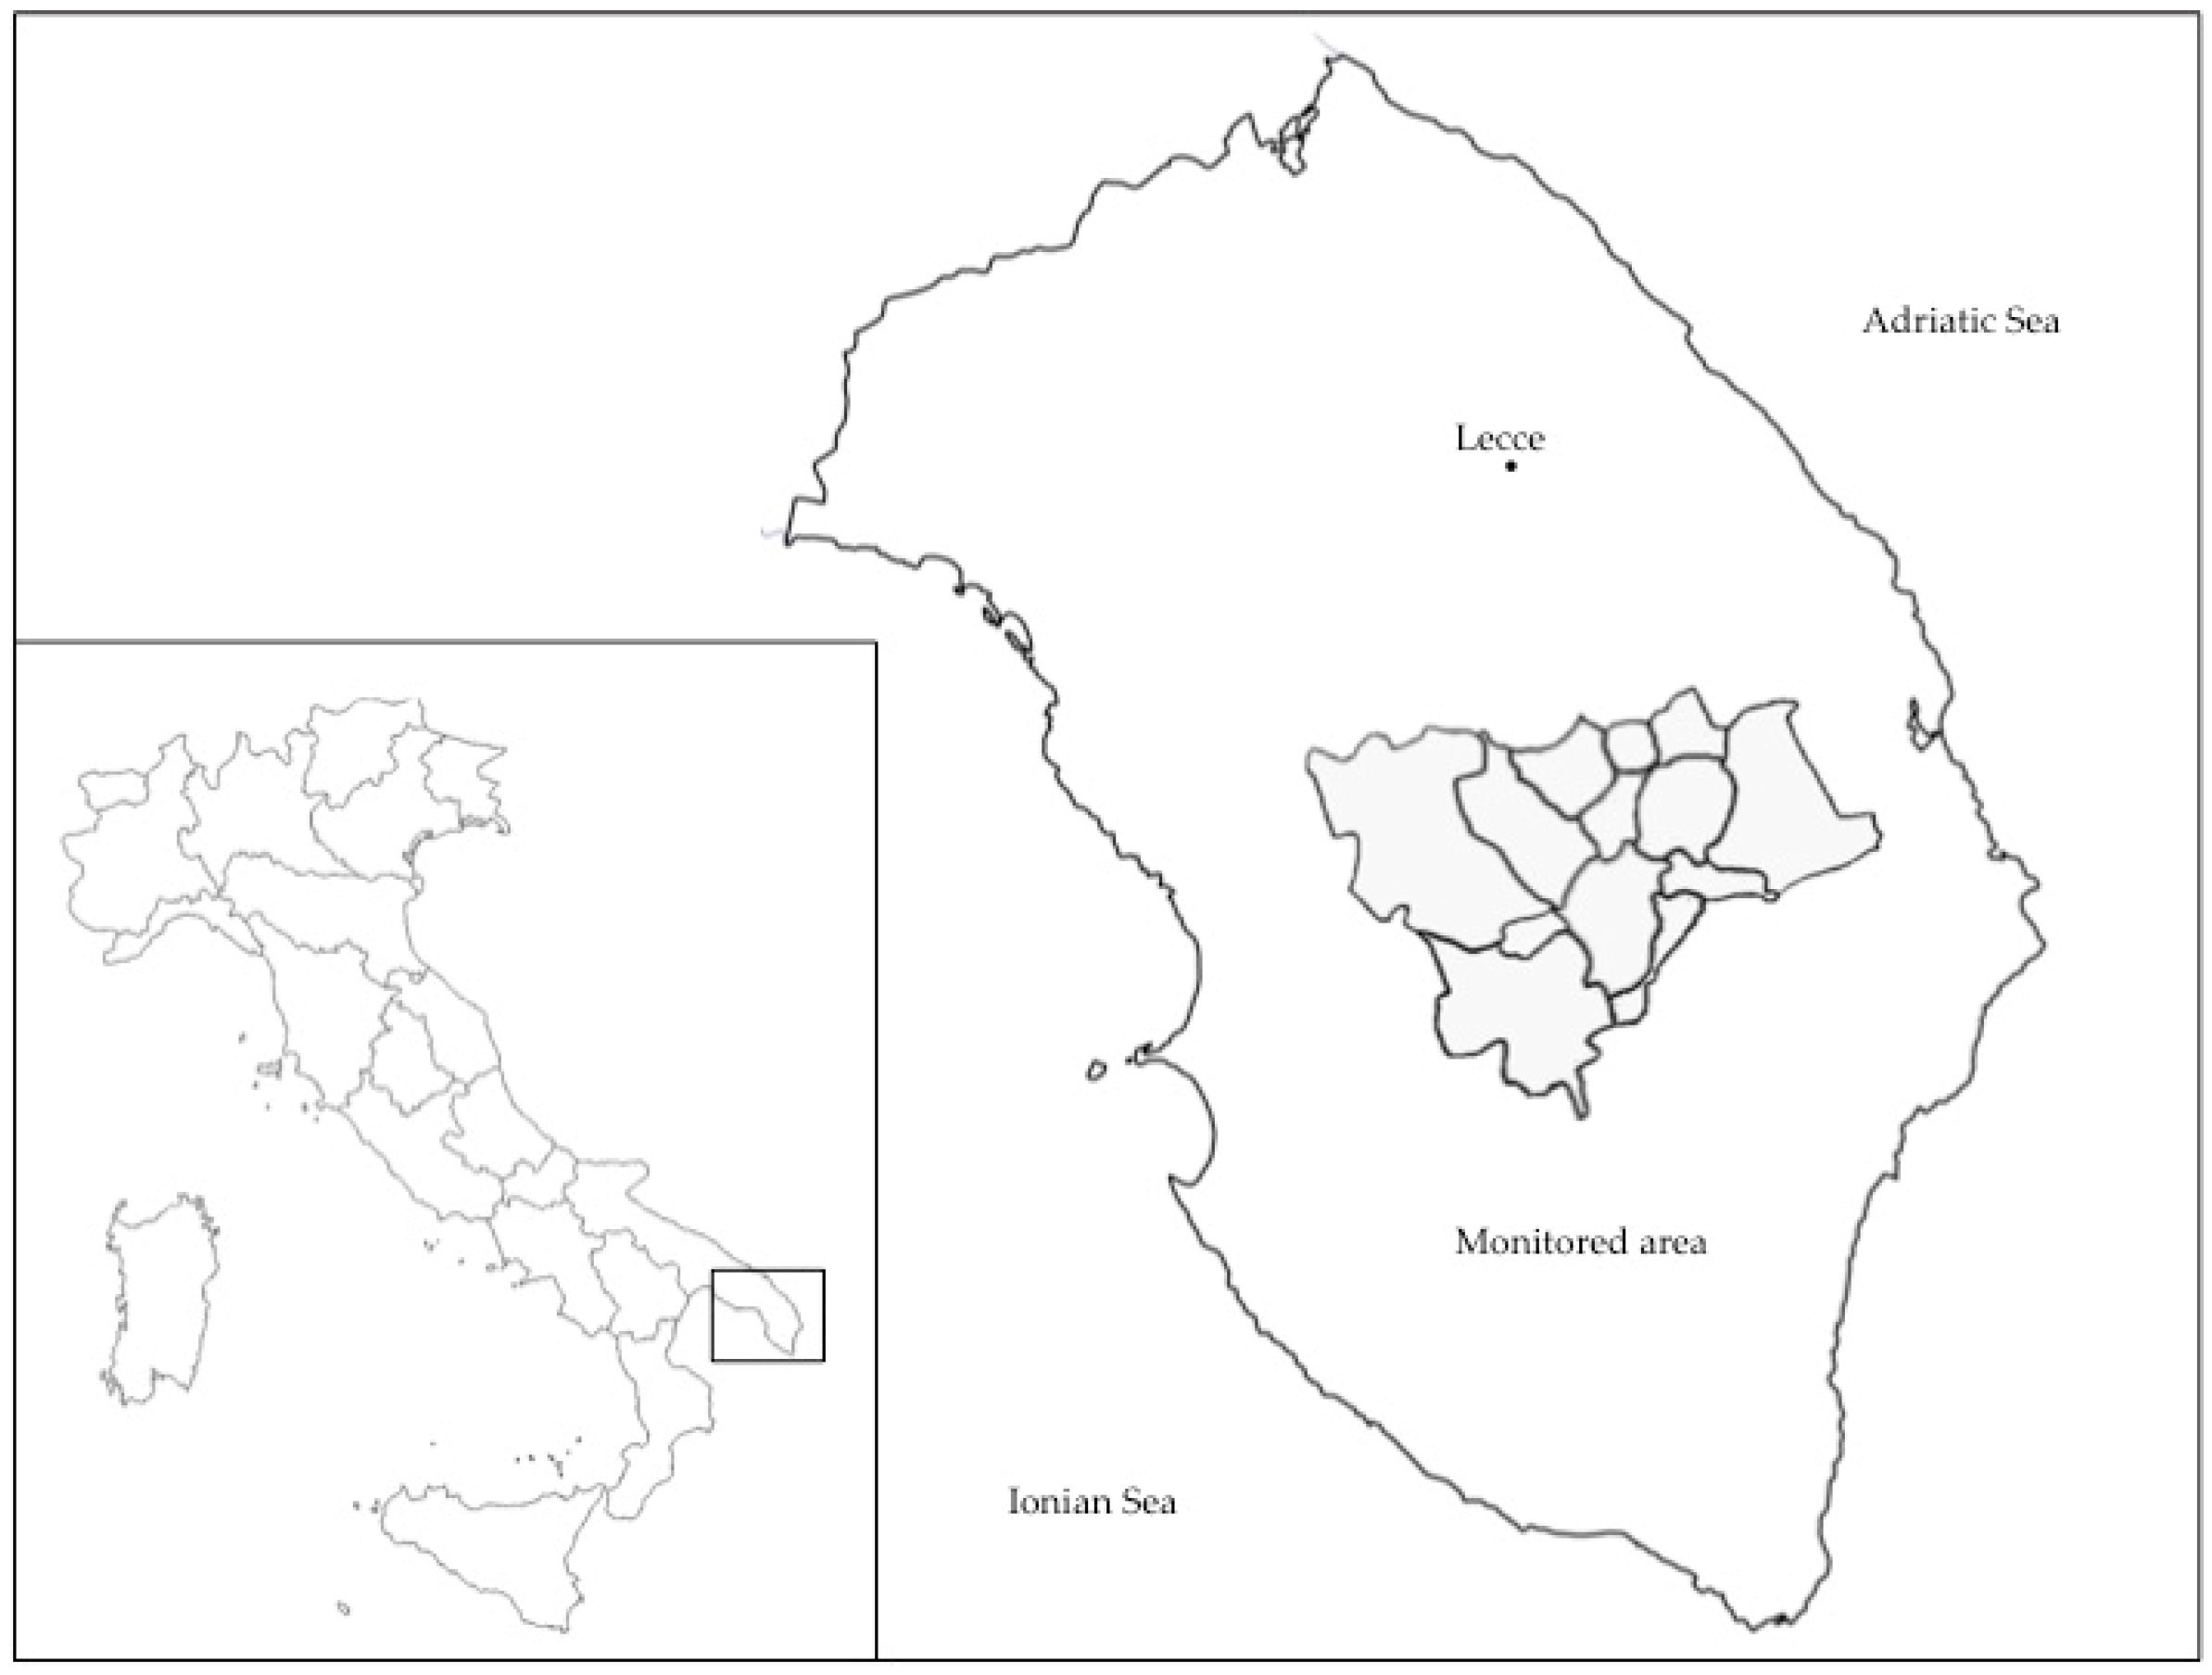
In this paper, to calculate the “grey water footprint” (GWF), the data from chemical analysis of Bagordo et al. [9] were processed.

2.1. Study Area

The area of study (Figure 1) is located in the middle of the Salento Peninsula in the Province of Lecce with no access to the sea and covers a total area of 334.89 km2 between 40_1601000 and 40_301100N latitude and between 18_2403500 and 18_40500E longitude.
From the hydrogeological point of view, the selected study area is characterized by calcareous outcrops that are highly permeable to water due to the large quantity of cracks and sinkholes, associated with karst phenomena [13]. The high permeability of the terrain means that in most of the territory there is no easy access to the water table. Indeed, the precipitation, more intense in cold seasons, is rapidly absorbed by the terrain and percolates directly to the deep aquifer, which rests on a base of seawater from marine invasion [14,15].

2.2. Chemical Analyses

The chemical quality of the deep aquifer was monitored. Eighty-eight water samples were taken from 22 wells situated in the selected study area. The dataset can be considered representative because the samples were collected in four seasonal sampling campaigns conducted in April 2009, July 2009, November 2009 and February 2010. Samples were transported to the laboratory in refrigerated boxes and were analyzed for 15 chemical parameters: Ammonium (NH4+), Chlorides (Cl), Nitrates (NO3), Sulphates (SO42−), Arsenic (As), Cadmium (Cd), Chromium (Cr), Copper (Cu), Iron (Fe), Mercury (Hg), Manganese (Mn), Sodium (Na), Nickel (Ni), Lead (Pb), Vanadium (V). These parameters were selected from those established by Council Directive 98/83/EC on the quality of water intended for human consumption, subsequently transposed into Italian law by Decree Law 31 of the 2nd of February 2001 [16]. Vanadium is not present in the EU Directive but was included in the Italian law.
The analytical method used to determine concentrations of NO3, NH4+, SO42− and Cl was ionic chromatography. Water samples, unmodified or diluted 1:10, were filtered and injected into the chromatographer (Metrohm 883 Basic IC plus), an instrument equipped with a column and pre-column for both anions and cations.
Concentrations of As, Cd, Cr, Cu, Fe, Hg, Mn, Na, Ni, Pb, and V were simultaneously determined, instead, using an ICP-OES spectrometer (a Thermo iCAP 6000). Undiluted water samples were acidified to facilitate nebulization and filtered.
In particular, to determine the concentrations of Na, the water samples were diluted 1:100 to bring the concentration values into the range of calibration curves used with the ICP-OES spectrometer.

2.3. Grey Water Footprint Calculation

The grey water footprint (GWF), one of the three components of Water Footprint (i.e., green WF, blue WF and grey WF), measures the amount of water required to assimilate a polluting load produced from anthropic activity, meeting specific quality standards [17,18]. The grey component is thus an indicator representing the level of water pollution caused by productive processes [19], which makes it possible to compare the environmental pressure exerted by water pollution with those by direct and indirect water consumption [20].
In the case of diffused pollution sources, the most used method considers that only a certain fraction of chemical pollutants reaches groundwater or surface water bodies:
L = α × Appl (mass/time)
where α represents the leaching-runoff fraction, i.e., the fraction of chemical substances that effectively reaches freshwater bodies, and Appl (mass/time) indicates chemical substances that lay on or in the soil, such as fertilizers, manure, pesticides, organic material deriving from grazing, etc. [21].
Since our study is based on a sampling of deep groundwater data, we can directly use the actual L values, which do not have to be estimated. In order to know the GWF of an activity or process, you must first calculate it separately for each contaminant. Subsequently, the general GWF will be equal to the highest GWF found by comparing the specifications of each contaminant. The methodology and calculation of the GWF is described by Hoekstra et al. [18] where it has been defined according to the following formula:
GWF = L/(cmax − cnat ) (volume/time)
where L (mass/time) represents the pollutant load released into water, which is the average concentration detected in the monitoring campaigns on the 22 sampling sites; cmax (mass/volume) represents the maximum permissible concentration of pollutant according to the limits indicated in the regulations on water intended for human consumption (Table 1); and cnat (mass/volume) represents the natural concentration in the receiving water body.
Therefore, using this equation, and not considering the time factor, we can determine the GWF related to the pollutants contained in the deep groundwater of the investigated area.
Most important is, of course, to specify which water quality standards and natural concentrations have been used in preparing a GWF account.
The definition of the natural groundwater quality, also known as the background groundwater quality, is fundamental for the determination of threshold values, and this is assumed to be relevant to the concerns behind the challenges established by the EU Water Framework and Groundwater Directives. At EU level, several research projects, such as the BRIDGE (Background criteria for the identification of groundwater thresholds project), contributed to the elaboration of suitable methodologies aiming at the quantification of the natural background groundwater composition and the threshold values [22].
Nevertheless, in line with prevailing scientific literature on GWF [21], we used values derived from Chapman [23]. For anthropogenic substances we assumed values equal to zero (cnat = 0).

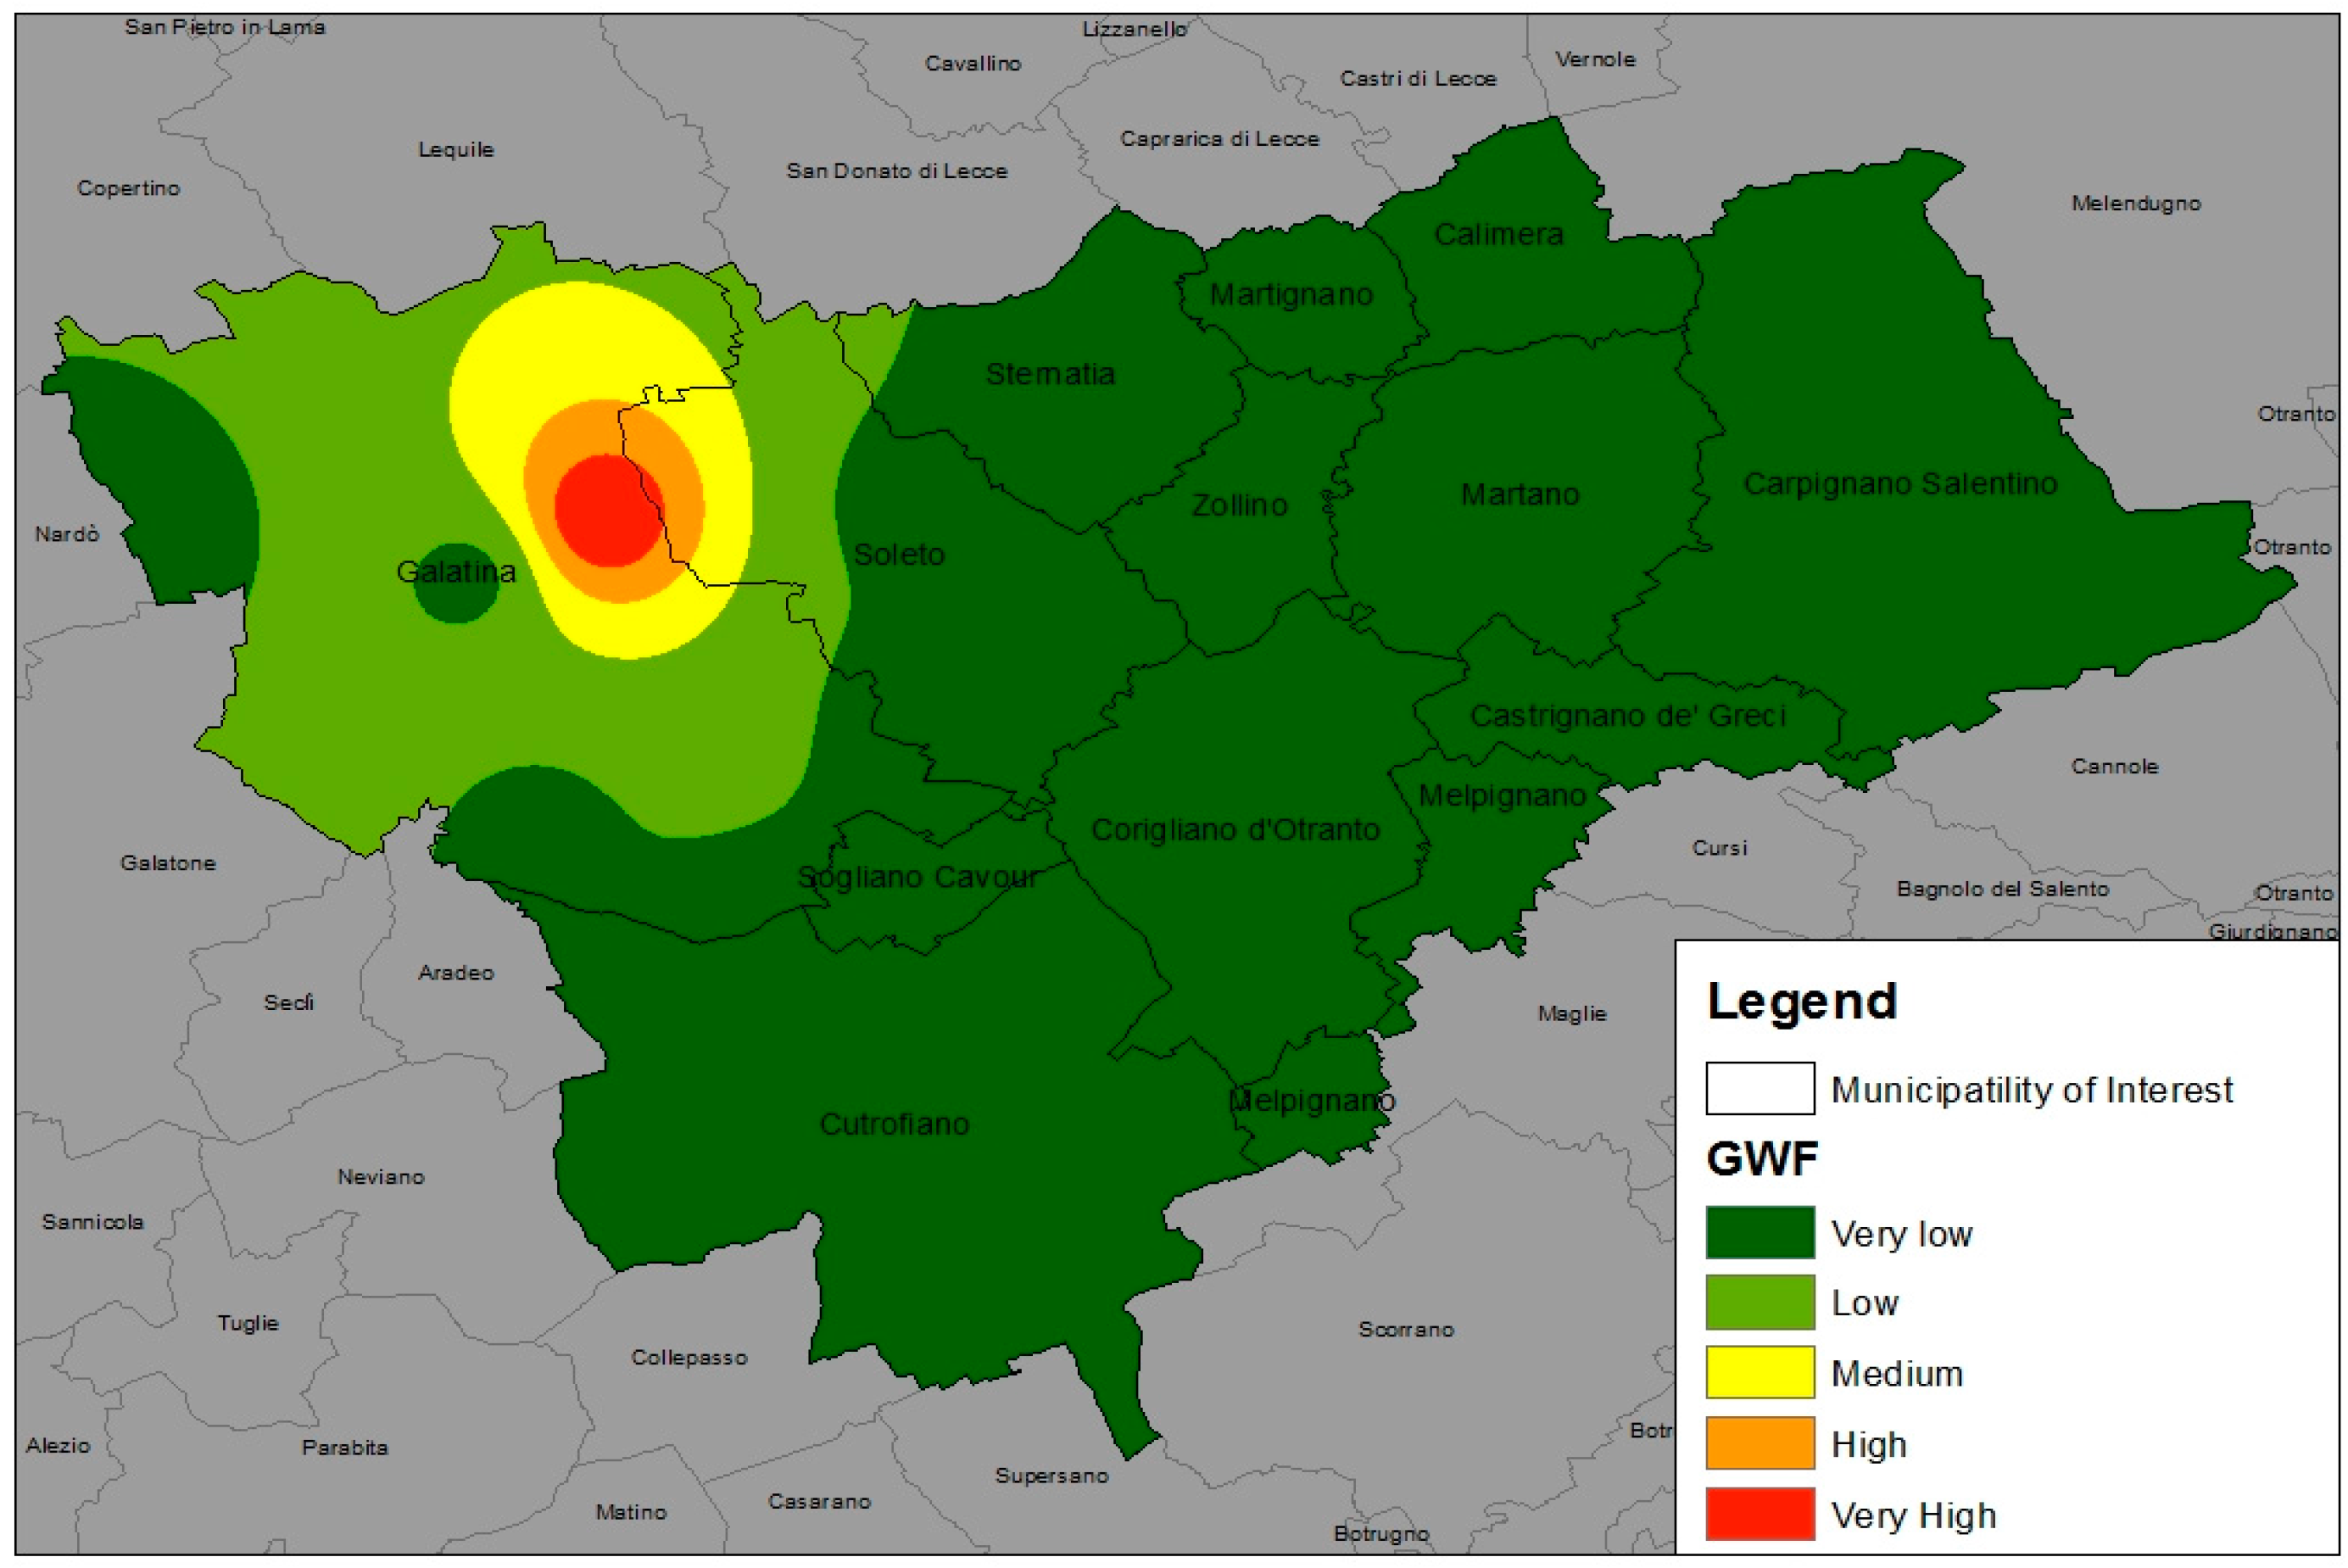
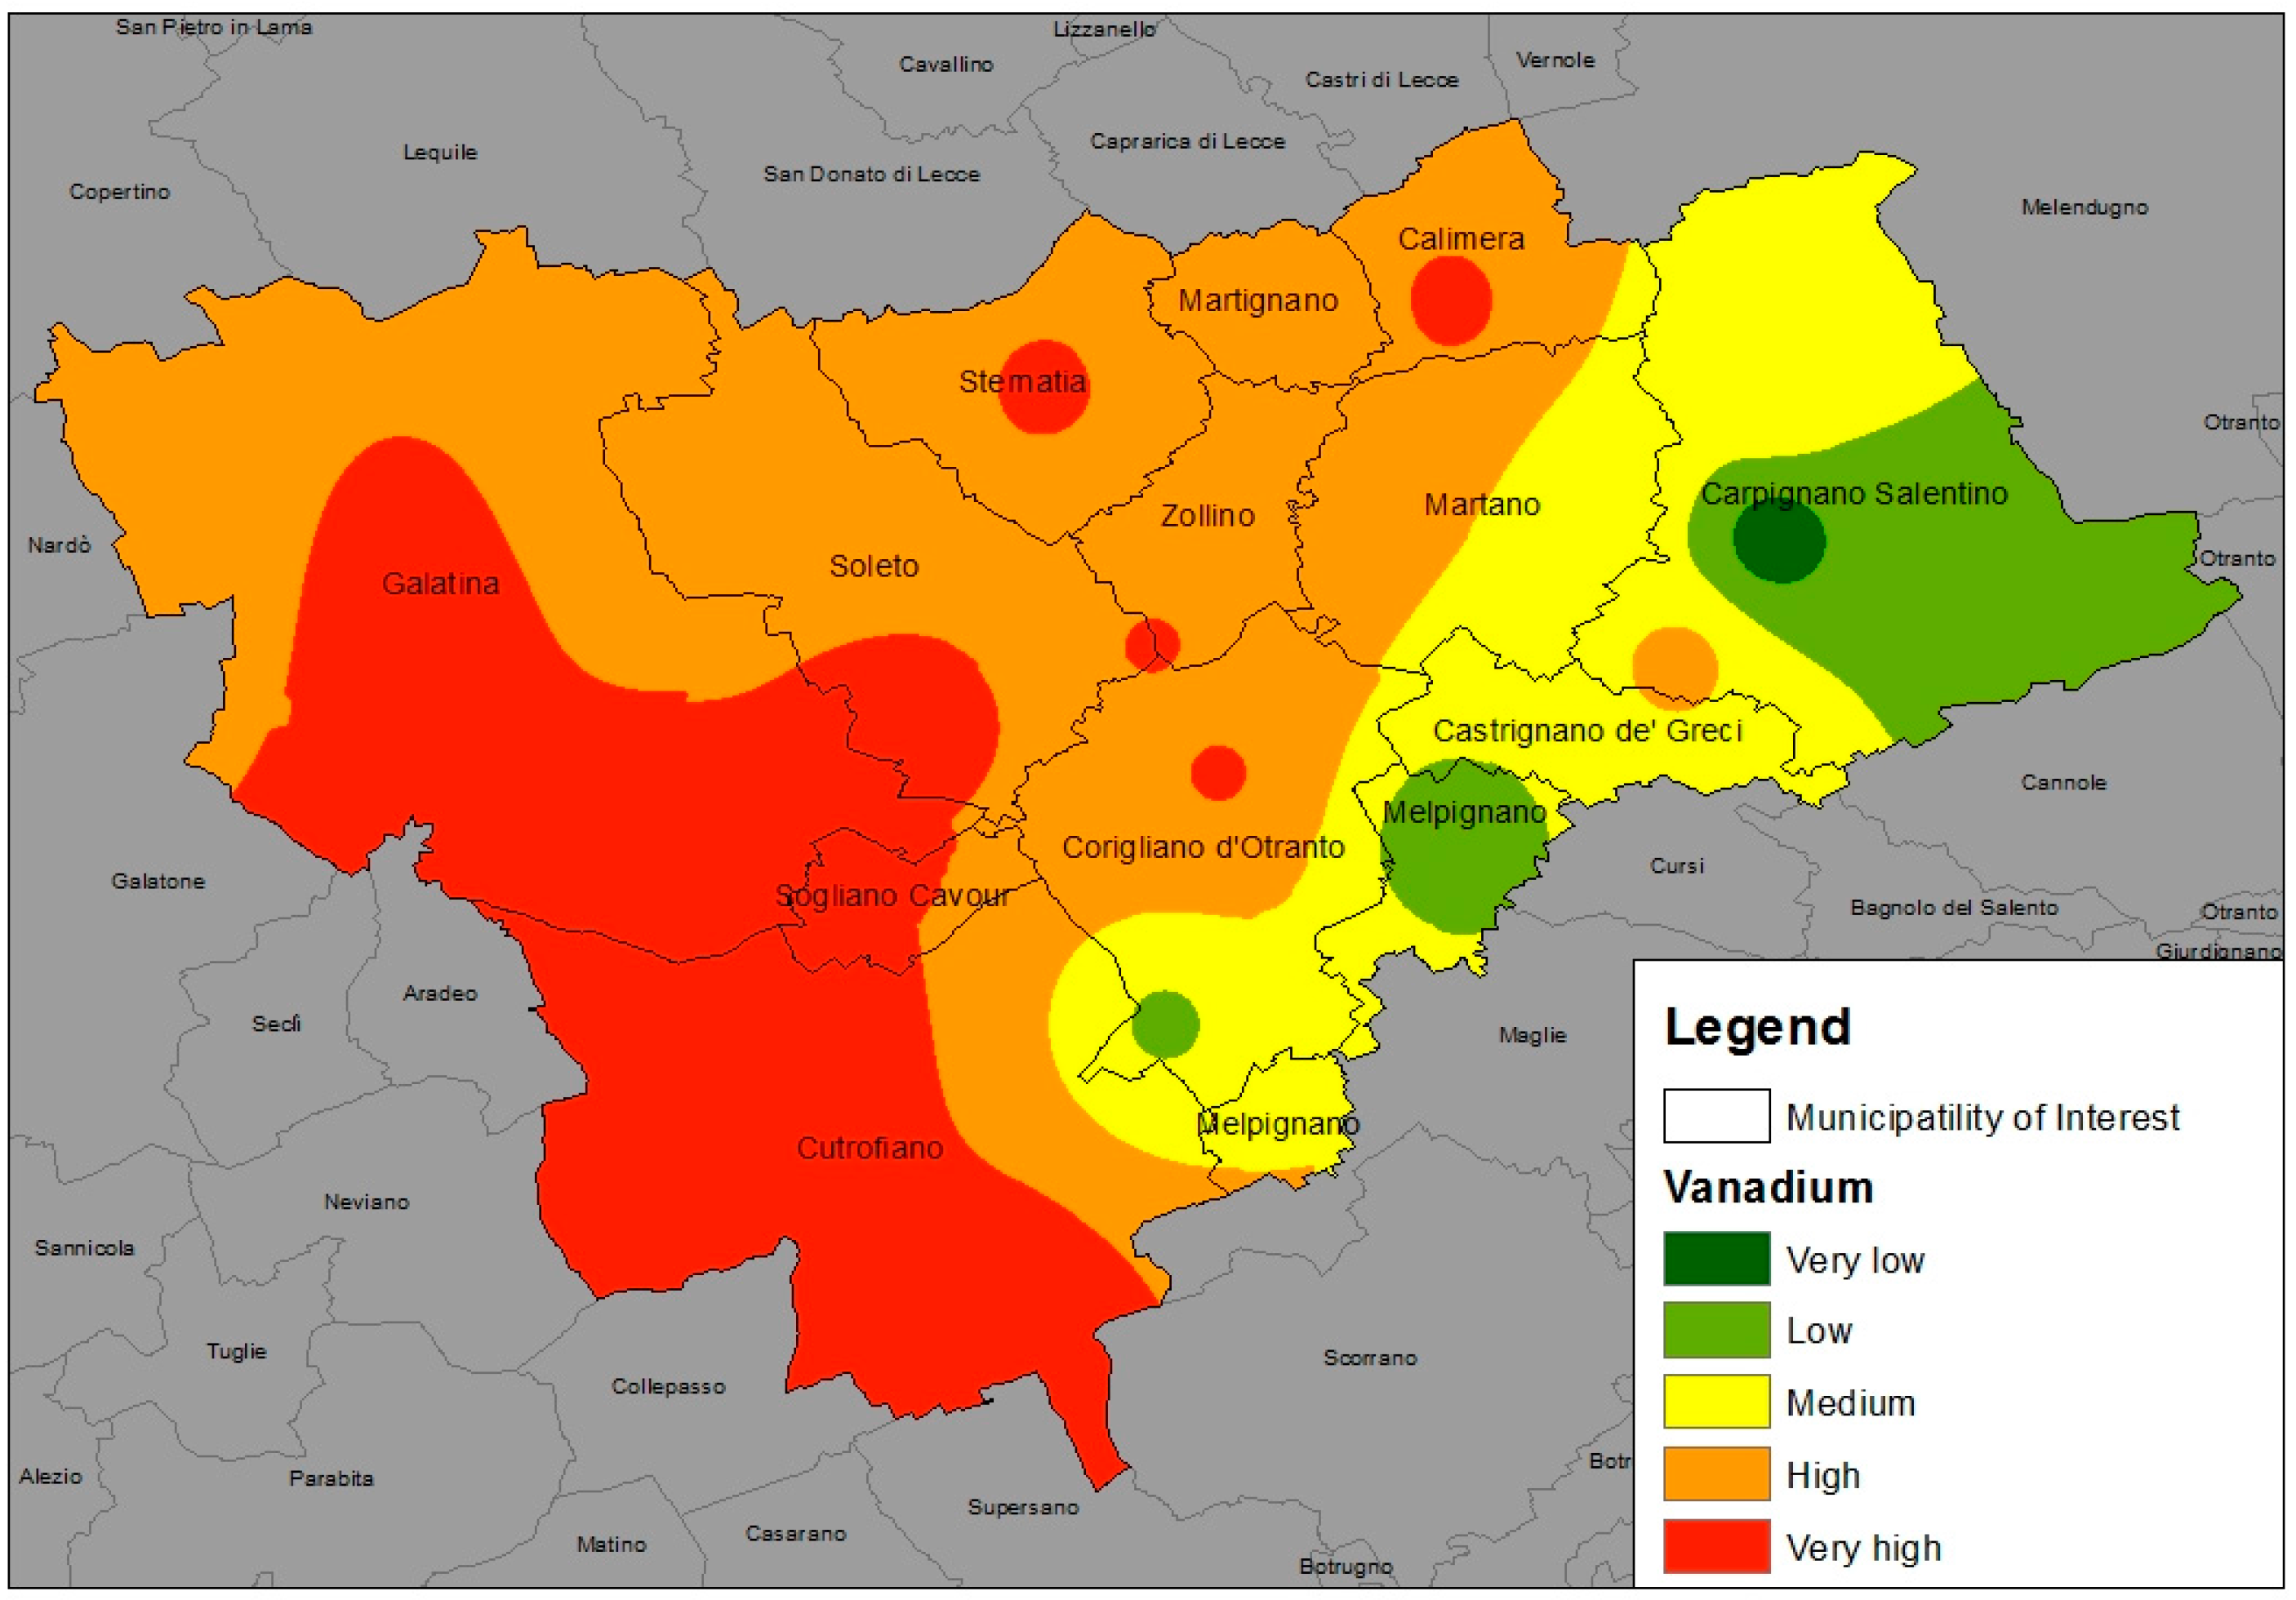
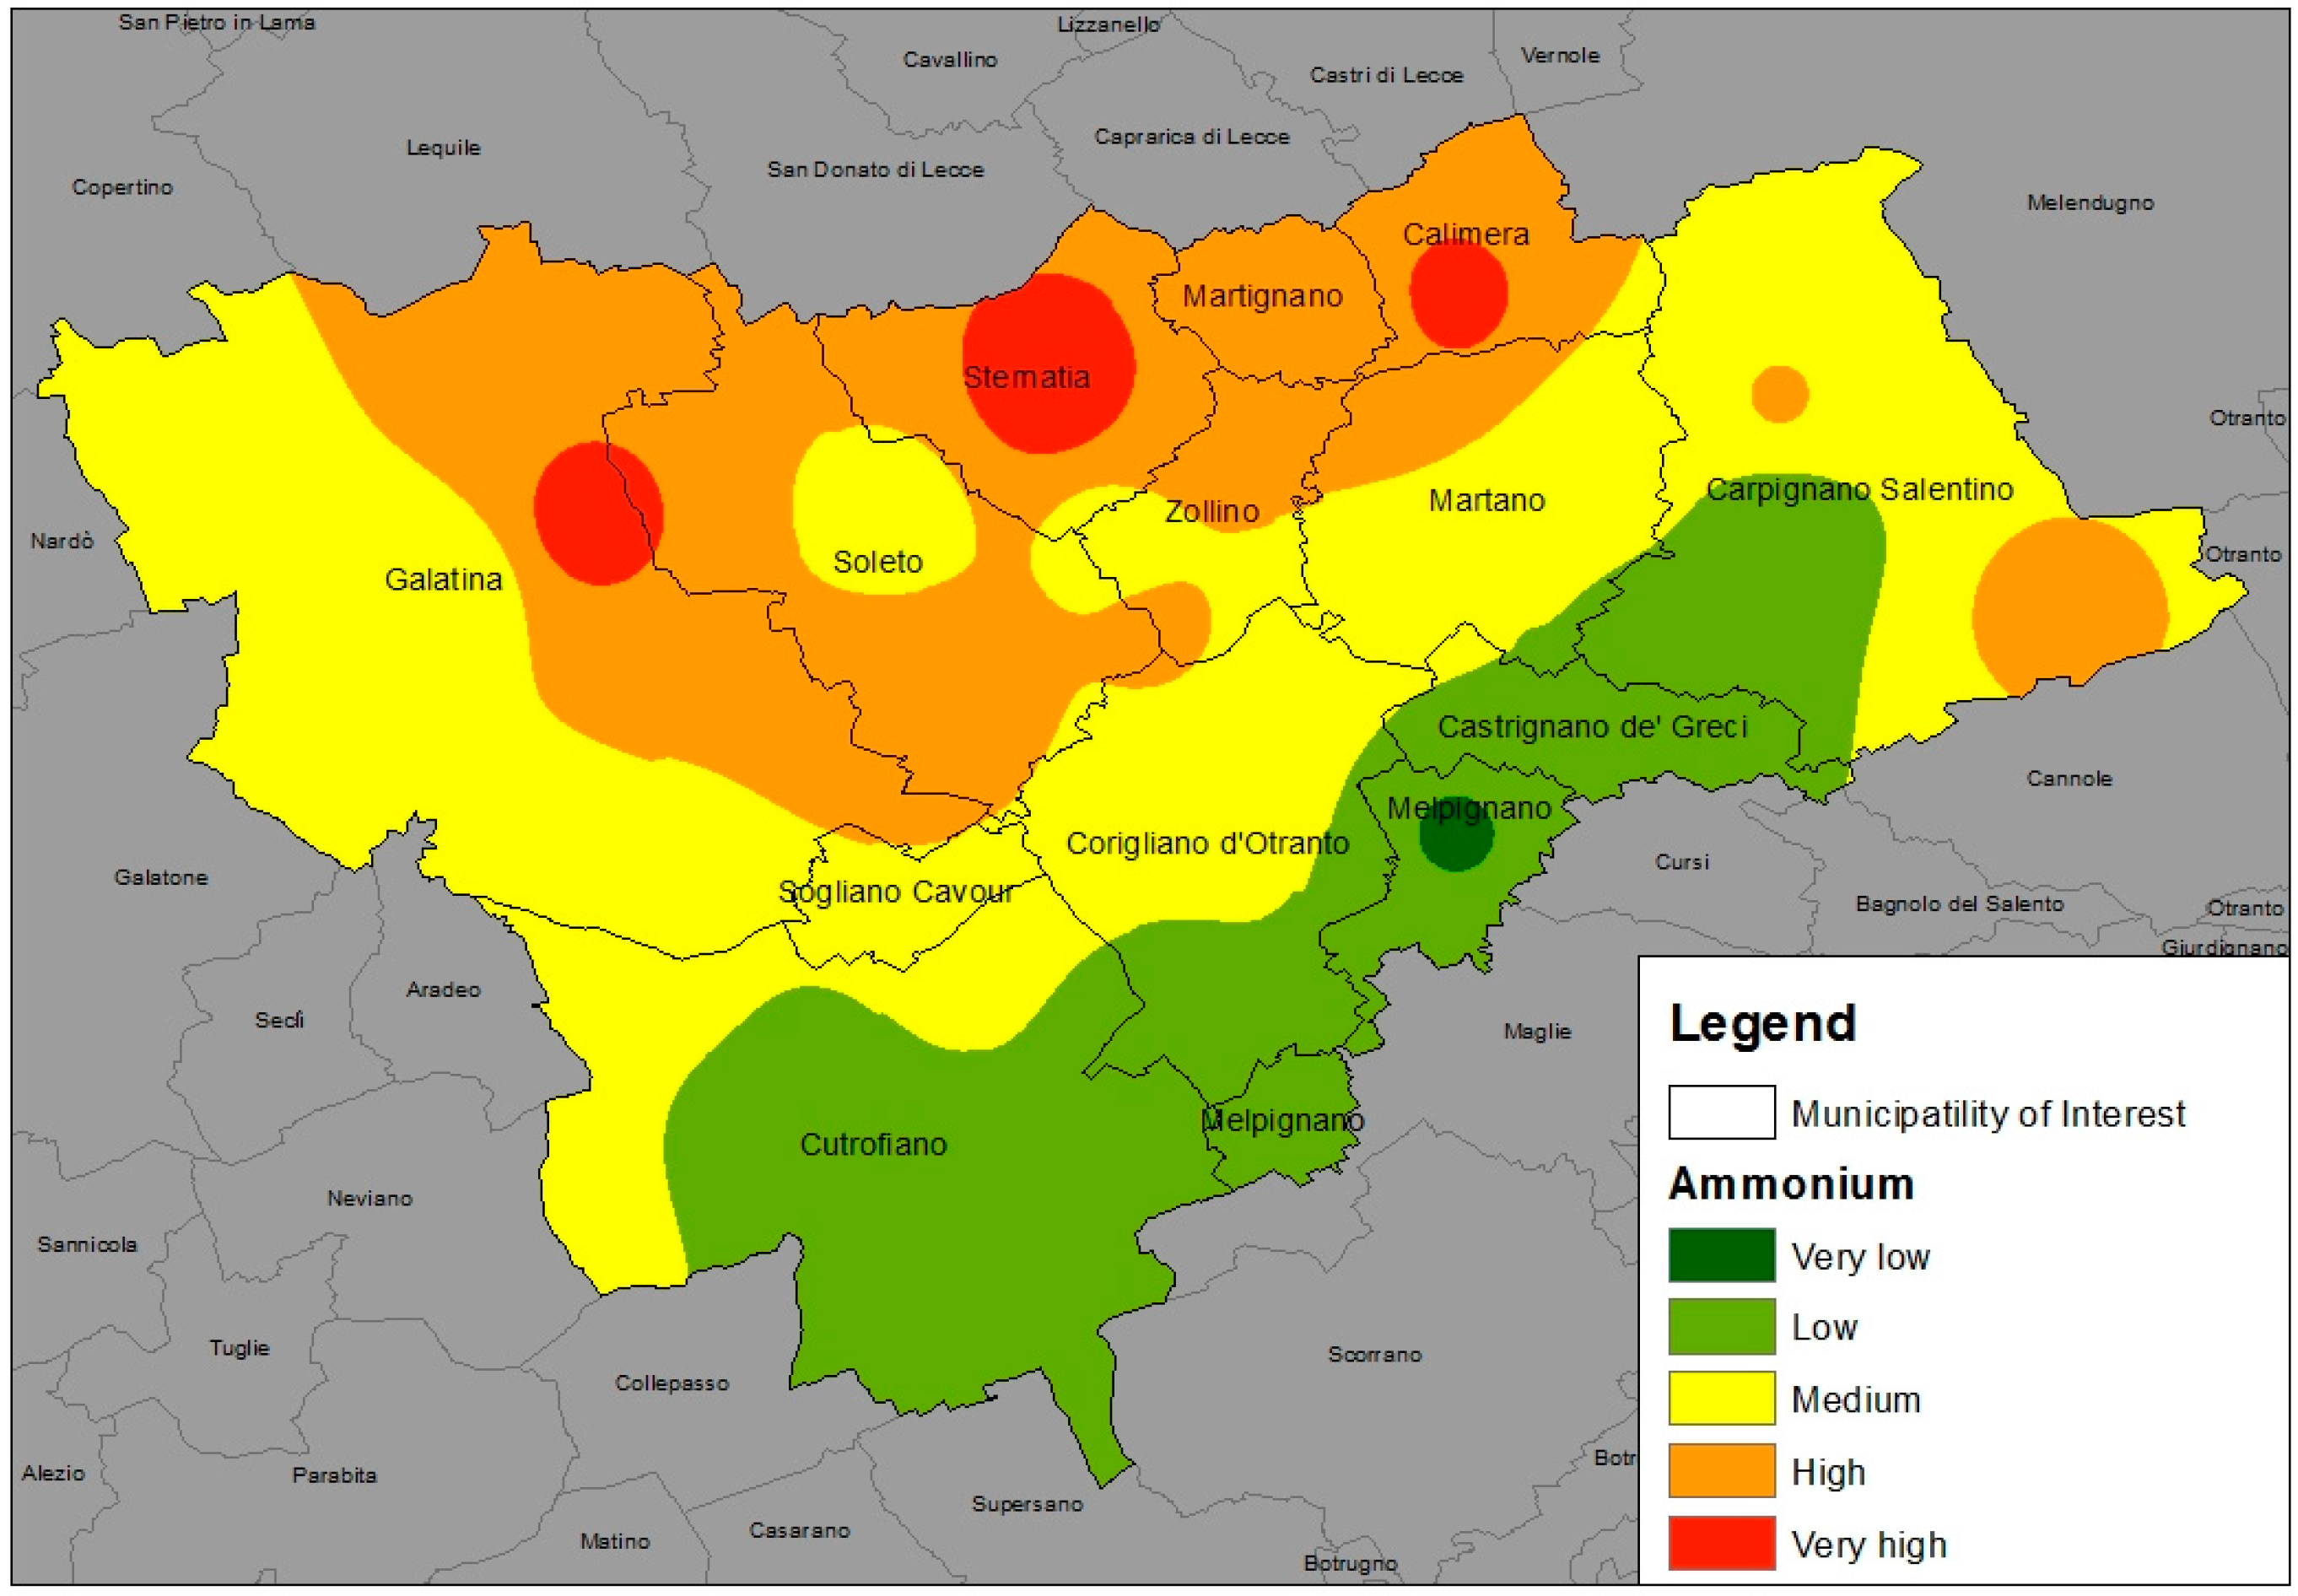
3. Results and Discussion

Table 1 shows the results of the GWF calculation for each parameter on the 88 water samples from the deep aquifer monitoring wells in the selected study area.
The GWF, calculated for each chemical parameter, has allowed us to analyze the contribution that each contaminant makes to the total pollution levels of the water table in the selected study area. The results obtained show a widespread contamination of groundwater by the following chemical elements: Mercury (Hg), Vanadium (V) and Ammonium (NH4+) whose concentrations were above the limits prescribed by the regulations on water intended for human consumption [16].
For the purpose of determining an overall indicator of water pollution, the water footprint based on the most critical substance is considered to be acceptable. The GWF is in fact calculated for the pollutant considered as being the most critical, having the largest associated dilution volume [24].
The GWF assessment of the study area has founded that mercury contributes to a greater extent to the GWF value being the chemical contaminant which would require on average a greater volume of water (1.00 L) to be assimilated (1.00 L/mg). Based on knowledge of local geology, it can be said that the mercury detected is unlikely to be of natural origin.
Also, the V levels seem to be particularly high in water samples (69% of contribution in terms overall GWF). Therefore, the high Mercury and Vanadium concentrations may thus be associated with anthropic pressures on the aquifer (industrial activities) [9,25,26], but the issue requires further study to evaluate the causality relation. As shown in Table 1, Ammonium (NH4+) is the contaminant that contributes with a weight equal to 39.18% of the total GWF. In particular, to assimilate 1 mg of ammonium 0.69 L of water would be necessary.
The study, focusing on the GWF assessment of groundwater of an area of Salento enables the formulation of hypotheses regarding the causes of low quality, and the elaboration of intervention management strategies to improve the overall state of groundwater.
Our results, showing the distribution of the problem on spatial scale (Figure 2), identify certain badly affected contexts associated with risk factors present in the area.
The pattern that emerges is characterized by high GWF values concentrated in the north-western part of the area, which appears to be the most affected by pollution of the aquifer.
The central and north-eastern parts of the area appeared to be not chemically contaminated, while in the north-western parts of the studied area groundwater quality seems to be unsuitable for the envisaged uses, revealing high values of GWF.
Evaluating the contribution of each chemical pollutant to the total overall GWF, the biggest problem regarding the quality of the aquifer underlying the area of study is represented, as already indicated, by the presence of certain chemical elements and compound, particularly Mercury, Vanadium, and Ammonium.
Since the overall GWF will be equal to the highest GWF found by comparing the specifications of each contaminant, most of the overall GWF results corresponds to the GWF related to Mercury, as we can see from Table 2 and in Figure 3 and Figure 4.
The GWF related to Vanadium (Figure 3) reports particularly high values in the south-western area of Salento, which lies between the industrial areas of Cutrofiano and Galatina. This circumstance may be associated just with the presence of industrial activities [26], but this hypothesis would require further study about causality relations.
The GWF related to Ammonium (Figure 4), which reveals high values mainly in the northern area of Salento, could be the result of fertilization in agriculture, but also of human or animal defecation [28,29]. Its presence in groundwater can be related to geological factors such as the decay of material undergoing fossilization [30], but, if associated with microbiological compounds, also to sewers and/or livestock farms [31].
Groundwater monitored in the study results, in most cases, not compliant with the Italian Decree Law 31/01 for drinking use. Given the widespread use of groundwater in Salento for domestic purposes, the adoption of limitation measures aiming at avoiding risks for public health is justified [7].
The use of the wells for irrigation may in fact cause water-borne contaminations to spread, arising from the consumption of raw fruit and vegetables cultivated in the irrigated area.
In addition, the pollutant loads originated by industrial activities in this area are significant because cement and waste incineration plants could be responsible for heavy metals discharge such as Vanadium [32].
The hydrographical system of this area, characterized by ponors, and no flowing into the sea [33], needs to reverse the contamination by adopting minimum standards of environmental quality and then implementing policies to maintain the achieved targets.

4. Conclusions

Climate characteristics and human activities that involve any extensive use of water resources, influence the level of groundwater contamination, leading to reduced water availability and to progressive deterioration of its quality.
The GWF concept has been improved by accounting for natural concentrations of substances in the water basin, thus decreasing the oversizing due to the given maximum allowable concentrations of anthropogenic origin substances. Recently, GWF studies have been carried out, not only for nitrogenous pollutants as in the previous scientific literature, but also for different water quality parameters, such as nutrients, dissolved solids, metals, and pesticides [34].
As demonstrated in Lamastra et al. [24], the GWF approach enables the sustainability assessment of the receptor water body. When the concentration of the pollutant in the water body overcomes water quality standards, additional water volume (grey water) is needed to dilute the contaminant. If instead the water body volume is large enough to not compromise its water quality standard, the GWF is not relevant.
Considering the Integrated Water Resources Management framework, the accounting methodology used in this study makes GWF an additional indicator in the water planning processes, a criterion in the decision making process of pollution management of a hydrological basin and a tool for the ex-ante assessment of the pollution monitoring programs’ effectiveness [35], also from an economic point of view [36].
Water research has started to quantify and map footprints, but further efforts should be made to understand how to govern such footprints in a sustainable perspective [37].
Improving the scientific soundness of GWF assessments can better inform society about the impact on water systems, serving as a tool for reaching water pollution sustainable targets [38].
The EU Water Framework Directive represents certainly the major driving factor of groundwater monitoring, both quantitative and chemical. Nevertheless, the need for monitoring is also stimulated by Regional Water Plans, as reported by some international studies in other EU areas [39].
From our study, it emerges that the management of groundwater quality requires a multidisciplinary approach focused on identifying the measures necessary to protect our water resources.

Acknowledgments

The authors would like to thank Traci Michelle Ricciardo for the extensive English revisions.

Author Contributions

The following authors contributed in full to this work. Pier Paolo Miglietta and Francesca Serio conceived the study, analyzed the sources, the literature and drafted the manuscript. Pier Paolo Miglietta and Pierluigi Toma developed the framework and design methodology. Danilo Migoni and Francesco Bagordo contributed to data collection and analysis. Benedetta Coluccia helped to draft the manuscript. Francesco Paolo Fanizzi and Antonella De Donno supervised the research project and carried out a detailed revision. All the authors wrote the body of the paper, read and approved the final manuscript.

Conflicts of Interest

The authors declare no conflict of interest.

References

  1. Howard, G.; Bartram, J.; Pedley, S.; Schmoll, O.; Chorus, I.; Berger, P. Groundwater and public health. In Protecting Groundwater for Health: Managing the Quality of Drinking-Water Sources; Schmoll, O., Howard, G., Chilton, J., Chorus, I., Eds.; Association Publishing: London, UK, 2006. [Google Scholar]
  2. Chilton, J.; Seiler, K.P. Groundwater occurrence and hydrogeological environments. In Protecting Groundwater for Health: Managing the Quality of Drinking-Water Sources; Schmoll, O., Howard, G., Chilton, J., Chorus, I., Eds.; International Water Association Publishing: London, UK, 2006. [Google Scholar]
  3. Kačaroğlu, F. Review of groundwater pollution and protection in karst areas. Water Air Soil Pollut. 1999, 113, 337–356. [Google Scholar] [CrossRef]
  4. Lloyd, J.W.; Howard, K.W.F.; Pacey, N.R.; Tellam, J.H. The value of iodine as parameter in the chemical characterization of groundwaters. J. Hydrol. 1982, 57, 247–265. [Google Scholar] [CrossRef]
  5. Spizzico, M.; Lopez, N.; Sciannamblo, D. Analysis of the potential contamination risk of groundwater resources circulating in areas with anthropogenic activities. Nat. Hazard Earth Syst. Sci. 2005, 5, 109–116. [Google Scholar] [CrossRef]
  6. Giudici, M.; Margiotta, S.; Mazzone, F.; Negri, S.; Vassena, C. Modeling hydrostratigraphy and groundwater flow of a fractured and karst aquifer in a Mediterranean basin (Salento peninsula, southeastern Italy). Environ. Earth Sci. 2012, 67, 1891–1907. [Google Scholar] [CrossRef]
  7. Masciopinto, C.; La Mantia, R.; Carducci, A.; Casini, B.; Calvario, A.; Jatta, E. Unsafe tapwater in households supplied from groundwater in the Salento Region of Southern Italy. J. Water Health 2007, 5, 129–148. [Google Scholar] [CrossRef] [PubMed]
  8. Portoghese, I.; D’Agostino, D.; Giordano, R.; Scardigno, A.; Apollonio, C.; Vurro, M. An integrated modelling tool to evaluate the acceptability of irrigation constraint measures for groundwater protection. Environ. Modell. Softw. 2013, 46, 90–103. [Google Scholar] [CrossRef]
  9. Bagordo, F.; Migoni, D.; Grassi, T.; Serio, F.; Idolo, A.; Guido, M.; Zaccarelli, N.; Fanizzi, F.P.; De Donno, A. Using the DPSIR framework to identify factors influencing the quality of groundwater in Grecìa Salentina (Puglia, Italy). Rend Lincei 2016, 27, 113–125. [Google Scholar] [CrossRef]
  10. Lugoli, F.; Leopizzi, M.I.; Bagordo, F.; Grassi, T.; Guido, M.; De Donno, A. Widespread microbiological groundwater contamination in the South-eastern Salento (Puglia-Italy). J. Environ. Monit. 2011, 13, 192–200. [Google Scholar] [CrossRef] [PubMed]
  11. Bagordo, F.; Quattrocchi, M.; De Donno, A.; Signorile, G.; Liaci, D.; Gabutti, G. Chemical-physical and microbiological survey in groundwater of Salento. Ann. Ig. 2003, 15, 639–647. [Google Scholar] [PubMed]
  12. Gerbens-Leenes, P.W.; Van Lienden, A.R.; Hoekstra, A.Y.; van der Meer, T.H. Biofuel scenarios in a water perspective: The global blue and green water footprint of road transport in 2030. Glob. Environ. Chang. 2012, 22, 764–775. [Google Scholar] [CrossRef]
  13. López-Geta, J.A.; Gómez, J.D.D.; de la Orden, J.A.; Ramos, G.; Rodríguez, L. Coastal Aquifers Intrusion Technology: Mediterranean Countries; Instituto Geológico y Minero de España: Madrid, Spain, 2003. [Google Scholar]
  14. Cristino, M.C.; Doglioni, A.; Simeone, V. Notes on morphological characters of ephemeral streams in Apulia region, south Italy. Eng. Geol. Soc. Territ. 2015, 3, 185–188. [Google Scholar] [CrossRef]
  15. Cristino, M.C.; Doglioni, A.; Simeone, V. Preliminary results about morphological characteristics of ephemeral stream catchments in Apulia region, South Italy. Rend. Online Soc. Geol. Italy 2013, 24, 70–72. [Google Scholar] [CrossRef]
  16. Legislative Decree No 31 of February 2, 2001 Implementing Council Directive 98/83/EC on the Quality of Water Intended for Human Consumption. Available online: http://www.camera.it/parlam/leggi/deleghe/01031dl.htm (accessed on 30 March 2017).
  17. Miglietta, P.P.; De Leo, F.; Ruberti, M.; Massari, S. Mealworms for Food: A Water Footprint Perspective. Water 2015, 7, 6190–6203. [Google Scholar] [CrossRef]
  18. Hoekstra, A.Y.; Chapagain, A.K.; Aldaya, M.M.; Mekonnen, M.M. The Water Footprint Assessment Manual: Setting the Global Standard; Earthscan: London, UK, 2011. [Google Scholar]
  19. Wu, B.; Zeng, W.; Chen, H.; Zhao, Y. Grey water footprint combined with ecological network analysis for assessing regional water quality metabolism. J. Clean. Prod. 2016, 112, 3138–3151. [Google Scholar] [CrossRef]
  20. Wang, L.; Ding, X.; Wu, X. Careful considerations when reporting and evaluating the grey water footprint of products. Ecol. Indic. 2014, 41, 131–132. [Google Scholar] [CrossRef]
  21. Franke, N.A.; Bovaciuglu, H.; Hoekstra, A.Y. Grey Water Footprint Accounting: Tier 1 Supporting Guidelines—Value of Water Research Report Series n°65; UNESCO-IHE: Delft, The Netherlands, 2013. [Google Scholar]
  22. Cruz, J.V.; Andrade, C. Natural background groundwater composition in the Azores archipelago (Portugal): A hydrogeochemical study and threshold value determination. Sci. Total Environ. 2015, 520, 127–135. [Google Scholar] [CrossRef] [PubMed]
  23. Chapman, D. Water Quality Assessments-A Guide to Use of Biota, Sediments and Water in Environmental Monitoring, 2nd ed.; CRC Press: Boca Raton, FL, USA, 1996. [Google Scholar]
  24. Lamastra, L.; Suciu, N.A.; Novelli, E.; Trevisan, M. A new approach to assessing the water footprint of wine: An Italian case study. Sci. Total Environ. 2014, 490, 748–756. [Google Scholar] [CrossRef] [PubMed]
  25. Telloli, C. Metal concentrations in snow samples in an Urban Area in the Po Valley. Int. J. Geosci. 2014, 5, 1116–1135. [Google Scholar] [CrossRef]
  26. World Health Organization [WHO]. Vanadium. Environment Health Criteria. 81. IPCS International Program on Chemical Safety; World Health Organization: Geneve, Switzerland, 1988. [Google Scholar]
  27. Legendre, P.; Legendre, L. Numerical Ecology, 2nd ed.; Elsevier: Amsterdam, The Netherlands, 1998. [Google Scholar]
  28. Ghaly, A.E.; Ramakrishnan, V.V. Nitrogen sources and cycling in the ecosystem and its role in air, water and soil pollution: A critical review. J. Pollut. Eff. Control 2015, 27, 1–26. [Google Scholar] [CrossRef]
  29. De Simone, L.A.; Howes, B.L. Nitrogen transport and transformations in a shallow aquifer receiving wastewater discharge: A mass balance approach. Water Resour. Res. 1998, 34, 271–285. [Google Scholar] [CrossRef]
  30. Schilling, K.E. Occurrence and distribution of ammonium in Iowa groundwater. Water Environ. Res. 2002, 74, 177–186. [Google Scholar] [CrossRef] [PubMed]
  31. Cabral, J.P.; Marques, C. Faecal Coliform bacteria in Febros River (northwest Portugal): Temporal variation, correlation with water parameters, and species identification. Environ. Monit. Assess. 2006, 118, 21–36. [Google Scholar] [CrossRef] [PubMed]
  32. Hindy, K.T.; Abdel Shafy, H.I.; Farag, S.A. The role of the cement industry in the contamination of air, water, soil and plant with vanadium in Cairo. Environ. Pollut. 1990, 66, 195–205. [Google Scholar] [CrossRef]
  33. Delle Rose, M.; Beccarisi, L.; Zuccarello, V. Geomorphological and ecological researches inferring swamp areas inside endorheic catchment basin: The Asso graben-polje case study (south Italy). Geophys. Res. Abstr. 2009, 11, 4227. [Google Scholar]
  34. Hoekstra, A.Y. Water Footprint Assessment: Evolvement of a New Research Field. Water Resour. Manag. 2017, 1–21. [Google Scholar] [CrossRef]
  35. Pellicer-Martínez, F.; Martínez-Paz, J.M. Grey water footprint assessment at the river basin level: Accounting method and case study in the Segura River Basin, Spain. Ecol. Indic. 2016, 60, 1173–1183. [Google Scholar] [CrossRef]
  36. Miglietta, P.P.; De Leo, F.; Toma, P. Environmental Kuznets curve and the water footprint: An empirical analysis. Water Environ. J. 2017, 31, 20–30. [Google Scholar] [CrossRef]
  37. Hoekstra, A.Y.; Chapagain, A.K.; Zhang, G. Water footprints and sustainable water allocation. Sustainability 2016, 8, 20. [Google Scholar] [CrossRef]
  38. Liu, W.; Antonelli, M.; Liu, X.; Yang, H. Towards improvement of grey water footprint assessment: With an illustration for global maize cultivation. J. Clean. Prod. 2017, 147, 1–9. [Google Scholar] [CrossRef]
  39. Cruz, J.V.; Pacheco, D.; Cymbron, R.; Mendes, S. Monitoring of the groundwater chemical status in the Azores archipelago (Portugal) in the context of the EU water framework directive. Environ. Earth Sci. 2010, 61, 173–186. [Google Scholar] [CrossRef]
Figure 1. Area of study (located in the middle of the Salento Peninsula in the Province of Lecce).
Sustainability 09 00799 g001
Figure 2. Map of the interpolated of the overall GWF in the groundwater of the study area. Interpolation used the inverse distance weighting method [27].
Sustainability 09 00799 g002
Figure 3. Map of the interpolated of GWF related to Vanadium in the groundwater of the study area. Interpolation used the inverse distance weighting method [27].
Sustainability 09 00799 g003
Figure 4. Map of the interpolated of GWF related to Ammonium in the groundwater of the study area. Interpolation used the inverse distance weighting method [27].
Sustainability 09 00799 g004
Table 1. Results of the average grey water footprint (GWF) calculation for each chemical parameter on the 88 water samples from the deep aquifer monitoring wells in the selected study area.
ParameterMean (mg/L)Standard Deviation (±)cmax 1 (mg/L)GWFGWF % 2
As0.00200.00080.010.22222.22
Cd0.00100.00000.0050.200020.00
Cr0.00200.00040.050.04014.01
Cu0.00100.005210.00100.10
Fe0.02600.02180.20.135913.59
Hg0.00100.00280.0011.000100.00
Mn0.00100.00320.050.02042.04
Na34.400020.18412000.175217.52
Ni0.00100.00350.020.05105.10
Pb0.00100.00190.010.100410.04
V0.03450.01910.05 **0.690069.00
NH4+0.19000.22430.50.391839.18
Cl42.550043.10462500.172917.29
NO312.950012.0040500.259525.95
SO42−40.550025.77652500.165416.54
1 Limits specified by Council Directive 98/83/EC except ** (limits specified by Lgs.D. 31/01). 2 GWF % represents the percentage contribution (%) of each parameter to the GWF of the area.
Table 2. Results of the overall GWF and the GWF related to Vanadium and Ammonium concentrations for each wells in the study area.
Well IDWell Location (Municipality)LATLONGGWFGWF VanadiumGWF Ammonium
1Galatina40 13 918 5 11.000.740.57
2Galatina40 12 1518 9 127.500.761.02
3Galatina40 9 1818 8 371.251.000.64
4Galatina40 7 5218 10 161.191.190.61
5Soleto40 11 1118 14 261.000.970.70
6Soleto40 10 3318 12 91.071.070.88
7Sternatìa40 13 2718 13 271.110.991.11
8Martignano40 14 0318 16 141.000.820.72
9Zollino40 12 0918 13 561.000.760.58
10Calimera40 14 1818 17 101.011.010.99
11Martano40 12 4818 18 361.000.680.53
12Carpignano40 12 918 20 111.000.100.24
13Carpignano40 13 2318 20 111.000.580.69
14Carpignano40 11 2518 22 391.000.300.76
15Castrignano40 11 018 19 191.000.770.24
16Melpignano40 9 2418 17 111.000.320.19
17Corigliano40 9 5818 15 41.000.970.54
18Corigliano40 7 4018 14 331.000.440.35
19Cutrofiano40 7 1618 10 491.121.120.25
20Cutrofiano40 4 5418 13 11.151.150.23
21Cutrofiano40 11 4018 7 581.131.130.51
22Soleto40 12 2218 12 11.000.720.52

