Locating Sustainability Issues: Identification of Ecological Vulnerability in Mainland China’s Mega-Regions

1
Nanjing Institute of Geography and Limnology, Chinese Academy of Sciences, Nanjing 210008, China
2
University of Chinese Academy of Sciences, Beijing 100049, China
3
Key Laboratory of Watershed Geographic Sciences, Nanjing Institute of Geography and Limnology, Chinese Academy of Sciences, Nanjing 210008, China
4
School of Geographical Science, Nantong University, Nantong 226007, China
*
Author to whom correspondence should be addressed.
Sustainability 2017, 9(7), 1179; https://0-doi-org.brum.beds.ac.uk/10.3390/su9071179
Submission received: 29 March 2017
/
Revised: 9 May 2017
/
Accepted: 1 June 2017
/
Published: 5 July 2017
(This article belongs to the Section Sustainable Urban and Rural Development)
Abstract
:This paper presents a spatial analysis of likely/potential hotspots of sustainability issues in Mainland China through an empirical investigation of patterns of ecological vulnerability in and of China’s megaregions. To be specific, this paper assesses the level of patterns of the ecological vulnerability of 16 megaregions through an indicator system, which includes soil erosion, desertification, ecosystem vulnerability, key ecological areas, and water and land resources. Empirical results reveal that while most megaregions are located in the less vulnerable areas, there are a couple of megaregions with a vulnerable basis of ecological environment. These megaregions consist of Chengdu-Chongqing, Guanzhong Tianshui Economic Zone, Shandong Peninsula, Wuhan City Circle, Beijing-Tianjin-Hebei, and Liaoning Coastal Belt. Furthermore, a typology of these megaregions is identified based on their development level and ecological vulnerability.
1. Introduction
Sustainable development has emerged as a common objective in an increasingly interconnected world. The recent “Rio + 20” Summit of the United Nations, hosted by Brazil in June 2012, for instance, has reiterated the need to address sustainable development issues all over the world. Although the need for “sustainable development” clearly has a global allure, it is obvious that China is fast emerging as one of the countries where the challenges are profound: its well-documented achievements in terms of rapid economic growth, paralleled by fast urbanization, obviously go hand in hand with many potential and actual ecological and environmental problems (e.g., farmland shrinking, forest reserves facing exhaustion, scarcity of water resource, increased pollution of water and air, etc.). Mainland China can thus be called a hotspot for likely/potential sustainability issues, and it is therefore no surprise that the Chinese government increasingly pays attention to a more balanced perspective of sustainable development where preservation and optimal use of the ecological environment goes hand in hand with continued and more balanced economic and social development. Ecological vulnerability thus emerges as an important theme against the backdrop of processes of urban and regional development in China, and the objective of this paper is to literally locate the intersection between both processes: we systematically identify where in China tensions between fast-paced growth in production and environmental sensitivity are likely to occur.
In this study, we investigate the intersection through the meta-geographical lens of “megaregion”. As early as in the 1960s, Gottmann’s identified “megalopolis” to conceptualize the urbanized belt along the northeastern coastal United States [1]. Afterward, along with the decentralization of economic production, the changing forms of urban development has been intensively documented to capture the dynamics of the cities and their economically and politically connected hinterlands [2,3,4,5]. Notions of “megaregions”, “city-region” and “metropolitan area” are developed to conceptualize the cross-boundary urban development and governance philosophy. Even these concepts are related, they accentuate varied connotation of this emerging spatial organization. In this research, we adopt the concept of “megaregions” to stress the functional characteristics of city-regions [3], which is deemed to be a new spatial scale to explore urban sustainability [6].
In order to tackle the analysis of the ecological vulnerability of megaregions, Liu et al. [7] have established a conceptual framework focusing on tripartite balance between “economy-society-ecology”. Furthermore, there has been flanking research on the development of a “green economy” [8], “eco-cities” (ecological city) [9,10] and “ecosystem services” [11] in China’s urbanizing regions. In this context, Dou et al. [12] (p. 430) have suggested that “implementing the development strategy (focusing on the) eco-city is the most effective way to achieve sustainable development of urban areas”. This implies that the development of mega-regions does not come at the expense of a “healthy” ecological environment, while their developmental potential has to be considered against the backdrop of the nature and the overall degree of ecological vulnerability [13,14]. In this paper, we contribute to this literature through a systematic, GIS (Geographic Information System)-based analysis of the spatial articulation of the intersections between ecological vulnerability and megaregion-formation in Mainland China.
The remainder of this paper is organized as follows. In the second section, we position the research on megaregions in the context of the sustainability literature. This is followed in the third section with a discussion of our methodology: we specify the notion of “megaregions” in the Chinese context, and briefly introduce their development levels s, according to a recent research (for more details, please refer to [15]). The fourth section is main part of this research which is to connect the spatial patterns of development/ecological vulnerability for reflecting on the macro-geography of potential sustainability problem hotspots in Mainland China. In the conclusions, we provide an overview of our main findings.
2. Megaregions and Their Ecological Vulnerabilities in Mainland China
China’s urbanisation has a clear-cut regional dimension: most of its major cities are part of broader regional clusters of cities of varying sizes. In literature, the “megaregion” is more likely an empirical existence and by-product during the regionalization process possessing particular economic, cultural, institutional or political characteristics [16,17]. Nowadays, as people and places are more closely connected, megaregions, socially constructed from within, is recognized as the “space of flows” of the population, information and goods [18]. Accordingly, many efforts have been made to explore the functional connectivity among cities at the regional scale [19]. Previous studies also focused on various development factors and their relations at the city-region scale, as well as the specific regional institutions of economic functions [20]. In view of city-region’s long-term development, Parr [21] analyzed the interactions between the central city and its surrounding hinterlands through the flows of labor forces, trade, commuting, and capital, and subsequently identified a pattern of centralization followed by decentralization in England. In the POLYNET project, Hall and Pain [22] identified a polycentric structure within some European mega-city regions where cities were separated by physical distance but networked functionally. In the context of economic globalization, some concepts such as “global cities” [23], “global city-regions” [24], and “mega-city regions” [22] are widely used in academics reflecting the rising interest in “region”. As megaregions increasingly represent the hotspots for human and economic activities, a profound understanding of the ecological-environmental sustainability in those regions is of prime importance. Consequently, in this paper we employ the notion of megaregion not only as a product of economic activities and policy agendas but also as an analytical perspective to explore the sustainability issues in regional China.
Analyses of sustainability usually put an emphasis on the interactions between human activities and the natural environment [25]. Major themes in the sustainability literature are the analysis of the carrying capacity of the resource base and the environment at large [26], energy balances [27], and the need for coordinated development between economic growth and environmental protection [28]. It is now widely recognised that sustainability implies a balanced coordination between the natural environment on the one hand and economic and social conditions on the other hand—i.e., the now-classic ”three pillars of sustainability” [28,29]. Furthermore, a well-preserved and well-protected ecological environment has become an important dimension in considerations of regional sustainability. For instance, Childers [25] (p.320) had argued that “(u)rban ecology increasingly contributes to urban sustainability”. Unsurprisingly, then, assessing how ecological equilibria are influenced by continuous human disturbance has drawn increasing scholarly attention in many parts of the world, as the success of the present journal attests [13,30,31,32,33,34,35,36,37,38,39]. Various geographical foci thus emerge, and include urban areas [14,33], mountain zones [32] maritime regions [35,40,41], and coal mining areas [42]. Many of these studies draw on spatial analysis supported by geographic information system (GIS) to study ecological vulnerability and often combine different indicators, such as soil erosion, desertification, animal diversity, net primary productivity, and the nature of human activity [31].
Against this backdrop, the literature on sustainability issues in Mainland China has been developing rapidly, and now includes a range of scalar approaches and geographical foci. The spatial scale of analysis ranges from the national scale to the provincial scale [28], and also often zooms in on the urban scale [26], and sometimes even the neighbourhood scale as in a recent study of Wujin District, Changzhou City [43]. It has been argued that research on sustainable development in Mainland China speaks, to some extent, more systematically to the three pillars of sustainable development as many analyses focus on integrating ecology, sociology and economics [44]. In addition, the focus on developing a “green economy” is emerging as one of the most important topics in sustainable development studies in Mainland China [45]. One key area of attention is that China’s fast-paced economic development goes hand in hand with equally fast-paced urbanization, with the share of the nation’s population living in cities having increased from 17.9% to 52.6% between 1978 and 2012 [46]: in order to accommodate the vast growth of economic activities, many cities in Mainland China have boomed, and this clearly poses great challenges to achieving sustainable development [26].
3. Methodology
3.1. Identification of Megaregions and Their Development Levels in China
The megaregions used in this study are derived Duan et al.’s [15,47,48] analysis of “Economic Polarized Areas” (EPAs). Its identification and assessment of development level have been recently presented in Duan et al. [15]. To make the paper self-standing, here we restrict ourselves to the rationale of the “EPAs research”, the basics of the data gathering and processing, and main results. Readers are referred to the original paper for more details [15].
EPAs which identification is based on classical growth pole theory are detected by a combined evaluation of the degree of functional integration within regions and policy-based criteria as recognized by the central government for playing a strategic role in the national economic development. For development level, a score is calculated through a generalized entropy method. The data sources from (1) China City Statistical Yearbook 2013; (2) China Transportation Yearbook 2012; (3) www.FortuneChina.com, consulted in October 2012; (4) Chinese Yearbook of cultural relics, 2013 [15].
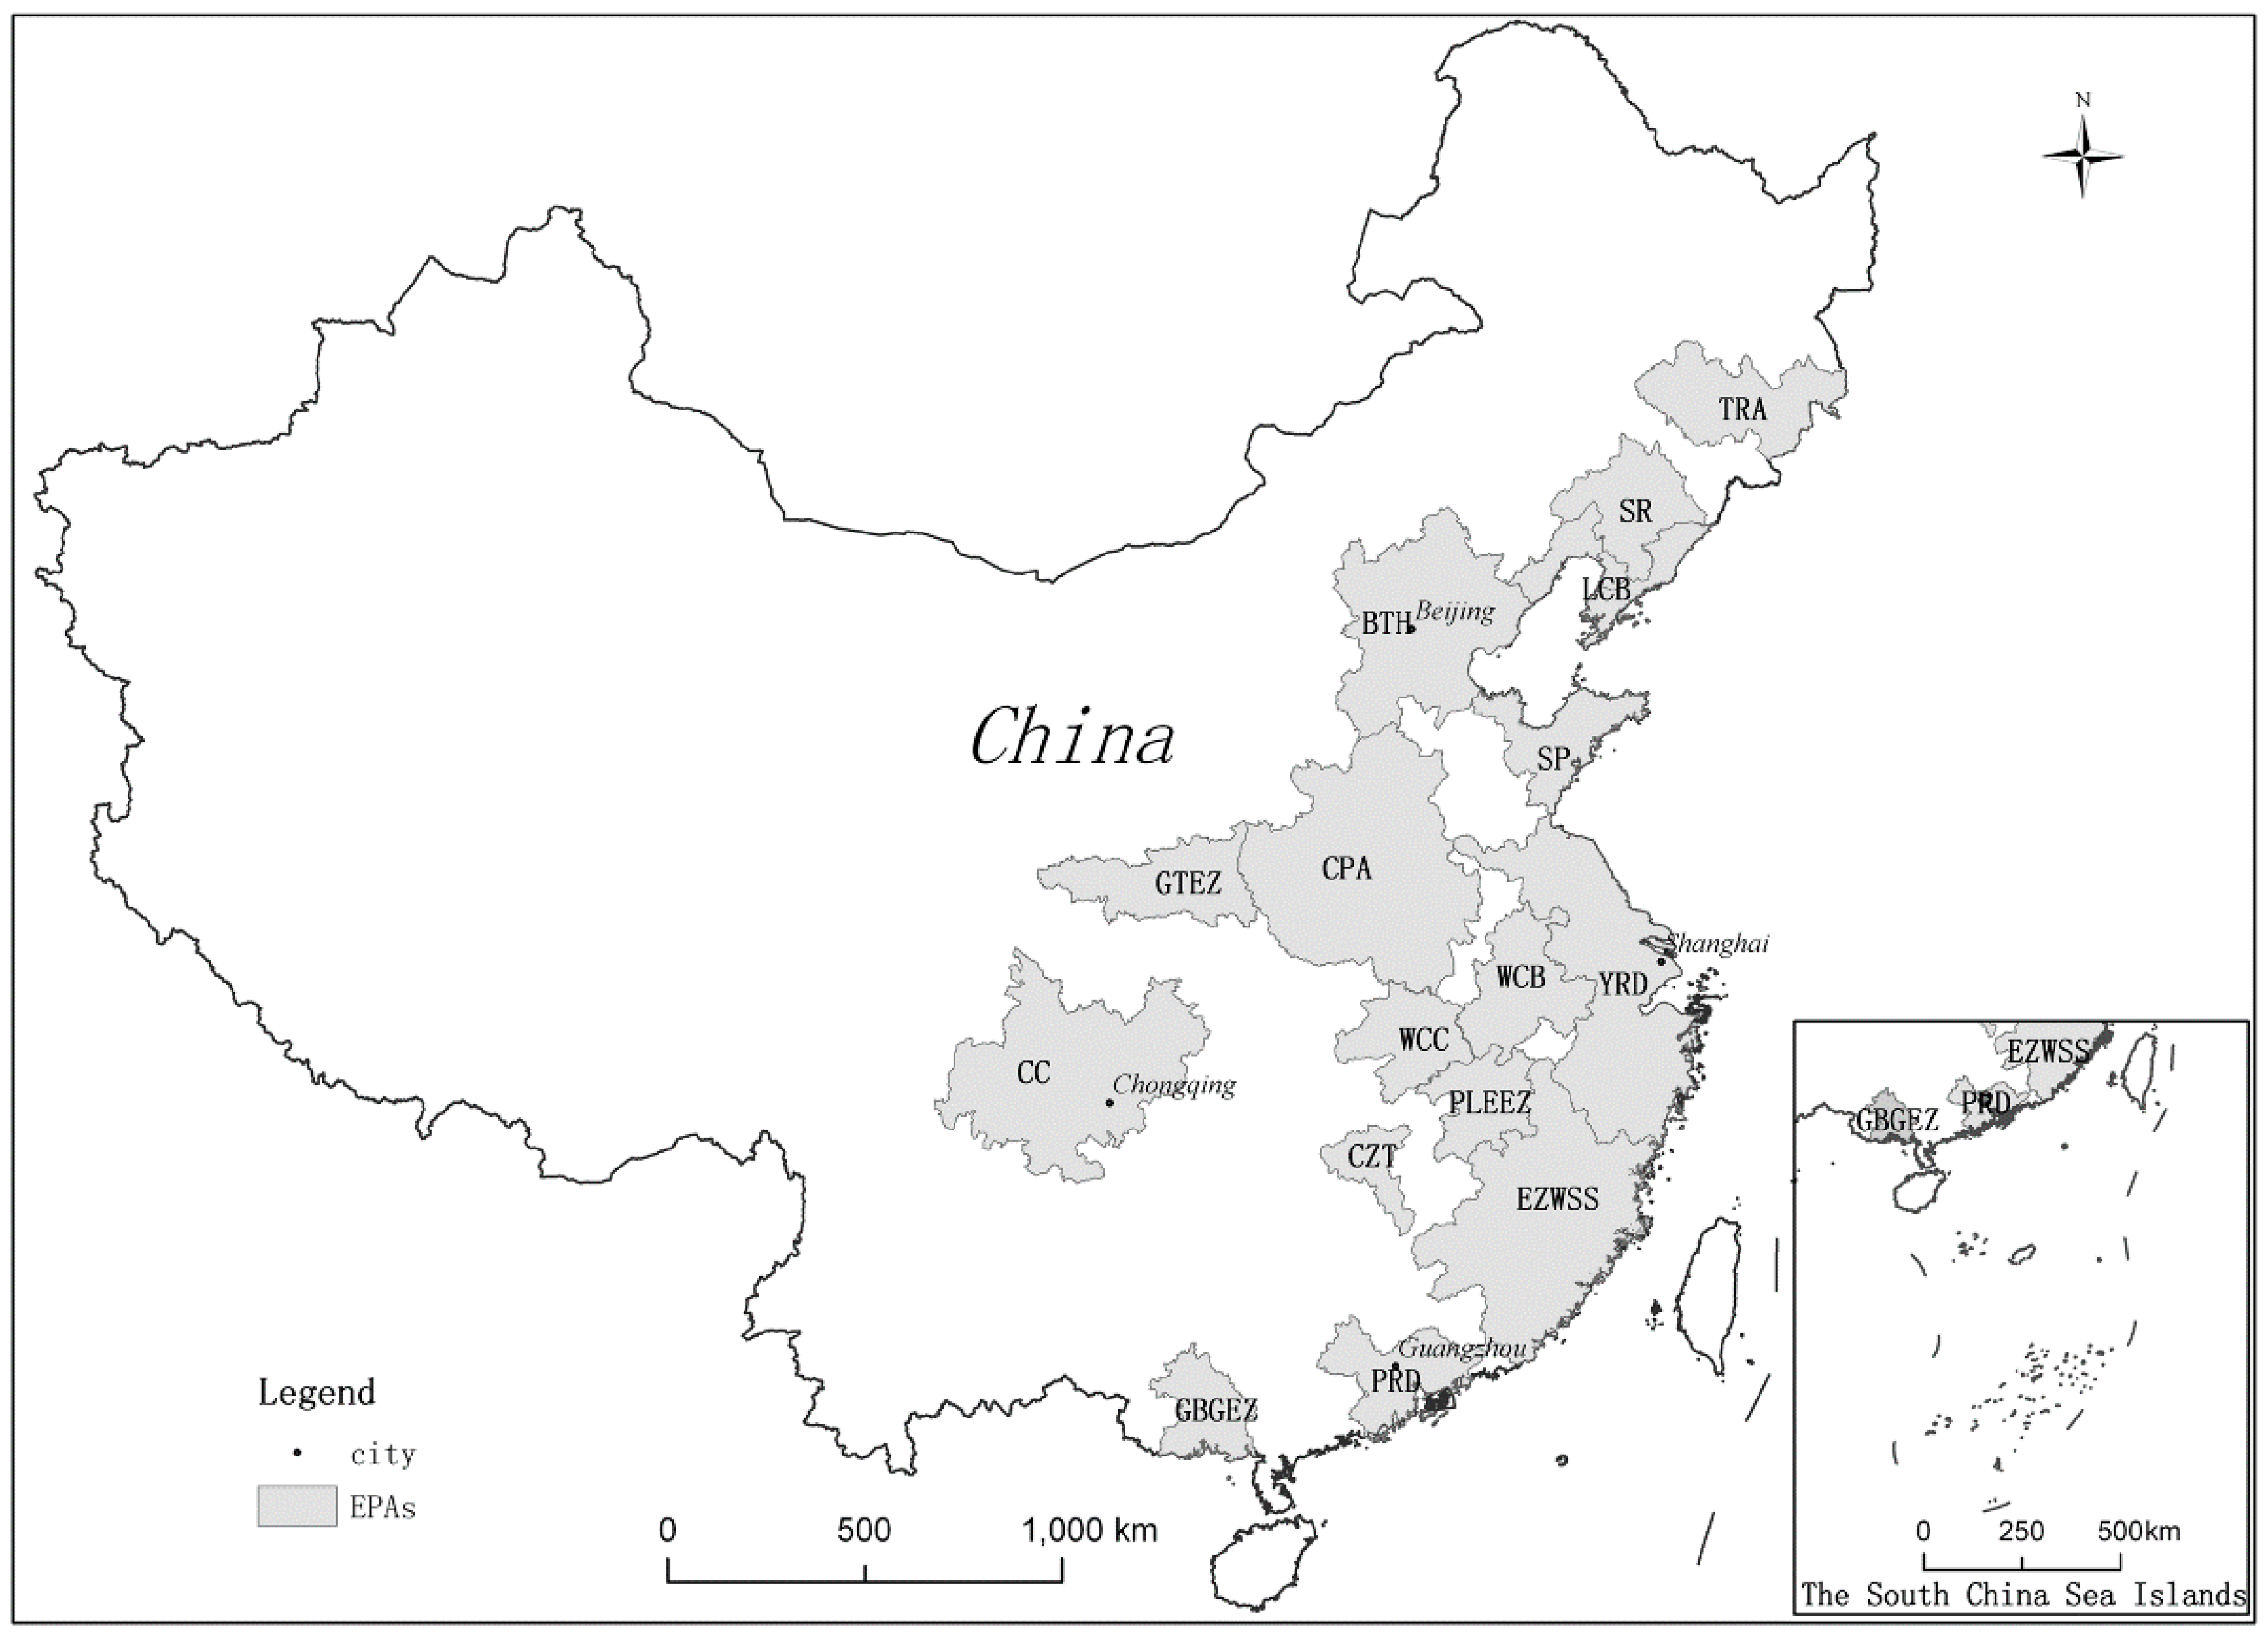
The identification of megaregions and evaluation of their development levels build on a combination of four functional categories including command and control, economy, humanities and innovation with 16 indicators. In general, a total of 16 EPAs are thus identified [15,47,48]: (1) the Yangtze River Delta (YRD), (2) Beijing-Tianjin-Hebei (BTH), (3) the Pearl River Delta (PRD), (4) the Central Plains Area (CPA), (5) the Economic Zone on the West Side of the Straits (EZWSS), (6) Chengdu-Chongqing (CC), (7) Shandong Peninsula (SP), (8) Shenyang Region (SR), (9) the Liaoning Coastal Belt (LCB), (10) Wuhan City Circle (WCC), (11) Wanjiang City Belt (WCB), (12) the Guanzhong Tianshui Economic Zone (GTEZ), (13) the Chang-Zhu-Tan city group (CZT), (14) Poyang Lake Ecological Economic Zone (PLEEZ), (15) the Tumen River Area (TRA), and (16) Guangxi Beibu Gulf Economic Zone (GBGEZ) (Figure 1). In this paper, we use the 16 EPAs as our basic spatial unit for evaluating ecological vulnerability and sustainable development strategy of China’s prospective megaregions. The development level score of China’s 16 EPAs see in Table 1.
3.2. Measurements of Ecological Vulnerability (EV)
A broad range of ecological indicators (e.g., soil erosion, ecosystem types, land resources, water resources, desertification, etc.) has been used in recent research for evaluating ecological vulnerability and sustainability [14,31,42,49]. Based on the existing research and data availability, we established the following indicator system.
First, we draw the ecological vulnerability map of China and evaluate the comprehensive ecological vulnerability of EPAs. The data of county-level administrative regions’ ecological vulnerability degree of China is provided by the Institute of Geographic Sciences and Natural Resources Research, Chinese Academy of Sciences (http://www.igsnrr.cas.cn/). According to the original data, we draw the ecological vulnerability map of China. Then with the boundary map of China’s megaregions, evaluate the comprehensive ecological vulnerability of EPAs in consideration of the whole degree of ecological vulnerability and proportion of severe ecological vulnerable regions in EPAs.
To calculate the whole degree of ecological vulnerability for each EPA, we apply the following function:
where DW represents the EPA’s whole degree of ecological vulnerability; di is the original ecological vulnerability of each county-level administrative region, i.e., 1, 2, 3, 4, and 5, represent respectively slightly, mildly, moderately, severely, and extremely vulnerable; ai is the area of each county-level administrative region in an EPA; and m is the number of county-level administrative regions in an EPA.
Then, we calculate the proportion of severe ecological vulnerable regions (original ecological vulnerability more than four, i.e., severely and extremely vulnerable county-level administrative regions) in EPAs, and mark the proportion as DP. We use the normalization function (2) to process the data of DW and DP, and get the DWN and DPN.
where Min(DW) and Max(DW) represent the lowest and the highest scores of DW. The values are thus transformed into a positive number with a scale ranging from 0 for the lowest-scoring region to 1 for the highest-scoring region.
Calculate the comprehensive ecological vulnerability by following function:
where DC represents the comprehensive ecological vulnerability in EPAs; a, b are weights, which are all equal to 0.5. We used equal weight of a and b based on the Technical criterion for ecosystem status evaluation [50], considering equal importance of DW and DP for ecological vulnerability evaluation. This evaluation results show in Table 2.
Second, maps of ecological indicators were collected from unclassified government bulletins and previous studies. These include the National key ecological function areas of China, the Available land resources per capita of China, the Available water resources per capita of China (data source from “National major function oriented zone planning” issued by the State Council of China, 2010) [51], the Soil erosion map of China, the Ecosystem types distribution of China (sourced from the Data Center for Resources and Environmental Sciences, Chinese Academy of Sciences (RESDC), http://www.resdc.cn), the Desertification distribution map of China (sourced from Environmental and Ecological Science Data Center for West China, National Natural Science Foundation of China, http://westdc.westgis.ac.cn), and the Rocky desertification land distribution in the Karst regions of China (sourced from “Rocky desertification bulletin of China”, issued by the Forestry Bureau of China, 2012).
Although some of these maps data are publicly available, they are rarely used in conjunction with each other, not least because they tend to be scattered in various bulletins of Chinese government departments and research institutes (e.g., the State Council of China, the Chinese Academy of Sciences, the Forestry Bureau of China, etc.). In our research, we combined these maps into ecological vulnerability, the ecological basis, and the resource basis.
3.3. Overlying Megaregions’ Development Levels of and EVs
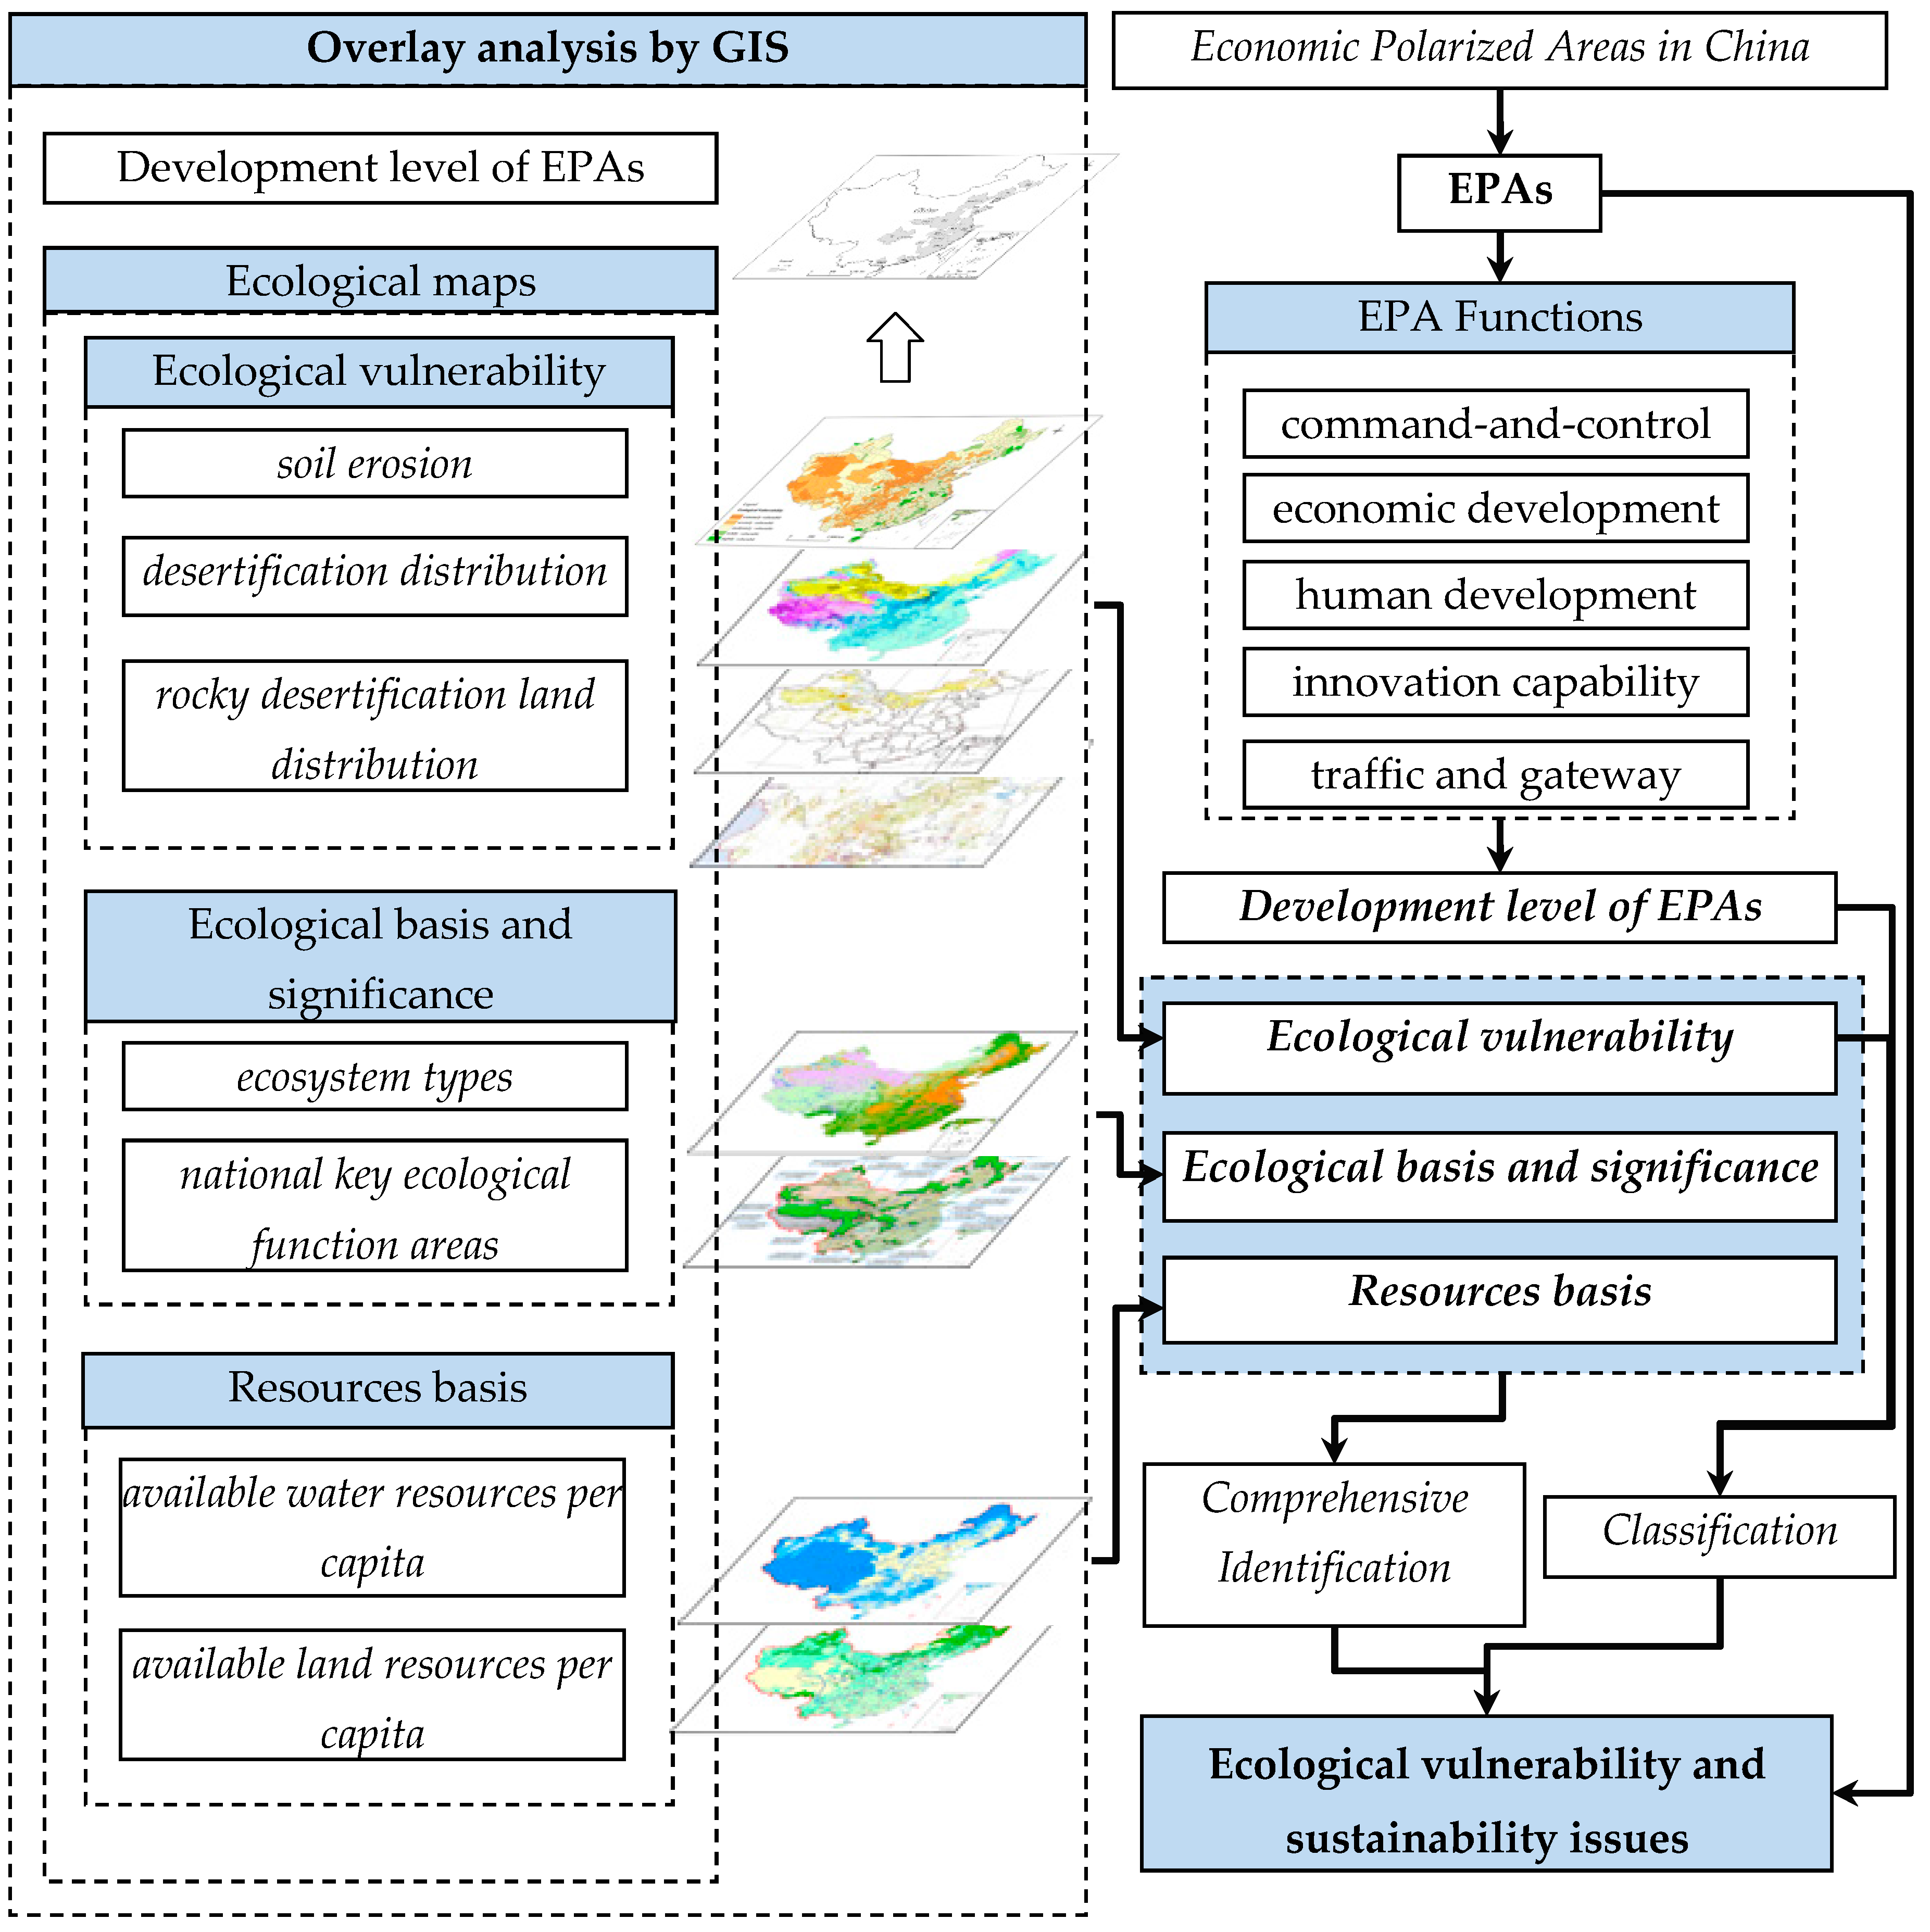
The overlap of the developmental level (DL) and the ecological vulnerability maps (EV) is assessed in a GIS environment (Figure 2). The analysis basically consists of overlaying maps (e.g., the boundary map of China’s megaregions and the ecological vulnerability map of China), and evaluating the degree of overlap (i.e., serious, moderate, mild and slight) between the different dimensions.
The overlay analysis includes overlapping two maps (e.g., the boundary map of China’s EPAs and soil erosion map of China), and evaluating each EPA’s degree (i.e., serious, moderate, mild and slight) of soil erosion (the larger extreme soil erosion areas of the EPA, the higher degree of soil erosion).The analysis between the maps of desertification and rocky desertification uses the same method as that of map of soil erosion. Overlapping the map of ecosystem types and the EPAs’ outline map reflects the ecological basis of EPAs (i.e., to calculate the ratios of forest and farmland ecosystem types in EPA), and overlapping the national key ecological function areas map and the EPAs’ outline map reveals the ecological significance of EPAs is used to explore the relationships between EPAs and national key ecological function areas, such as Chinese Loess Plateau soil and water conservation ecological function areas. These locational relationships include intersection (intersected areas more or less) and adjacency (adjacent distance far or near). The intersection relationship represents the EPAs’ ecological significances defined by relevant governmental departments. We quantify the ecological importance of the EPAs by calculating the percentage of its land areas covered by the national key ecological function areas. The greater percentages, the more responsibility and pressure of EPAs on the ecological environment protection.
The framework of analysis (Figure 2) presented two analysis clues: one is to evaluate the ecological vulnerability and identifying sustainable restriction combined “ecological basis and significance” and “resources basis” named as “comprehensive identification”, and the other is to divid 16 EPAs into four categories based on gauging the score of 16 EPAs’ development level and degree of ecological vulnerability named as “classification”. Then, based on the two clues we identified ecological vulnerability and located sustainability issues in the 16 EPAs.
4. Results and Discussion
4.1. Classification Patterns of the Economic Polarized Areas and Ecological Vulnerability
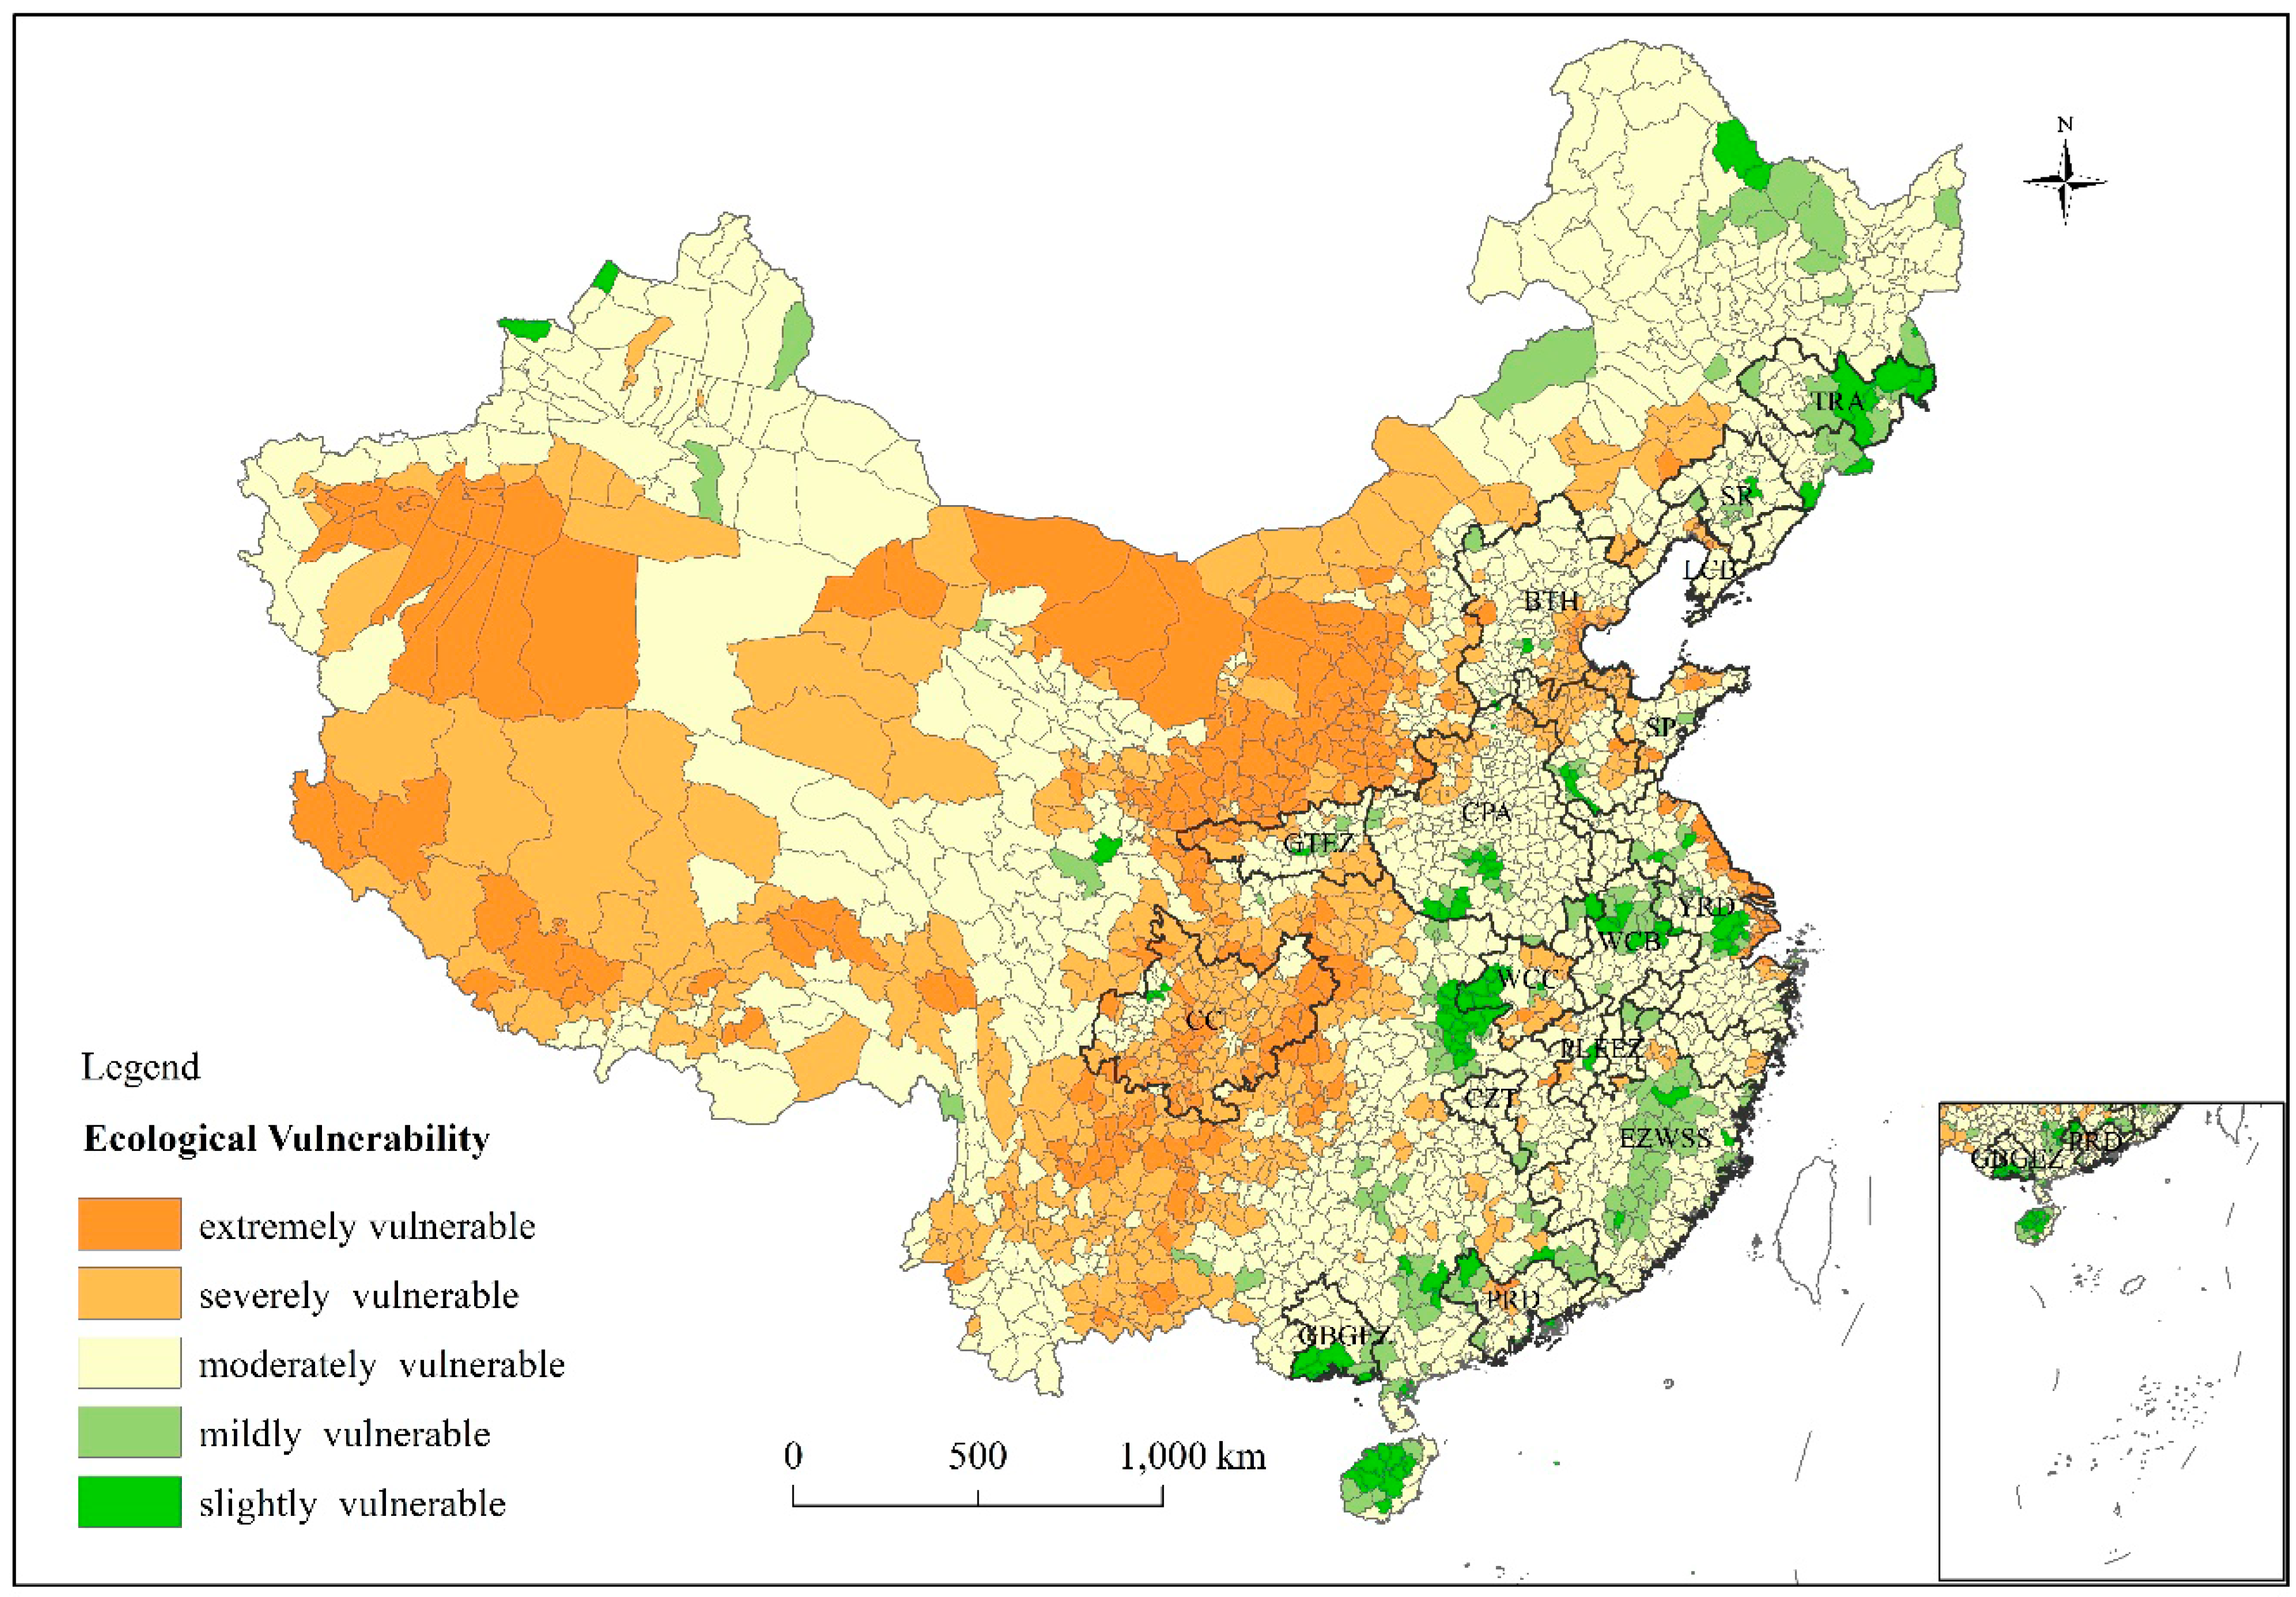
According to the statistics, extremely, severely, and moderately vulnerable ecological areas all together account for 55% of China’s total land area and they respectively account for 9.7%, 19.8% and 25.5% [51]. Large-scale and intensive industrialization and urbanization are usually concentrated in a very limited number of areas, as fostering China’s EPAs and their various functions must in principle be in line with these constraints of ecological vulnerability. Figure 3 maps the ecological vulnerability of Economic Polarized Areas in Mainland China. Table 2 presents the whole degree of ecological vulnerability of the region and severe ecological vulnerable regions’ proportion amongst the 16 EPAs. Inspection of Table 2 and Figure 3 reveals that some EPAs have a high whole degree of ecological vulnerability which are higher than grade 3 (CC, GTEZ, SP, BTH, LCB, YRD, CPA and PLEEZ), while other EPAs have a much lower whole degree of vulnerability which are less than grade 3 (WCC, CZT, SR, PRD, EZWSS, WCB, GBGEZ and TRA). There are high proportions of severe ecologically vulnerable areas amongst CC, GTEZ, SP and WCC whose figures are more than 30% of their respective land areas, especially as high as 81.8% amongst CC. Another type is that some EPAs have no severe ecologically vulnerable areas. Figure 3 confirms that the degrees of ecological vulnerability vary significantly amongst different EPAs. Overall, ecological vulnerability is higher in northern China than that in southern China, and higher in western China than that in eastern China. Most EPAs are located in the less vulnerable areas, which are more relatively suitable for economic growth and polarization.
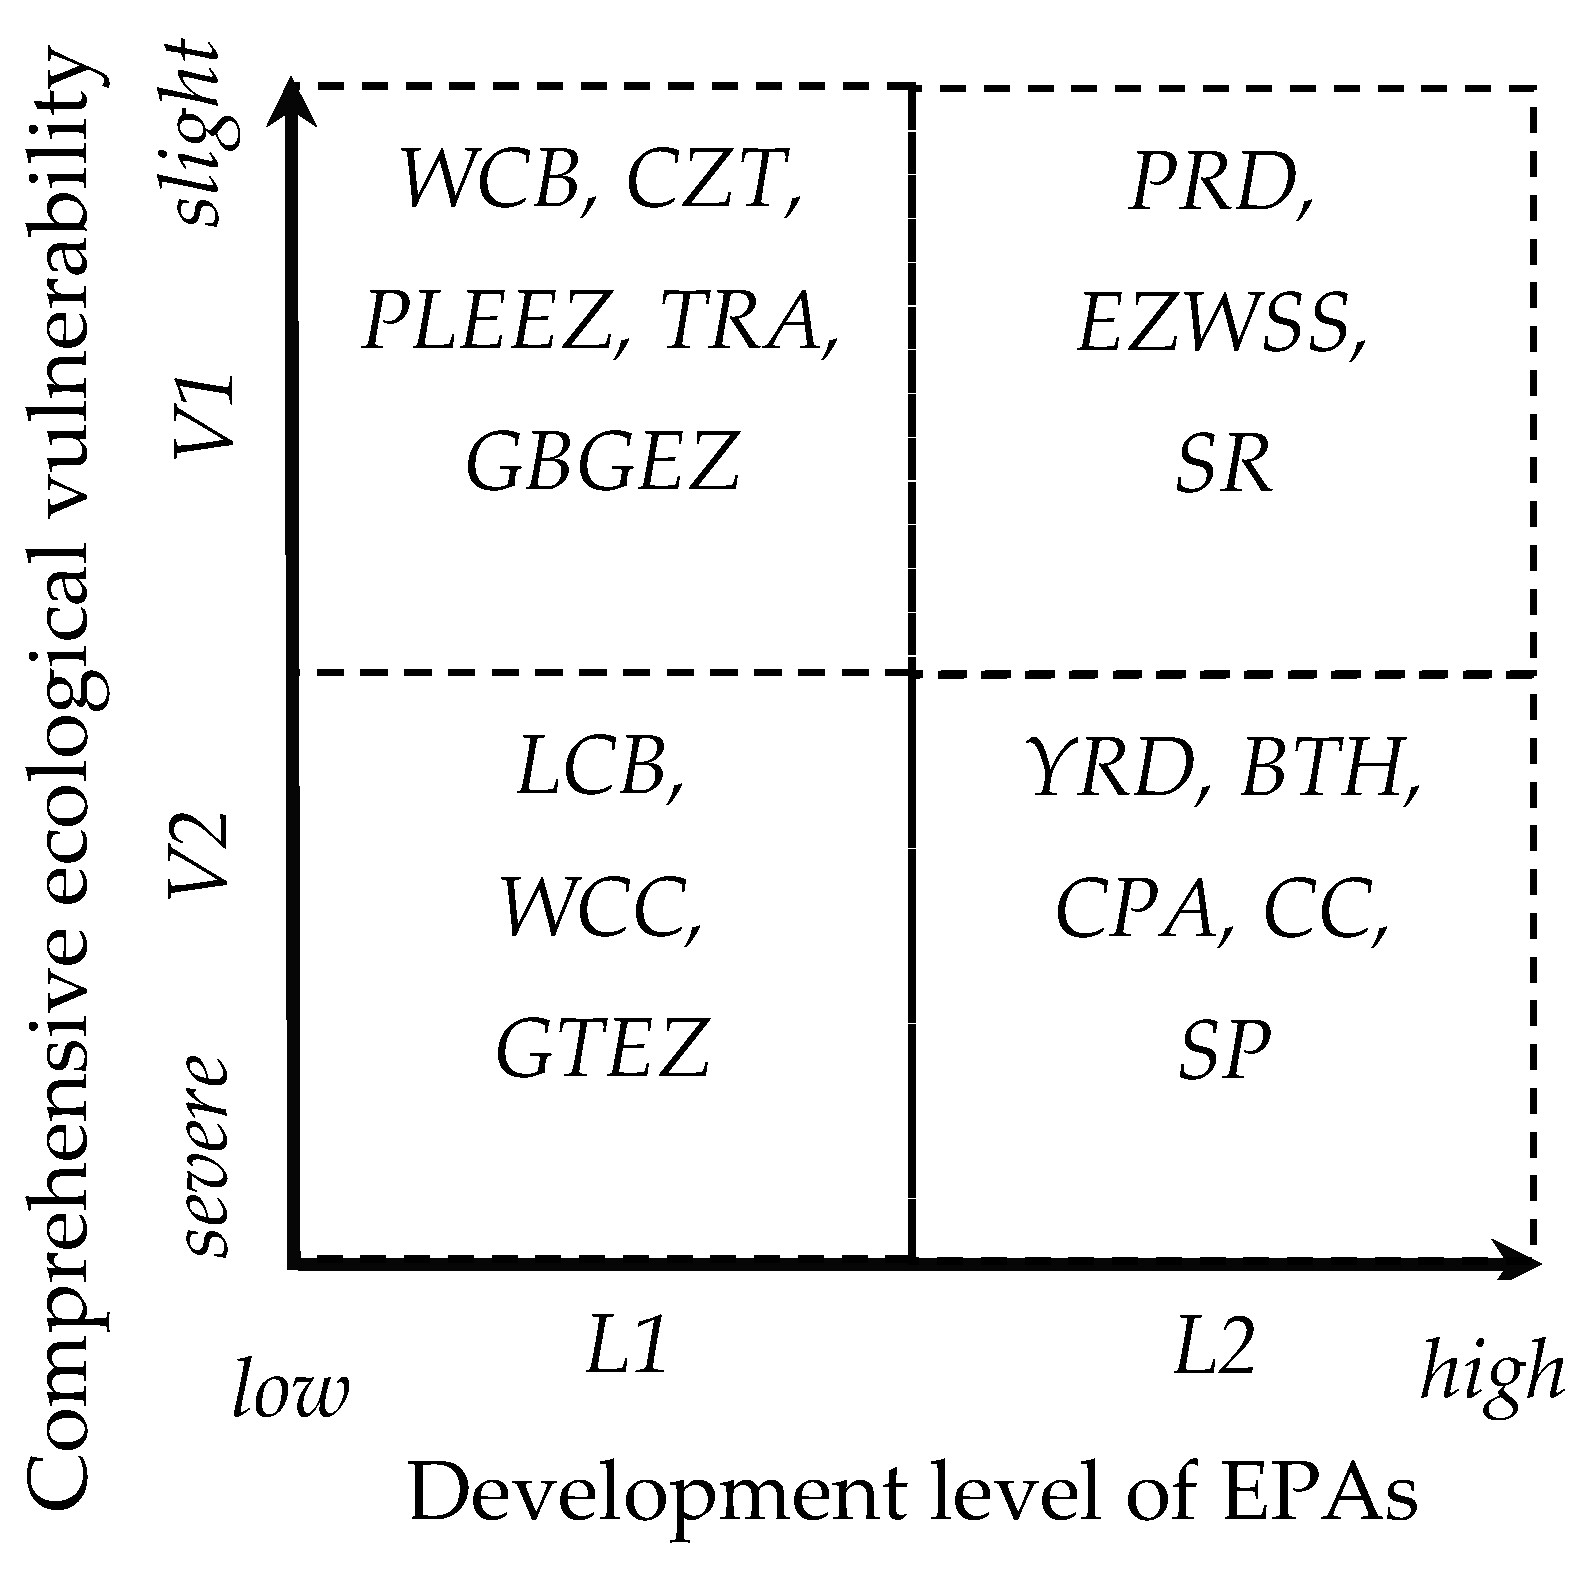
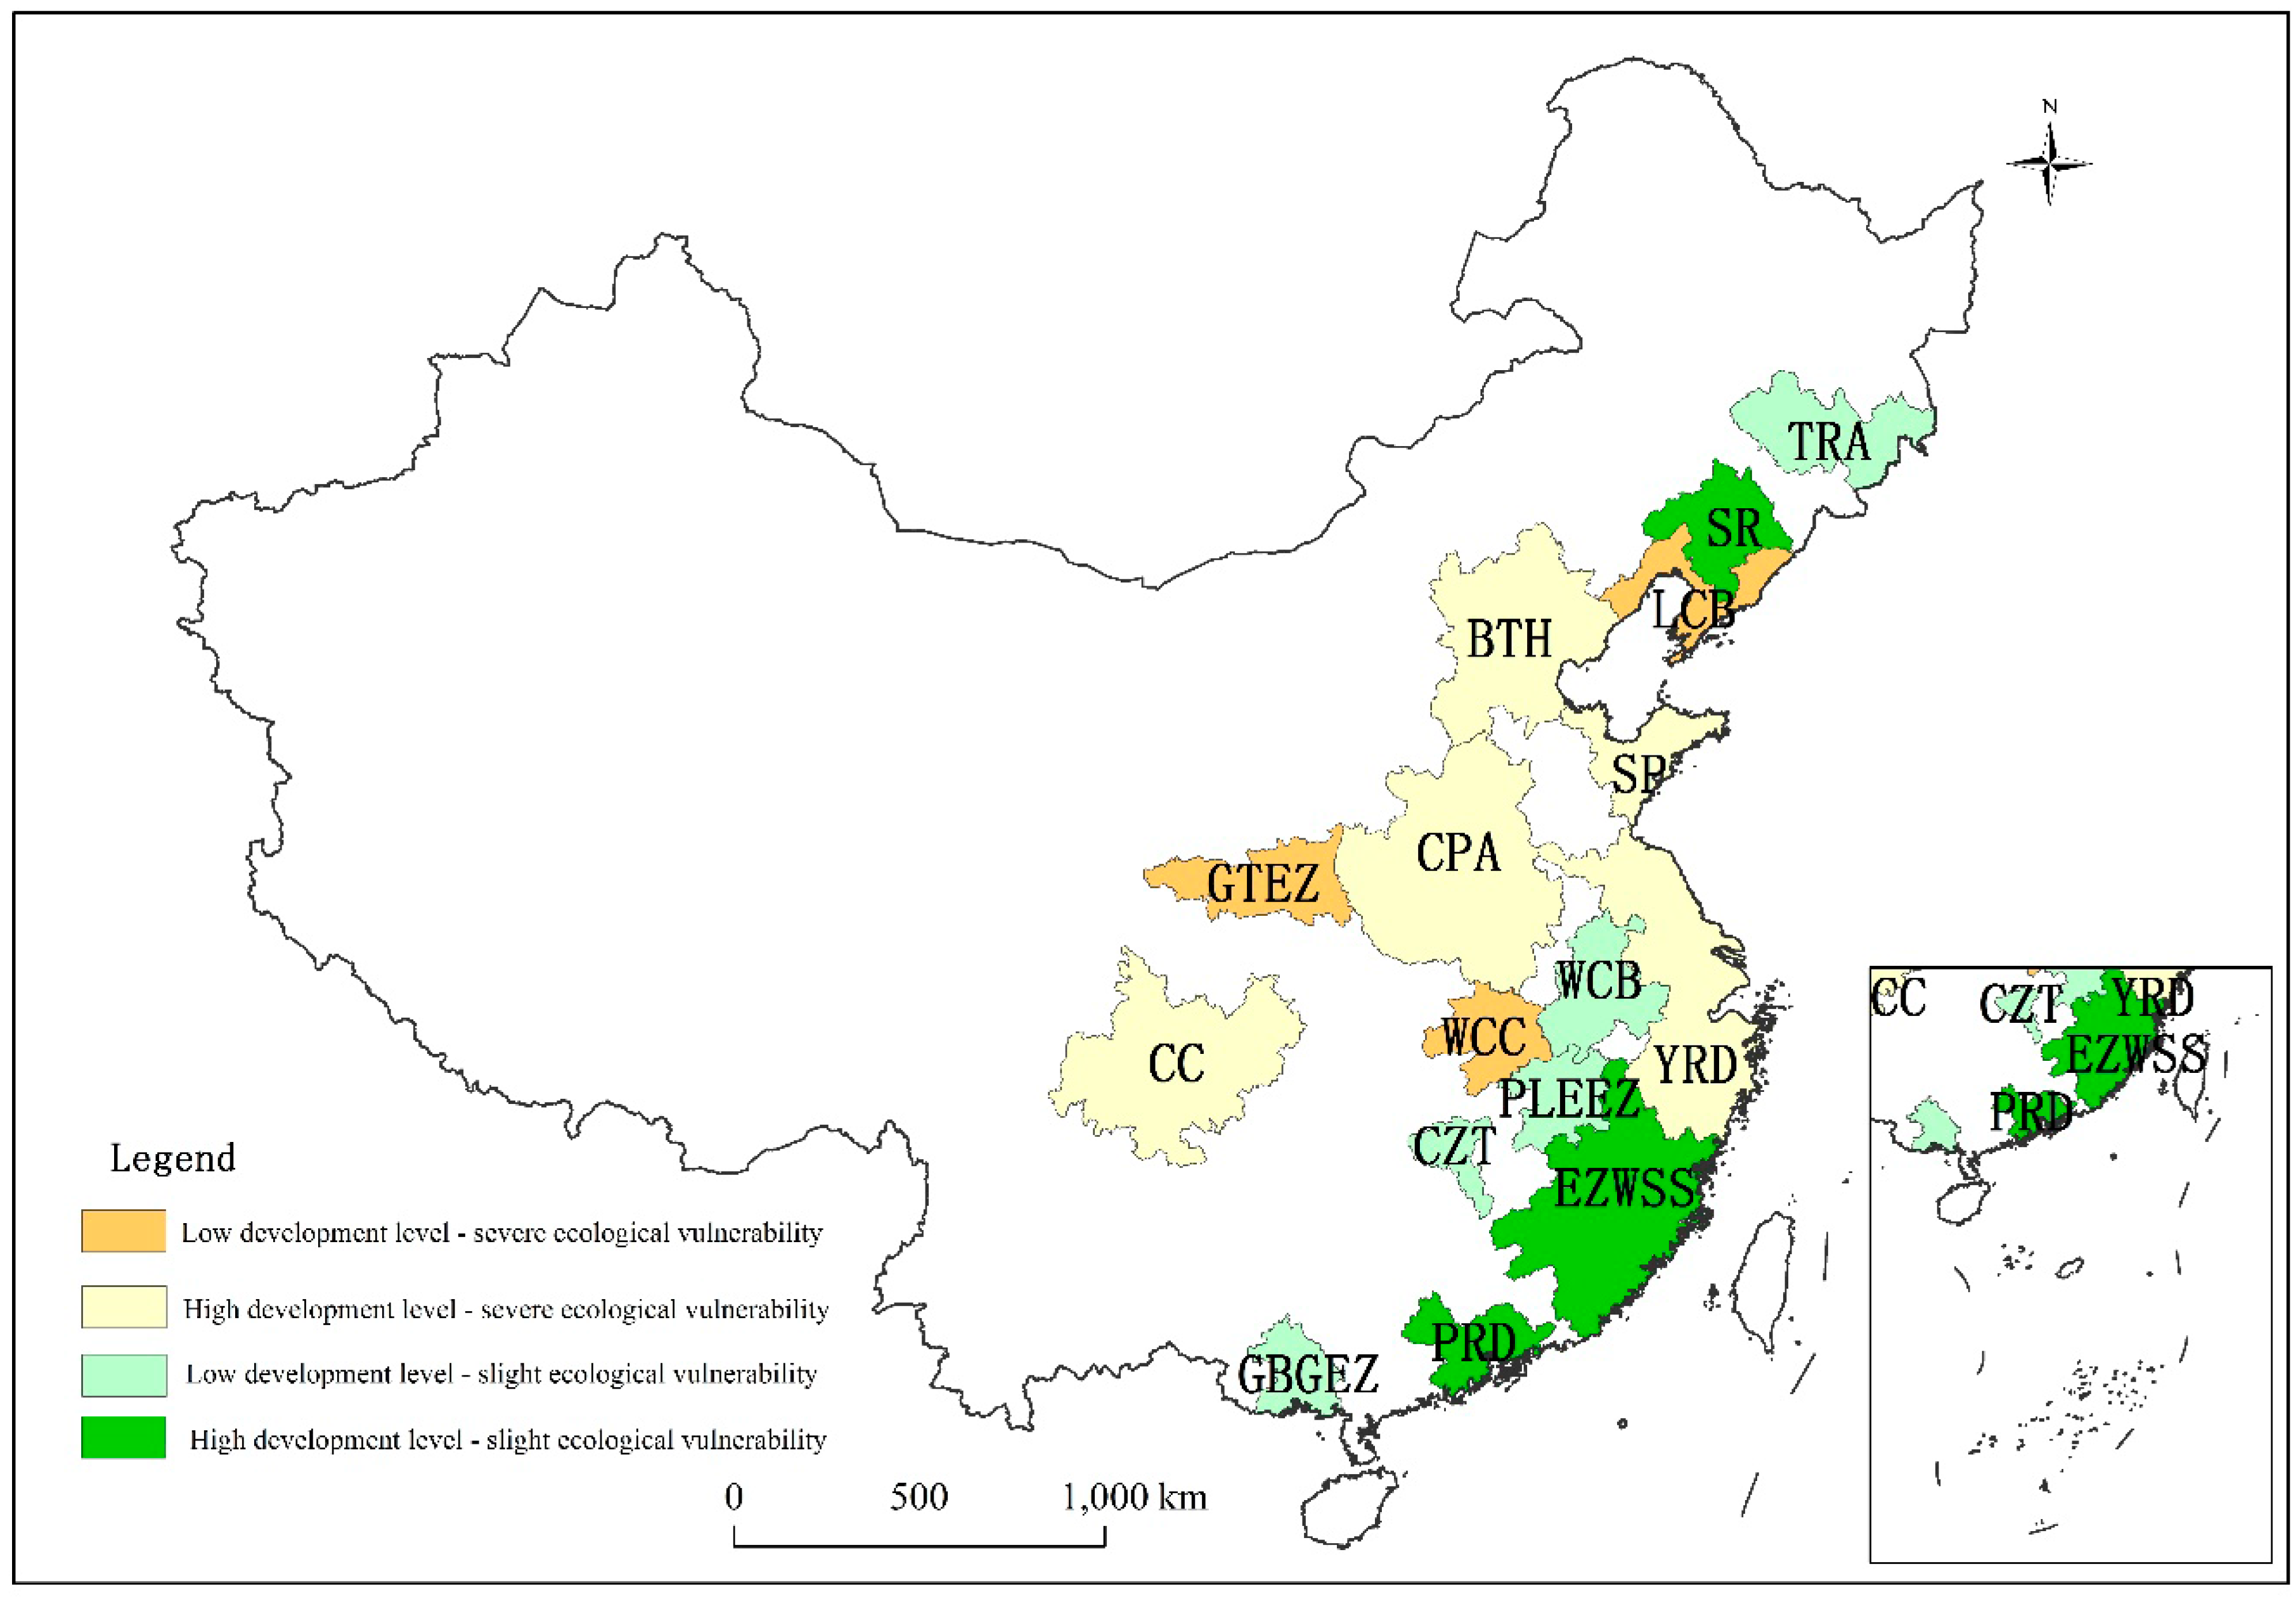
Figure 4 compares individual EPA’s ecological vulnerability and development level. We divide 16 EPAs into four quadrants according to the ranks of EPAs’ comprehensive ecological vulnerability and development level, namely low development level-severe ecological vulnerability, high development level-severe ecological vulnerability, low development level-slight ecological vulnerability and low development level-slight ecological vulnerability(see Figure 4 and Figure 5), in order to further analyze the relationship between the development level and ecological vulnerability and explore sustainable development problems among the EPAs.
4.2. Spatial Differentiation of Vulnerability Factors in the Economic Polarized Areas
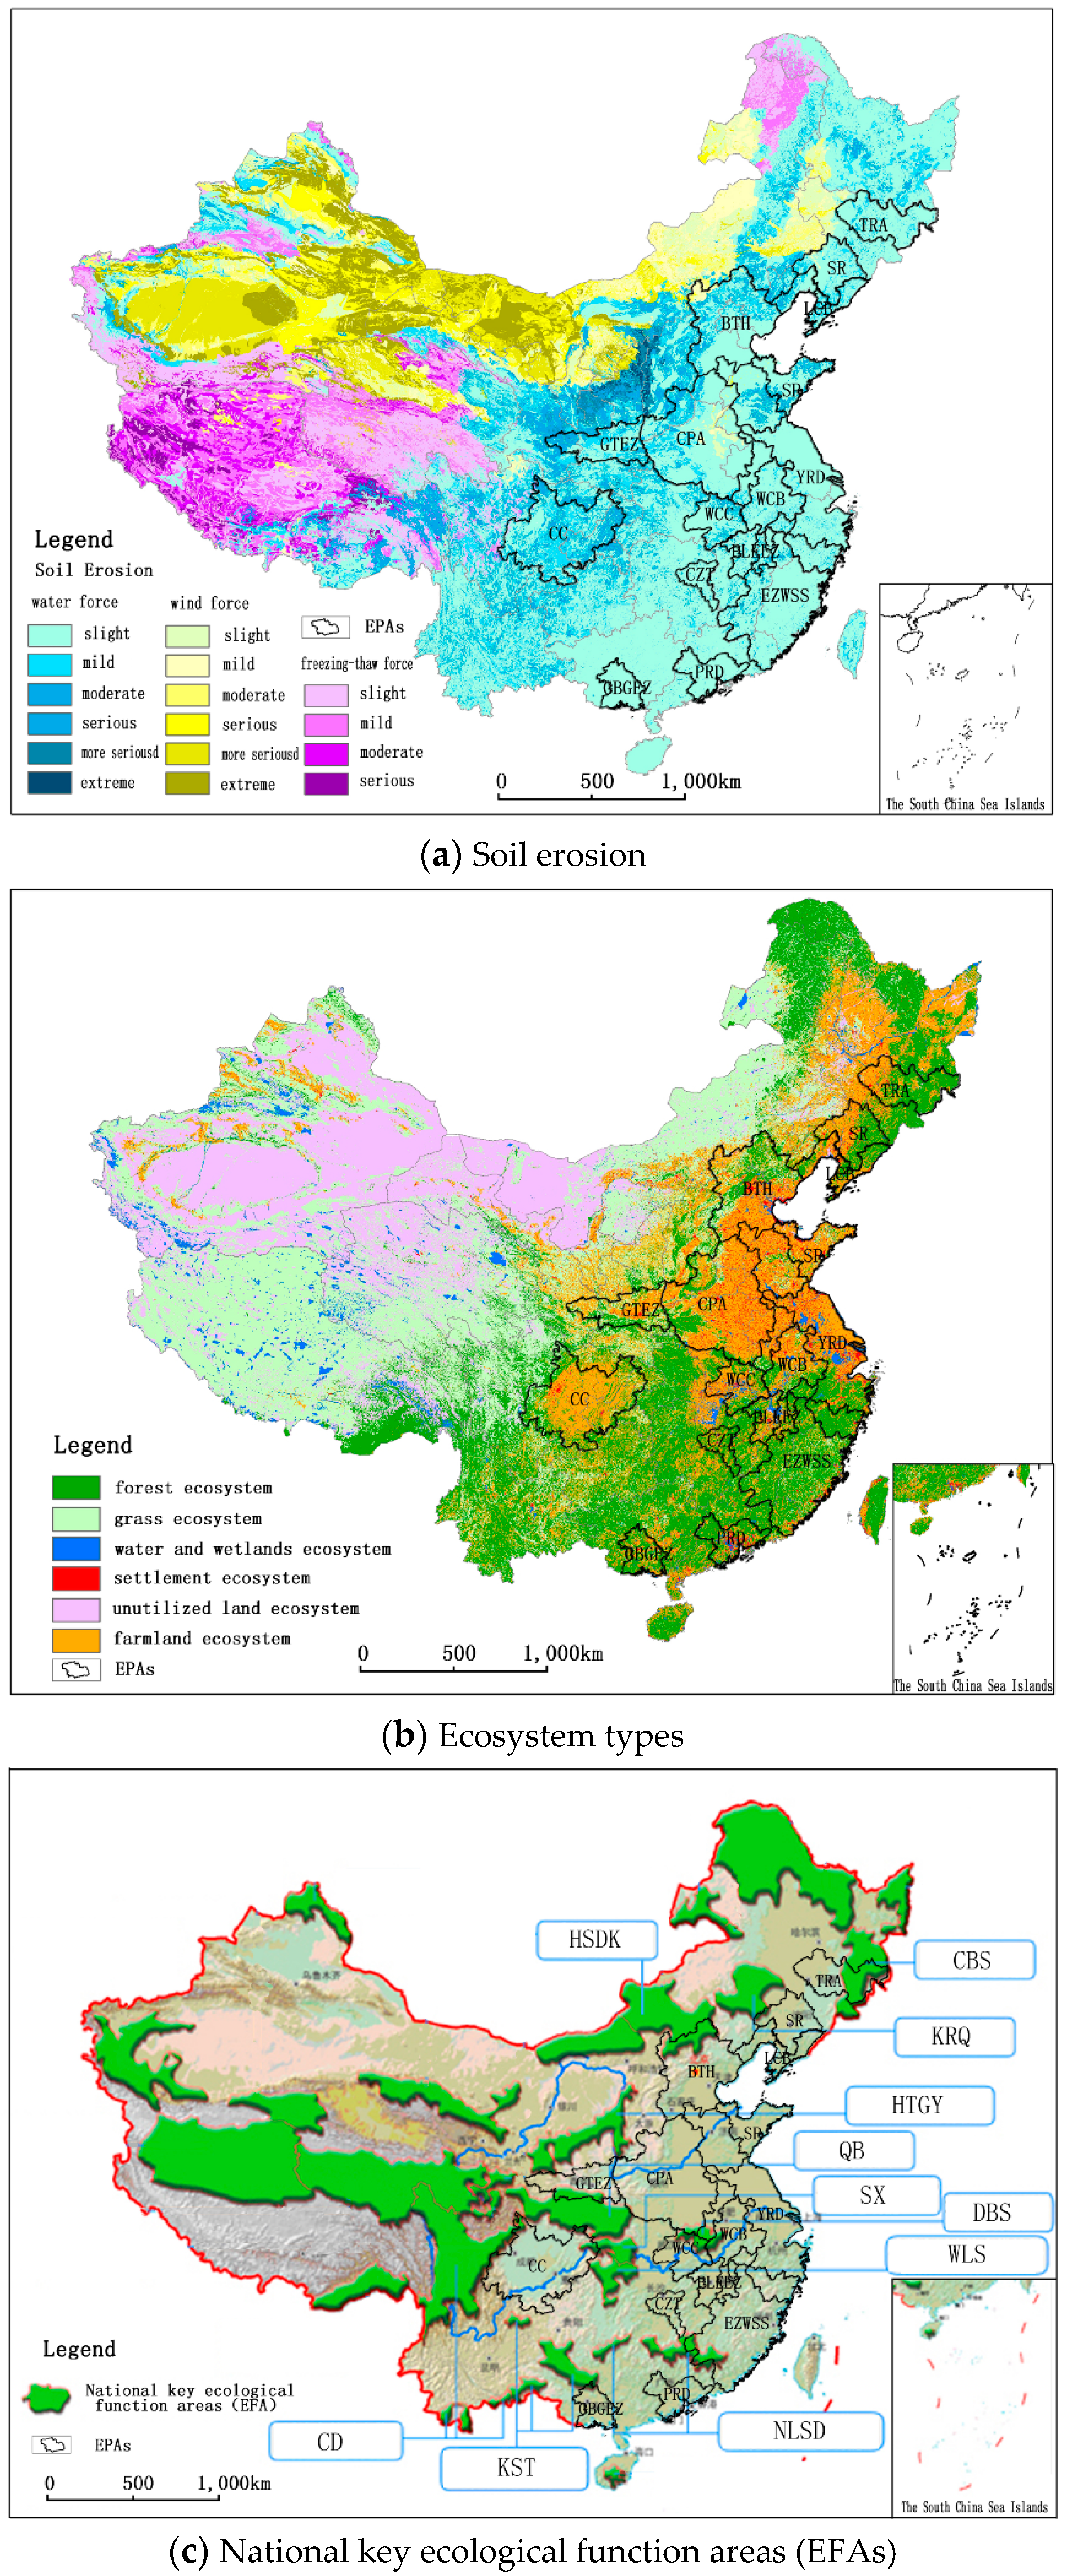
The presence of ecological vulnerability’ main dimensions (i.e., soil erosion, desertification and rocky desertification) in the 16 EPAs is summarized in Table 3, including the presence of national key ecological areas of China. Figure 6, in turn, maps the 16 EPAs into the different ecological maps, with the first of these (Figure 6a) focusing on soil erosion.
Soil erosion is one of the most important factors affecting regional ecological vulnerability. The agents of soil erosion include water, wind, and freezing–thaw cycles. According to our analysis, water is the primary agent of soil erosion for the 16 EPAs. There is 2,949,100 km2 of land area affected by soil erosion, accounting for 30.72% of China’s total land area. Land areas affected by water erosion and wind erosion are 1,293,200 and 1,655,900 km2, respectively [52]. Soil erosion decreases land productivity and increases sediment accumulation in rivers, reservoirs, and lakes. This hinders the development of the economy and society. Cursory and initial inspection of Table 3 and Figure 6a reveals that EPAs with higher degrees of soil erosion include CC, GTEZ, and CPA (Figure 6a, and Table 3).
Desertification (i.e., desertification or rocky desertification) is one of the key vulnerability factors. China’s desert areas cover 1,731,100 km2, accounting for 18.03% of the total land area, and includes most of China’s provincial level administrative units. According to the State Forestry Administration of China, overall land desertification in China is under control, and the desertified land area continues to decline. A few of the EPAs, such as BTH, CPA, and SR, (Table 3) are less affected by desertification. Beijing–Tianjin–Hebei and the Liaoning Coastal Belt are under threat of potential desertification. It has been reported that frequent sandstorms affect industrial production and people’s daily lives significantly in these regions. The two EPAs are also responsible for protecting ecology as in where some national ecological reserves are located, such as the Keerqin grassland ecological areas and the Huishandake desertification prevention and control ecological areas (Figure 6c). Another desertification region among the 16 EPAs is the Central Plains Area where large amounts of sediments have been deposited over millennia by the Yellow River and then shaped into sand belts by the wind. Rocky desertification areas occur in the southwest karst region of China. Rocky desertification mainly occurs on the Yunnan–Guizhou plateau, covering 8 provinces. These places are very important ecological niches, such as the source areas of the Pearl River, the Yangtze River water-supply area, and the Three Gorges reservoir region. Rocky desertification is the region’s most serious ecological problem and affects the ecological security of the Pearl and Yangtze rivers. By the end of 2011, the land area of rocky desertification was 120,020 km2, accounting for 26.5% of the karst land area, and 11.2% of China’s land area [53]. EPAs with rocky desertification include Chengdu–Chongqing, the Guangxi Beibu Gulf Economic Zone and Chang–Zhu–Tan city group (Table 3).
The ecological service function of land use is mainly reflected in biological resources production, soil erosion prevention, desertification and salinization prevention, microclimate improvement, air and water purification, and biological diversity maintenance [54,55,56]. Based on land use types, there are seven types of ecosystem in mainland China, including farmland, forest, grass, water and wetlands, desert, settlement, and unused land [57]. Among the 16 EPAs, farmland ecosystems are mainly located in CPA, northern YRD and CC. The southern YRD, EZWSS, and northern BTH are rich in forest ecosystems. The GTEZ and CC are rich in grassland ecosystems, while YRD, WCC, PLEEZ and WCB are rich in water ecosystems (Figure 6b). The EFAs (National key ecological function areas of China) are important areas for national ecological security protection. Comparatively, these regions have higher pressure to coordinate human activities and ecological-environment. As shown in Figure 6c and Table 3, most of the EPAs are positively correlated with EFAs.
Available water resources among the 16 EPAs are unevenly distributed, with abundant water in the south and scarcity in the north. Available water resources per capita in some EPAs (BTH, SP, GTEZ, CPA, and CC) are less than 500 m3/year (Figure 6d). In contrast to water resources, available land resources are more abundant in the north than in the south. Some EPAs in southern China (YRD, EZWSS, PRD and GBGEZ) are lacking in land resources (Figure 6e). Water and land resources are the basic foundations of regional social and economic development, and their uneven distribution among the 16 EPAs influences economic activities and their sustainable development.
4.3. Comparison of Vulnerability Factors of key Cities in Economic Polarized Areas
To further understand geographical differences of ecological vulnerability factors in EPA’s from the perspective of their cities, we choose Beijing (in BTH), Shanghai (in the YRD) and Chongqing (in CC) as representative cities which locate in northern, eastern and western China (location see Figure 1). Table 4 presents the main development situation and ecological vulnerability factors amongst the 3 cities. Table 4 reveals that compared with Shanghai and Chongqing, Beijing’s whole degree of ecological vulnerability is lower. It was surprising that proportion of severe ecological vulnerable regions in total area of Chongqing is as much as 96.4%. Below, from ecological vulnerability’s various relevant factors of the three cities were compared.
Beijing and Shanghai are China’s main economic and population core areas, and Chongqing is economic center in western China. Comparatively, the population density is the highest among the three metropolitan areas. The high density of polarization acquires higher requirements on water and land resources and pressure on ecological environment. Per capita water resources of Beijing is only 95.1 cu.m/person, which is far lower than Chongqing’s and Shanghai’s. Water shortage has become an important factor restricting the sustainable development of Beijing. It’s an obvious shortage of available land resources in Shanghai. Per capita area of cultivated land of Shanghai is only 770 hectares/person. Under these conditions, that Shanghai has been put forward “reduction planning strategy” (i.e., reducing the area of land used for construction purposes) contributes to save land resources and protect ecology. It’s worth noting that Shanghai has 464,600 hectares of wetlands which proportion in total area of territory is 73.27%. There are 6 nation level nature reserves which total area is 27,500 hectares in Chongqing. Geological disasters is the vulnerability factor of Chongqing and Beijing. There are 347 and 40 times of geological disasters occurred in 2014 in Chongqing and Beijing respectively, in which land-slide is mainly in Chongqing and collapse in Beijing. In Chongqing there is 8950 km2 of rocky desertification area, accounting for 10.9% of the total land area. The rapid population growth and intensive development industry in Chongqing, and the relatively high percentage of rocky desertification area, with 34.6% of the city’s population living in karst areas, is a perfect example of imminent sustainability conflicts. In addition, Beijing faced the threat of desertification. Desertification has been close to Beijing where is only 70 km apart, which increasingly causes people’s concern to Beijing’s sustainability issues.
In short, as representative cities of the Mainland China’s EPAs, vulnerability factors and sustainability issues of Beijing, Shanghai and Chongqing show the huge difference, which water resources shortage, collapse geological disasters and desertification threat occur in Beijing, Shanghai is faced with land resources shortage and pressure of wetlands protection, then serious soil erosion, serious rocky desertification, land-slide geological disasters and pressure of nature reserves protection are main vulnerability factors and sustainability concerns in Chongqing.
4.4. Discussions on the Sustainable Development Issues of China’s EPAs
Based on classification of ecological vulnerability and the development level of EPAs, we explore 4 kinds of EPAs’ sustainability issues and development concerns. Firstly, GTEZ, WCC and LCB, belong to low development level-severe ecological vulnerability mega-regions, face the dual pressures of promoting economic development and ecological protection. These regions are distributed not only in the east but also in the west China. The Guanzhong Tianshui Economic Zone, located in the central EFAs (Chinese Loess Plateau soil and water conservation ecological function areas, Qinba Mountain biodiversity ecological function areas, National central park of China (Table 3 and Figure 6c)) experiences serious soil erosion and water shortages. As the economic center of northwestern China, it might distribute economic activity layout in some “point” (key cities and towns), but not “surface” (whole region); it also enhances economic and social development by promoting its cultural and tourism resources, such as the Qinshihuang Terracotta Warriors and Horses Museum of Xi’an City, which was selected as one of the planet’s most popular museums in 2013—the only one in east Asia to be selected. Wuhan City Circle considers paying more attention to forest ecosystem protection and soil erosion prevention and control in the east and in the south (Figure 6c). With “the urban agglomeration in the middle reach of Yangtze River development planning” being approved by the State Council of China in April 2015 [58], Wuhan City Circle could reinforce its advantages for economic development and transportation, and promote economic development of its nearby EPAs (i.e., Poyang Lake Ecological Economic Zone and Chang-Zhu-Tan city group). Under the background of economy growth significantly declines in northeastern China, Liaoning Coastal Belt development level is not high, at the same time suffers soil erosion, desertification threat and water shortage.
Moreover, high development level-severe ecological vulnerability regions which include BTH, CC, YRD, CPA and SP are discussed. Because of its unique geographical position and climate, and because of the influx of large numbers of people, the Beijing–Tianjin–Hebei metropolitan area experiences environmental problems such as water shortages and pollution, overused land resources, soil erosion, land desertification, and air pollution. Serious fog and haze create a profoundly negative international image of Beijing. Hence central government and local government of this region needs to pay more attention to ecological protection, for example by preventing and controlling desertification (Huishandake desertification prevention and control ecological function areas (Table 3, Figure 6c)), and controlling the intensive use of water and soil resources. The ecological environment in Chengdu–Chongqing directly influences the ecological security of the Yangtze River and the safe operation of the Three Gorges dam. This EPA has serious soil erosion problems (Figure 6a) and is surrounded by many national key ecological function areas. These areas (Table 3, Figure 6c) include the Three Gorges reservoir area (soil and water conservation ecological function areas), the Wuling Mountain biodiversity area (water and soil conservation ecological function areas), and the Sichuan-Yunnan forest (biodiversity ecological function areas). This EPA needs to intensify its protection of ecological environments, as well as strengthen economic development by selecting leading industries that are environmentally friendly to ensure the sustainable development of the regional economy, society, and the ecological environment. It is supposed to take comprehensive measures to protect the ecological environment, including promoting soil and water conservation, and enabling ecological migration. Just as the comparison of vulnerability factors of representative cities in Economic Polarized Areas above, the Yangtze River Delta faced with land resources shortage and pressure of wetlands protection. Figure 3 reveals that the serious vulnerable regions among the YRD are located in the eastern coastal areas. That lakes and wetlands area significantly reduce the middle and lower reaches regions of the Yangtze River and water quality of offshore sea in the Yangtze River Delta deteriorate obviously, available land lack and water resources are in shortage because of water quality-induced in recent decades, compels the YRD attach importance to ecological environment measures (e.g., rivers, lakes, off-shore waters and wetlands protection). With its large population, water shortages, and city dispersion, the Central Plains Area should pay attention to enhance regional polarization with Zhengzhou as its growth pole.
Once more, low development level-slight ecological vulnerability regions are mostly located in the central China (i.e., the Wanjiang City Belt, the Poyang Lake Ecological Economic Zone and the Chang-Zhu-Tan city group). Available water and land resources are no lack relatively in the this type regions. With the implementation of the Yangtze River Economic Belt strategy, they are regarded the most important regions to support economic rise of the central China. Meanwhile, the Poyang Lake Ecological Economic Zone is a special eco-economic zone based on the ecological protection and limited industrial agriculture of Poyang Lake. In this type, the other two EPAs are Guanzhong Tianshui Economic Zone and Tumen River Area. The Guangxi Beibu Gulf Economic Zone is located in the southern Karst rocky desertification prevention and control ecological function areas, (Guizhou–Guangxi–Yunnan Karst rocky desertification prevention and control ecological function areas, Table 3 and Figure 6c). It is under serious threat of rocky desertification. In addition to prevention and control of rocky desertification, in economic development strategy it should consider strengthening economic development functions to promote China–ASEAN (Association of Southeast Asian Nations) cooperation based on its transportation-related advantages.
Lastly, the Pearl River Delta, the Economic Zone on the West Side of the Straits and the Shenyang Region present low development level-slight ecological vulnerability. They locate in eastern coastal China, possess more suitable characteristics for economic development with minimal ecological degradation. These regions are supposed to transfer their innovation functions to emerging EPAs, upgrade traditional industries, and promote resource saving and re-use. Local government and Environmental protection NGOs of these EPAs need to pay more attention to protect key ecological function areas, such as the Nanling Mountain forest and biodiversity ecological function areas and Keerqin grassland ecological areas (Figure 6c).
When considering the patterns of ecological functions and ecological vulnerability among China’s major development hotspots, it seems sensible to select the most appropriate regions for economic development and polarization. At the same time, excessive polarization in a limited number of regions tends to be unsustainable because of limited resources. Currently, economic activity transfer represented by industrial transfer from the coastal to the inland EPAs (e.g., from southern to northern Jiangsu Province, and from Beijing to Hebei Province) and between EPAs (e.g., from the Yangtze River Delta to Wanjiang City Belt, and from Pearl River Delta to the Chang–Zhu–Tan city group) is taking place as production costs increase in the coastal areas. Even within the EPAs, industrialization and urbanization development should be strictly controlled, especially in the southwest and northwest regions (e.g., CC and GTEZ). In brief, Mainland China’s Mega-regions have their specific and geographical characteristic ecological and resources background, the measures of sustainable development ought to adjust to local conditions.
5. Conclusions
In this study, we analyzed the ecological vulnerability of the 16 mega-regions in mainland China and provided relevant suggestions for their main issues and challenges of sustainable development. The ecological vulnerability of megaregions shows great geographical variation. Although most megaregions are located in less vulnerable areas where are relatively suitable for economic development and polarization, our analysis showed that several EPAs (Chengdu–Chongqing, Guanzhong Tianshui Economic Zone, Shandong Peninsula, Wuhan City Circle, Beijing–Tianjin–Hebei and Liaoning Coastal Belt) suffer from a high degree of comprehensive ecological vulnerability. In addition, according to the rank of EPAs’s comprehensive ecological vulnerability and development level, 16 EPAs have been classified into 4 types (i.e., low development level-severe ecological vulnerability, high development level-severe ecological vulnerability, low development level-slight ecological vulnerability and high development level-slight ecological vulnerability) which have their specific and geographical characteristic ecological and resources background and sustainability issues.
On account of difficulties in data acquisition in a large study area, there were several limitations of this study in the quantitative analysis of ecological vulnerability, analysis of functional evaluation of China’s EPAs and their ecological vulnerability, etc. Thus, further analysis would be proceeded to examine the ecological environmental effect of economic activities on the 16 mega-regions in mainland China at finer scale.
Acknowledgements
We gratefully acknowledge Weiyang Zhang in Ghent University for their insightful and constructive suggestions and assistance. We would also like to acknowledge the Data Center for Resources and Environmental Sciences, Chinese Academy of Sciences (RESDC) (http://www.resdc.cn), Institute of Geographic Sciences and Natural Resources Research, Chinese Academy of Sciences (http://www.igsnrr.cas.cn/) and Environmental and Ecological Science Data Center for West China, National Natural Science Foundation of China (http://westdc.westgis.ac.cn) for data support. The valuable and helpful comments of the anonymous reviewers are appreciated as well.
Author Contributions
Hui Zou and Xuejun Duan contributed to the research design. Hui Zou and Lei Ye was responsible for data collection and analysis. Hui Zou and Lei Wang wrote the paper. Xuejun Duan provided guidance and suggestions. All authors have read and approved the final manuscript.
Conflicts of Interest
The authors declare no conflict of interest.
References
- Gottmann, J. Megalopolis: The Urbanized Northeastern Seaboard of the United States; The M.I.T. Press: Cambridge, MA, USA, 1961. [Google Scholar]
- Goldfeld, K.S.; Sassen, S.; Glaeser, E.L. The Economic Geography of Mega-Regions; Princeton University Press: Princeton, NJ, USA, 2007. [Google Scholar]
- Florida, R.; Gulden, T.; Mellander, C. The rise of the mega-region. Camb. J. Reg. Econ. Soc. 2008, 1, 459–476. [Google Scholar] [CrossRef]
- Argenbright, R. Remarking Moscow: New Places, New Selves. Geogr. Rev. 1999, 89, 1–22. [Google Scholar] [CrossRef]
- Harrison, J.; Hoyler, M. Mega-Regions: Globalization’s New Urban Form? Edward Elgar: Cheltenham, UK, 2014. [Google Scholar]
- Marull, J.; Galletto, V.; Domene, E.; Trullén, J. Emerging megaregions: A new spatial scale to explore urban sustainability. Land Use Policy 2013, 34, 353–366. [Google Scholar] [CrossRef]
- Liu, Y.; Xu, J.P.; Luo, H.W. An Integrated Approach to Modelling the Economy-Society-Ecology System in Urbanization Process. Sustainability 2014, 6, 1946–1972. [Google Scholar] [CrossRef]
- Rueff, H.; Inam-ur-Rahim; Kohler, T.; Mahat, T.J.; Ariza, C. Can the green economy enhance sustainable mountain development? The potential role of awareness building. Environ. Sci. Policy 2015, 49, 85–94. [Google Scholar] [CrossRef]
- Song, Y.J. Ecological city and urban sustainable development. Procedia Eng. 2011, 21, 142–146. [Google Scholar] [CrossRef]
- Platt, R.H. Toward ecological cities: Adapting to the 21st century metropolis. Environment 2004, 46, 10–27. [Google Scholar]
- McPhearson, T.; Kremer, P.; Hamstead, Z. Mapping ecosystem services in New York City: Applying a social-ecological approach in urban vacant land. Ecosyst. Serv. 2013, 3, 11–26. [Google Scholar] [CrossRef]
- Dou, X.; Li, S.; Wang, J. Ecological Strategy of City Sustainable Development. APCBEE Procedia 2013, 5, 429–434. [Google Scholar] [CrossRef]
- Seeliger, L.; Turok, I. Towards Sustainable Cities: Extending Resilience with Insights from Vulnerability and Transition Theory. Sustainability 2013, 5, 2108–2128. [Google Scholar] [CrossRef]
- Qiu, B.; Li, H.; Zhou, M. Vulnerability of ecosystem services provisioning to urbanization: A case of China. Ecol. Indic. 2015, 57, 505–513. [Google Scholar] [CrossRef]
- Duan, X.; Derudder, B.; Ye, L.; Shen, W. Hierarchical tendencies and functional patterns among Mainland China’s megaregions. Eurasian Geogr. Econ. 2017, 58, 1–26. [Google Scholar] [CrossRef]
- Wei, Y.H.D. Beyond new regionalism, beyond global production networks: Remaking the Sunan model, China. Environ. Plan. 2010, 28, 72–96. [Google Scholar] [CrossRef]
- Wong, C.; Qian, H.; Zhou, K. In search of regional planning in China: The case of Jiangsu and the Yangtze Delta. Town Plan. Rev. 2008, 79, 295–329. [Google Scholar] [CrossRef]
- Hall, P. Looking backward, looking forward: the city region of the mid-21st century. Reg. Stud. 2009, 43, 803–817. [Google Scholar] [CrossRef]
- Scott, A.J. Regions and the World Economy: The Coming Shape of Global Production, Competition, and Political Order; Oxford University Press: New York, NY, USA, 1998. [Google Scholar]
- Jones, M.; MacLeod, G. Regional spaces, spaces of regionalism: territory, insurgent politics and the English question. Trans. Inst. Br. Geogr. 2004, 29, 433–452. [Google Scholar] [CrossRef]
- Parr, J. Perspectives on the city-region. Reg. Stud. 2005, 39, 555–566. [Google Scholar] [CrossRef]
- Hall, P.G.; Pain, K. The Polycentric Metropolis: Learning from Mega-City Regions in Europe; Routledge: London, UK, 2006. [Google Scholar]
- Sassen, S. The Global City; Princeton University Press: Princeton, NJ, USA, 1991. [Google Scholar]
- Scott, A.J. Global City-Regions: Trends, Theory, Policy; Oxford University Press: Oxford, UK, 2001. [Google Scholar]
- Childers, D.L.; Pickett, S.T.A.; Grove, J.M.; Ogden, L.; Whitmer, A. Advancing urban sustainability theory and action: Challenges and opportunities. Landsc. Urban Plan 2014, 125, 320–328. [Google Scholar] [CrossRef]
- Wei, Y.; Huang, C.; Lam, P.T.; Sha, Y.; Feng, Y. Using Urban-Carrying Capacity as a Benchmark for Sustainable Urban Development: An Empirical Study of Beijing. Sustainability 2015, 7, 3244–3268. [Google Scholar] [CrossRef]
- Van Timmeren, A.; Zwetsloot, J.; Brezet, H.; Silvester, S. Sustainable Urban Regeneration Based on Energy Balance. Sustainability 2012, 4, 1488–1509. [Google Scholar] [CrossRef]
- Yang, Q.; Ding, Y.; de Vries, B.; Han, Q.; Ma, H.M. Assessing Regional Sustainability Using a Model of Coordinated Development Index: A Case Study of Mainland China. Sustainability 2014, 6, 9282–9304. [Google Scholar] [CrossRef]
- Lejano, R.P.; Stokols, D. Social ecology, sustainability, and economics. Ecol. Econ. 2013, 89, 1–6. [Google Scholar] [CrossRef]
- Cinner, J.E.; Huchery, C.; Darling, E.S.; Humphries, A.T.; Graham, N.A.J.; Hicks, C.C.; Marshall, N.; McClanahan, T.R. Evaluating Social and Ecological Vulnerability of Coral Reef Fisheries to Climate Change. PLoS ONE 2013, 8, e74321. [Google Scholar] [CrossRef] [PubMed]
- Song, G.; Li, Z.; Yang, Y.; Semakula, H.M.; Zhang, S. Assessment of ecological vulnerability and decision-making application for prioritizing roadside ecological restoration: A method combining geographic information system, Delphi survey and Monte Carlo simulation. Ecol. Indic. 2015, 52, 57–65. [Google Scholar] [CrossRef]
- Zhang, J.T.; Xiang, C.L.; Li, M. Integrative ecological sensitivity (IES) applied to assessment of eco-tourism impact on forest vegetation landscape: A case from the Baihua Mountain Reserve of Beijing, China. Ecol. Indic. 2012, 18, 365–370. [Google Scholar] [CrossRef]
- Wang, X.M.; Bian, Z.F. The Implications of Ecological Sensitivity on Exploitation of Unutilized Land: A Case Study in Ji’Nan City, China. Procedia Environ. Sci. 2011, 10, 275–281. [Google Scholar] [CrossRef]
- Makler-Pick, V.; Gal, G.; Gorfine, M.; Hipsey, M.R.; Carmel, Y. Sensitivity analysis for complex ecological models—A new approach. Environ. Model. Softw. 2011, 26, 124–134. [Google Scholar] [CrossRef]
- Okey, T.A.; Agbayani, S.; Alidina, H.M. Mapping ecological vulnerability to recent climate change in Canada’s pacific marine ecosystems. Ocean Coast. Manag. 2015, 106, 35–48. [Google Scholar] [CrossRef]
- Mumby, P.J.; Chollett, I.; Bozec, Y.-M.; Wolff, N.H. Ecological resilience, robustness and vulnerability: How do these concepts benefit ecosystem management? Curr. Opin. Environ. Sustain. 2014, 7, 22–27. [Google Scholar] [CrossRef]
- Ippolito, A.; Sala, S.; Faber, J.; Vighi, M. Ecological vulnerability analysis: A river basin case study. Sci. Total Environ. 2010, 408, 3880–3890. [Google Scholar] [CrossRef] [PubMed]
- De Lange, H.; Sala, S.; Vighi, M.; Faber, J. Ecological vulnerability in risk assessment—A review and perspectives. Sci. Total Environ. 2010, 408, 3871–3879. [Google Scholar] [CrossRef] [PubMed]
- Abson, D.J.; Dougill, A.J.; Stringer, L.C. Using principal component analysis for information-rich socio-ecological vulnerability mapping in southern Africa. Appl. Geogr. 2012, 35, 515–524. [Google Scholar] [CrossRef]
- Qiu, P.; Xu, S.; Xie, G.; Tang, B.; Bi, H.; Yu, L. Analysis of the ecological vulnerability of the western Hainan Island based on its landscape pattern and ecosystem sensitivity. Acta Ecol. Sin 2007, 27, 1257–1264. [Google Scholar]
- Farhan, A.R.; Lim, S. Vulnerability assessment of ecological conditions in Seribu Islands, Indonesia. Ocean Coast. Manag. 2012, 65, 1–14. [Google Scholar] [CrossRef]
- Liao, X.; Li, W.; Hou, J. Application of GIS based ecological vulnerability evaluation in environmental impact assessment of master plan of coal mining area. Procedia Environ. Sci. 2013, 18, 271–276. [Google Scholar] [CrossRef]
- Chen, H.; Wu, Q.; Cheng, J.; Ma, Z.; Song, W. Scaling-up Strategy as an Appropriate Approach for Sustainable New Town Development? Lessons from Wujin, Changzhou, China. Sustainability 2015, 7, 5682–5704. [Google Scholar] [CrossRef]
- Niu, W. Theory and practice of China’s sustainable development. Bull. Chin. Acad. Sci. 2012, 27, 280–289. [Google Scholar]
- Deng, N. Sustainable development and green economy of China. China Popul. Resour. Environ. 2012, 22, 1–3. [Google Scholar]
- Bai, X.M.; Shi, P.J.; Liu, Y.S. Realizing China’s urban dream. Nature 2014, 509, 158–160. [Google Scholar] [CrossRef] [PubMed]
- Duan, X.; Yu, X.; Josef, N. Study on the Expanded Scope of the Yangtze Delta Region Based on the Function of Economic Polarized Area. Acta Geogr. Sin. 2009, 62, 211–220. [Google Scholar]
- Duan, X.; Yu, X.; Josef, N.; Zhang, W.; Yu, L. Development and Function Evaluation of Economic Polarized Area in China. Sci. Geogr. Sin. 2013, 33, 769–778. [Google Scholar]
- Tan, P.Y.; Hamid, A.R.B. Urban ecological research in Singapore and its relevance to the advancement of urban ecology and sustainability. Landsc. Urban Plan 2014, 125, 271–289. [Google Scholar] [CrossRef]
- Ministy of Environmental Protection of China. Technical Criterion for Ecosystem Status Evaluation; MEP: Beijing, China, 2015.
- National Major Function Oriented Zone Planning. Available online: http://www.gov.cn/zwgk/2011-06/08/content_1879180.htm (accessed on 5 April 2016).
- 2013 Environmental Protection Bulletin of China. Available online: http://jcs.mep.gov.cn/hjzl/zkgb/2013zkgb/201406/t20140605_276534.htm (accessed on 5 April 2016).
- Rocky Desertification Condition of China. Available online: http://www.forestry.gov.cn/main/69/content-831684.html (accessed on 5 April 2016).
- Ran, S.; Lv, C.; Jia, K.; Qi, Y. Environmental Impact Assessment of the Land Use Change in China Based on Ecosystem Service Value. Environ. Sci. 2006, 27, 2139–2144. [Google Scholar]
- Yang, W.; Li, F.; Wang, R.; Xiong, X. Eco-service efficeincy assessment menthod of urban land use: A case study of Changzhou city, China. Acta Ecol. Sin. 2013, 33, 4487–4494. [Google Scholar]
- Van der Biest, K.; Vrebos, D.; Staes, J.; Boerema, A.; Bodi, M.B.; Fransen, E.; Meire, P. Evaluation of the accuracy of land-use based ecosystem service assessments for different thematic resolutions. J. Environ. Manag. 2015, 156, 41–51. [Google Scholar] [CrossRef] [PubMed]
- China’s Terrestrial Ecosystems Type Spatial Distribution 2010. Available online: http://www.resdc.cn/data.aspx?DATAID=105 (accessed on 10 May 2016).
- Urban Agglomeration Development Plan in the Middle Reach of Yangtze River. Available online: http://www.ndrc.gov.cn/zcfb/zcfbtz/201504/t20150416_688229.html (accessed on 10 April 2016).
Figure 1.
Location of the 16 Economic Polarized areas in Mainland China. Adopted from: Figure 1 in Duan et al. [15].
Figure 1.
Location of the 16 Economic Polarized areas in Mainland China. Adopted from: Figure 1 in Duan et al. [15].

Figure 2.
Analysis framework. Figures used for overlay analysis source see in Section 3.2.
Figure 2.
Analysis framework. Figures used for overlay analysis source see in Section 3.2.

Figure 3.
Ecological vulnerability in Mainland China. Data provided by Institute of Geographic Sciences and Natural Resources Research, Chinese Academy of Sciences (http://www.igsnrr.cas.cn/).
Figure 3.
Ecological vulnerability in Mainland China. Data provided by Institute of Geographic Sciences and Natural Resources Research, Chinese Academy of Sciences (http://www.igsnrr.cas.cn/).

Figure 4.
Typology of these megaregions based on their development level and ecological vulnerability. (Note: (1) Development level draws on overall score of Table 1, rankings 1–8 and 9–16 classified as L2 and L1, respectively. (2) Comprehensive ecological vulnerability on Table 2, rankings 1–8 and 9–16 classified as V2 and V1, respectively. (3) Abbreviations of EPAs refer to Table 1.)

Figure 5.
Classification patterns of ecological vulnerability and the development level of EPAs.

Figure 6.
GIS maps of various aspects of ecology in China’s EPAs. (Note: (1) Area of available land resources = area of land suitable for construction–area of existing construction land–area of basic farmland; (2) Figure 6a and Figure 6b are source from the Data Center for Resources and Environmental Sciences, Chinese Academy of Sciences (RESDC) (http://www.resdc.cn) ; Figure 6c, Figure 6d and Figure 6e adopted from Figure 11, Figure 2 and Figure 3 in “National major function oriented zone planning” issued by the State Council of China [51])).


Table 1.
Development level of China’s 16 EPAs.
| EPA | YRD | BTH | PRD | CPA | EZWSS | CC | SP | SR |
| Score | 4.233 | 2.778 | 1.663 | 1.125 | 1.058 | 1.045 | 0.567 | 0.428 |
| EPA | LCB | WCC | WCB | GTEZ | CZT | PLEEZ | TRA | GBGEZ |
| Score | 0.426 | 0.425 | 0.378 | 0.308 | 0.288 | 0.259 | 0.149 | 0.069 |
Abbreviations: YRD = Yangtze River Delta, BTH = Beijing-Tianjin-Hebei, PRD = Pearl River Delta, CPA = Central Plains Area, EZWSS = Economic Zone on the West Side of the Straits, CC = Chengdu-Chongqing, SP = Shandong Peninsula, SR = Shenyang Region, LCB = Liaoning Coastal Belt, WCC = Wuhan City Circle, WCB = Wanjiang City Belt, GTEZ = GuanzhongTianshui Economic Zone, CZT = Chang-Zhu-Tan city group, PLEEZ = Poyang Lake Ecological Economic Zone, TRA = Tumen River Area, and GBGEZ = Guangxi Beibu Gulf Economic Zone. Data source: Duan et al. [15].
Table 2.
Score and rank of comprehensive ecological vulnerability amongst 16 EPAs.
| EPAs | EPAs’s Whole Degree of Ecological Vulnerability | Proportion of Severe Ecological Vulnerable Regions in EPA/% | Score of EPA’s Comprehensive Ecological Vulnerability | Rank of EPA’s Comprehensive Ecological Vulnerability |
|---|---|---|---|---|
| YRD | 3.0 | 15.8 | 0.35 | 7 |
| BTH | 3.2 | 19.9 | 0.41 | 5 |
| PRD | 2.8 | 9.8 | 0.25 | 10 |
| CPA | 3.0 | 12.7 | 0.32 | 8 |
| EZWSS | 2.6 | 3.4 | 0.18 | 13 |
| CC | 4.1 | 81.8 | 1.00 | 1 |
| SP | 3.4 | 40.9 | 0.59 | 3 |
| SR | 2.9 | 0.0 | 0.21 | 12 |
| LCB | 3.1 | 15.2 | 0.36 | 6 |
| WCC | 2.9 | 34.6 | 0.44 | 4 |
| WCB | 2.5 | 0.0 | 0.13 | 14 |
| GTEZ | 3.4 | 43.6 | 0.62 | 2 |
| CZT | 2.9 | 0.0 | 0.22 | 11 |
| PLEEZ | 3.0 | 9.3 | 0.29 | 9 |
| TRA | 2.0 | 0.0 | 0.00 | 16 |
| GBGEZ | 2.3 | 0.0 | 0.08 | 15 |
Table 3.
Degree of ecological vulnerability amongst 16 EPAs.
| EPA | Soil Erosion | Desertification | Rocky Desertification | Overlap of EPAs and EFAs |
|---|---|---|---|---|
| YRD | + | |||
| BTH | +++ | + | HSDK | |
| PRD | + | |||
| CPA | ++++ | + | DBS | |
| EZWSS | + | NLSD | ||
| CC | ++++ | +++ | SX, WLS, CD | |
| SP | ++ | |||
| SR | ++ | + | KRQ | |
| LCB | +++ | |||
| WCC | +++ | DBS | ||
| WCB | ++ | DBS | ||
| GTEZ | ++++ | HTGY, QB | ||
| CZT | + | ++ | ||
| PLEEZ | ++ | |||
| TRA | + | CBS | ||
| GBGEZ | + | +++ | KST |
Note: According to degree, serious marked as ++++, moderate marked as +++, mild marked as ++, and slight marked as +. Abbreviations: (1) EFAs = National key ecological function areas of China; (2) HSDK = Huishandake Desertification prevention and control ecological functional areas; DBS = Dabie Mountain soil and water conservation ecological areas; NLSD = Nanling Mountain forest and biodiversity ecological areas; SX = The Three Gorges reservoir area soil and water conservation ecological areas; QB= Qinba Mountain biodiversity ecological areas; WLS = Wuling Mountain biodiversity, water and soil conservation ecological areas; CD = Sichuan-Yunnan forest and biodiversity ecological areas; KRQ = Keerqin grassland ecological areas; HTGY = Chinese Loess Plateau soil and water conservation ecological areas; CBS = Changbaishan Mountain forest ecological areas; KST = Guizhou-Guangxi-Yunnan Karst rocky desertification prevention and control ecological areas; (3) and abbreviations for EPAs as in Table 1.
Table 4.
Main development situation and ecological vulnerability factors amongst 3 representative cities.
Table 4.
Main development situation and ecological vulnerability factors amongst 3 representative cities.
| Indicators\Cities | Beijing | Shanghai | Chongqing |
|---|---|---|---|
| Population (10,000 persons) (1) | 2152 | 2426 | 2991 |
| Administrative region area (sq. km) (1) | 16,411 | 6340 | 82,374 |
| Population density (persons/sq. km) (1) | 1311 | 3827 | 363 |
| Gross domestic product (100 million yuan) (1) | 21,330 | 23,567 | 14,262 |
| Per capita GDP (Gross domestic product) (yuan) (1) | 99,995 | 97,370 | 47,850 |
| Per capita water resources (cu.m/person) (1) | 95.1 | 194.8 | 2155.9 |
| Per capita area of cultivated land (1000 hectares/person) (1) | 0.103 | 0.077 | 0.821 |
| Area of wetlands (1000 hectares) (1) | 48.1 | 464.6 | 207.2 |
| Proportion of wetlands in total area of territory (%) (1) | 2.86 | 73.27 | 2.51 |
| Number of nation level nature reserves (unit) (1) | 2 | 2 | 6 |
| Area of nation level nature reserves (1000 hectares) (1) | 2.6 | 6.6 | 27.5 |
| Geological disasters (unit) (1) | 40 | 1 | 347 |
| Area of rocky desertification (1000 hectares) (2) | 0 | 0 | 895 |
| Whole degree of ecological vulnerability (3) | 3.00 | 4.42 | 4.62 |
| Proportion of severe ecological vulnerable regions in total area of territory (%) (3) | 0.3 | 89.2 | 96.4 |
| Belong to the EPA (3) | BTH | YRD | CC |
Data source: (1) China Statistical Yearbook 2015; (2) Rocky desertification bulletin of China, issued by the Forestry Bureau of China, 2012; (3) Results of the study.
© 2017 by the authors. Licensee MDPI, Basel, Switzerland. This article is an open access article distributed under the terms and conditions of the Creative Commons Attribution (CC BY) license (http://creativecommons.org/licenses/by/4.0/).
Share and Cite
MDPI and ACS Style
Zou, H.; Duan, X.; Ye, L.; Wang, L. Locating Sustainability Issues: Identification of Ecological Vulnerability in Mainland China’s Mega-Regions. Sustainability 2017, 9, 1179. https://0-doi-org.brum.beds.ac.uk/10.3390/su9071179
AMA Style
Zou H, Duan X, Ye L, Wang L. Locating Sustainability Issues: Identification of Ecological Vulnerability in Mainland China’s Mega-Regions. Sustainability. 2017; 9(7):1179. https://0-doi-org.brum.beds.ac.uk/10.3390/su9071179
Chicago/Turabian StyleZou, Hui, Xuejun Duan, Lei Ye, and Lei Wang. 2017. "Locating Sustainability Issues: Identification of Ecological Vulnerability in Mainland China’s Mega-Regions" Sustainability 9, no. 7: 1179. https://0-doi-org.brum.beds.ac.uk/10.3390/su9071179
Note that from the first issue of 2016, this journal uses article numbers instead of page numbers. See further details here.