1. Introduction
According to studies in both developed and developing countries, the public, worldwide, is becoming increasingly concerned about sustainable healthcare. In the United Kingdom and the United States, studies reveal that the care delivered did not often meet the subjective expectations of patients regarding quality [
1,
2,
3]. A survey in the United States reported that patients only received half of the recommended treatment process [
4]. The same goes for nations in development. In Kenya, for example, only 56.9% of malaria patients received the recommended treatment, 30.4% were treated with minor errors, and 12.7% received inappropriate treatment [
5].
The analysis of attitudes and satisfaction among patients towards the quality of healthcare services has been initiated a long time ago with a wide range of research papers [
6]. Rooney et al. announced a report introducing a set of quantifiable indicators used to evaluate healthcare quality in hospitals over time [
7]. More recently, researchers have suggested evaluations based on direct clinician observation and perception of patients be used simultaneously to improve the reliability of the data [
8]. This is because, in many cases, the opinion of the patient can be affected by certain factors, particularly their own subjective and uninformed cost-benefit analysis, and may not fully reflect the quality of the health care provider [
9]. Financial aspects of health care have been shown to have a great impact on decision-making among patients [
10] which, in turn, potentially affects the sustainability of the communities to which they belong [
11]. Asymmetric information may come into play as well, suggesting that communication regarding health care is an essential element factoring in the perception of health care quality by patients.
Private providers often offer services perceived by users to be more attractive but with a higher price [
12]. This however is not true in all countries. Rao et al. indicated that the perceived quality at public facilities in India was marginally favourable [
13]. In Zaire, on a local level, the interpersonal qualities displayed by some nurses sometimes helped compensate for the negative effects of the costs, and even increased the level of utilisation of some health centres [
14]. Specific components of interpersonal care, such as responsiveness of nurses to complaints and reassurance from doctors, were initially thought to be the main determinants of perceived quality of care; however, empirical studies show that these factors are not strong predictors [
13,
14,
15,
16,
17,
18]. The quality of care as perceived by patients was found to depend on certain contextual and intervening conditions pertaining to the broader environment, the organisation, and personal factors of the nurse and patient [
19].
The rapid changing of human habitat around the world has long posed the question of natural, and, consequently, social sustainability, because a community must be able to keep its population in good shape in order to sustain itself. This maintenance of public health is tied to the living environment: Varied environments result in different health status [
20,
21,
22]. In the United Kingdom, different areas have different mortality rates [
23,
24,
25]. Intuitively, an unhealthy environment, including perverse effects of climate change, also shows negative influences on not only people’s health [
26,
27,
28], but their perception of health care quality, as well [
29]. However, nature is not the sole factor in sustaining a community; human health is also largely a social matter. In fact, the relationship between personal and public health has been in focus in the recent years. Questions over whether health management was personal or social responsibility were raised; the debate tied between the consequences of unresolved inequities in access to health care, especially in developing countries [
30,
31], versus an insistence on personal liberty and refusal of public health management [
32]. There is, thus, an intriguing connection between personal perceptions of health care and that of the social system, which called for an investigation linking these elements together.
With rising concern about health-related, as well as sustainability, issues in developing countries, this study aims to add findings on the Vietnamese population’s view on health care. People-perceived healthcare quality and public health status will be considered in relation to the factors of health insurance, age, body mass index (BMI), marital status, healthcare costs, health communication, and the impact of friends and relatives.
In this paper, two main issues are discussed: (1) the factors regarding demographics, society, and psychology affecting the patient’s evaluation of health care services quality; and (2) the influence of body mass index, perceived quality of health services, and health communication on people’s perceptions of public health.
2. Materials and Methods
The data for this article was derived from a survey conducted in Hanoi, Vietnam by a team of professional investigators from Vuong and Associates in September 2016. This study collected data on a range of socio-economic and demographic indicators. Participants were patients, chosen at random with no discriminatory criteria; response rates were approximately 83% (5 out of 6). The questions were direct and simple, and participants were instructed by the interviewer to ensure that each questionnaire was filled correctly. The average time taken to collect a questionnaire was 10–15 min. Investigators have been thoroughly trained in order not to interfere with data sampling.
Data was extracted from the dataset of periodic general health examinations, which was collected and prepared by a data team from Vuong and Associates during September to November 2016. Ethical standards of the survey were regulated in the license of V&A/07/2016 (12 September 2016). Raw data was first recorded in Excel (v.2010; Microsoft, Redmond, WA, USA) and then executed in R (v3.3.1; Bell Labs, Murray Hill, NJ, USA).
We acknowledge that the dataset is Hanoi-based and thus presents a major geographical limitation. A nationwide survey would conduct to a different dataset showing regional differences as well as shifting in behaviours. For the time being, such a survey would require resources beyond our capacity.
2.1. Measures
The study took into account the following demographic factors, social-economic situation, and the mentality and perception of patients. These indicators will be explained in the following section.
Explanatory variables concerning demography included age (“Age”) and marital status (“Maritalstt”). With regards to socio-economic factors, the survey tracked whether the patient has a health insurance (represented by “HealthIns”, a categorical variable responded with “yes” or “no”), and the quality of health communication as evaluated by the patient (“HealthCom”). Heath communication was defined in this study as information concerning health, diffused on mass media; its value was derived from the average score given by patients for the following four criteria: Sufficiency, Attractiveness, Emphasis, and Popularity. They were scored from 1 (lowest) to 5 (highest).
Factors related to the mentality and perception of patients included cost, family and medical experience. Namely, patients were asked to estimate an affordable cost for a general examination (“AffCost”). This variable was divided into 3 levels: “low” (<VND 1 million), “med” (between VND 1 and 2 million), and “hi” (>VND 2 million). It was also taken into consideration whether or not the patient had friends or relatives who have experienced prolonged treatment (represented by “AcqTrmt”, a categorical variable with two responses, “yes” and “no”). Participants were furthermore questioned on their experience (or lack thereof) of taking care of patients (“ExpCare”, a categorical variable admitting two options “yes” and “no”).
The height and weight of patients were recorded and used to calculate their BMI, which then served as a representative indicator in our analysis. Health care quality (“SerQual”) was measured as the average value of the scores given by patients for the following five criteria: Tangibles, Reliability, Responsiveness, Assurance, and Empathy. These elements were scored from 1 (lowest) to 5 (highest). Finally, patients were asked of their perception of public health (“ComHthPers”), and their answers were limited to four options: Very optimistic (“Good”), Moderately optimistic (“Quite”), Pessimistic (“Bad”), and Unknown (“Unknown”).
2.2. Methodology
To examine the impact of demographics, society and psychology on the patient’s evaluation of health care services quality, multivariate linear regression was used with the general model as follows:
with the condition that
k independent variables
Xi must have the same sample size
n to the dependent
Y.
Y is a numerical variable, while
Xi can be numerical or categorical. Data, after being processed in R, gave the values of
βi, which represented the linear impact of
Xi on
Y, namely the value of “SerQual” in this research.
In order to examine the influence of BMI, perceived health care services quality and communication on the patient’s perception of public health, a baseline-categorical logit model (BCL) was employed due to its dominant features in predicting the probabilities of
Y in different conditions of
x. Estimations were computed using logit BCL according to [
33].
The general equation of the baseline-categorical logit model was:
in which
x was the independent variable and
πj(
x) = P(
Y =
j|
x) its probability. Thus π
j = P(
Yij = 1), with
Y being the dependent variable. In the logit model, the probability of an event was computed as:
with ∑
jπj(
x) = 1 and
βJ = 0; in which
n was the number of observations in the sample,
j the categorical values of an observation
i, and h a row in basic matrix
xi [
34]. The statistical significance of predictor variables in the model were determined based on
z-value and
p-value; with a
p < 0.05 being the conventional level of statistical significance required for a positive result.
3. Results
3.1. A Descriptive Statistics Analysis
A few descriptive statistics are displayed in the table below:
It could be observed in
Table 1 that younger people (<30 years old) accounted for over a half of the respondents. Some other noteworthy points emerge, such as over 82% of participants had health insurance, and three-quarters of them reported they used to take care of patients.
Popular perceptions of public health were rather negative, as only 16.3% felt optimistic about the current state of public health. This was partly reflected in their evaluation of service quality. For nearly two-thirds of the patients surveyed, health care quality in hospitals scored under 4 points (majorly from 2 to <4 points).
While perception of public health was measured as a discrete variable, the quality of health care services as assessed by patients was considered a continuous variable within the scope of this study (refer to
Section 2.1. Measures for more details on the variable “SerQual”). The values of this variable, as well as each of its five sub-elements, were shown in the following table among other continuous variables.
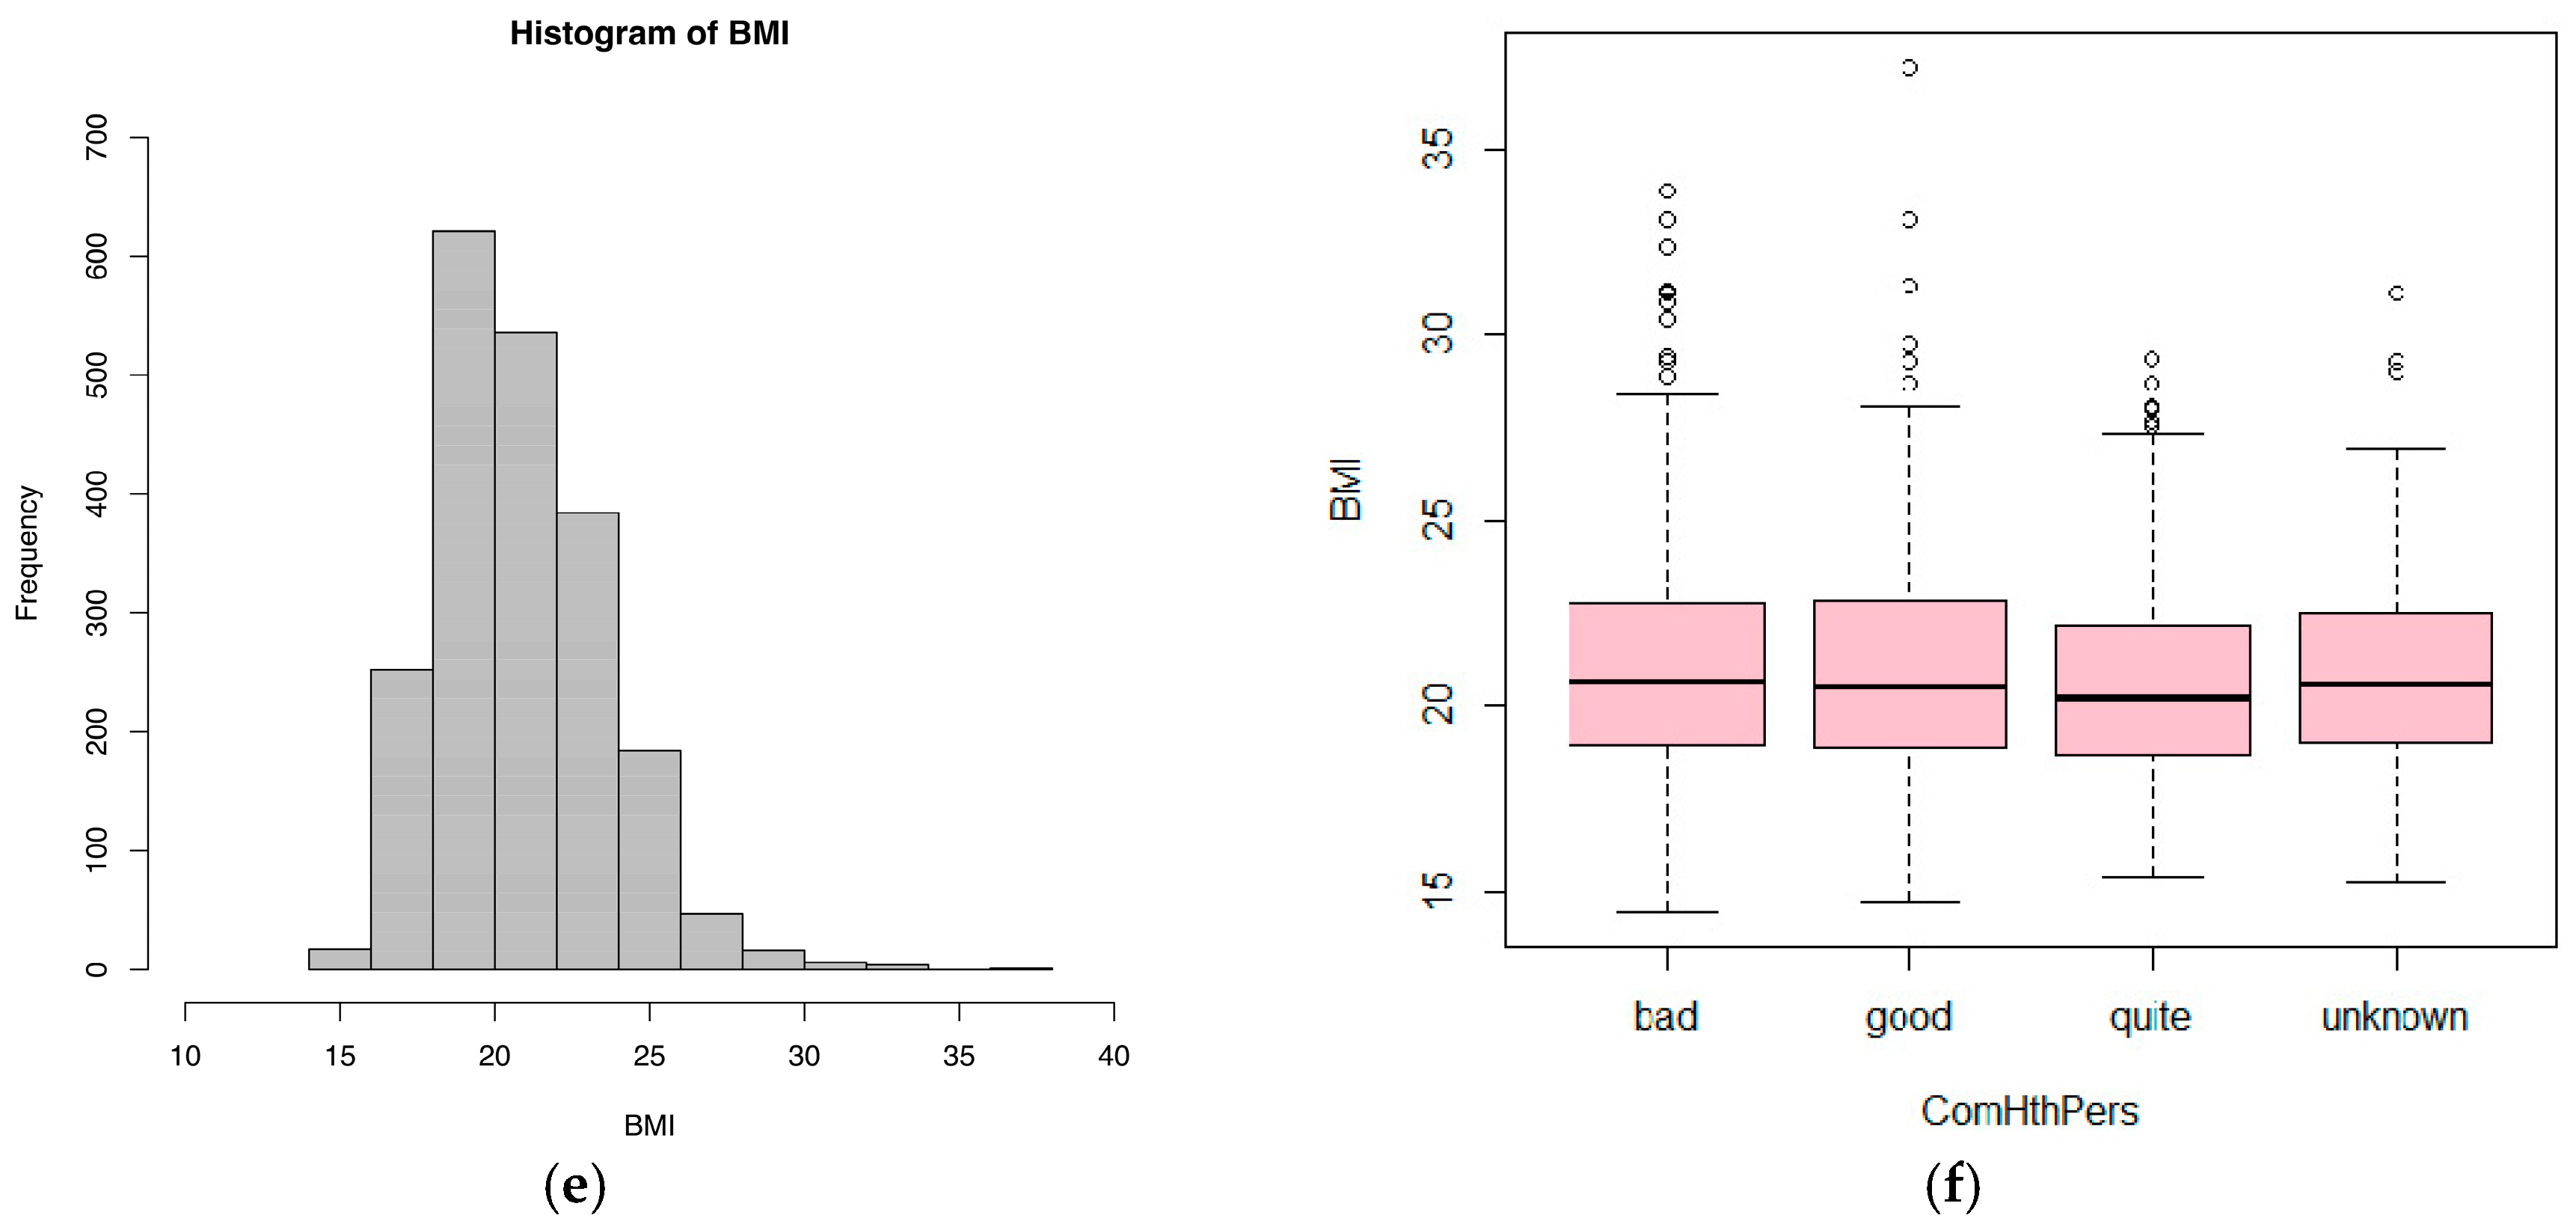
Table 2 presented the mean value, standard errors, and 95% confidence interval of key variables mentioned in the study. Healthcare service quality was evaluated by patients as a little more than acceptable, given its mean score of 3.55/5 (95% CI = 3.51–3.59). Regarding remaining variables, BMI is at a normal level and the mean age is quite young, reflecting the reality of Vietnam’s young population.
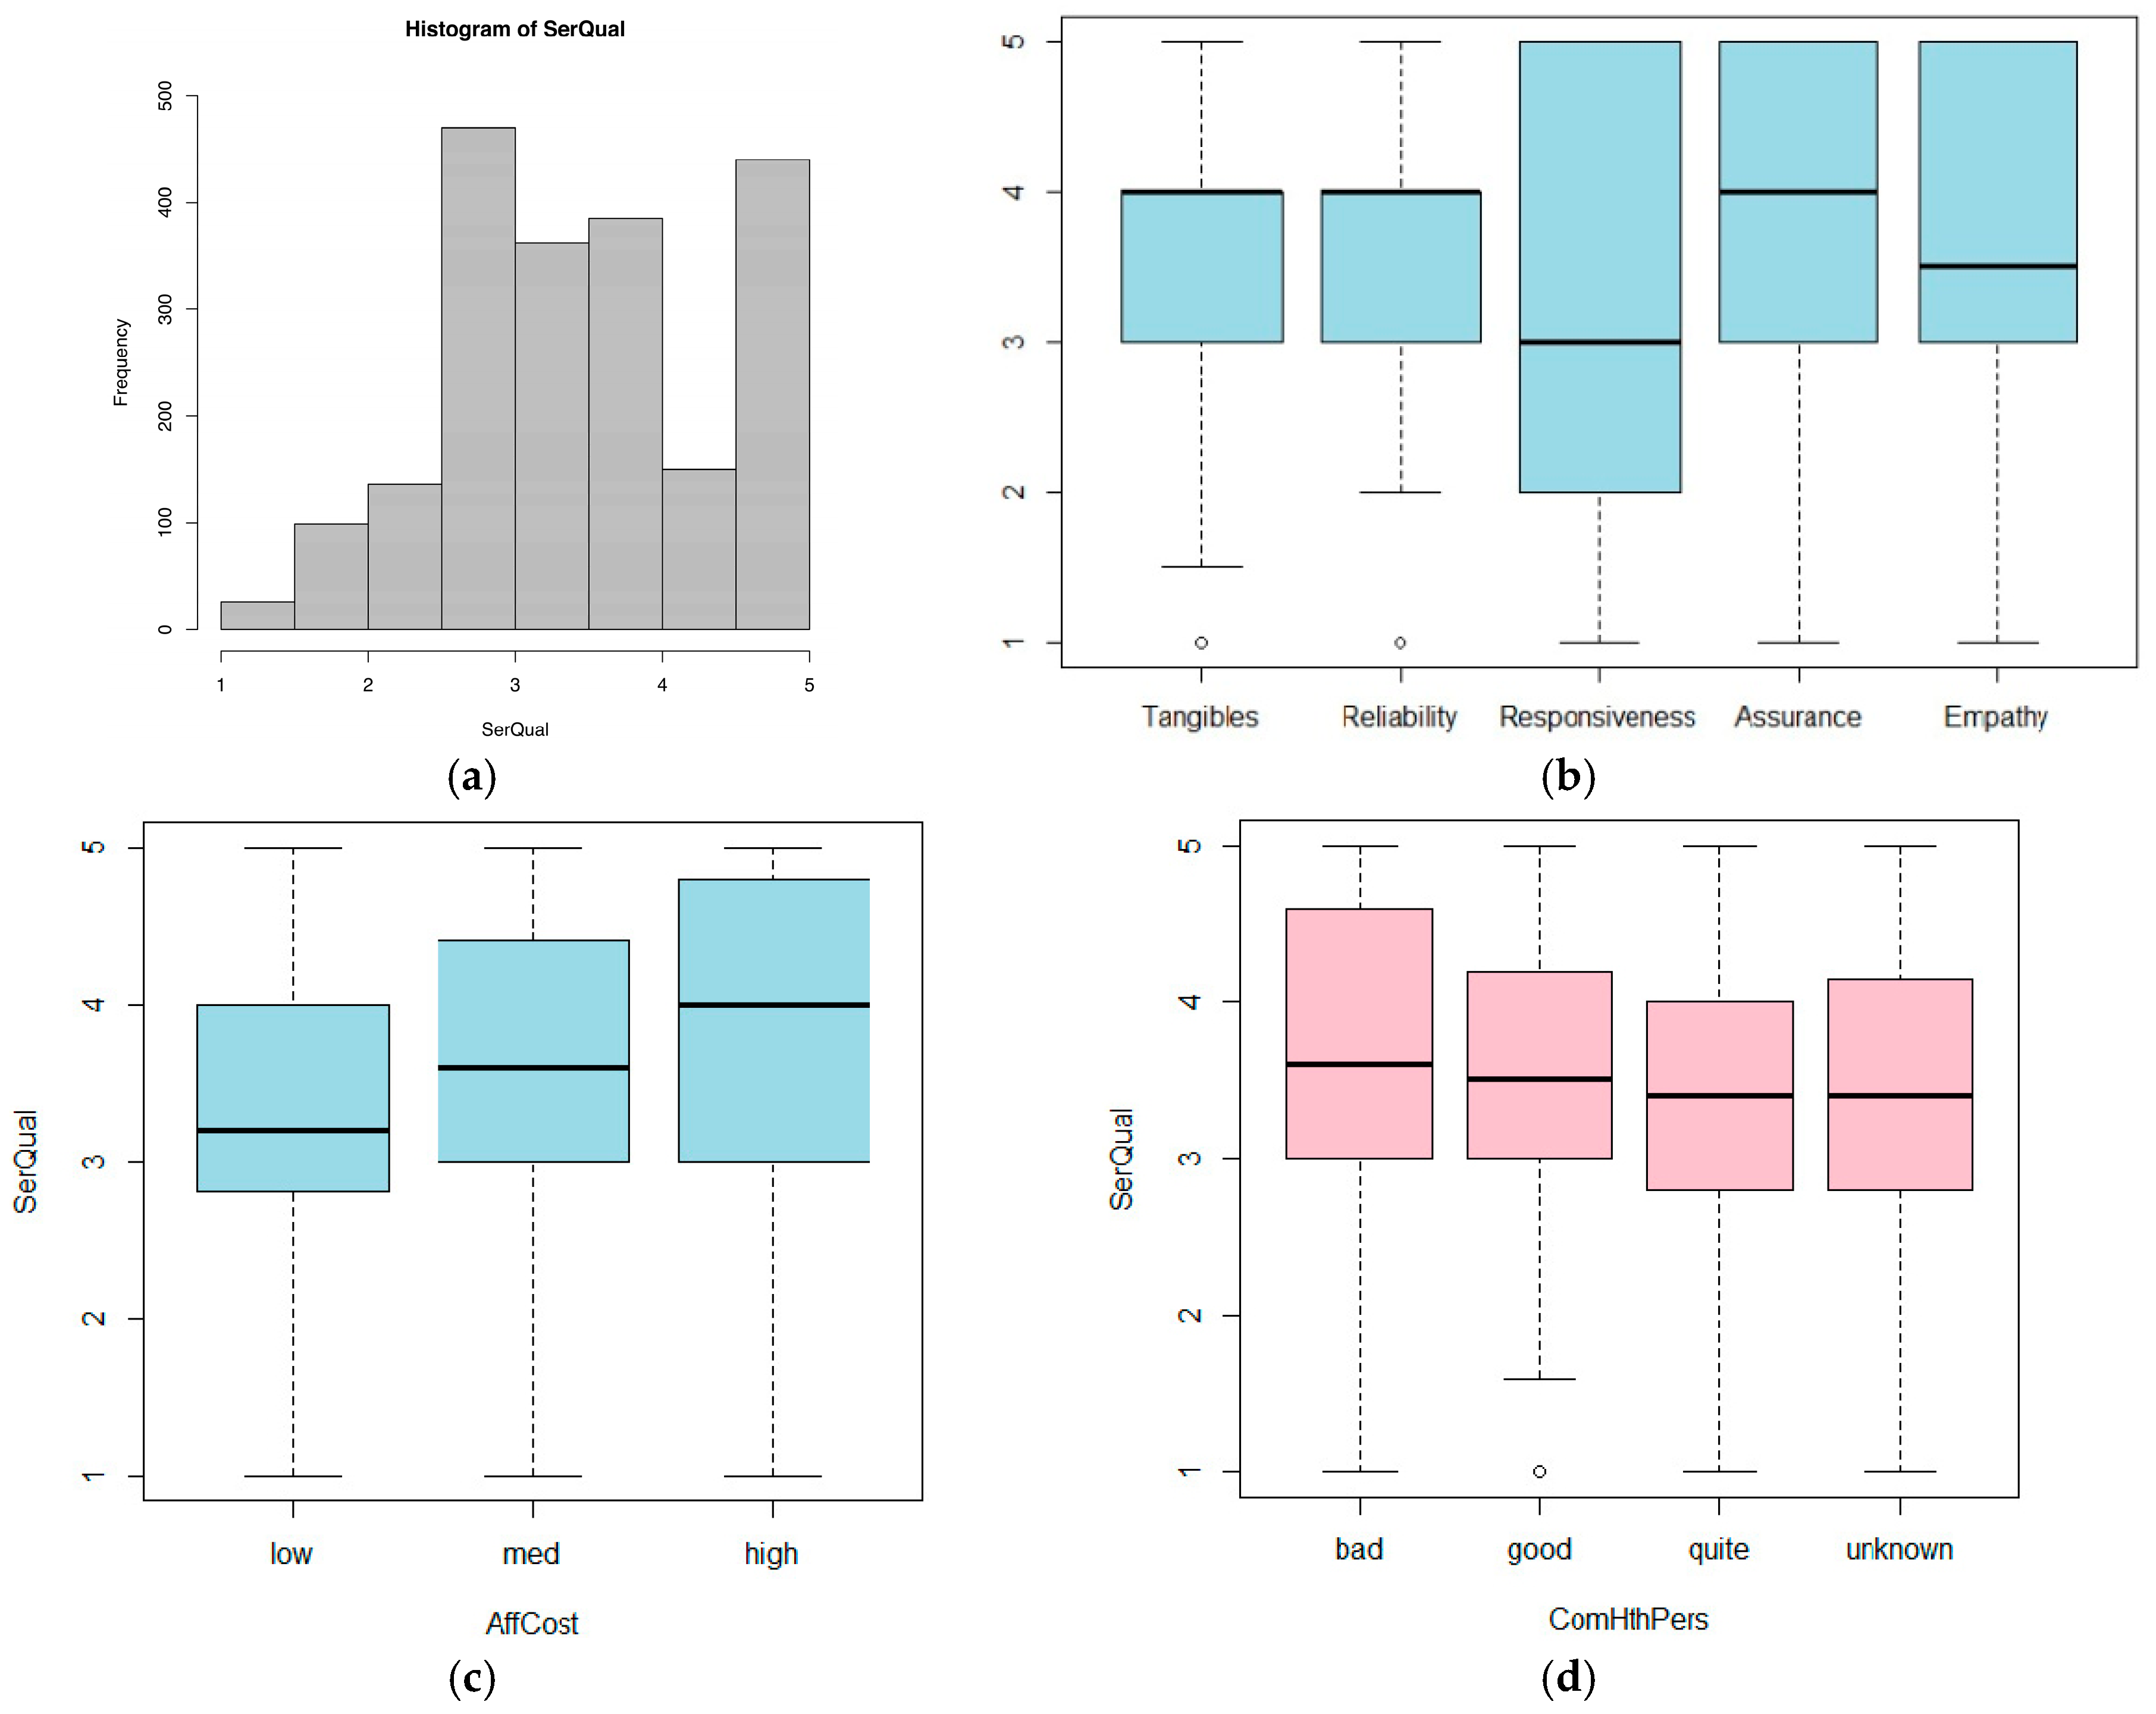
Figure 1 provides other figures from the dataset.
3.2. Factors Affecting Health Care Quality as Perceived by Patients
Factors that were considered influential to popular attitude towards the quality of medical care include: demographic elements, namely age and marital status; socio-economic elements, such as health insurance and quality of health communication; and personal, subjective elements, such as affordable cost limits, having friends/relatives in prolonged treatment, and experience of taking care of patients. (For more details on the measurement of these indicators, refer to
Section 2.1. Measures above.)
Regression was performed to determine the impact of these factors on the perception of patients on health care service quality. Results are shown in
Table 3.
It could be seen in
Table 3 that all standardized coefficients in the model were statistically significant with
p < 0.05, which confirmed the correlation between these factors and people-perceived health quality. This relationship was represented in the equation below:
The factors affecting health care quality evaluations could be divided into two groups: (1) positive factors, and (2) negative factors.
Among the factors in Group 1, health communication (“HealthCom”) had the strongest influence, with β2 = 0.210 (p < 0.001). This coefficient implies that, controlling for other factors, when health communication increased one point, health services quality increased 0.21 points on average. In addition, affordable cost estimated at over VND 2 million (“AffCost” at “hi”) and experience of caring for patients (“ExpCare” at “yes”) also belonged to this group. This showed that the willingness to pay a periodic general health examination at a high cost and the experience of taking care of patients also improved the general attitude towards healthcare services.
Group 2 consisted of age, possession of insurance (“HealthIns” at “yes”), a marital status other than married or unmarried (“Maritalstt” at “other”), an affordable cost of under VND 1 million (“AffCost” at “low”) and experience of prolonged treatment (“AcqTrmt” at “yes”), all of which had negative coefficients. It was worth noting that, surprisingly, possession of health insurance could lead to patients’ bad impression of healthcare services quality, with coefficient β3 = −0.208 (p < 0.001) indicating that insured people evaluate medical care quality 0.208 points lower than the uninsured (other factors controlled). Furthermore, the negative values of β1, β4, and β7 also indicated that older people who were widowed or divorced and those with friends or relatives who had experienced or were experiencing prolonged treatment tend to be more critical in evaluating the quality of services they receive. In other words, young people, married or unmarried people, and those surrounded with people in stable health conditions were more likely to express positive feelings on health care quality.
3.3. BMI, Quality of Health Communication, and Healthcare Quality Affect People’s Perception of Public Health
The BCL model was employed to examine the influence of BMI, health care service quality and health communication quality as perceived by patients on patients’ view of public health.
Table 4 provides the estimates.
With 0.05 being the level of significance, all estimated coefficients in the model were statistically significant, except for β2 in the logit(good/quite) model. Therefore, it could be affirmed that there existed a relationship between the above variables.
Regression equations were established as follows:
Compared to health communication and health care quality (both reported as perceived by patients), BMI had a weaker impact on people’s perception of public health, with a coefficient of merely 0.064. It could be calculated that a person of average BMI (20.85), evaluating healthcare quality as average (3.55 points) and rating health communication quality at the lowest point (one point), would have a 55% probability of having a pessimistic (“bad”) view on public health. The numerical value (0.555) was computed using Equation (6).
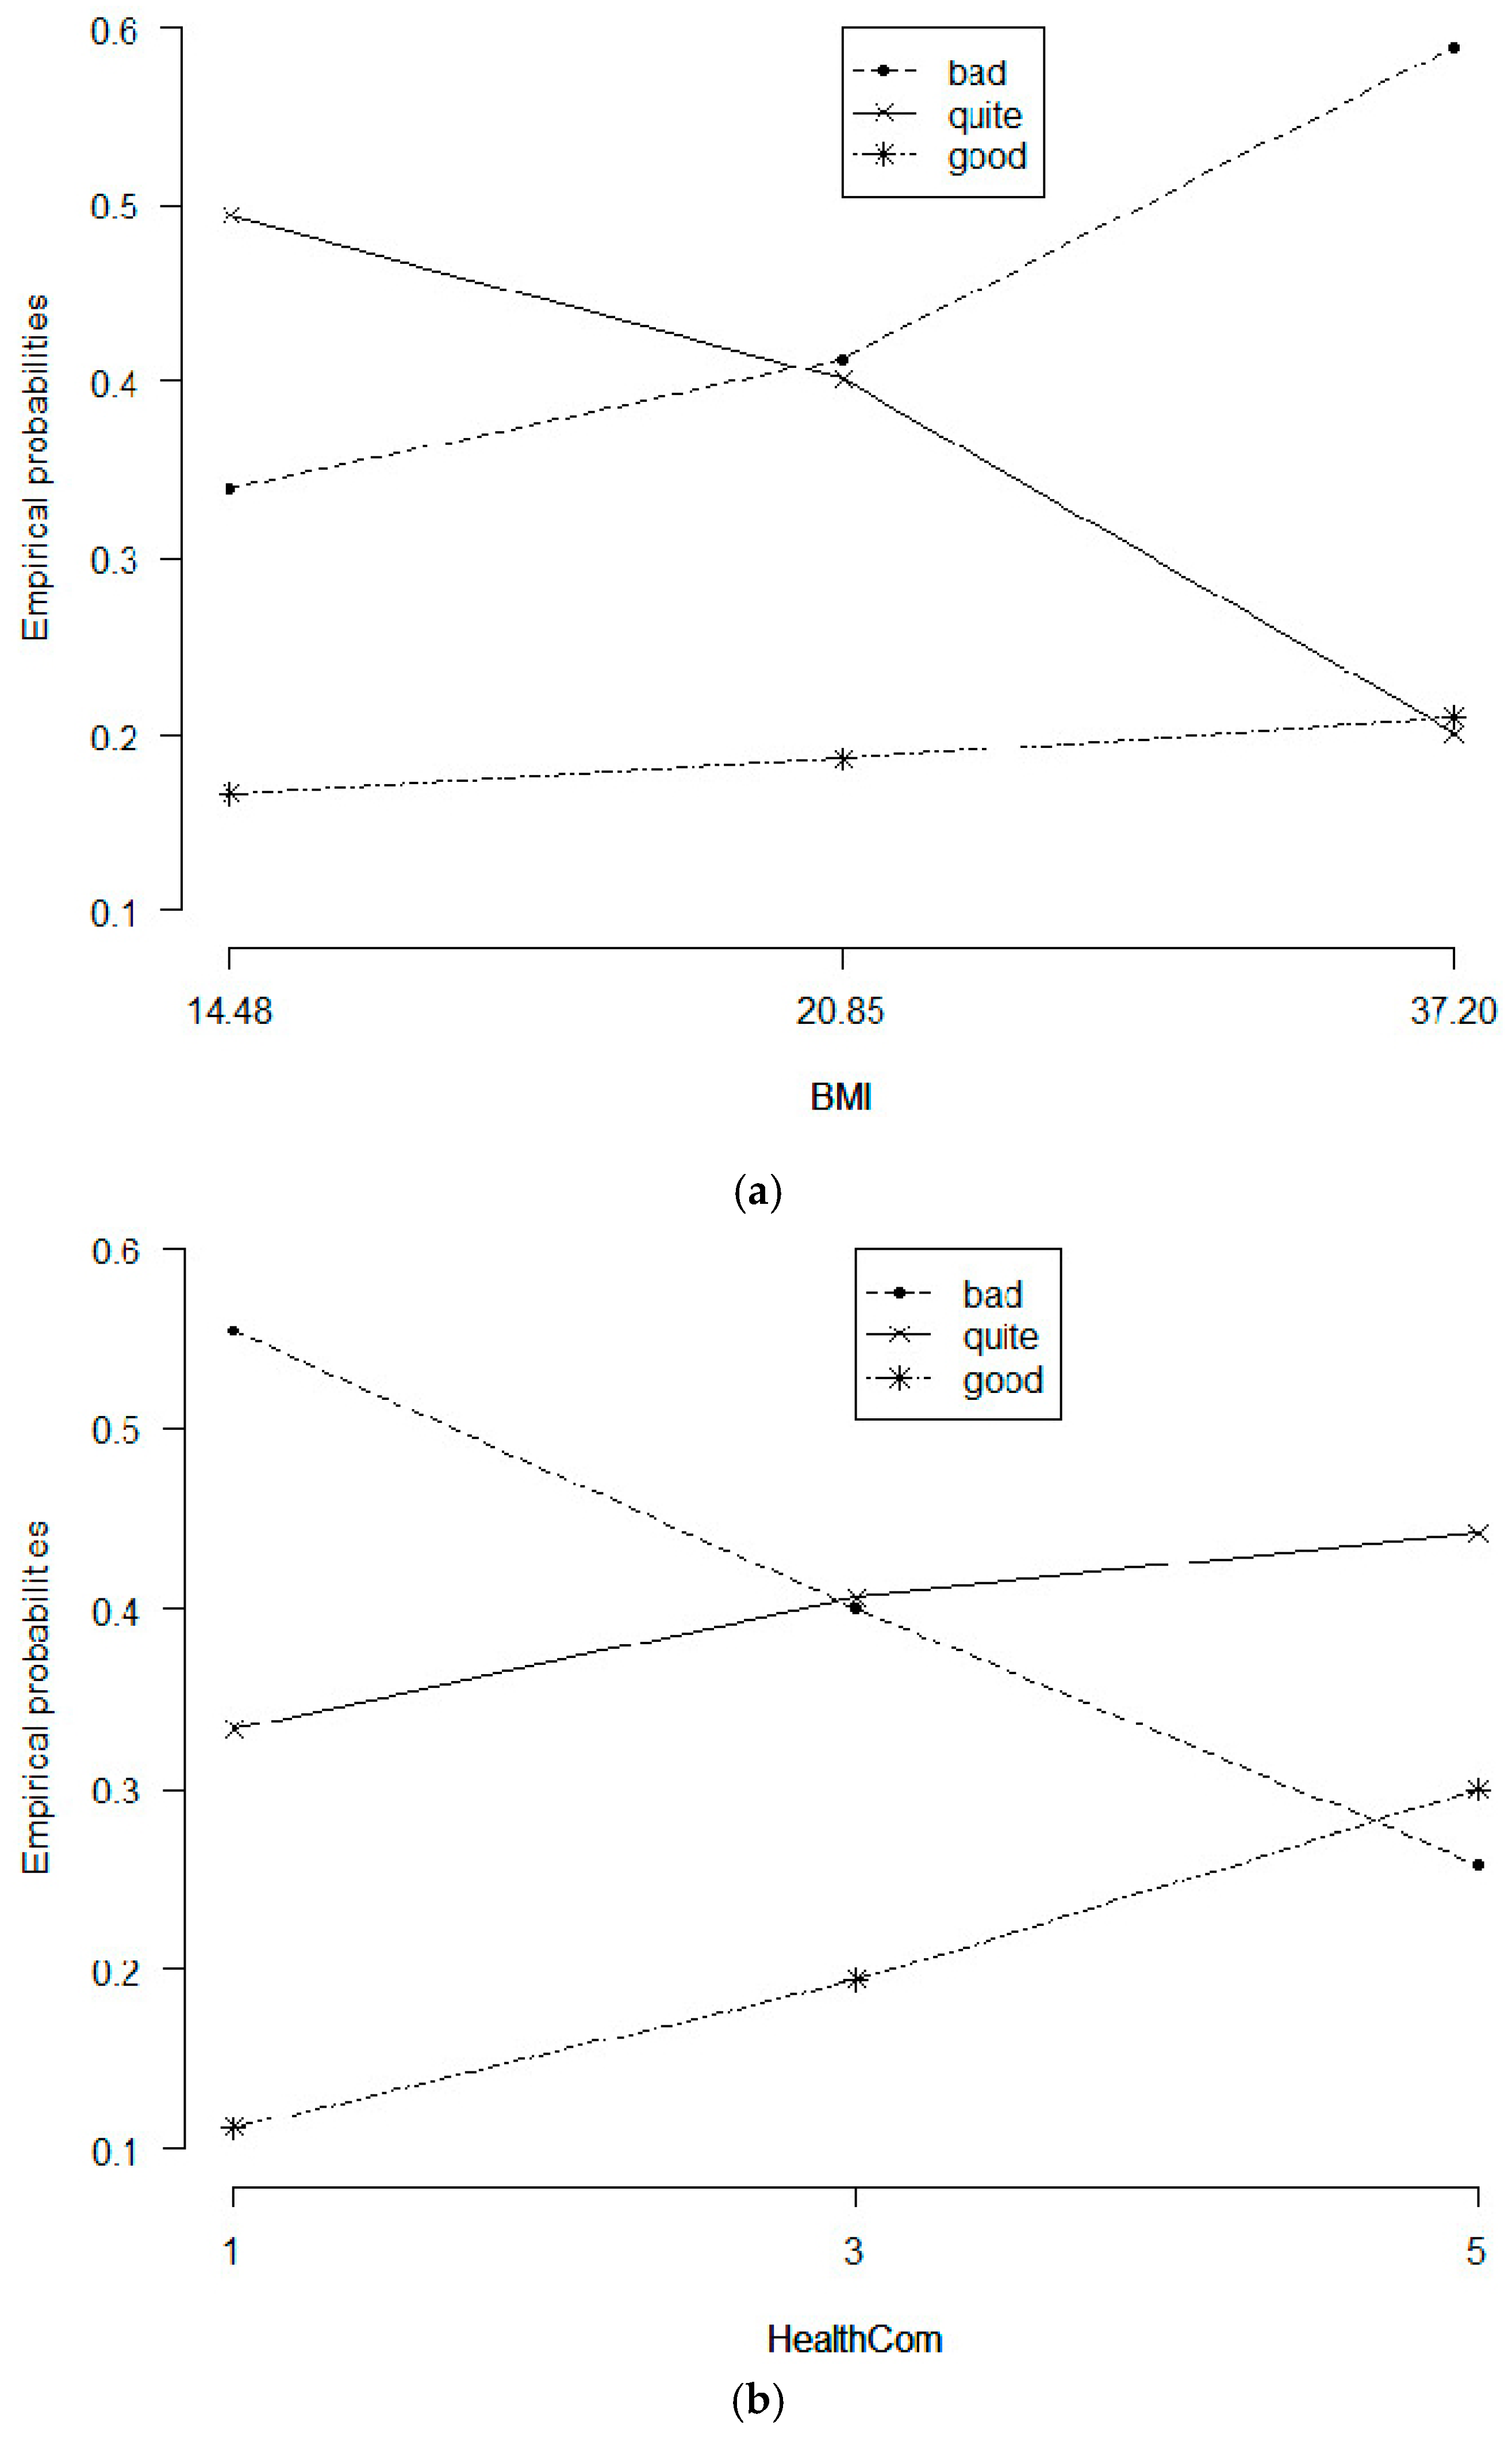
Using the same methods, we calculated probabilities of other variables in other conditions. These probabilities were presented in
Figure 2.
Figure 2a illustrated different perceptions of public health of the people with different BMI. People with higher BMI tended to be more negative about public health. This propensity was more obvious when BMI exceeded the average point, which was revealed through opposite trends and changes in slopes of the lines representing a very optimistic perception (“good”) of the current state of public health and its pessimistic counterpart (“bad”) at BMI = 20.85. Observing the line representing optimism in public health, one could remark that the probability of optimistic perception increased mildly when BMI increased, which seemed to show that an increased BMI boosted pessimistic perceptions as well as very optimistic ones. However, not only the likelihood of optimistic perception about public health was generally not high, its increase was insignificant, particularly in contrast with the stark drop in the probability of moderately optimistic perception (“quite”). It was safe to say that in general, a higher BMI resulted in less optimism in the current state of public health.
Figure 2b represented the influence of health communication on how people perceived health care service quality. Media indeed had a powerful impact on popular perception: when moving from the lowest score to the highest score of service quality as rated by patients, both lines representing very optimistic and moderately optimistic views regarding public health went up, while pessimistic perception went down in probability. The likelihood of a very optimistic view of public health might go up to 74% at its peak. This means that when health communication is sufficient, attractive, emphasized, and popular, public perception on the status of collective health in a community can be improved drastically.
Similarly,
Figure 2c once again affirmed the modest level of optimism concerning public health, with lines depicting changes in probabilities of popular perception about community health according to perceived health care quality. The probability of very optimistic perception went flat with all points lying under 20%, even decreased slightly (from 18.7 to 17.7%) when health service quality score rose from three to five points. Notably, the likelihood of pessimistic views fluctuated from 26% to 51% in an upward trend when healthcare quality increased, and vice versa for that of moderate optimism. In summary, improvement in patient-based evaluation of health care quality did not encourage and even reduced good feelings about public health.
4. Discussion
Based on the above results, this section will evaluate the influence of the aforementioned factors on social sustainability through their impact on health care quality, as well as public health.
Quality of health communication, willingness to pay high treatment costs, being married, being young and having experience in taking care of patients—these are factors that could increase positivity in patient attitude towards health care services, which is in line with recent empirical findings on determinants of patient satisfaction [
35]. Of these factors, health communication and marital status are the most influential. When the quality of health communication rises, people receive more information, both in quality and quantity; their assessment will be more informed and reasonable instead of being characterised by flawed remarks due to a lack of information, which leads to a lack of empathy for medical staff, who usually work in a stressful environment [
34,
36].
In the same vein, similar explanations go for those who have had experience taking care of someone ill. From their experience, they have a deep empathy for the job of taking care of patients, like doctors and nurses. This is still true when comparing those already married and others (single, widowed, or separated). On average, married people assess the quality of health services to be 0.386 points higher than those who have another marital status. We can assume that marriage, primarily, involves health communication and is related to better medical knowledge through an increased amount of (reliable) information. Previous studies have even found family is the primary unit for health education in all countries, despite the country’s level of economic development [
37]. Family members can be a source of healthcare information and can affect other members’ self-care attitude and preventative behaviours [
38].
Health care costs and quality have a mutually influential relationship. When patients feel that medical facilities in a hospital are dependable, they will be willing to pay a higher price, corresponding to with what they receive [
39]. Conversely, when they pay high costs, it is usually for better service which will in turn make them rate health care quality higher.
Contrary to some of our results which are consistent with the extant literature, the impact of factor of age in our study stands in contrast with previous findings. Coulter et al. and Keller et al. proved that younger people tend to be more critical in assessing quality of medical care [
40,
41], but the opposite was concluded in this research. The older appear more critical when giving opinions about healthcare quality. It should be noted, though, that the difference is not really clear as each unit of increase in age only leads to 0.005 points of decrease in healthcare quality (Equation (4)).
It is also noteworthy that having health insurance results in a more negative stance on health care. This may be because, counterintuitive as this might sound, patients may receive services with worse quality when they have insurance. In fact, with health insurance, patients pay less money for the treatment—in some cases, reimbursement rates can be up to 100% in Vietnam. This could potentially induce medical staff to become less conscientious with insured patients because they do not see a direct turnover to them.
This problem could also be linked to having friends or relatives who have had prolonged treatment also rate quality of treatment at lower levels. The reason might be that they were influenced by the opinions of their friends or relatives, who bought health insurance to alleviate their financial burden during the treatment [
34] and had poor impressions about the service quality.
With respect to people’s perceptions about public health, the findings separate into two main conclusions. The first one concerns body mass index (BMI): the increase in BMI causes a relative decrease in the probability of good feelings about public health (from 66% down to 41%). This effectively means that when someone is less healthy (represented the risk of being overweight, in this case), they are more likely to project their own concerns on the rest of society, thus feeling pessimistic about the current state of community health.
The second was one of the most intriguing results we have found: an increase in quality of health care services leads to decreased likelihood of optimistic feelings about public health (from 74% down to 49%), contrary to most expectations. However, it can be explained as follows: these two variables are assessed simultaneously by the respondents, and both are influenced by the patients’ subjective feelings and perception. When a person has a pessimistic outlook on the status of public health, they will make every effort to choose the best care services for themselves. In Vietnam, it is usually private hospitals or clinics that offer service packages. These packages are mostly high-quality due to modern equipment and responsiveness of the staff. It should be noted that these types of service does not usually come in an affordable price to a sizeable part of the population, and are typically used by those of at least over-average income. In fact, if we take into account the fact that costs and quality are mutually influential, as concluded above, we could essentially say: those who earn enough to afford good services are pessimistic about public health, while those who somehow feel better about public health are often not as wealthy and are discontent with the quality of the health care they could access.
This not only, once again, implies a growing gap of inequality among the wealthy and the less fortunate, but also a collective dissatisfaction towards the health care system, in particular, and the governmental system, in general. As such, if Vietnam wishes to sustain its social stability in the long-term, it is indispensable that the Vietnamese government works on improving health care quality by renovating facilities, updating medical equipment, and devising better training programs for the medical personnel. The fact that the current health insurance system and policies are inadequate—if not potentially damaging—in maintaining and promoting equal access to health care is not new and conforms to previous findings [
38,
42]; thus, it is advised that the government takes an alternate direction in health care reforms. At the same time, thorough attention should be given to the communication of health-related knowledge: health campaigns, rather than consisting of mostly propaganda-style PSA, should be done in a more pragmatic manner in order to raise public health awareness. A suggestion would be to employ young people in media campaigns, as they are flexible and up-to-date with international trends on methods of garnering public attention, and are also more favourable to the current quality of the health system.


