Thermal Ceramic Panels and Passive Systems in Mediterranean Housing: Energy Savings and Environmental Impacts

Department of Building Construction, University of Alicante, 03080 Alicante, Spain
Sustainability 2017, 9(9), 1613; https://0-doi-org.brum.beds.ac.uk/10.3390/su9091613
Submission received: 1 August 2017
/
Revised: 5 September 2017
/
Accepted: 8 September 2017
/
Published: 11 September 2017
(This article belongs to the Special Issue Sustainable and Resource–Efficient Homes and Communities)
Abstract
:This research examines the benefits of designing a living space in a basement, as a method of passive temperature control in summer, combined with thermal ceramic panels (TCP) on some walls. These panels incorporate a capillary system of polypropylene tubes which work with cold water. We studied a detached house on the coast of Alicante, where the moderate temperature of the ground tempered interior conditions of comfort using the flow of air from the basement, significantly reducing energy demand and environmental impacts. This reduction was quantified through simulations using the Design Builder tool, having previously monitored the state of the building, on scenarios of a house without a basement, a house with a basement and an all-air system, and a house with a basement and radiant surfaces, using TCP panels on walls. This latter passive system led to a 10.25% reduction in annual energy demand. When we combined it with the two possible air conditioning systems, comfort achieved using the TCP panel system improved by 45.8% compared to the all air system in the living room on the ground floor and by 17% in the basement living room. In addition, annual energy demand and environmental impacts deriving from the use of the installation decreased by 31.8% with the TCP system.
1. Introduction
Housing construction in the Spanish Mediterranean has lower quality standards than in other EU countries, or in other large areas of inland Spain. Spain’s regulations dating back to the 1970s were very undemanding concerning parameters such as thermal transmittance, air permeability through frameworks and joinery, reduction of thermal bridges in building envelopes, etc. In recent years, the Technical Building Code (“Código Técnico de la Edificación” or “CTE” in Spanish) has led to higher standard requirements in Spain. The DB-HE energy-saving technical document [1] recommends the application of the unified tool Lider-Calener (HULC) [2] to single-family as well as collective housing projects. This tool creates a model of the project and then applies a climate file, which is part of the tool, taking into account the town’s location and altitude. This enables obtaining the value of annual energy demand and its energy rating according to air conditioning systems and energy sources used in the building.
Although the use of this tool is a big step forward, it is far from leading towards an adjusted or calibrated simulation illustrating a building’s actual behaviour. Furthermore, the tool does not allow incorporating bioclimatic techniques commonly used in architecture, making it difficult to quantify energy saved using these techniques [3]. This significant limitation means there is little incentive, to apply the tool to residential buildings. The pursuit of energy ratings for these HULC buildings means that specific energy solutions, which are often promoted by poorly justified energy policies, are chosen over passive conditioning systems [4]. Finally, other tools, such as Design Builder (DesignBuilder Software Ltd, Gloucs, UK) or TRNSYS (Transient System Simulation Tool, Thermal Energy System Specialists, LLC, Madison, WI USA), allow for adjustments according to actual use, such as opening and closing windows according to time schedules, using thermal inertia of locking systems for thermal comfort and reducing energy demand through phase change materials (PCMs) [5]. They are also able to simulate the building’s behaviour after implementing bioclimatic techniques and passive conditioning systems.
Climatic conditions of the Spanish Mediterranean coast are well known. In summer, between June and September, temperatures range from 30–35 °C during the day to 22–27 °C at night, with a continuous presence of sea breeze. Relative humidity is high, and varies between 60% and 80%. The months of May, October and November can be described as summer conditions, with more moderate temperatures. The sea breeze generally tempers the climate, with gentle oscillations between day and night phases. Winters are therefore mild, with temperatures usually between 10 and 18 °C and with short cold phases over periods of snow in the interior of the country, with temperatures between 5 and 10 °C.
These conditions are even more favourable on the coast of Alicante, although climatic conditions in summer have led to the installation of air conditioning in most modern buildings [6]. The most commonly used system in residential housing is the variable refrigerant volume (VRV) split system, which uses reverse cycle in winter or heat pumps. Winter conditions are fairly mild, so by applying high quality standards to lock systems, peaks of energy demand at low temperatures are easily solved by occasional use of electric radiators, or supply air in heat pump systems, all based on electric power. Other alternative air conditioning systems, however, are starting to be used, despite the fact that they are not being sufficiently supported by energy policies, building planning or tax exemptions [7]. They are nonetheless beginning to be adopted as part of a quest to achieve greater comfort, save energy and reduce environmental impacts [8].
Unlike convective air conditioning systems, radiant surface conditioning systems have been used in buildings for decades. When exchanging energy, water-based systems have proven to be more energy efficient and lead to faster return on investment than those based on Joule effect electric energy [9]. In addition, the use of water at moderate temperatures of 30–35 °C in winter and 10–17 °C in summer enables using alternative energies, such as solar energy, geothermal energy, or chemical energy systems based on lithium chloride [10]. Furthermore, water-based systems, also called hydronic systems, can be conditioned during the entire annual cycle, distributing hot or cold water as required, while systems based on Joule effect can only be used during winter. In this way, hydronic radiant surface heating systems (HRSHS) lead to significant energy saving, both in energy sources and in efficiency of water distribution through small pumps or circulators. Energy distribution through supply air requires much greater consumption than in hydronic systems [11].
In architecture, the first systems to distribute water through closed circuits used pipes made of copper or plastic, mainly reticulated polyethylene. Most common diameters were 16 or 20 mm, with separations or “modules” between 10 and 30 cm. They were installed most frequently under the floor as this was easier to execute, and they were in fact denominated “thick tube” systems. Thin tube or “capillary tube” systems [3] were implemented in the mid-1980s. They are mat-like systems, based on polypropylene tubes having a diameter of around 3 mm. These mats were designed with gaps of around 10 mm between tubes, which were attached to flow and return manifold tubes having a diameter of 20 mm, by thermal fusion bonding. There are many ways of making the mats according to the manifold layouts. The size of gaps in the mat grid is variable, with widths from 150 mm to 1210 mm and lengths from 600 mm to 6000 mm. In this way, by hugely increasing the total surface area of the capillary tubes and creating a high density of thin tubes, the energy exchange with surface materials intended to be cooled or heated became more efficient. Furthermore, the ease of design, layout and assembly of these capillary tube mat installations made it possible to apply them to floors, ceilings and walls in any geometrical shape. Today, most common installation systems are underfloor, in plaster or metal modular suspended false ceilings, or in plasterboard cladding in walls and ceilings. A new way of conditioning architectural spaces offering significant advantages in terms of comfort and energy saving was thus achieved. Heating and cooling through the very surfaces that constituted the spaces became possible. Since capillary tube mats can adopt any format, it is possible to make prefabricated panels with different finishing materials, which connect to water distribution circuits of flow and return with a simple “click & cool” joint. The finishing material’s thermal conductivity has an impact on the system’s efficiency: the greater the conductivity, the higher the starting up speed will be and the greater the panels’ thermal performance will be [12].
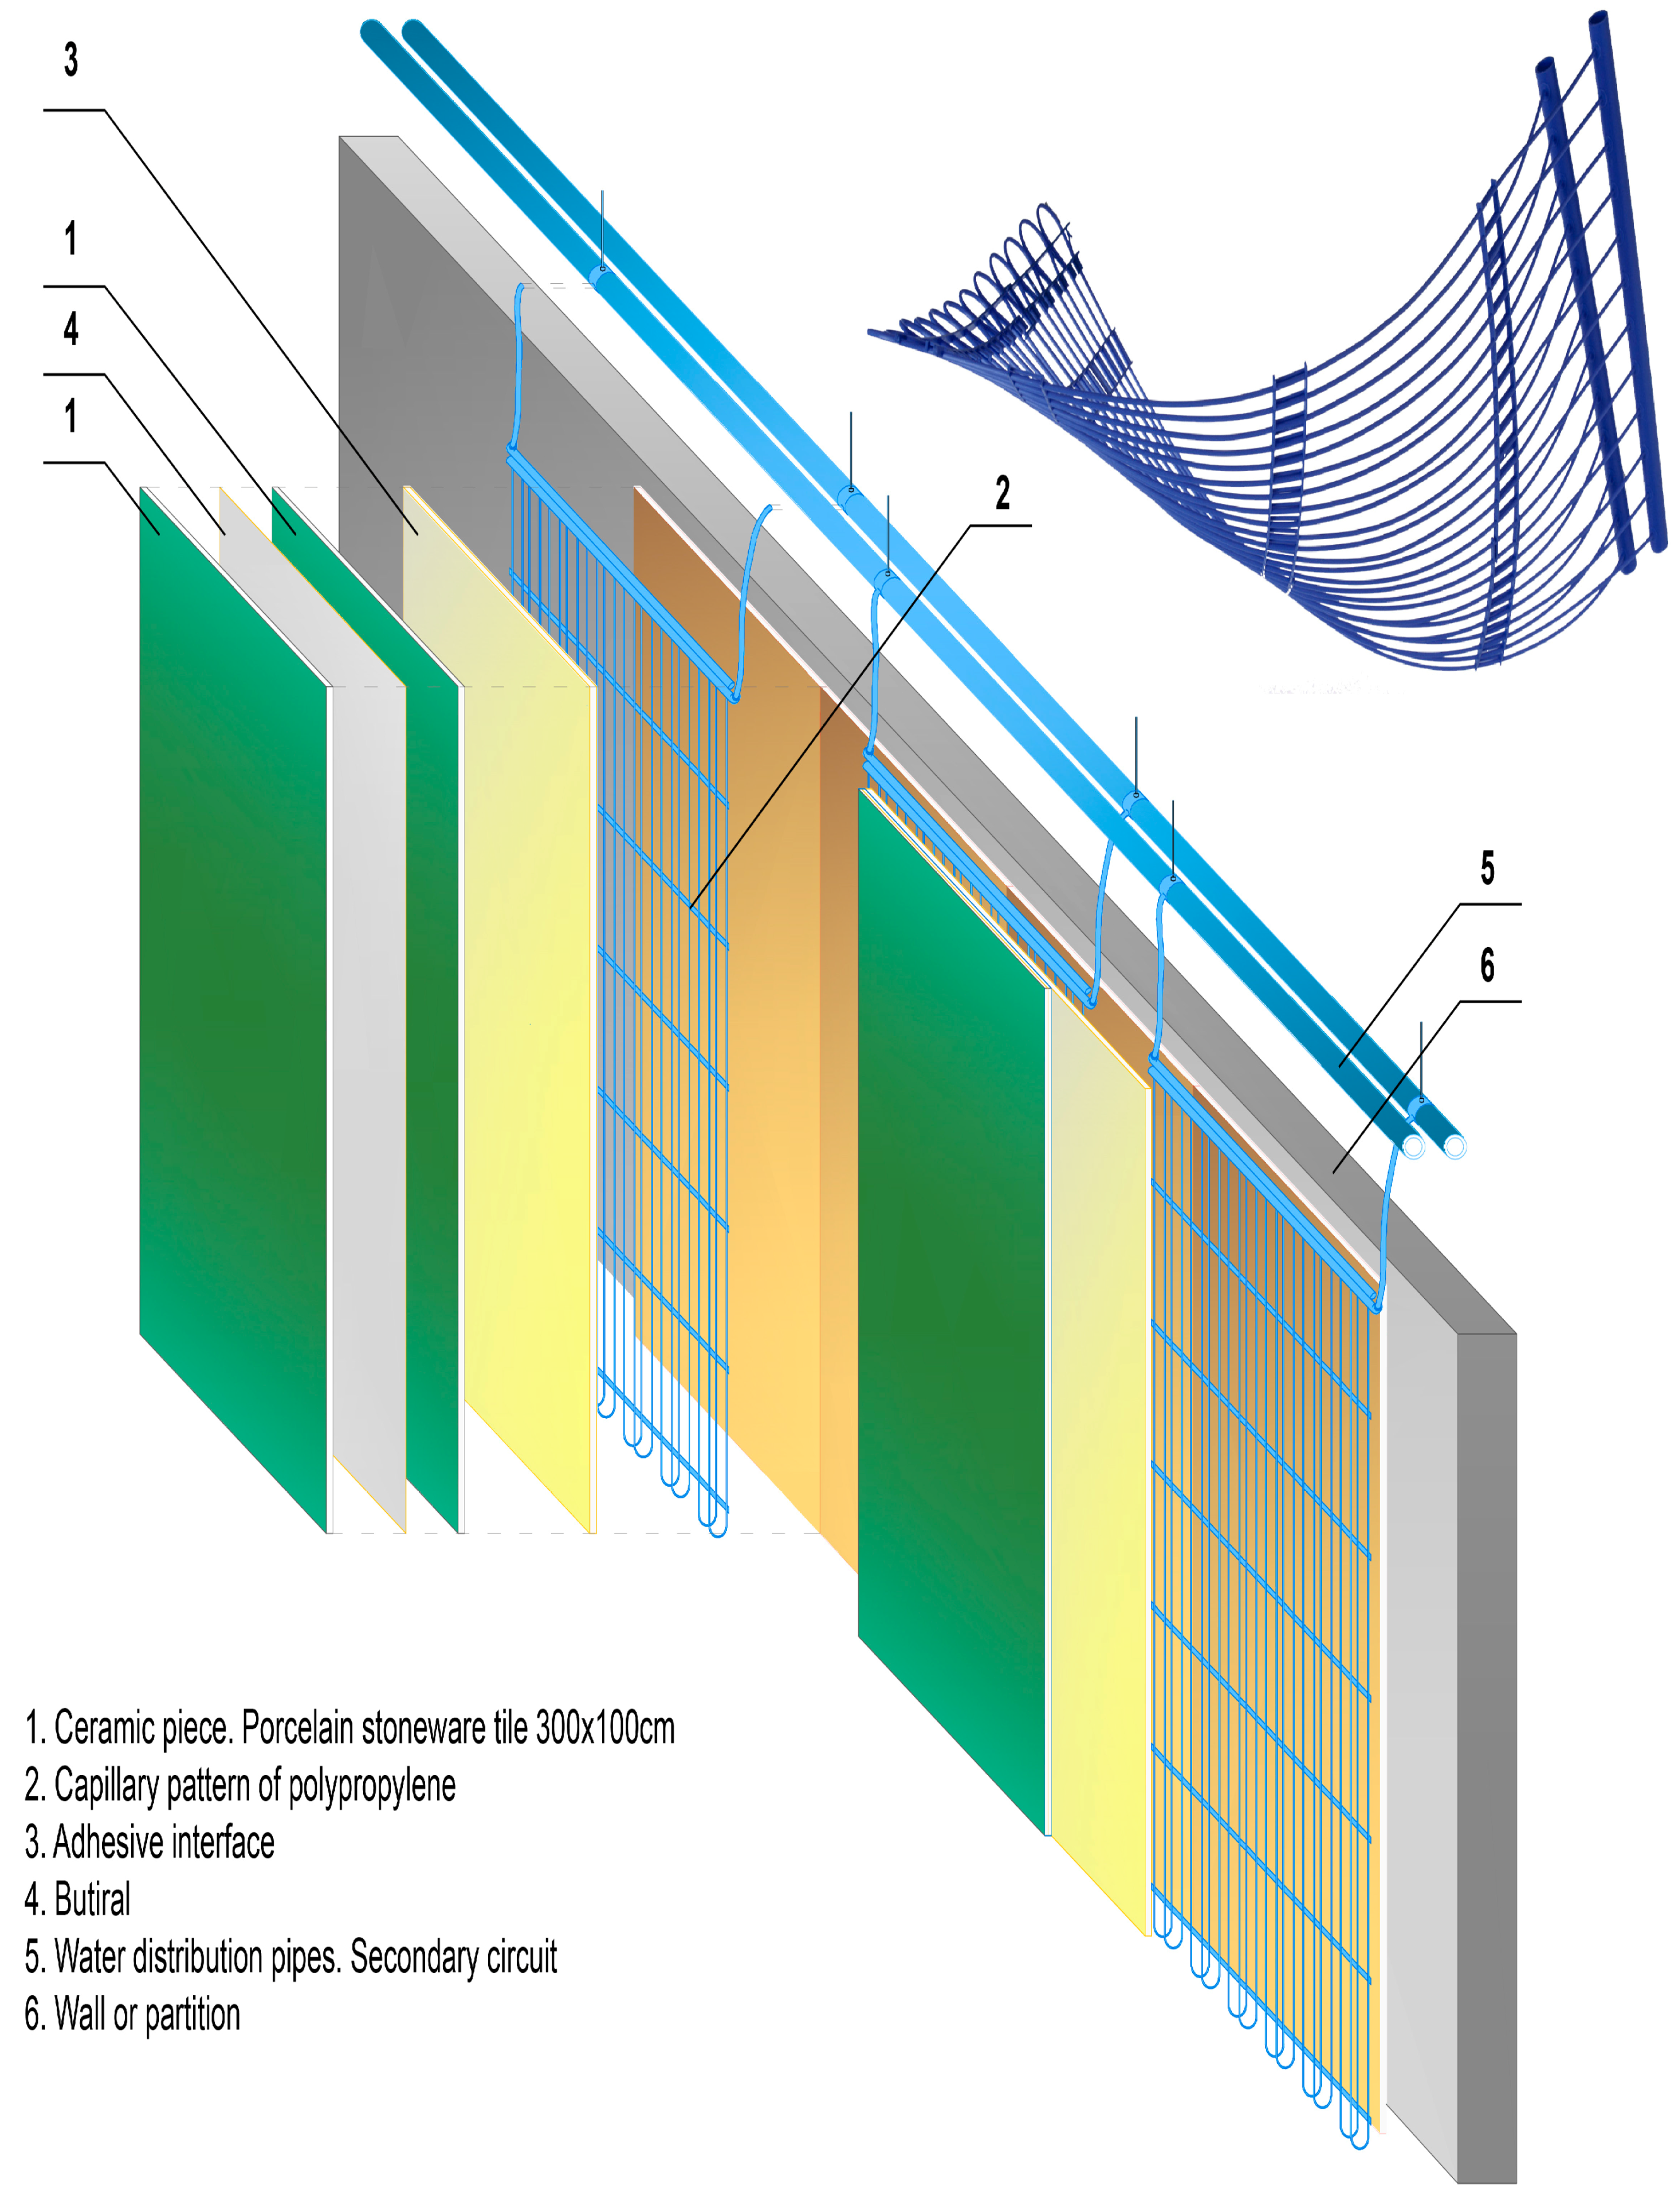
The “Technology and Sustainability in Architecture” research group at the University of Alicante (Spain) recently obtained a patent for a thermal ceramic panel (TCP) [13] based on porcelain stoneware tiles incorporating capillary tube mats of polypropylene tubes using conductive paste adhesive (Beka, V.WLP.1 Thermal Conductive Paste) (Figure 1). Tile formats range from pieces of 60 cm × 60 cm for false modular ceilings, up to 320 cm × 160 cm and 16 mm thick, with large format ceramics 3 mm thick, and a maximum weight of 32 kg/m2. This lightweight panel can be easily placed on walls and ceilings using a metal rail fixation system, or by hanging it in a “baffle” mode [14], i.e., with suspended panels that provide thermal conditioning on both sides.
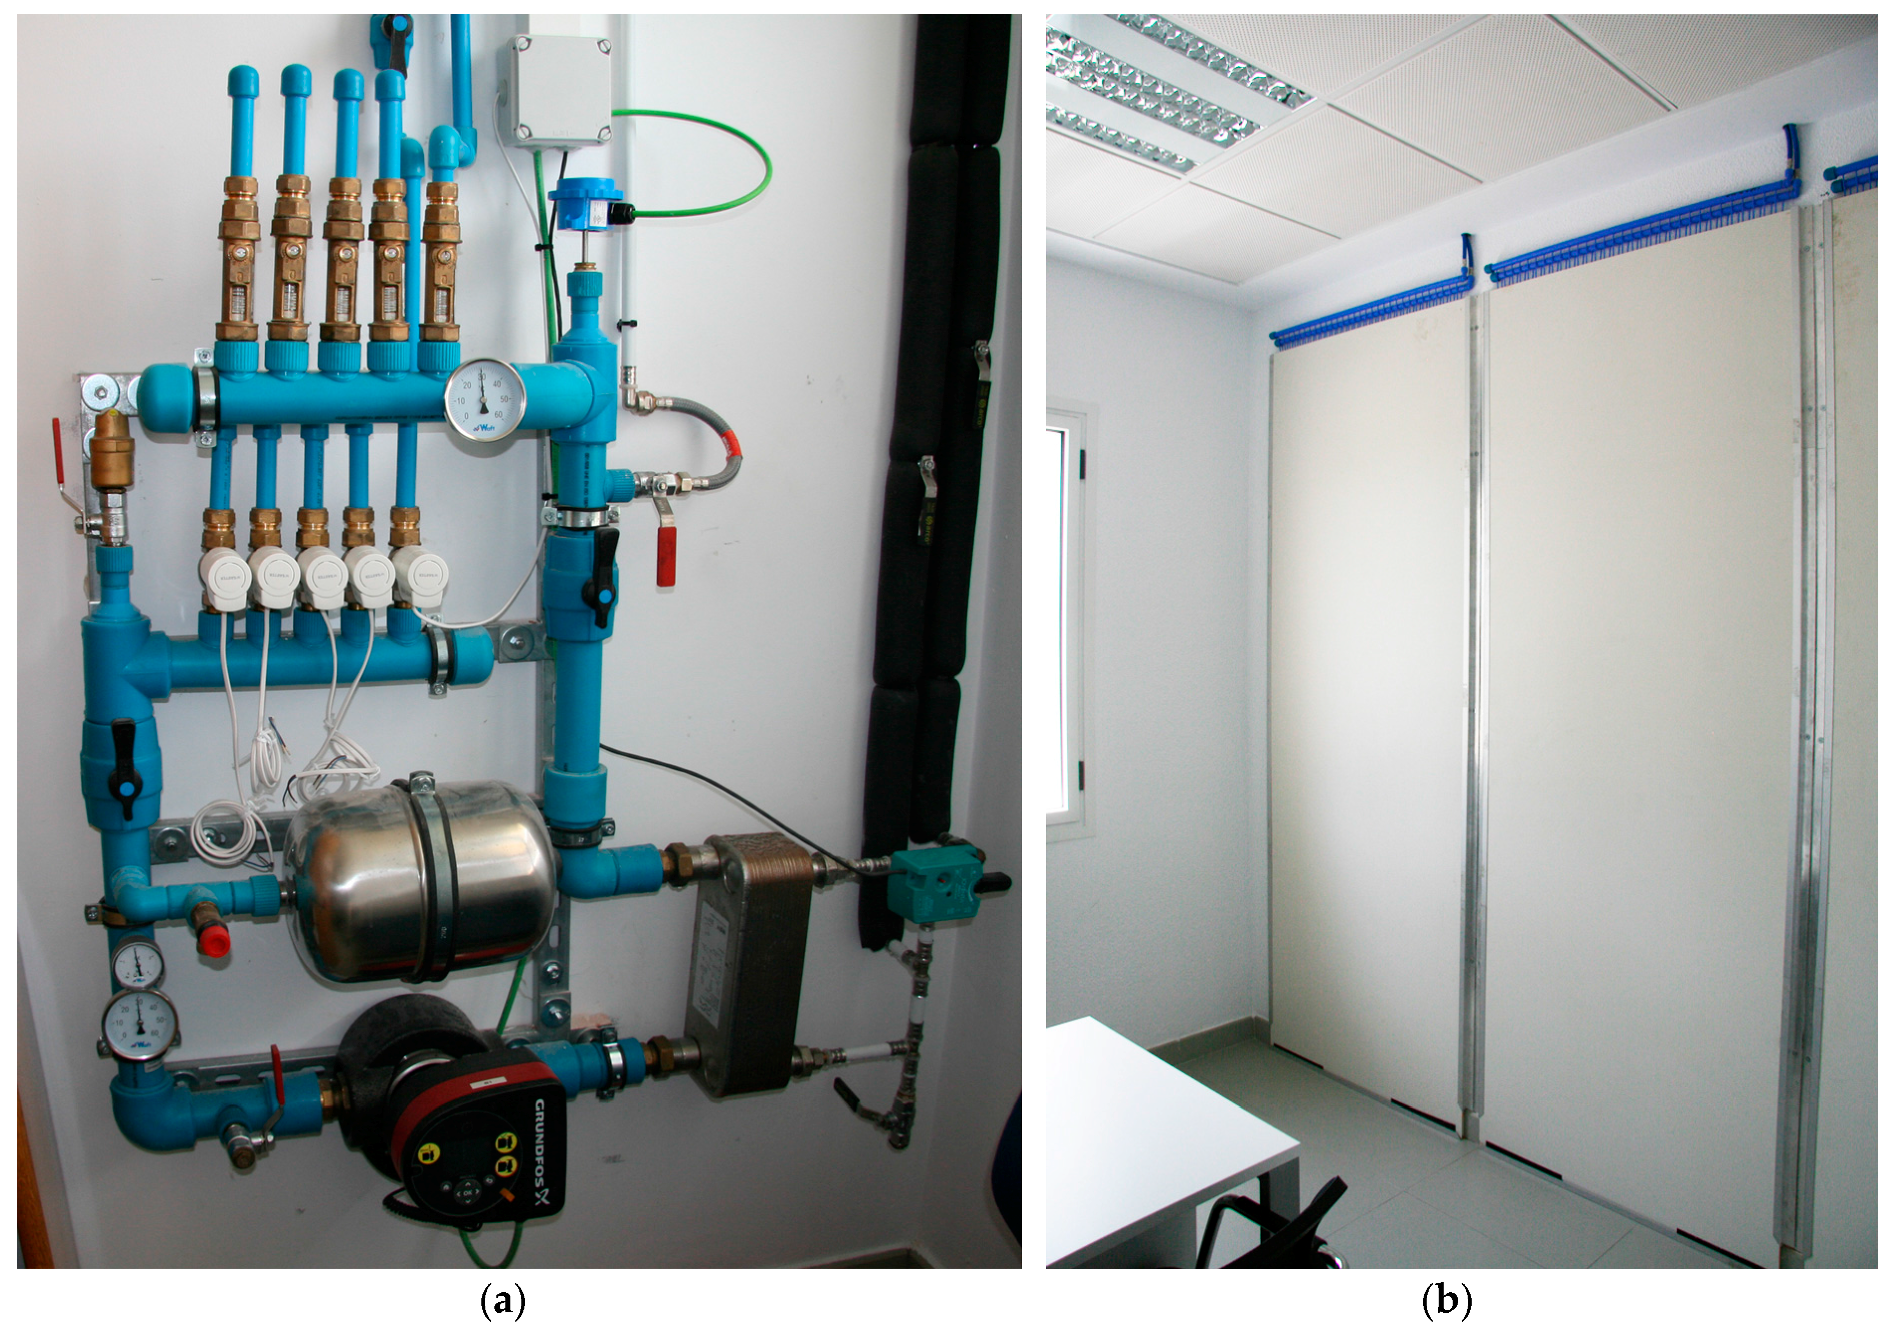
This study aims at quantifying improvements in comfort, reduction of energy demand and reduction of environmental impact derived from the use of these thermal ceramic panels (TCP) in single-family houses in Eastern Spain, on the Mediterranean coast. We will also analyse the application of the bioclimatic technique of using basement terrain energy, and its combination with TCP panels. The benefits of this system will be quantified comparing them to all-air facilities, in terms of level of achieved comfort, reduction of annual energy demand and the environmental impacts deriving from the use phase of the building. This study also aims at quantifying the amortisation period of investment taking into account the increase in cost of the TCP system. For this purpose, a single-family home located near the coast of Alicante, only 200 m away from the beach of Albufereta, was monitored, and simulations of building behaviour were carried out using the Design Builder tool. To calibrate the model, an office with TCP panels at the University of Alicante was monitored (Figure 2), its efficiency was measured and parameters were obtained relating to surface temperature, relative humidity and temperature of indoor air, as well as indoor air velocity. These data were applied in the Design Builder model. Energy consumption of the house’s electric energy in its current state could not be used in the calibration, since the dwelling is bioclimatic and does not require a climate control system in summer. It was not possible either to perform a comparative analysis with other buildings as this was the first time these TCP panels were applied. Capillary mat systems applied to Mediterranean housing have never been studied either [15].
2. Physical Justification of Radiant Surface Conditioning
To determine an occupant’s sense of thermal comfort in premises or within an architectural space [16,17], it is necessary to carefully analyse all parameters that determine that sense of well-being, namely: the dry bulb temperature of the air, its relative humidity, the velocity of the air that surrounds it, and the surface temperature of each of the walls configuring the given area [18]. Other parameters have a direct effect, such as air purity, sound level and natural or artificial light. To analyse an occupant’s sensation of comfort across the different scenarios envisaged in this study, we will use well-known physical calculations that deserve a brief review. The human body’s metabolism uses chemical energy to feed processes in which work and heat are generated, while at the same time maintaining a virtually constant body temperature between 36.5 and 37 °C. To maintain an optimal feeling of comfort, this energy balance must remain constantly stable, according to the equation below:
where
- Σq is the body heat balance;
- is the heat from metabolic activity;
- is the heat transferred by evaporation (breathing and sweating);
- is the heat transferred or acquired by conduction;
- is the heat transferred or acquired by convection; and
- is the heat transferred or acquired by radiation.
The impact of temperature on the sensation of comfort mainly occurs over an individual’s heat transfer by convection and radiation, since heat transfer by conduction is usually quasi-negligible. Heat losses by convection are obtained via the following equation:
where
- : convection heat flow per m2 of body surface;
- : heat transfer coefficient;
- : wall surface temperature; and
- : Ambient air temperature.
The hc convection factor is directly related to indoor air velocity, and the occupant’s disposition. Typically, this factor has an average value of 3.5 W/m2 °C, with an air velocity of 0.1 m/s, and 4.5 W/m2 °C, with an air velocity of 0.2 m/s [19,20]. Its value can be obtained through the following equation:
Given that the average body surface value is 1.7 m2, the Equation (3) could be simplified for the total calculation of human convection losses:
Radiation losses are more difficult to obtain. They are based on Stefan–Boltzmann’s law, depending on the fourth power of individuals’ surface temperatures and the average temperatures the premises’ walls. When working with finite planes and considering various positions relative to the individual, it becomes extremely complex to determine heat transfer by radiation. Fanger quantified form factors that affect how the real value of the average radiant wall temperature is determined [19]. The expression of the calculation of Trm can be simplified according to the equation in his manual:
Experimentally, in the case of spaces of common dimensions, between 20 and 30 m2, and an approximate height of 2.6 m to 3 m, the form factor from floor to ceiling and from wall to floor or ceiling is around 0.4 and 0.15, respectively [19,20].
Since the different walls of the space occupied by the individual will usually have different temperatures, the occupant will exchange heat for radiation variably in each direction. The problem can be simplified by establishing an average radiant temperature, which also takes into account the impact of the form factor, according to the equation below:
By means of the mean radiant temperature thus obtained and the temperature value of the skin and/or of the individual’s clothing, the value of heat transfer by radiation can be obtained experimentally, knowing that the radiation loss coefficient hr adopts approximate values of 4.7 W/m2 °C with an estimated human body temperature of 30 °C [20].
Once the convective coefficients hc and hr radiation losses have been determined with sufficient accuracy, we can determine the values of comfort operating temperature of To for the human body, which could be defined as “the uniform temperature of an imaginary enclosure in which the body exchanges the same dry heat (regardless of latent loads) by radiation and convection as within a same real environment” [18].
The interpretation of this equation helps to understand how air radiant surface conditioning systems work. The feeling of individual comfort in closed spaces, assuming control of relative humidity and air velocity are in conformity with the framework established by Spain’s Regulations on Thermal Installations in Buildings, or RITE (40–60%, and 0.15–0.24 m/s respectively, according to winter or summer regimes), depends both on surrounding air temperature and on the surface temperature of all the surfaces making up the space. It also depends to a similar or even greater extent, on the mean radiant temperature Trm. This implies that, for radiant surface systems, the variation of the surface temperature of some walls allows to obtain an optimum feeling of comfort, maintaining higher air temperature in summer and lower in winter [21]. This significant difference with convective systems (radiators) in winter, and forced air solutions in summer, leads to considerable improvements in comfort and energy savings [11,22]. Peaks in thermal loads are significantly reduced, sensation of comfort is improved with moderate and homogeneous temperatures, and air velocity is imperceptible by body sensors, while people’s health is preserved in the absence of excessively cold focal points [9,23,24]. Furthermore, the sound level is imperceptible as air is moved only to dehumidify (very low flow rates), and the presence of dust or bacteria in the ambient air is reduced.
However, little applied research has been carried out on the effect that thermal inertia of enclosures in architectural spaces [25] has on comfort and energy consumption [18]. The ISO 13786 standard [26] describes how to evaluate the way building elements contribute towards the building’s saving of energy and consumption. Properties to be considered are thermal admittance, which relates heat flow to temperature variation, and dynamic heat transfer properties, such as the damping factor and thermal wave lag [15].
3. Energy Savings Compared to Other Air Conditioning Systems
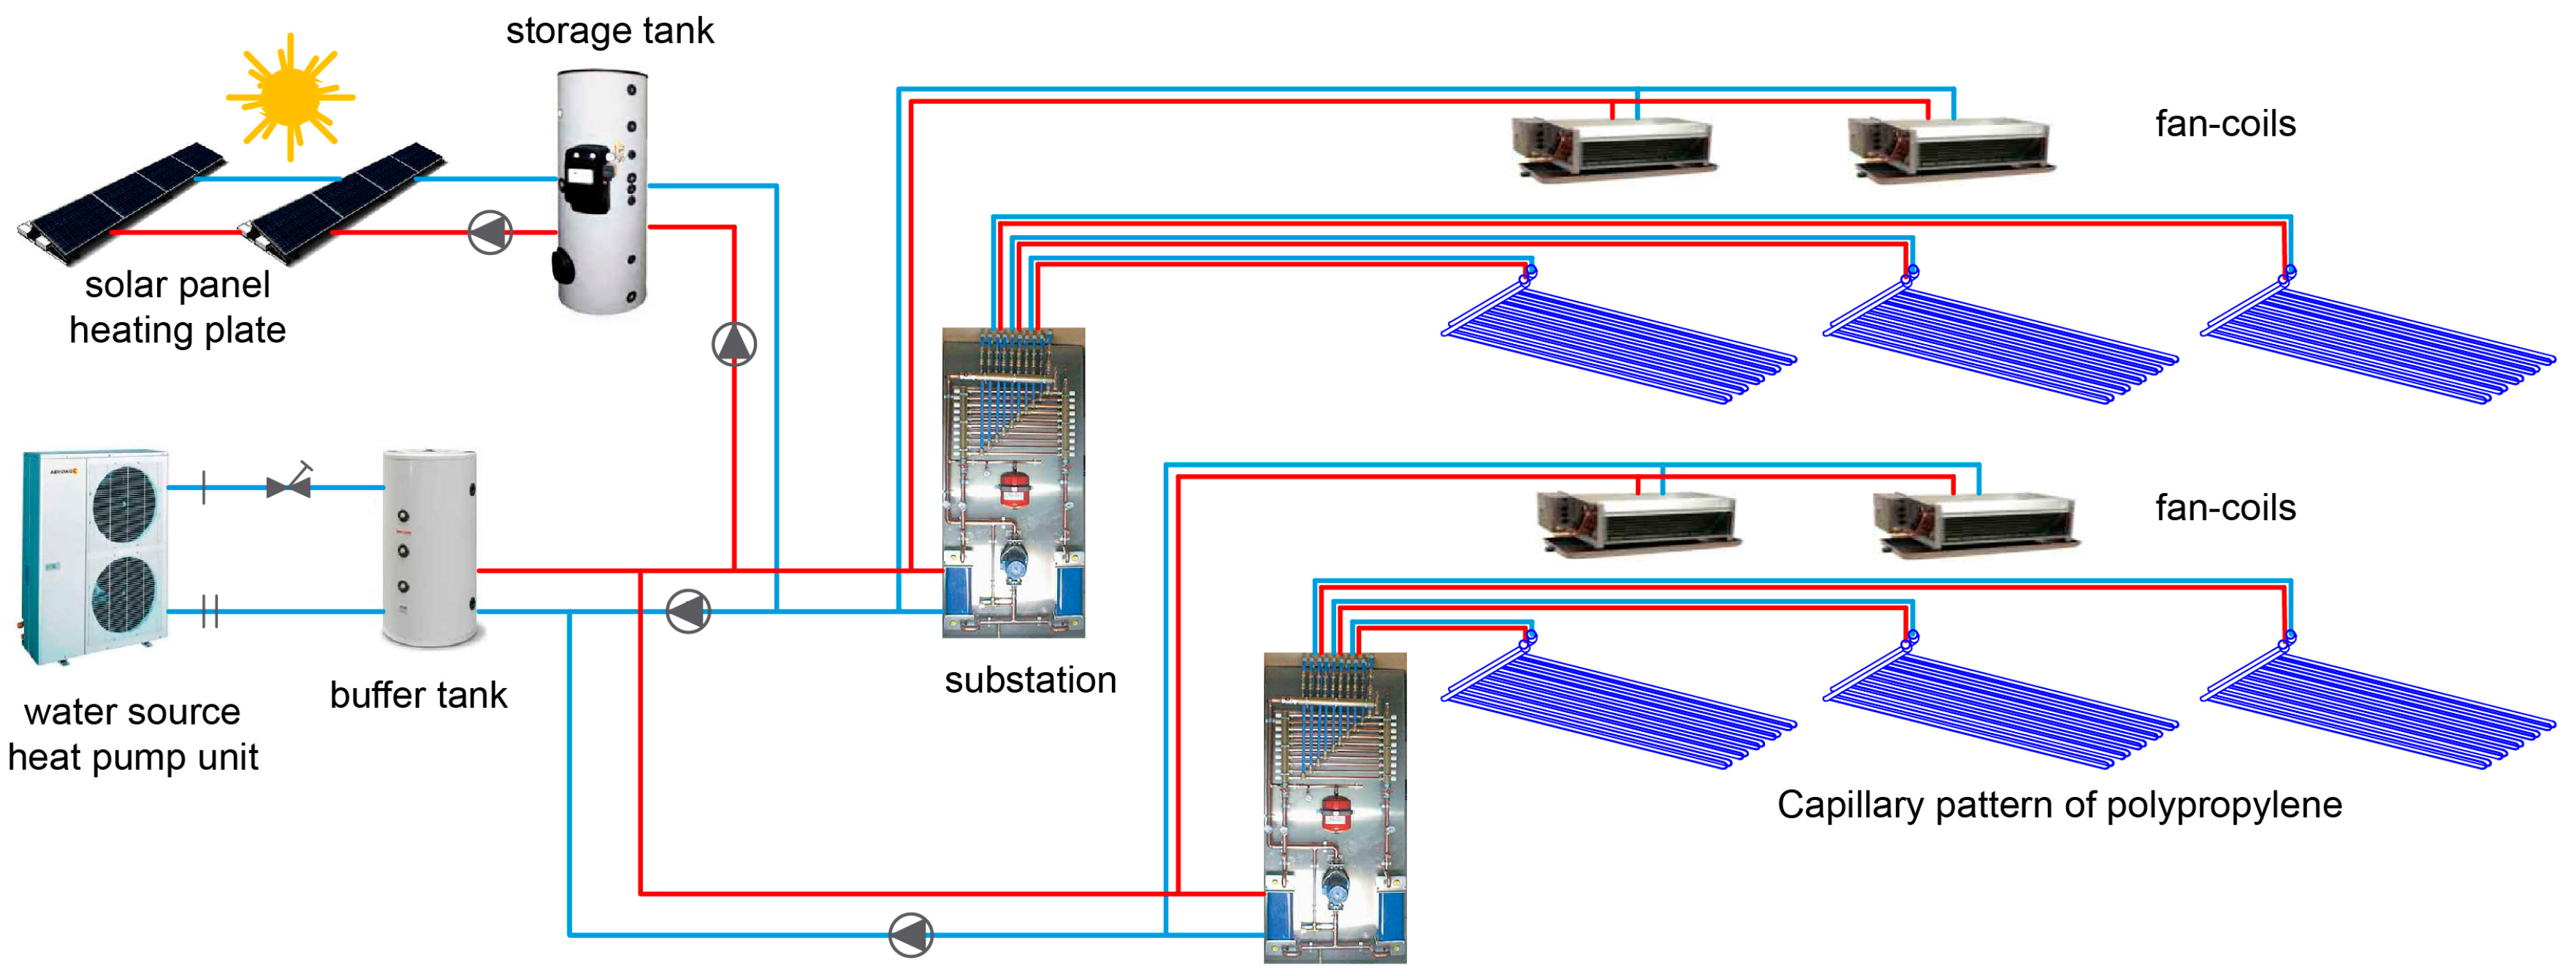
Temperatures at which the water needs to be prepared for use in capillary tube mats are very moderate (about 15 °C for cool mode and 35 °C for heat mode) and this allows improving the efficiency of the production source compared to other systems with greater preparation needs [10]. When the chosen source is a heat pump (aero-thermal or geothermal for example), lower consumption is obtained, since the machine’s COP will be improved and water will be able to be driven at more moderate temperatures than with other systems. This means better thermal yields will be obtained than with other systems [27,28]. We can also maximise the installation’s overall efficiency based on massive use of alternative or renewable energy [29,30], such as solar or geothermal energies.
3.1. Water as a Medium for Transporting Energy
If we take two magnitudes of the physical properties of water and compare them with those of air, we find that the specific heat of water is four times higher than the specific heat of air. This means that, to transport a certain amount of heat, more air is required based on the same thermal gap, and consequently more power from the electromechanical element.
The second magnitude to compare is density. Density of air at 25 °C is about 1.19 kg/m3 (depending on the exact composition of the air) and that of water at the same temperature is 1000 kg/m3. This means that when transporting a certain amount of energy, the necessary volumes are 1000 times higher with air than with water. Consequently, the electrical energy needed to run motors and fans in a forced air system is 80% higher than that required with a radiant system [31].
This is one of the main reasons to drive water at such moderate temperatures and achieve high energy efficiency. In addition, if we consider running in cool mode where supply air temperature is limited to dew point, it not only provides us with energy savings compared to other forced air, radiant and convective systems, but allows achieving powers of 75–90 W/m2 in cooling mode, which other radiant systems cannot reach. Therefore, it has advantages over chilled beams systems [32,33], passive phase change materials systems (PCMs) applied in natural ventilation slabs at night phase [5,34], displacement diffusion or UFAD (underfloor air diffusion) systems or drive of large air flows at low speed systems. The comparison with chilled beam systems is interesting. Chilled ceiling systems work to a greater extent by radiation and fan-coil dehumidification, while chilled beam systems work mainly by convection. The passive chilled beam system requires primary air to renew the indoor air and maintain the relative humidity of the environment. Instead, the active chilled system works with treated primary air, which is driven to activate convection. It is an air-water system, which requires greater investment of installation and greater energy consumption. Both reach higher levels of cooling output. All of them offer excellent thermal comfort and consume less energy than conventional all-air systems [35].
3.2. Reduction of Load Peaks
Capillary radiant systems are active solutions. They act constantly not only on the air contained in the room, but also on all the room’s enclosures, modifying its temperature by the action of the radiant wall. Thermal loads due to heat transfer through the enclosures, according to the Fourier law, are significantly reduced by decreasing the thermal gap of temperature difference between indoor and outdoor air. In summer, indoor air can become 3 °C warmer than in forced air systems, with a decrease in these thermal loads by around 25% [11]. Something similar happens in winter, as temperature is lower than in convective and forced air systems. This has an effect on the load peaks that lessen peak needs and their value is reduced compared to “all-air” systems. A correctly executed radiant system saves energy and reduces peak loads and consumption compared to air systems. These values may vary depending on the types of premises, climate, etc. Peak loads range from 20% to 40% [36].
3.3. Thermal Performance of the Installation
Temperatures at which the water needs to be prepared for use in capillary tube mats are very moderate (about 15 °C for cool mode and 35 °C for heat mode) and this allows improving the efficiency of the production source compared to other systems with greater preparation needs [10]. When the chosen source is a heat pump (aero-thermal or geothermal for example), lower consumption is obtained, since the machine’s COP will be improved and water will be able to be driven at more moderate temperatures than with other systems. This means better thermal yields will be obtained than with other systems [27,28]. We can also maximise the installation’s overall efficiency based on massive use of alternative or renewable energy [29,30], such as solar or geothermal energies (Figure 3).
4. Case Study: Isolated Single-Family House at “la Albufereta”
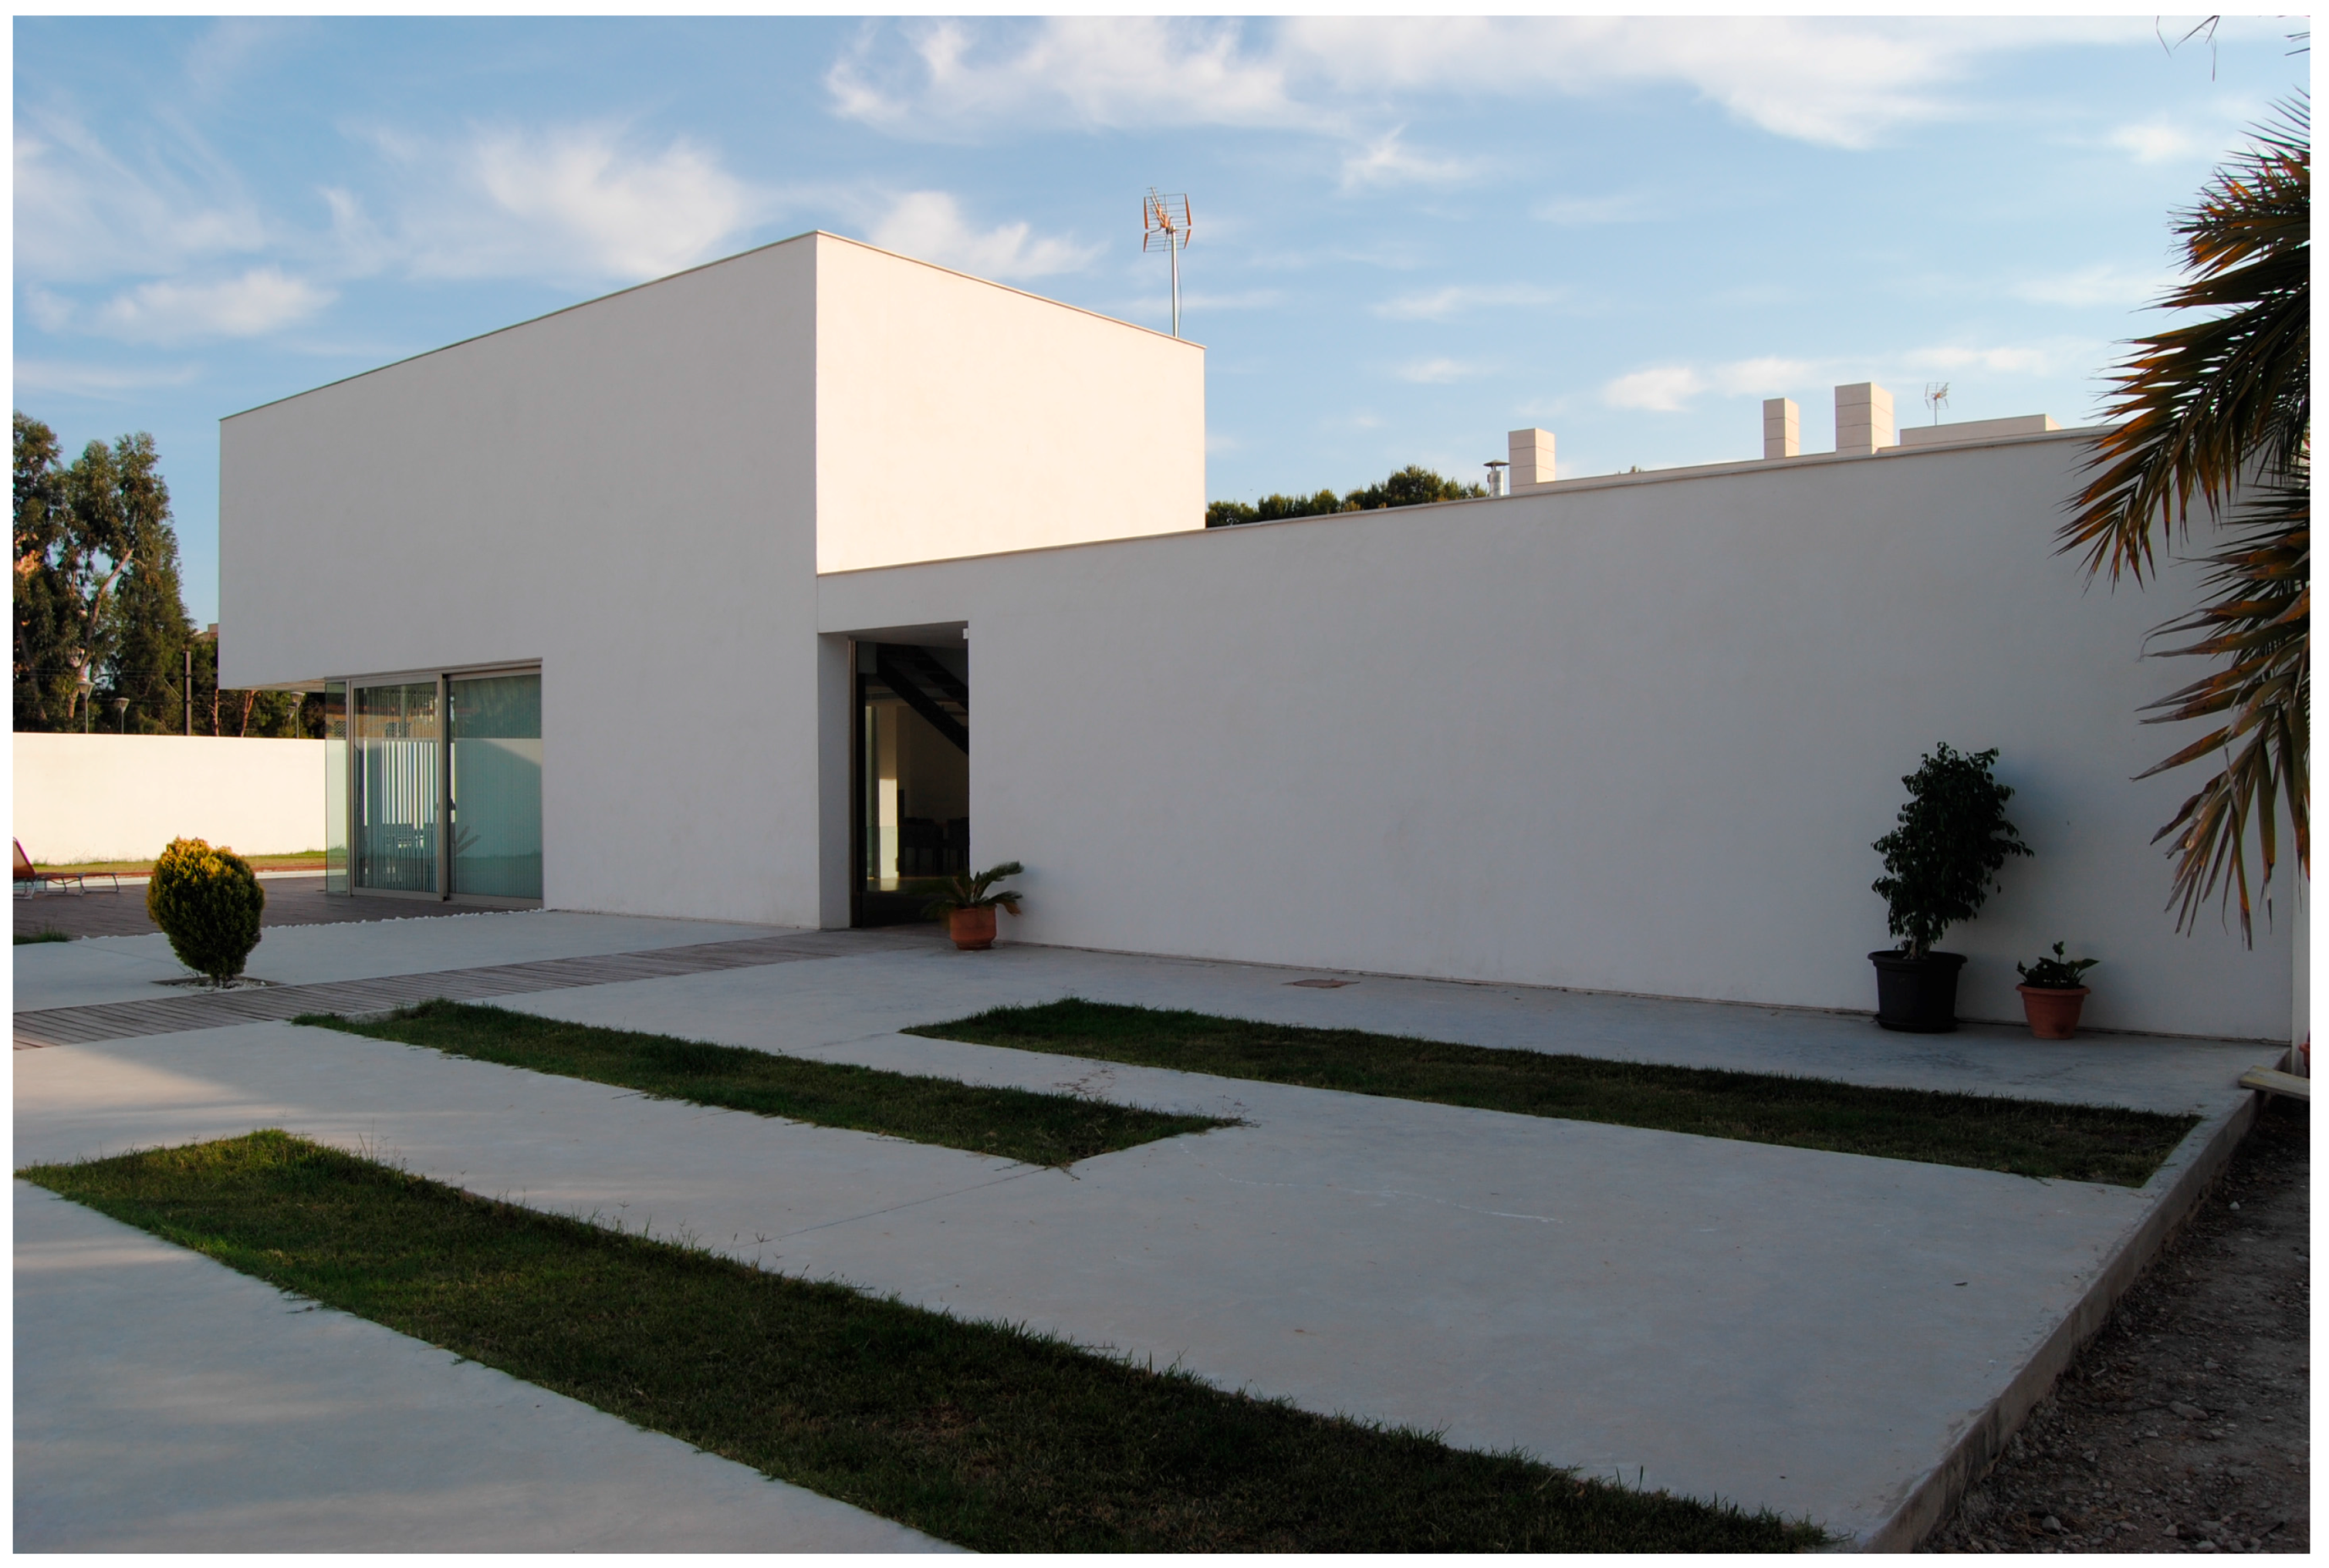
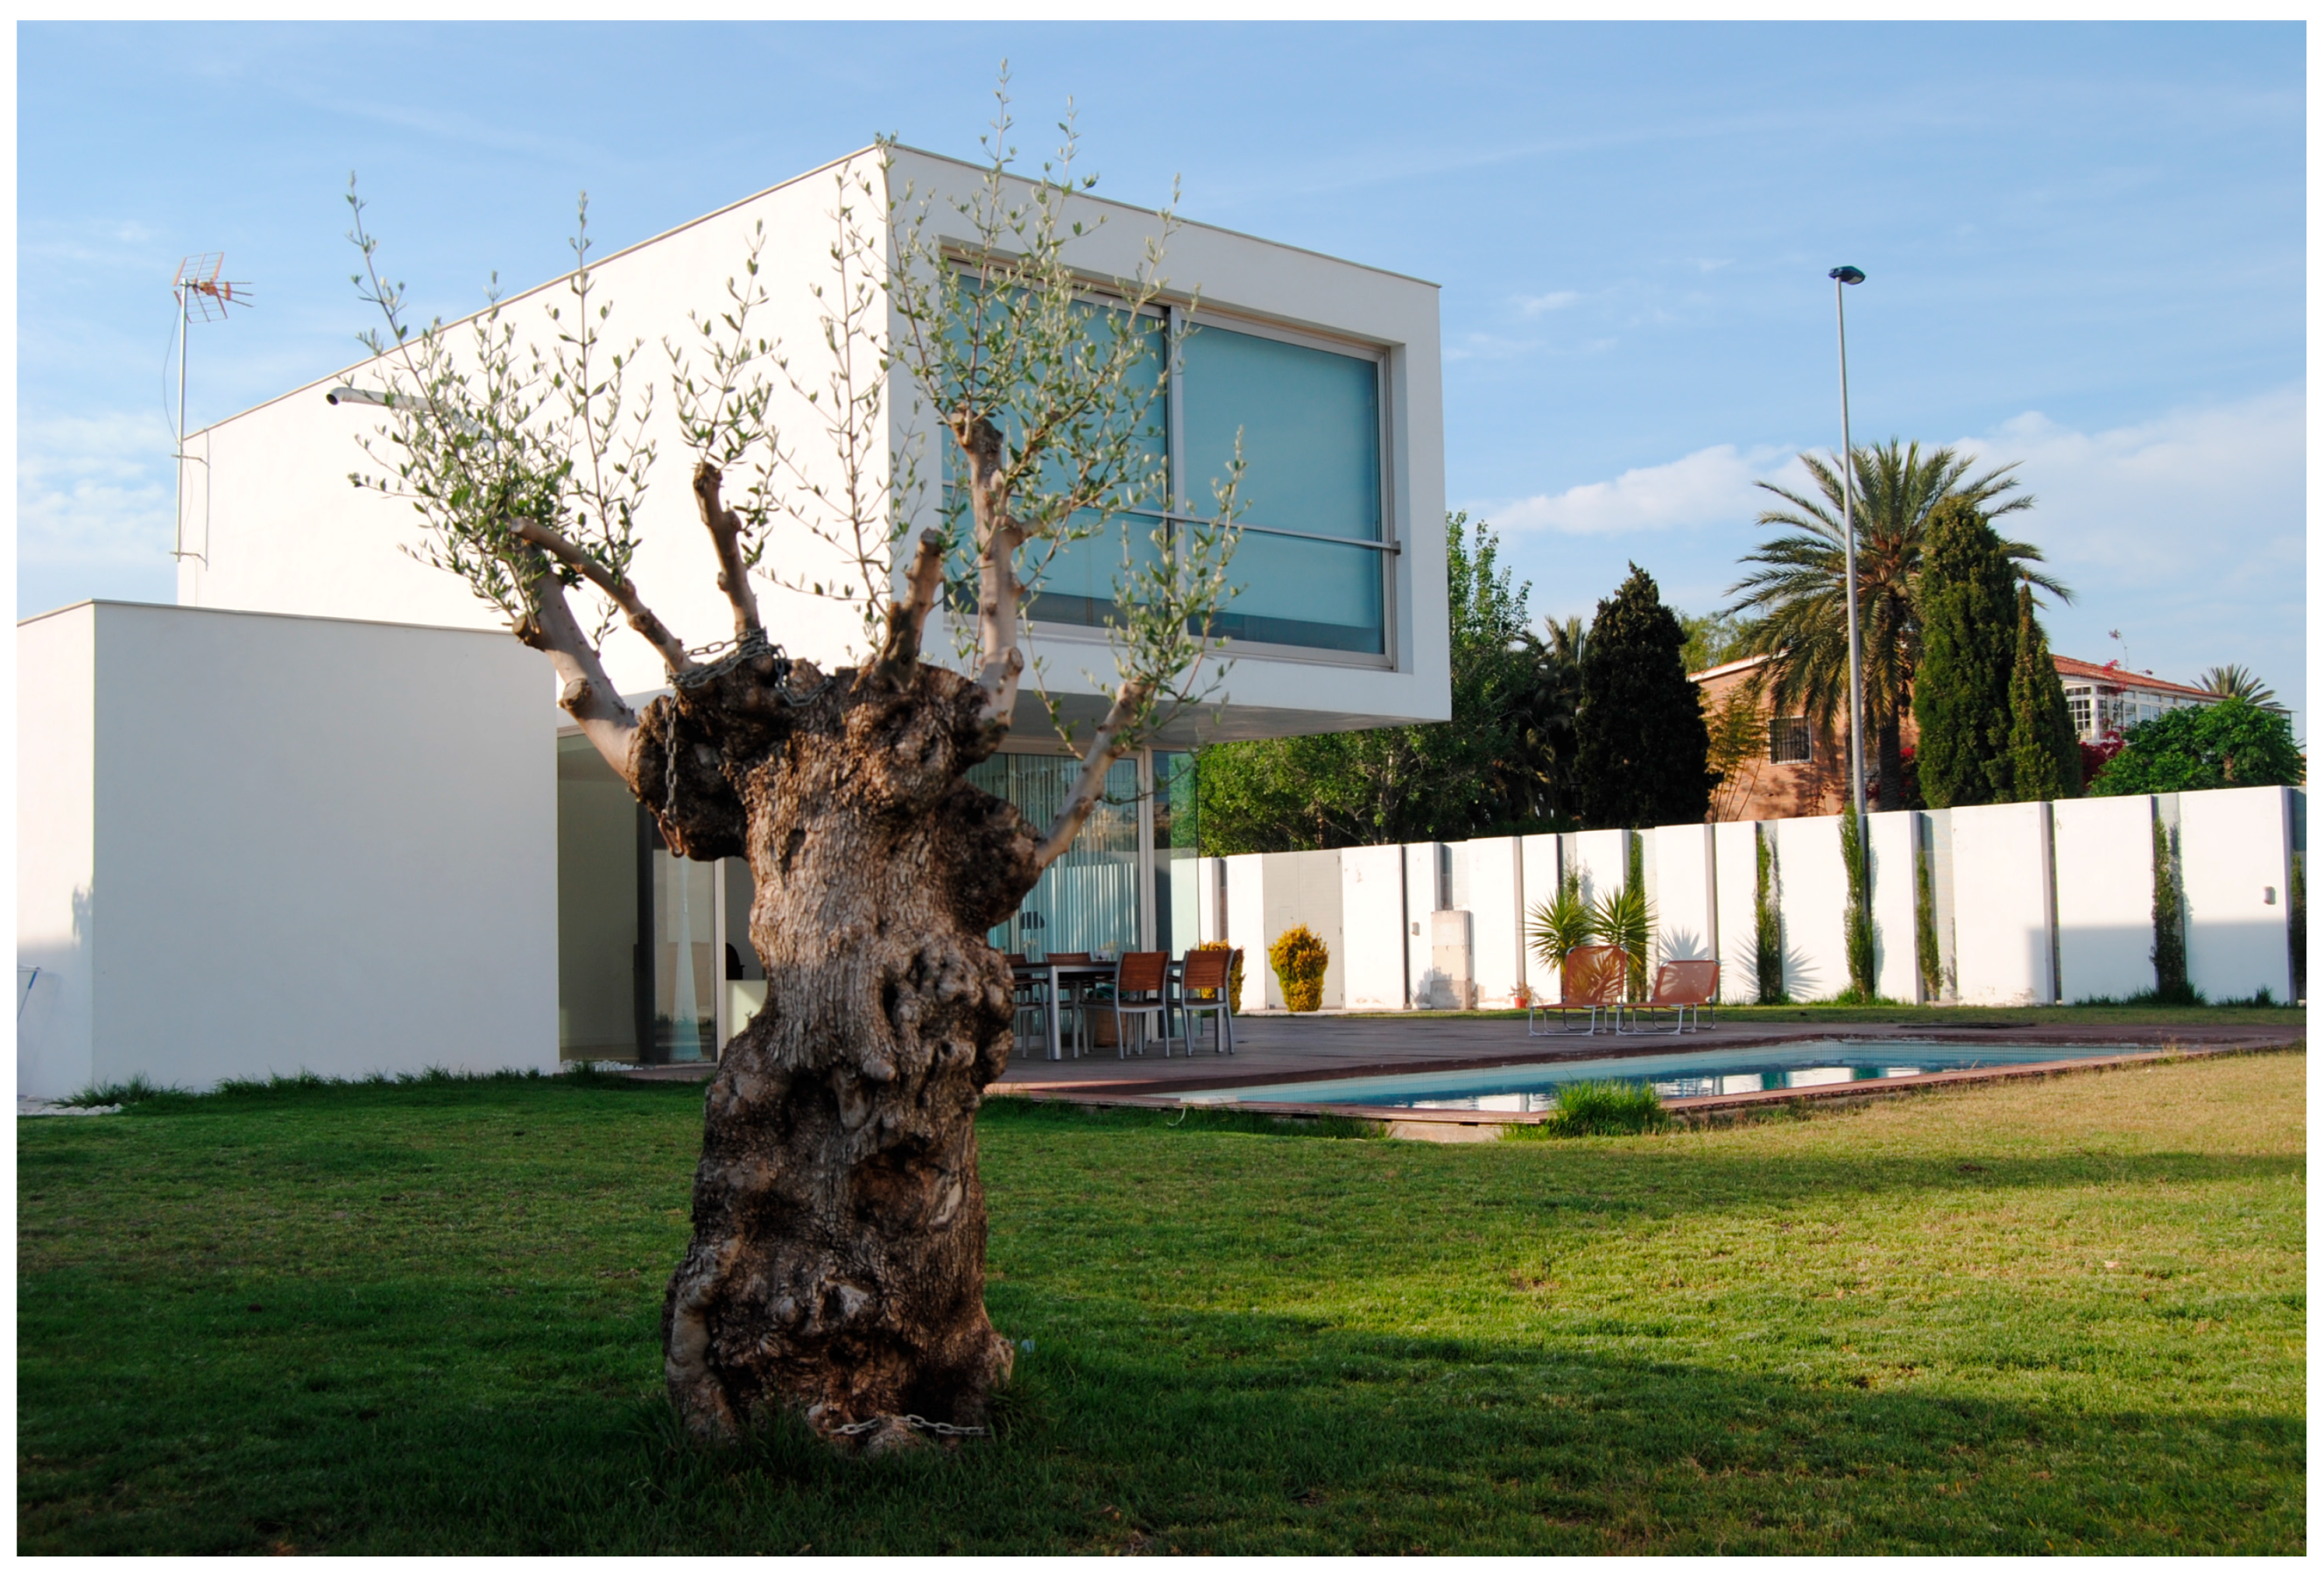
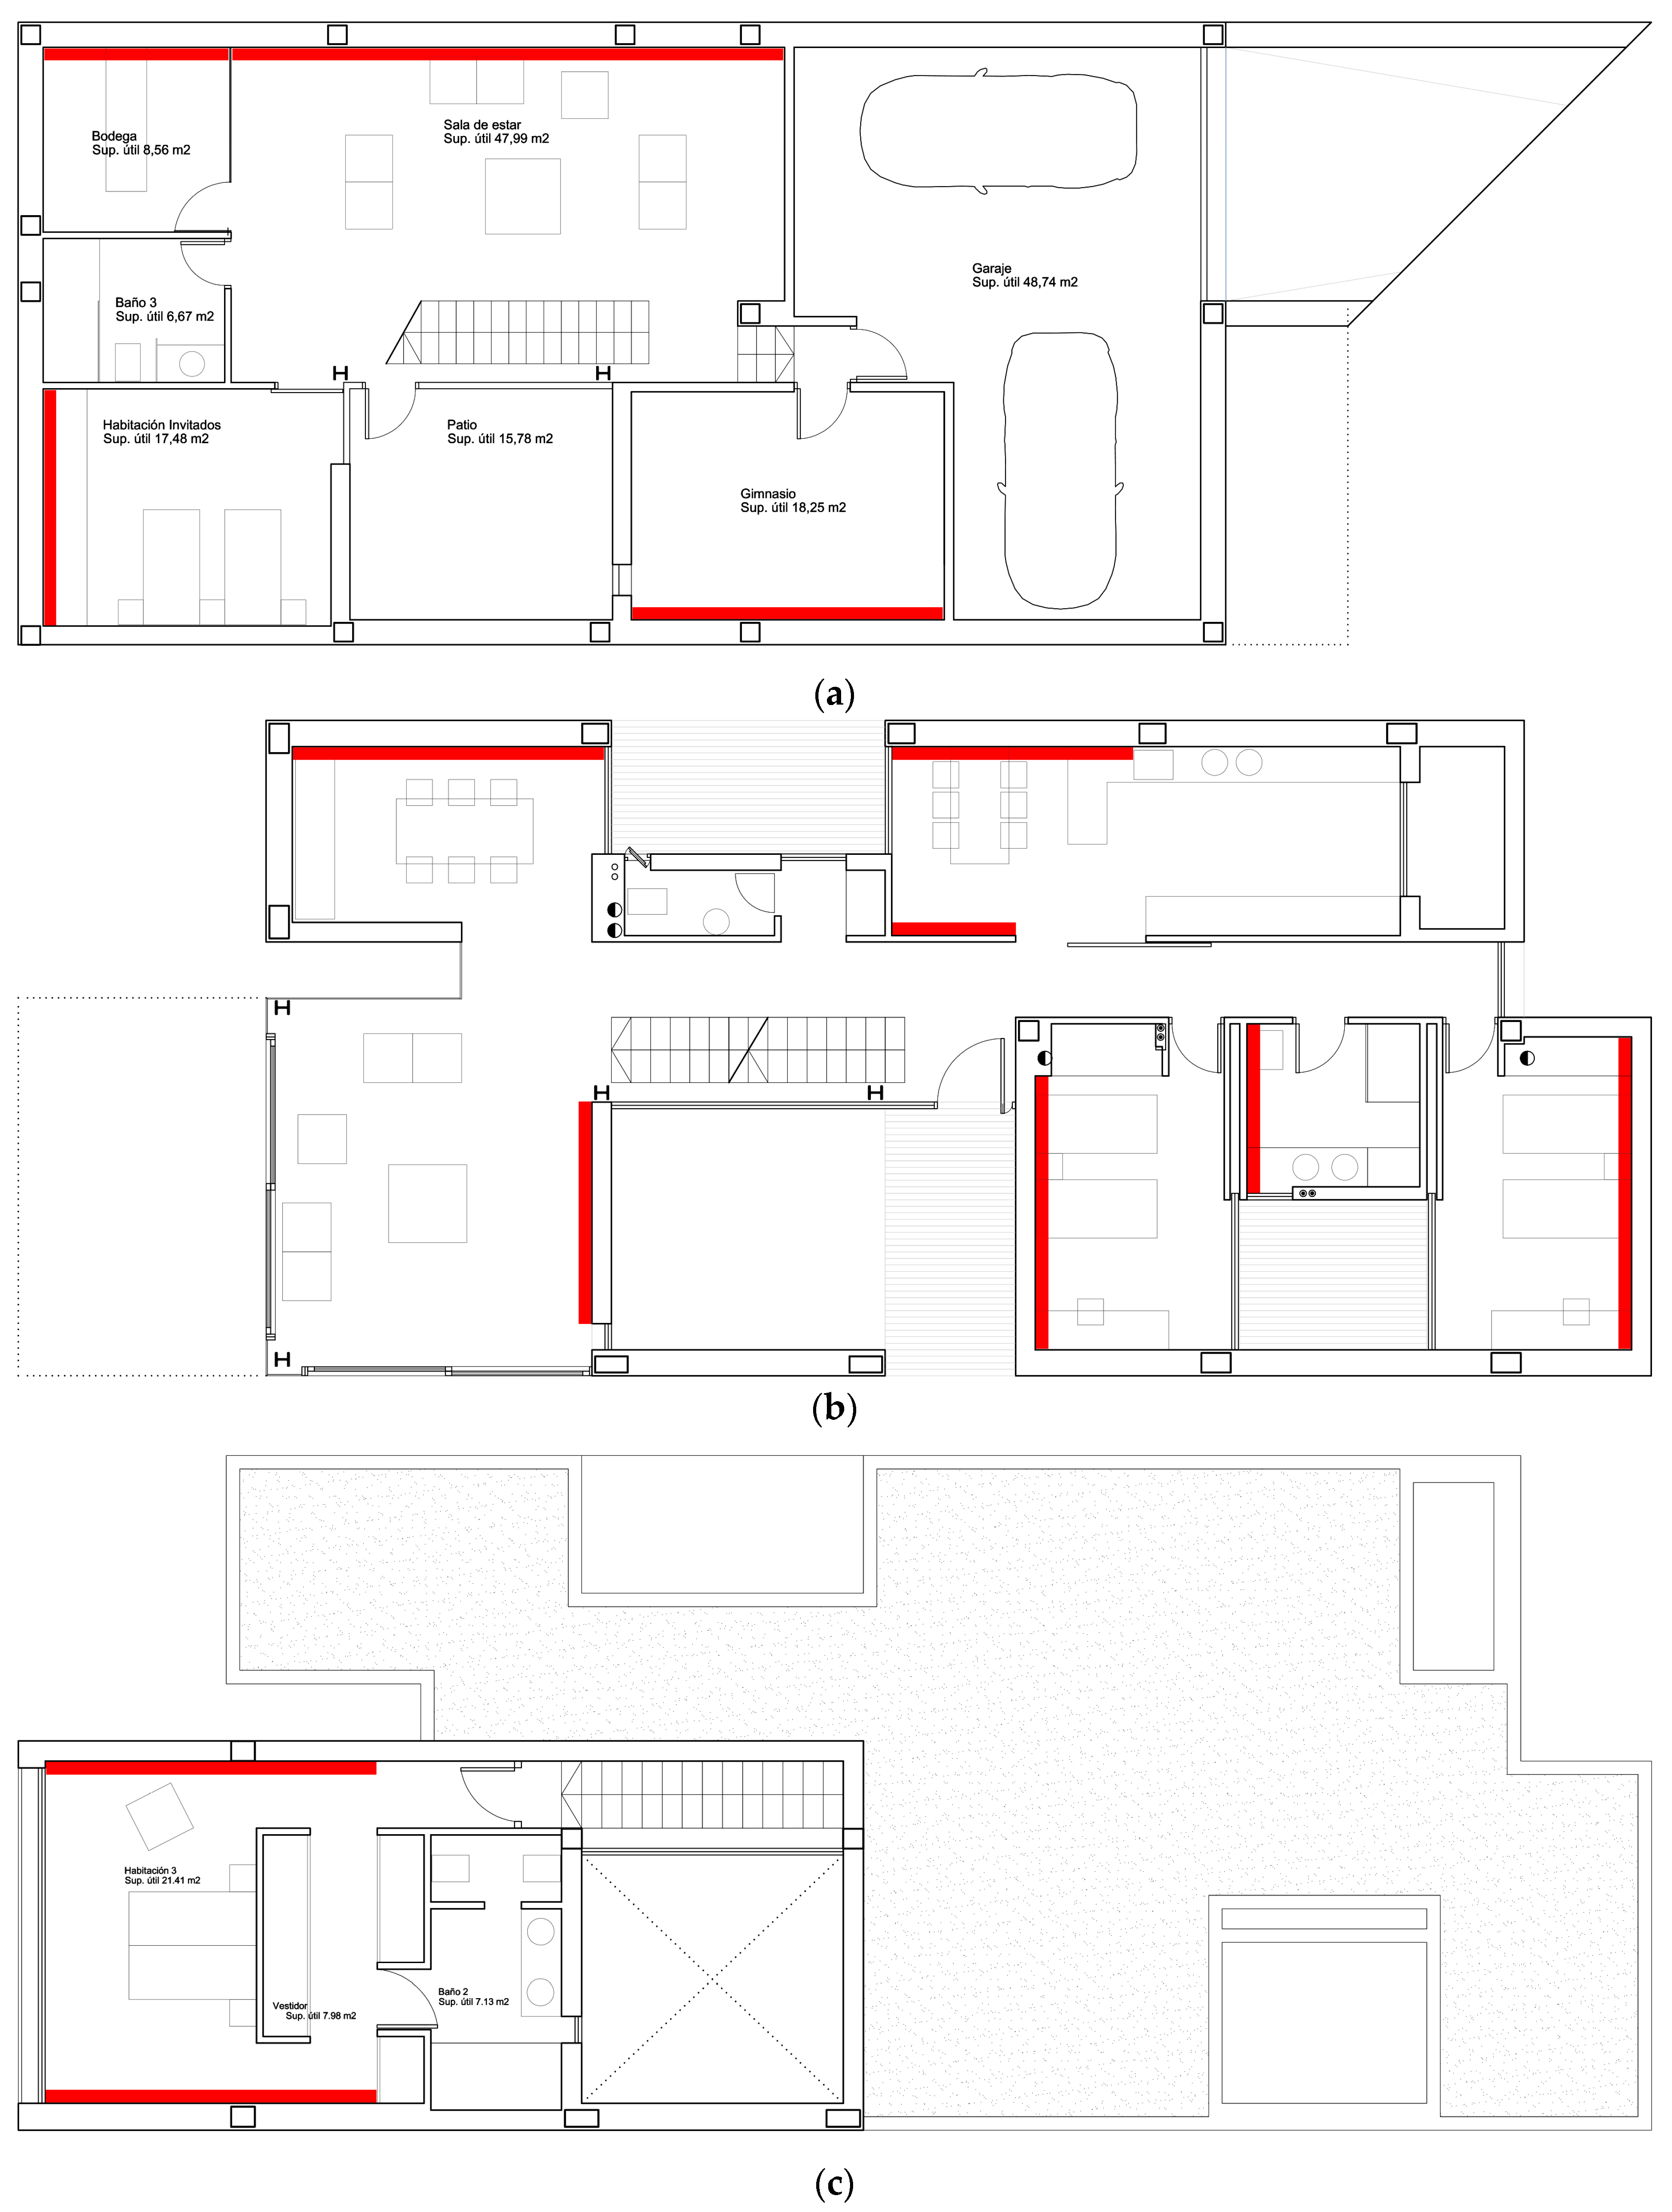
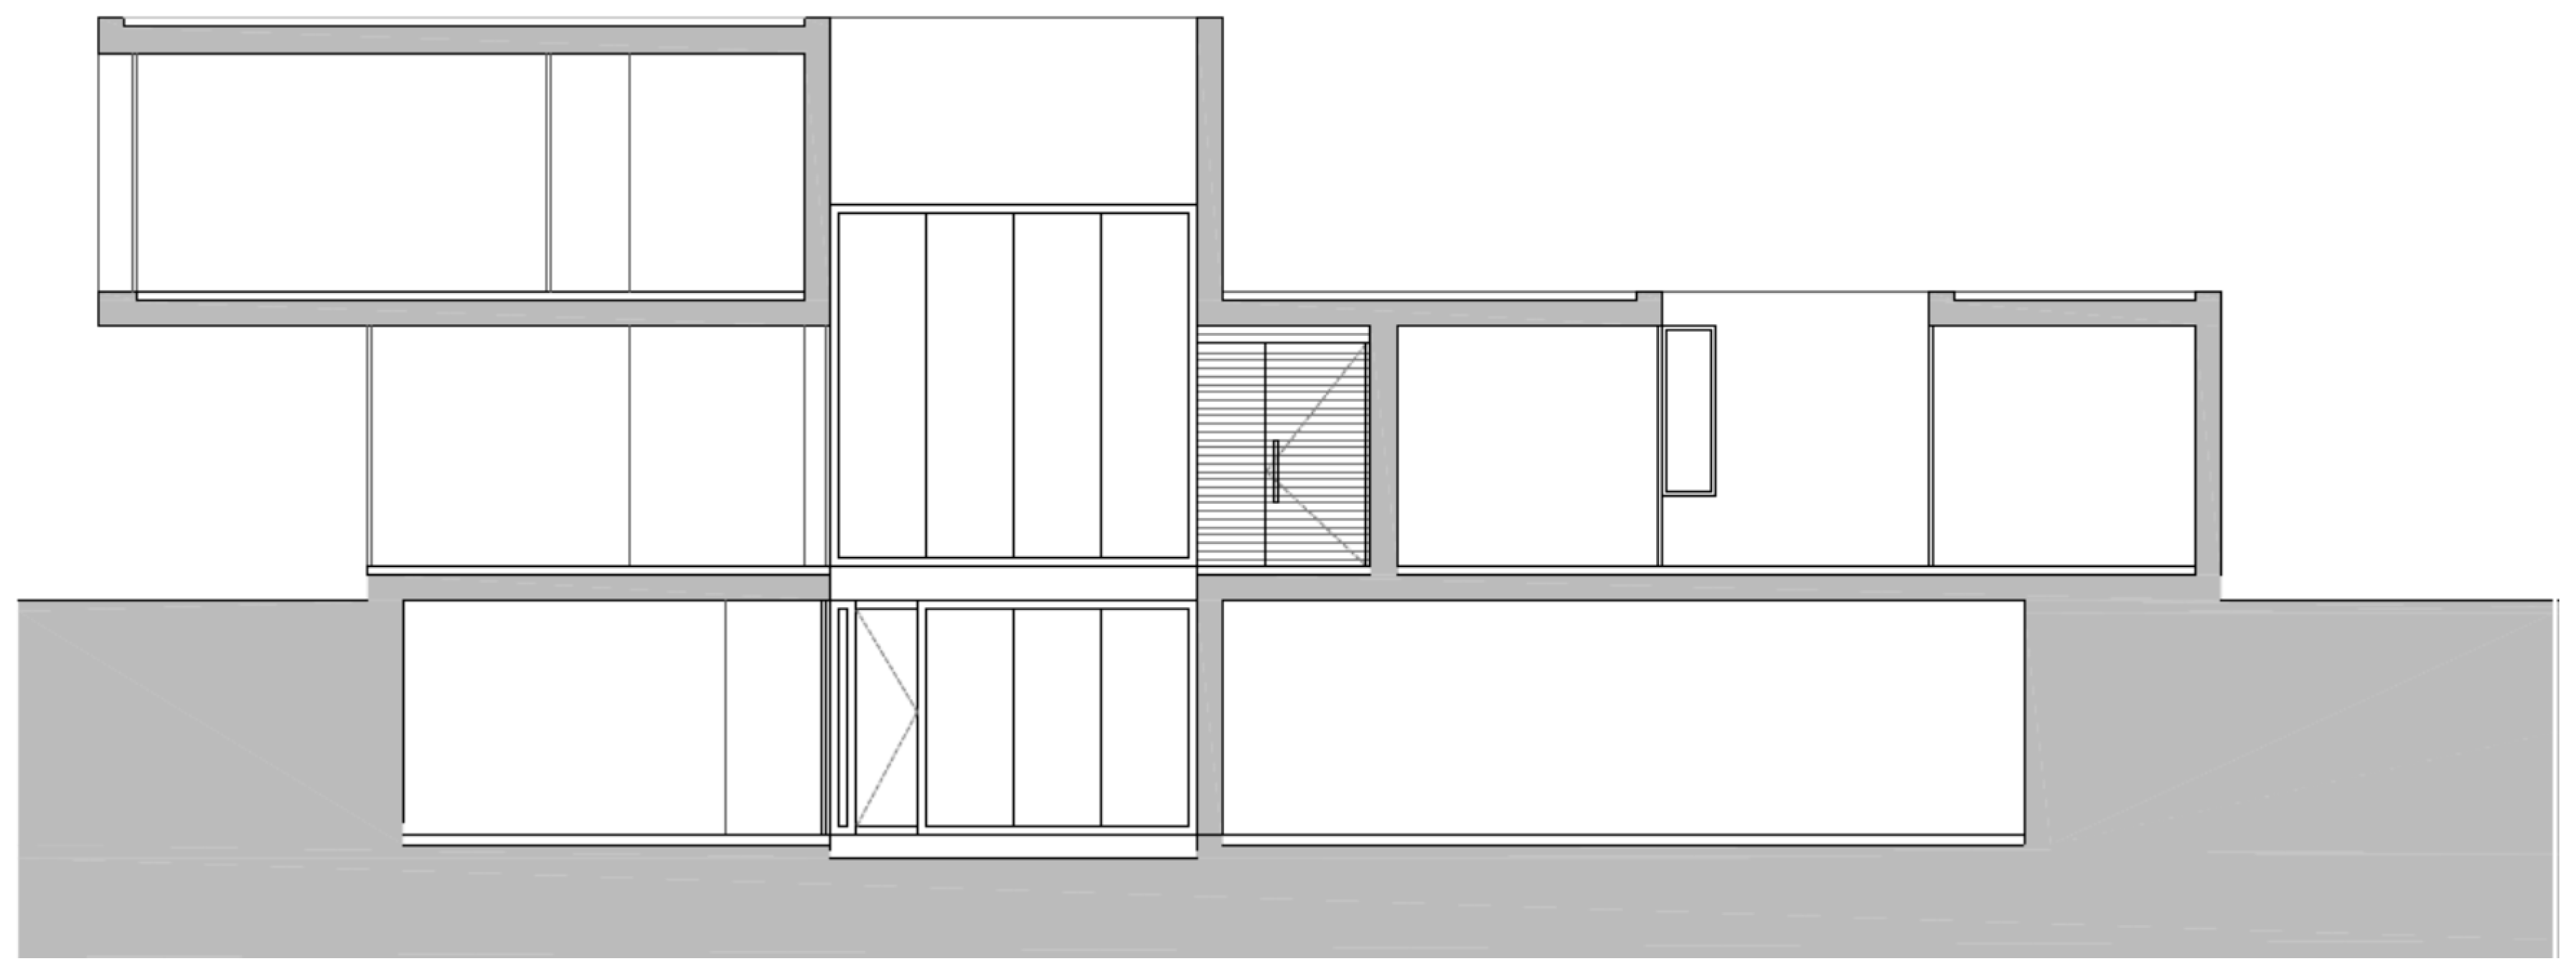
To study conditions of comfort and energy saving derived from the use of hydronic systems of capillary tube mats, a single family house located near the Albufereta beach in Alicante is presented here (Figure 4 and Figure 5). Behaviour was simulated and monitored to enable to draw conclusions. The house has a basement, ground floor and first floor, with a total constructed area of 346 m2 (Figure 6). In an initial project, the house was planned to be built at ground level and with no basement, but low resistance of the natural terrain made it unfeasible to build a foundation system within the material construction budget (or PEM in Spanish). The foundation based on a micropilot system would have cost €85,000, or 17.5% of the budget. For this reason, a basement was laid out on the whole surface, so that loads due to earth excavation were compensated with those introduced by the new building (see the longitudinal section of the house in Figure 7).
This unexpected situation led to a final house design that was completely different from the initial one. With a floor area of 142 m2 in the basement, which is much bigger than that required for garage space, storage and amenities, it was decided to add a second living room and a guest bedroom with a full bathroom. A further idea was to use the terrain’s stable energy for conditioning purposes, that is, to take advantage of the moderate temperatures that would be produced by the reinforced concrete walls for retaining the terrain to adjust conditioning. The geotechnical study also revealed the existence of phreatic-level waters 1.5 m deep, as the plot is near the Albufereta beach. Stability of the surface temperature was further facilitated, and a passive conditioning system was generated by convective currents, which would lead to a decrease in energy demand and increase in comfort. This technique could be combined in summer by opening the large glass panes in the ground floor living room, giving on to the garden. For winter, however, an underfloor heating system based on hot water radiators was installed next to the large glass walls.
The aim was to compensate scarce insulation and high air permeability of Eastern Spain building cladding, due to deficiencies in construction quality and low standard requirements of NBE-CT-79 and of the CTE. The failure of a building policy that omitted the importance of comfort and energy efficiency in buildings is demonstrated by the fact that air conditioning systems proliferated in residential buildings, often years after their construction. Unlike standards such as the Passivhaus in central Europe, where energy demands are less than 15 kWh/m2/year in winter, in Eastern Spain, they usually range 25–50 kWh/m2/year in winter, and 40–80 kWh/m2/year in summer [37].
4.1. Bioclimatic Basement Cooling System
Neila and Bedoya explored the most common bioclimatic techniques in architecture, according to the site’s climatology: greenhouse effect, evaporative cooling, trombe wall, chimney effect, Canadian wells, etc. [3]. In our house, thermal inertia of the terrain, applied to retaining wall enclosures and a terrain-insulated floor with a cupolex slab has a relevant impact. Greater cooling of the home’s indoor air on the ground floor and in the basement is achieved in summer, and low temperatures are moderated in winter. To achieve this, it was necessary to design a good system to manage communication openings between the building’s floors allowing air circulation in summer and winter. The layout of walls with average summer radiant temperatures of 23.3 °C in the basement and 26.5 °C in the walls of the ground floor produces significant thermal losses in the organism (qrdi). In addition, generated convection currents reduce indoor air temperatures on the ground floor by around 3.2 °C, and air velocity is very low, at around 0.05 m/s. In the case of requiring a greater degree of cooling during peak periods, this technique could be combined with the use of cross currents, by opening the glazing in the bedroom facing southeast on the first floor. As we will see, the possibility of combining it with Thermal Ceramic Panels (TCP) was examined, resulting in low annual energy demand. In the final phase of construction, TCP panels were rejected for budgetary reasons, and air conditioning with a VRV system was pre-installed. This means that flow and return ducts were placed at the possible location of indoor units or bathroom evaporators, 230 V power supply lines, condenser drain pipes in evaporators, and copper piping lines for R410A refrigerant distribution. In this way, if the building required an additional air flow when in use, the condensing machines could be installed on the roof without having to carry out works inside. After more than eight years of use, the house has recently required the use of a condenser, due to a slight lack of comfort during isolated load peaks.
4.2. Installation of Air Conditioning System by Capillary Mats with Large TCP Format Ceramic Panels
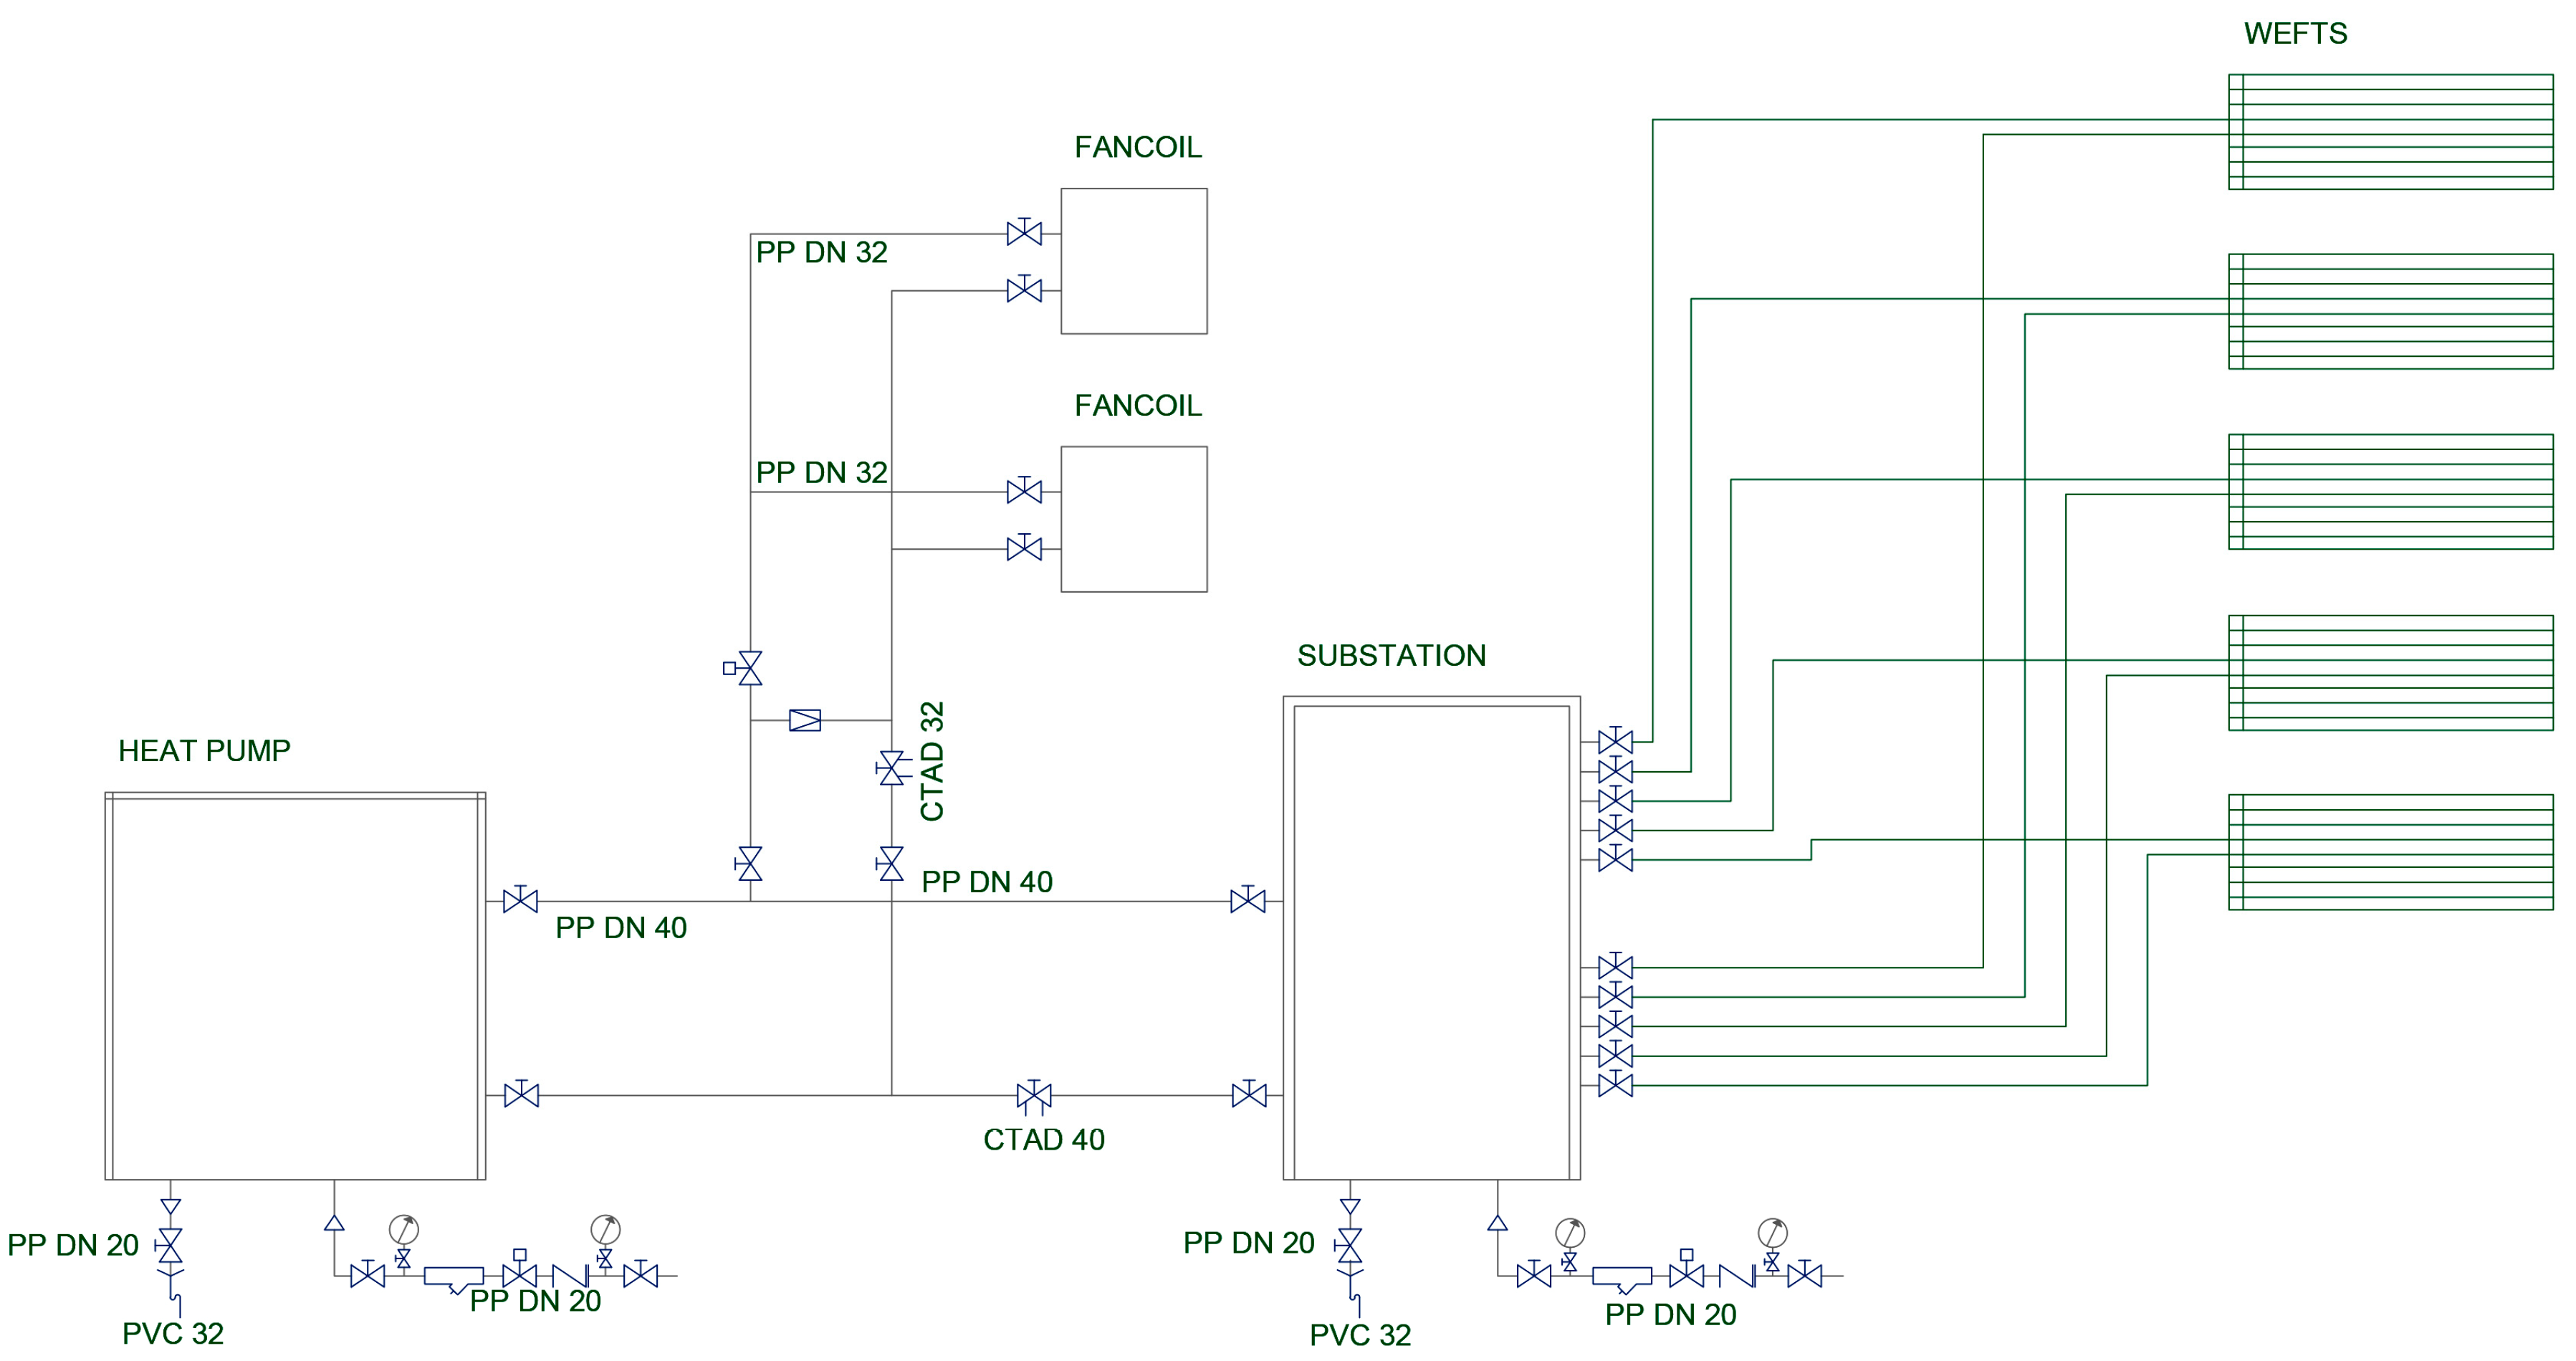
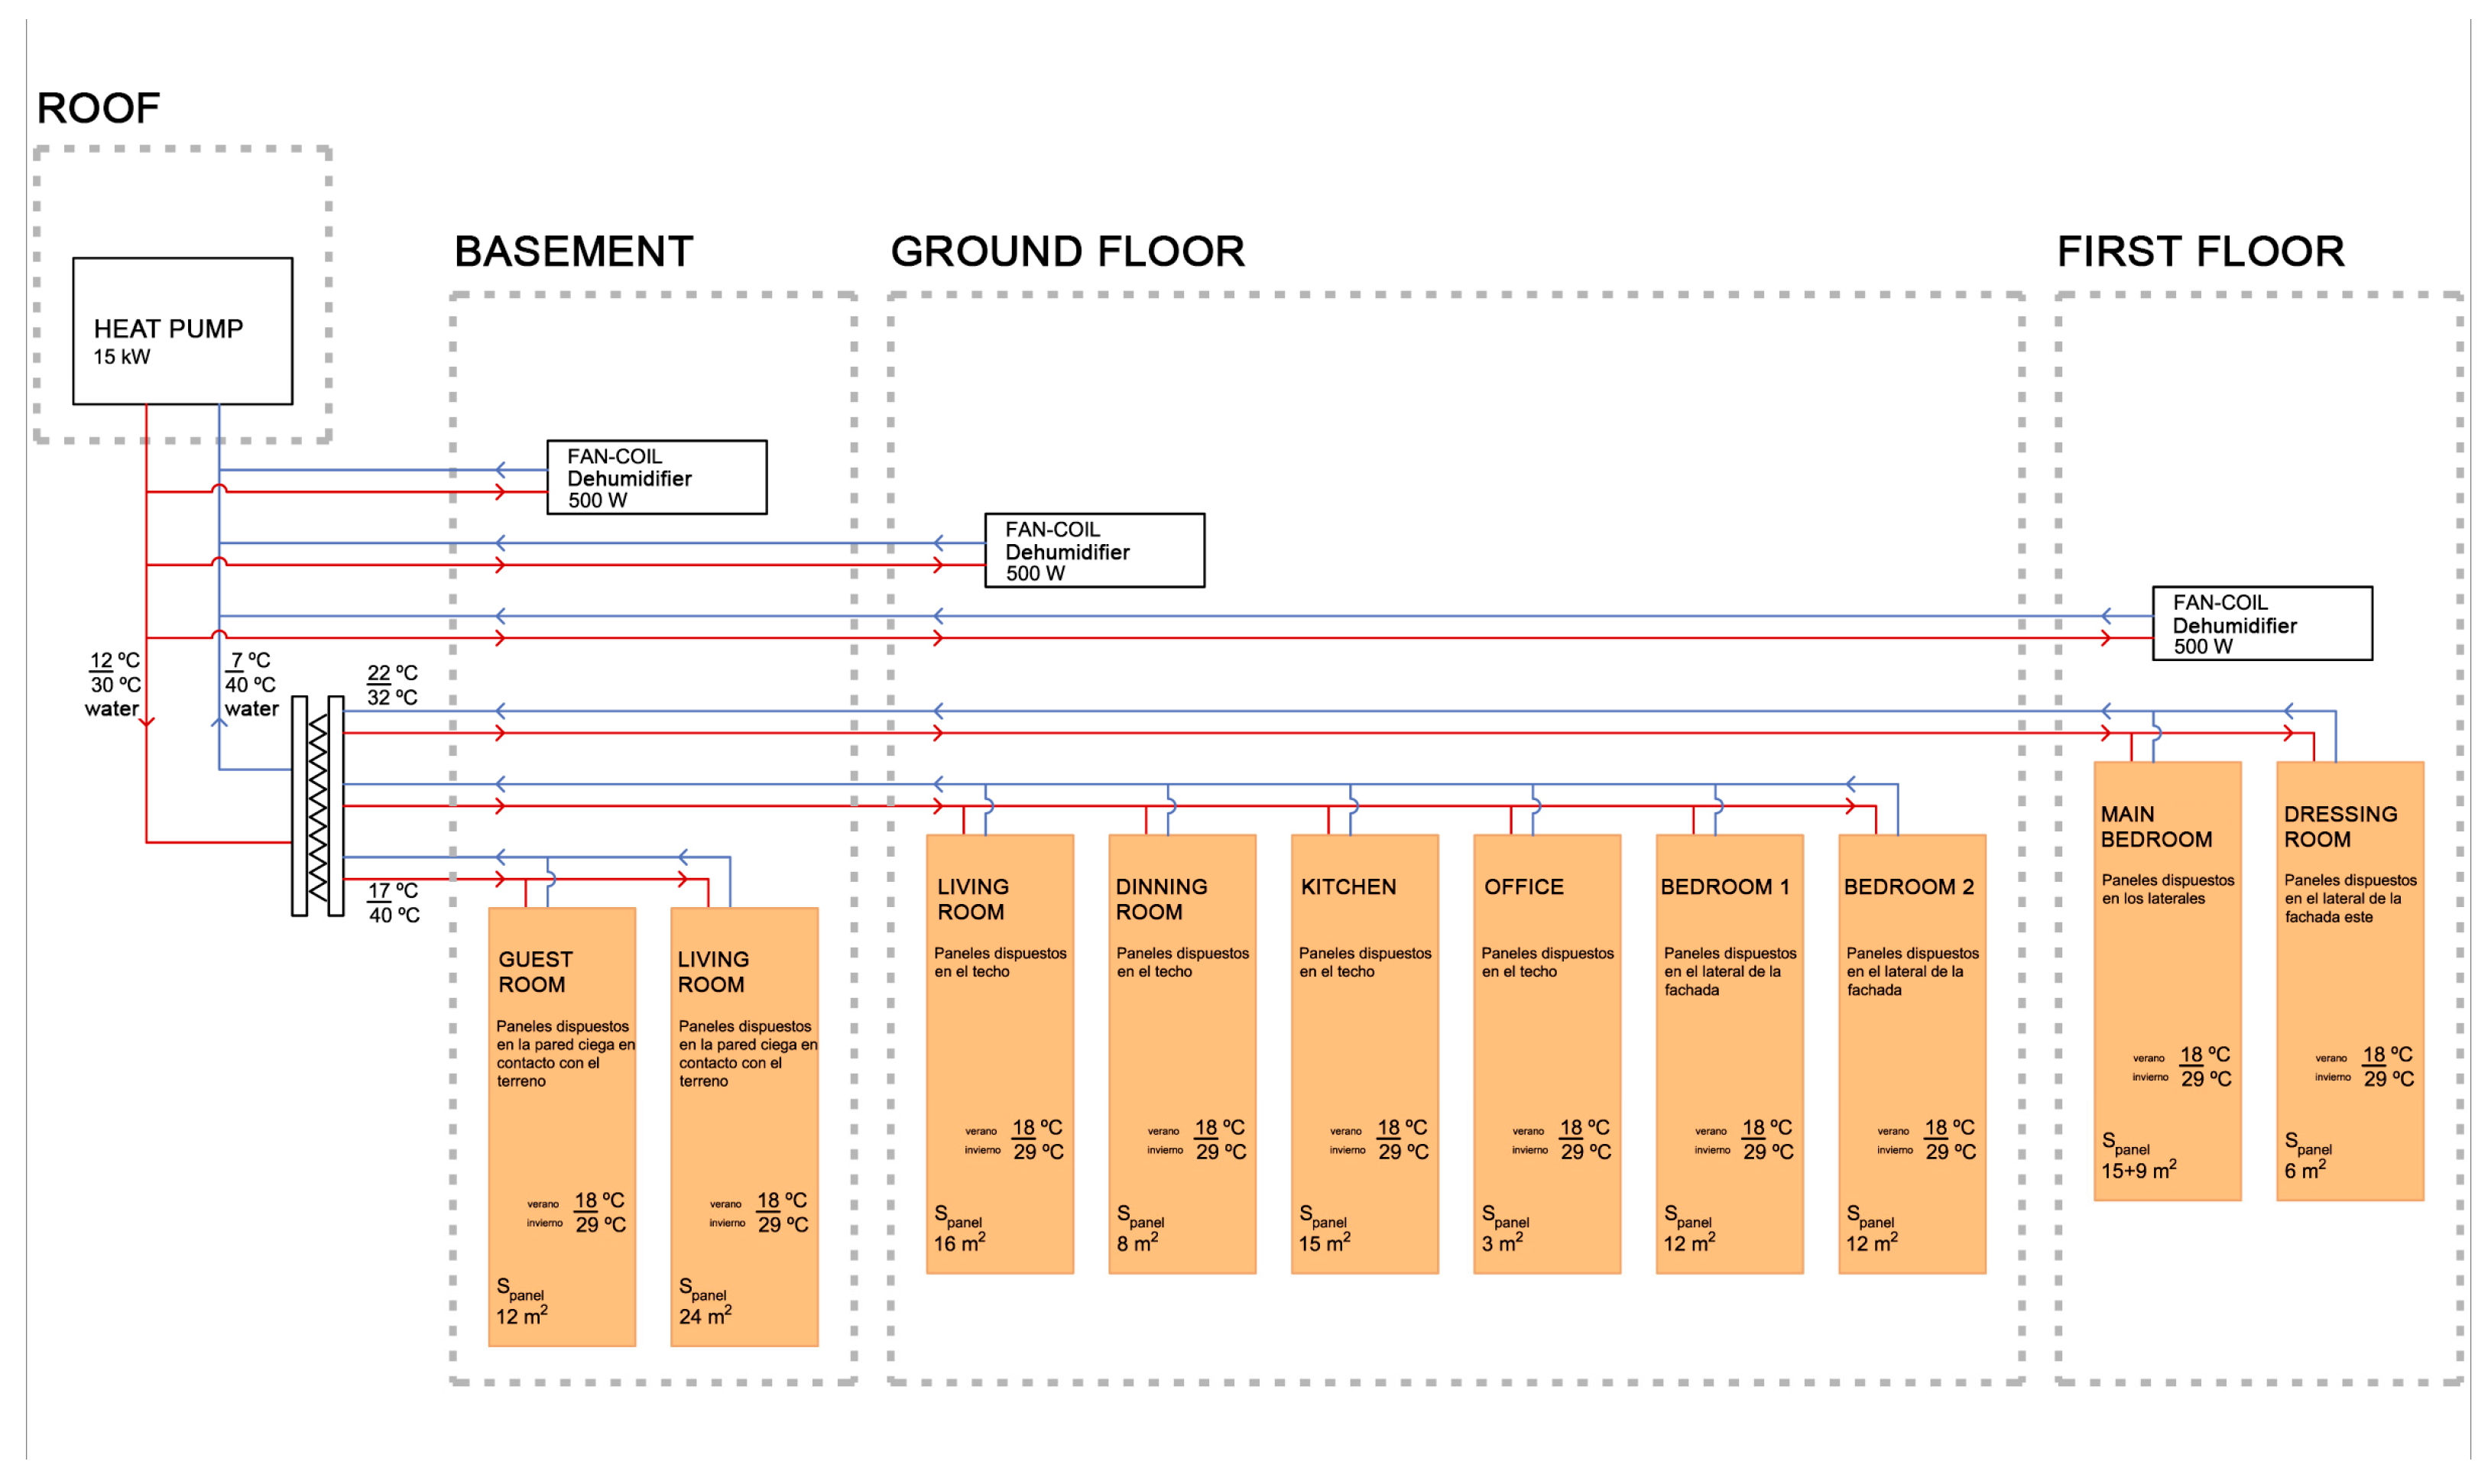
During the project phase, ceiling-based capillary tube mats of polypropylene tubes, over a total surface of 135 m2, were chosen to obtain an environmentally friendly and healthy climate. A project was drafted applying a 50,000 fr/h power heat pump, with a substation providing a heat exchanger and secondary circuit, with a manifold from which five circuits, based on a 20 mm diameter PPR tube, set off: basement living room, main living room, kitchen, ground floor bedrooms, and first floor bedroom (Figure 8). These circuits were controlled by thermostatic valves, and balancing valves in the return manifold (Figure 9). Two fan-coil type dehumidifiers were incorporated for the summer regime, receiving cold water from the primary distribution circuit. The possibility of applying solar vacuum tube panels on the roof was envisaged, through a system of solar cooling by means of lithium chloride chemical energy [10].
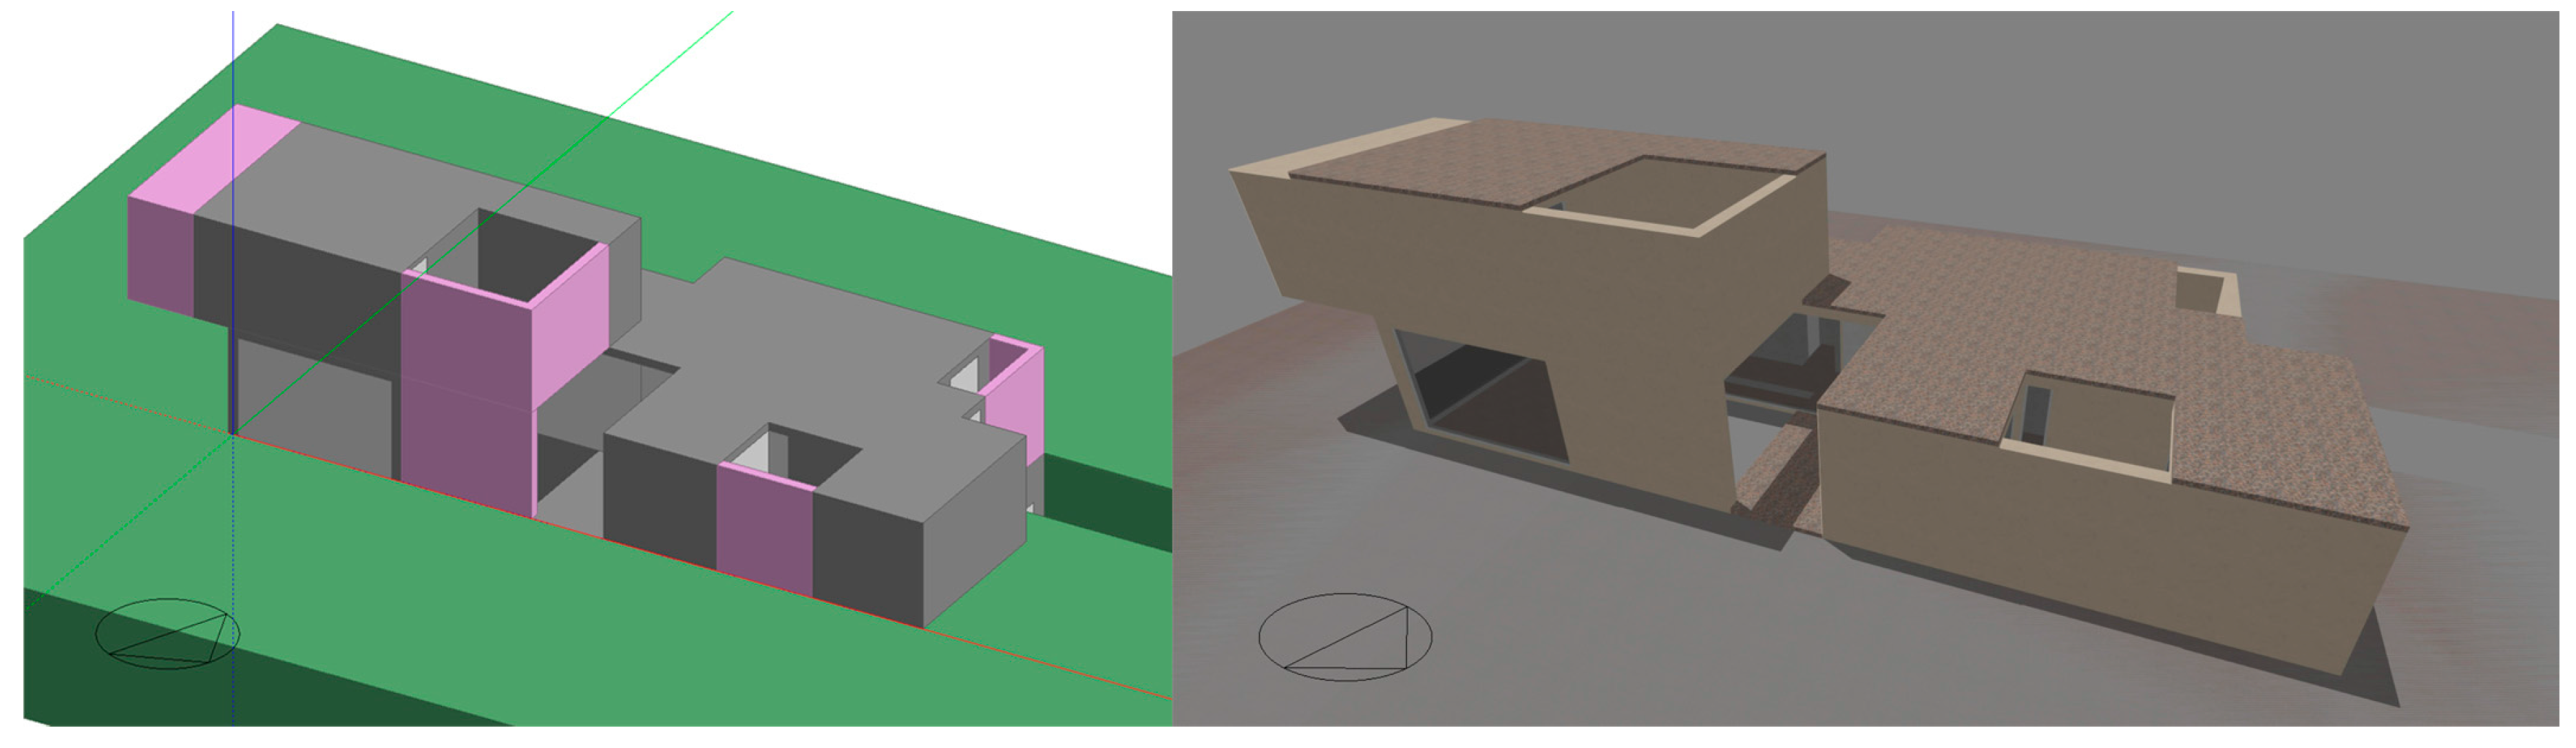
During the second phase of the project, wall rather than ceiling capillary mat systems were chosen, using the TCP prefabricated panel system described above. A total area similar to that provided for the ceiling (135 m2) was available. This was less than what would have been required in the absence of basement passive conditioning. In Figure 6, the large format TCP ceramic walls are marked in red. The system’s energy yields were studied taking into account that service start-up required the maximum power of the heat pump, while it is usual to maintain a minimum setpoint temperature at night (18 °C in winter and 28 °C in summer), at low energy consumption. During the day, indoor air temperature was maintained at setpoint temperatures of 20 °C in winter and 26 °C in summer. Energy demand obtained with simulation tools, discussed later, was considerably reduced compared to HVAC convective air conditioning systems.
5. House Monitoring
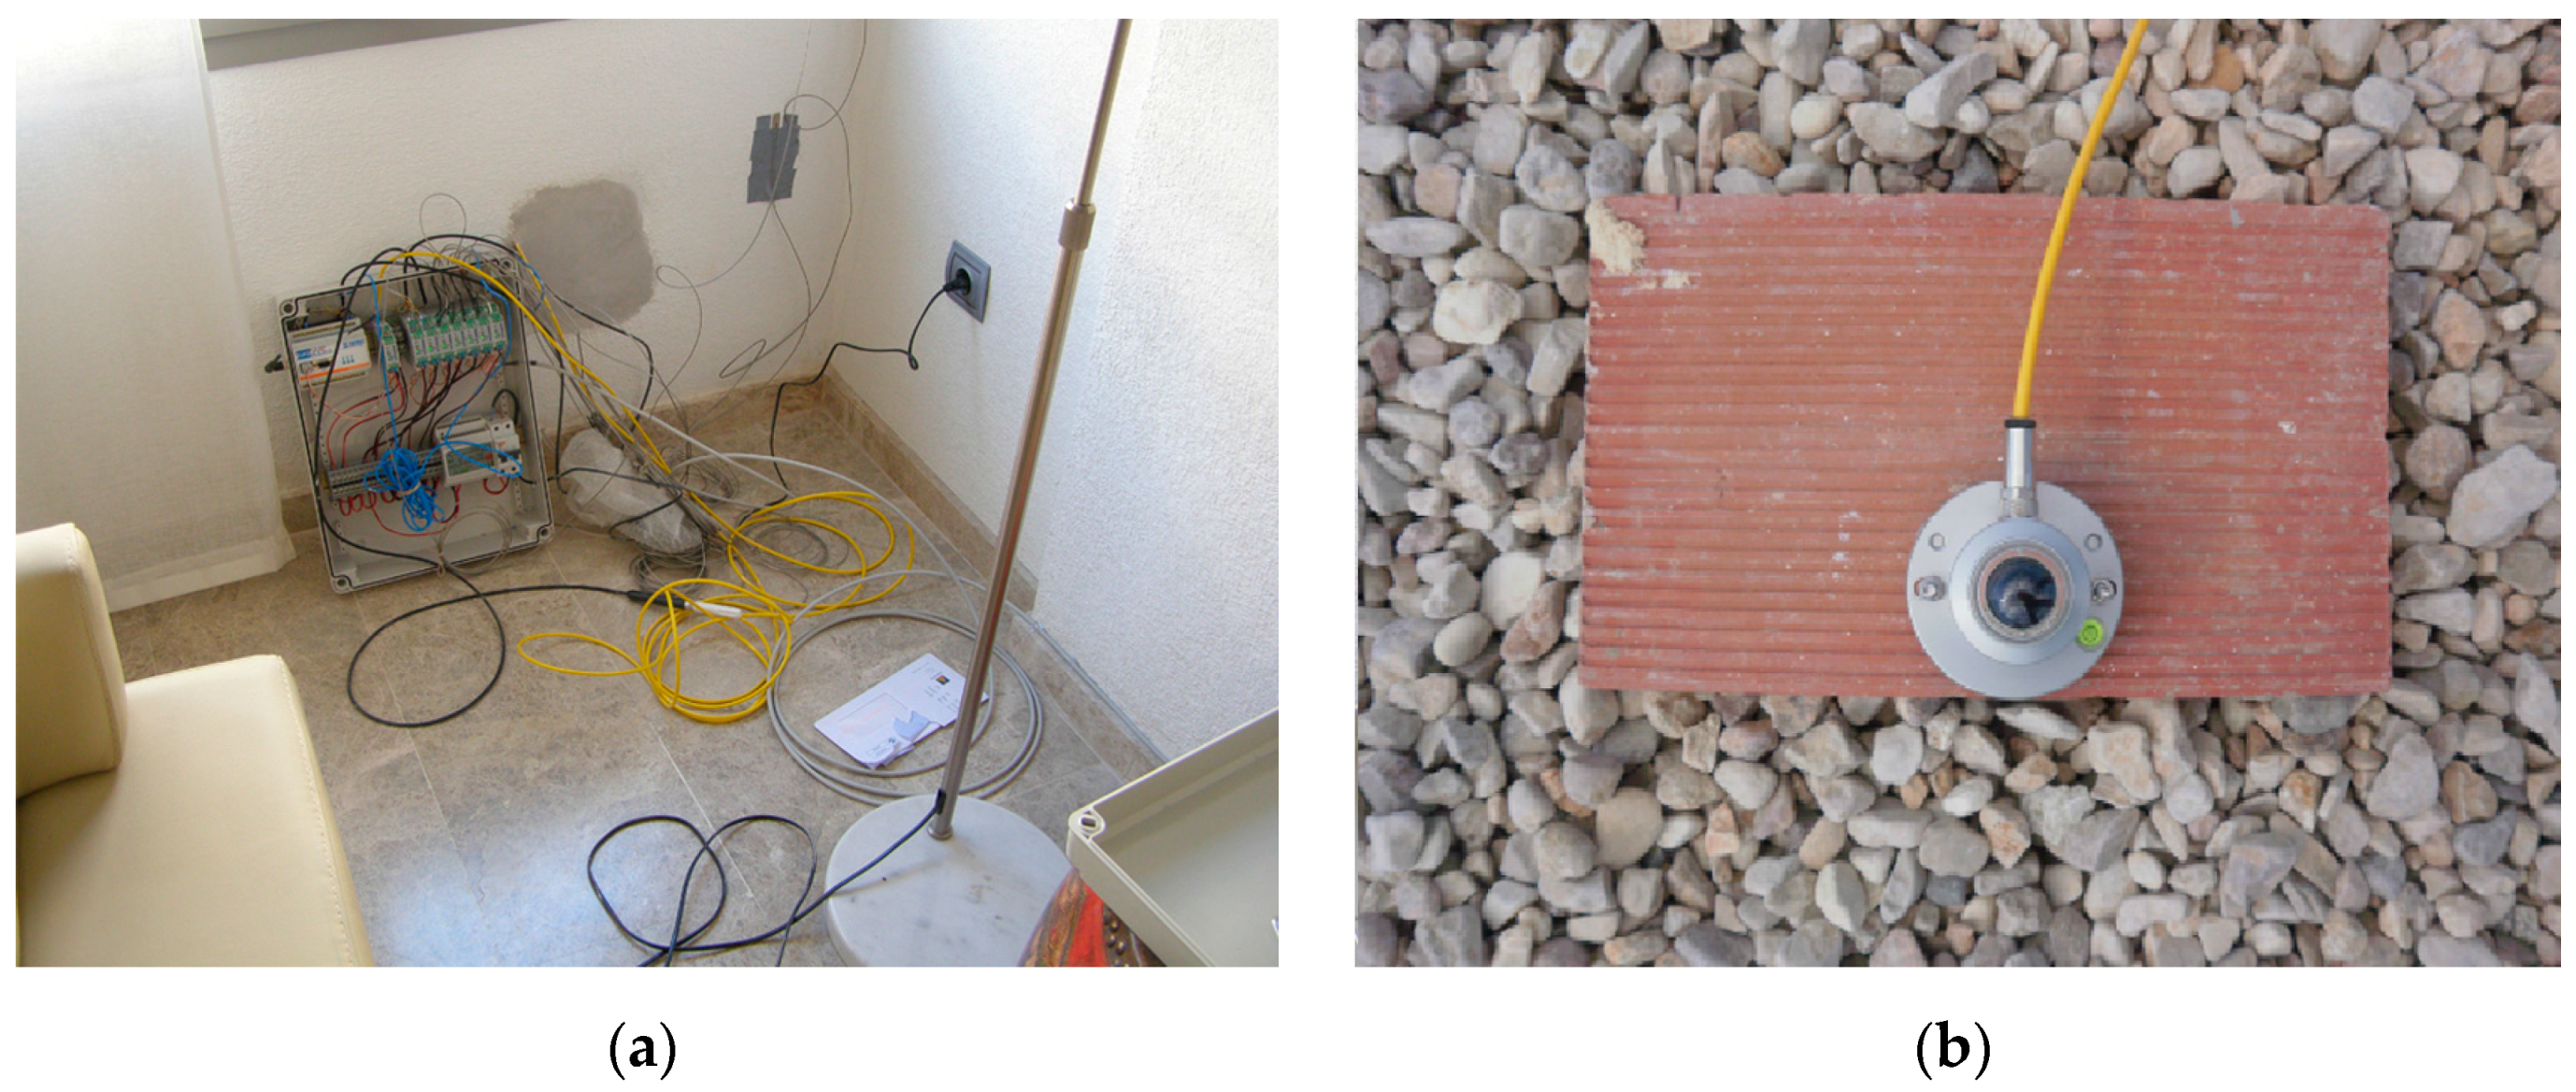
The house was monitored in two phases. The first monitoring system used consisted of sensors (surface temperature, indoor air temperature, outdoor air temperature, relative humidity, air velocity and solar radiation with roof pyranometer) placed at the strategic points of the enclosures. Data collected by the sensors were sent to a data logger (analyser), which transmitted the signal via GPRS to a database. This information is accessible from a web platform. The GRD GSM/GPRS data logger allows data to be recorded via analogue or digital channels. Through its GSM/GPRS modem, the data are sent to a server and consulted via web in graph and table format. They are downloaded as a CSV file (Figure 10). Data were collected from the complete cycle of the year 2012. The technical characteristics of the data logger and sensors are as follow:
- GPRS RTU, 1 RS232/385 Port, 2 pulse inputs, 14 digital Inputs, 6 Open Collector Digital Outputs, 6 current 0–10 V DC/4–20 mA Analog Inputs. Modbus master.
- Standard Hygroclip2-HC2-S Temperature and Relative Humidity Probe. Ranges Temperature –50 to +100 °C (−40 to +60 °C, 0–1 V outputs), Relative Humidity 0% to 100%. Accuracy ±0.8% RH, ±0.1 °K.
- Standard Hygroclip2-HC2-S3 Temperature/Relative Humidity probe for meteorology applications. Ranges Temperature −50 to +85 °C, Relative Humidity 0% to 100%. Accuracy ±1% rh, ±0.3 °C.
- KIPP Model CMP3 pyranometer ISO second class. Spectral range 310–2800 nm (50% points), response time < 18 s (95%), non-linearity < 2.5% (0–1000 W/m2), directional error < 20 W/m2 (80° at 1000 W/m2), sensitivity 7–20 CV/W/m2 (variation < 5% from −10 °C to +40 °C), operating temperature −40 °C to +80 °C. Thermopile detector.
- MiniAir64 Mini, probe anemometer, air velocity range 0.5–40 m/s, accuracy ±0.5% of full scale, 1.5% of reading, power supply 9–24 vDC, O/P 4–20 mA. Temperature −65 to 150 °C.
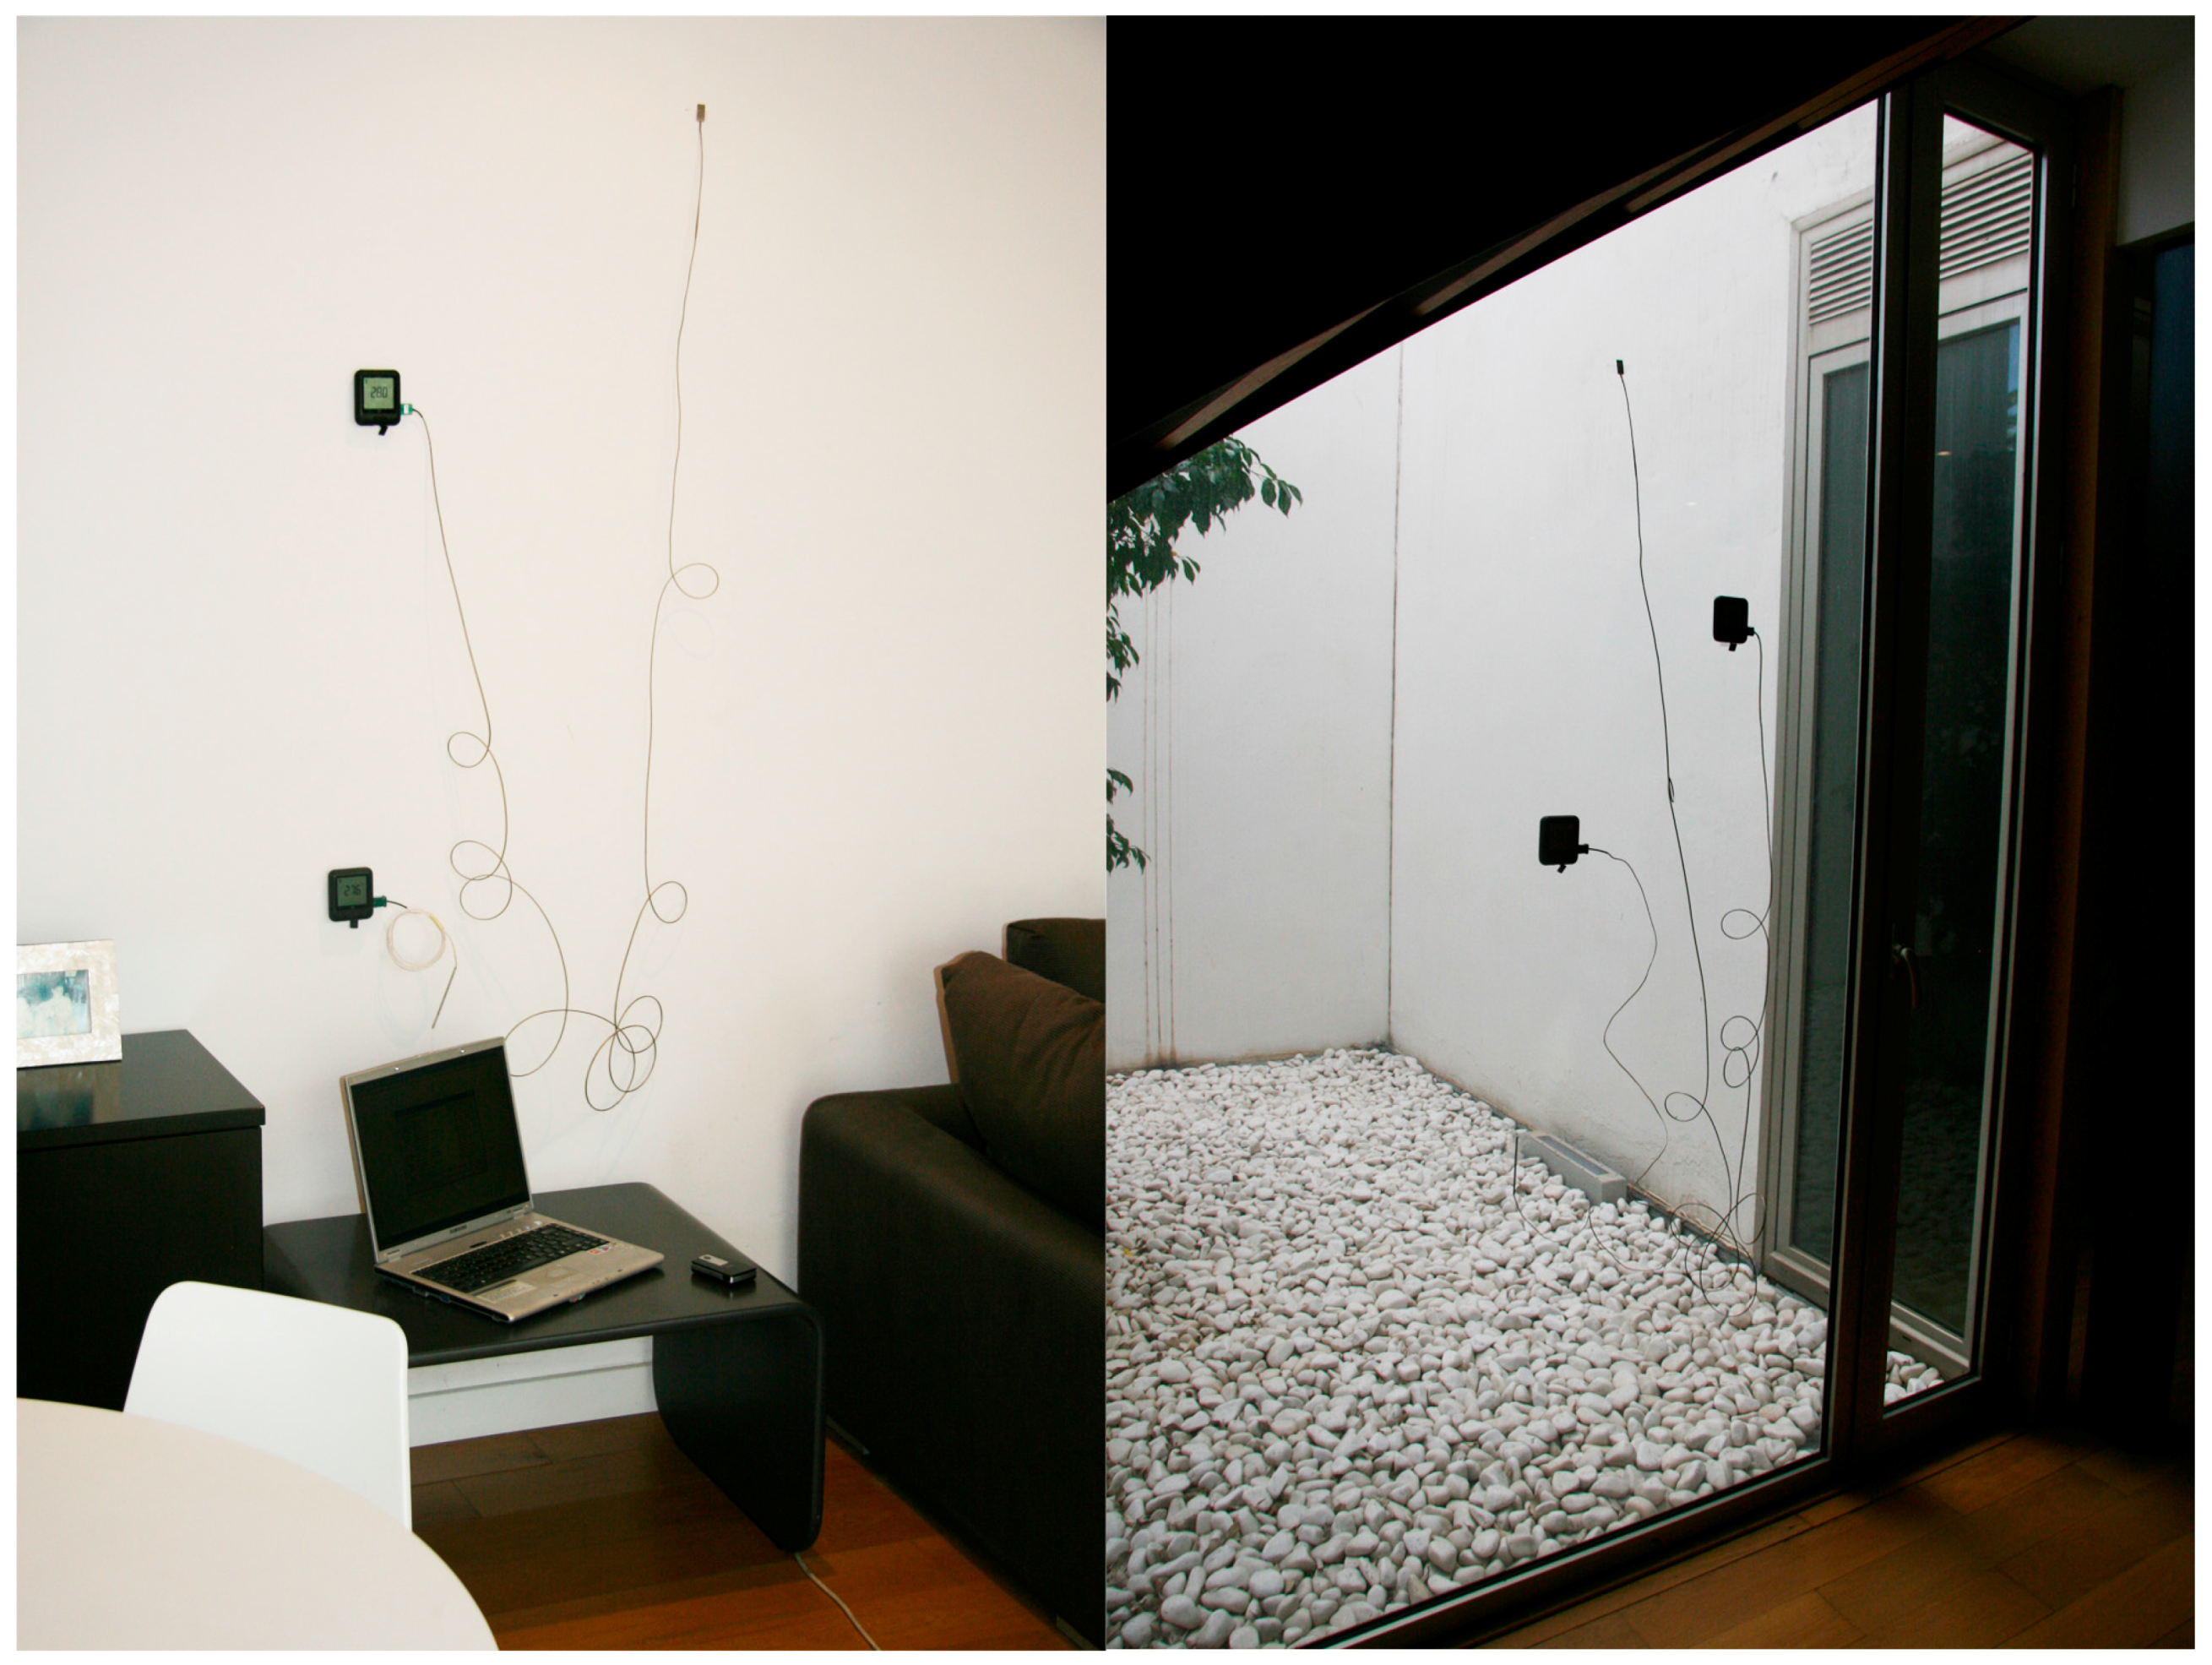
In a second phase, monitoring was performed via a wireless system. Temperature sensors connect to small “EL-WiFi-TC Thermocouple Probe Data Logger” model analysers. These “EL-WiFi-TH, Temperature and humidity data logger” analysers, with built-in temperature and humidity sensors, interpret the recorded data and send WiFi signals to a laptop computer (Figure 11). By installing the “EasyLog WiFi Software”, data is received and stored on the computer. Via a custom code, this information can be accessed from any computer through the network. This second monitoring phase was carried out in the week from 24 to 31 July 2016, and from 1 to 7 February 2017. Data were taken of surface temperatures, indoor air temperature and relative humidity in other points of the dwelling, which enabled a faster and more adjusted calibration in the Design Builder simulation tool. The technical characteristics of the sensors are as follow:
- ○
- EL-WiFi-TC. Thermocouple Probe Data Logger with WiFi. Temperature range is −270 to +1300 °C with a ±1.5 °C and a display resolution of 0.1 °C. Supports J, K, N and T thermocouple probes.
- ○
- K type thermocouple, surface mount 13 mm × 25 mm, measurement range up to −40 to 350 °C.
- ○
- EL-WiFi-TH. Temperature and humidity datalogger with WiFi. Internal memory for up to 500,000 readings. Ranges Temperature −50 to +100 °C (−40 to +60 °C, 0–1 V outputs), Relative Humidity 0% to 100%. Accuracy ±0.8% RH, ±0.1 °K.
6. Calculating Conditions of Comfort
First, data were collected on indoor air temperatures, surface temperatures, relative air humidity, solar radiation, etc., in the basement living room, guest bedroom, ground floor living room, remaining dependencies, and first floor bedroom, in the most unfavourable case, i.e., on 1 July at 3:00 p.m. A comparative calculation was then performed on the sensation of comfort on the ground floor, according to the method described in Section 5. The comparison was made over three scenarios, for which simulations are made in the following section:
- Option 1 (OP 1).
- Current house but based on the initial project, i.e., without a basement, and with construction of techniques and multi-layer enclosures similar to the house finally built.
- Option 2 (OP 2).
- House in current state, with passive cooling through the basement and connection with the central staircase. Ground floor slab with cupolex system, with thermal insulation and air chamber of 50 cm.
- Option 3 (OP 3).
- House in current state, with passive cooling of the basement, and KaRo capillary tube mat system in various walls of the rooms.
To calculate human comfort in these scenarios and for that specific moment of the year, the Fanger procedure described above was followed to obtain the form factors, and, based on these, mean radiant Trm temperature. Mean values of the surface temperature of each surface were thus obtained, based on the simulations carried out through Design Builder and the energy losses of the individual qcvi + qrdi in watts, which is an indicator of experienced comfort along with the operating temperature To.
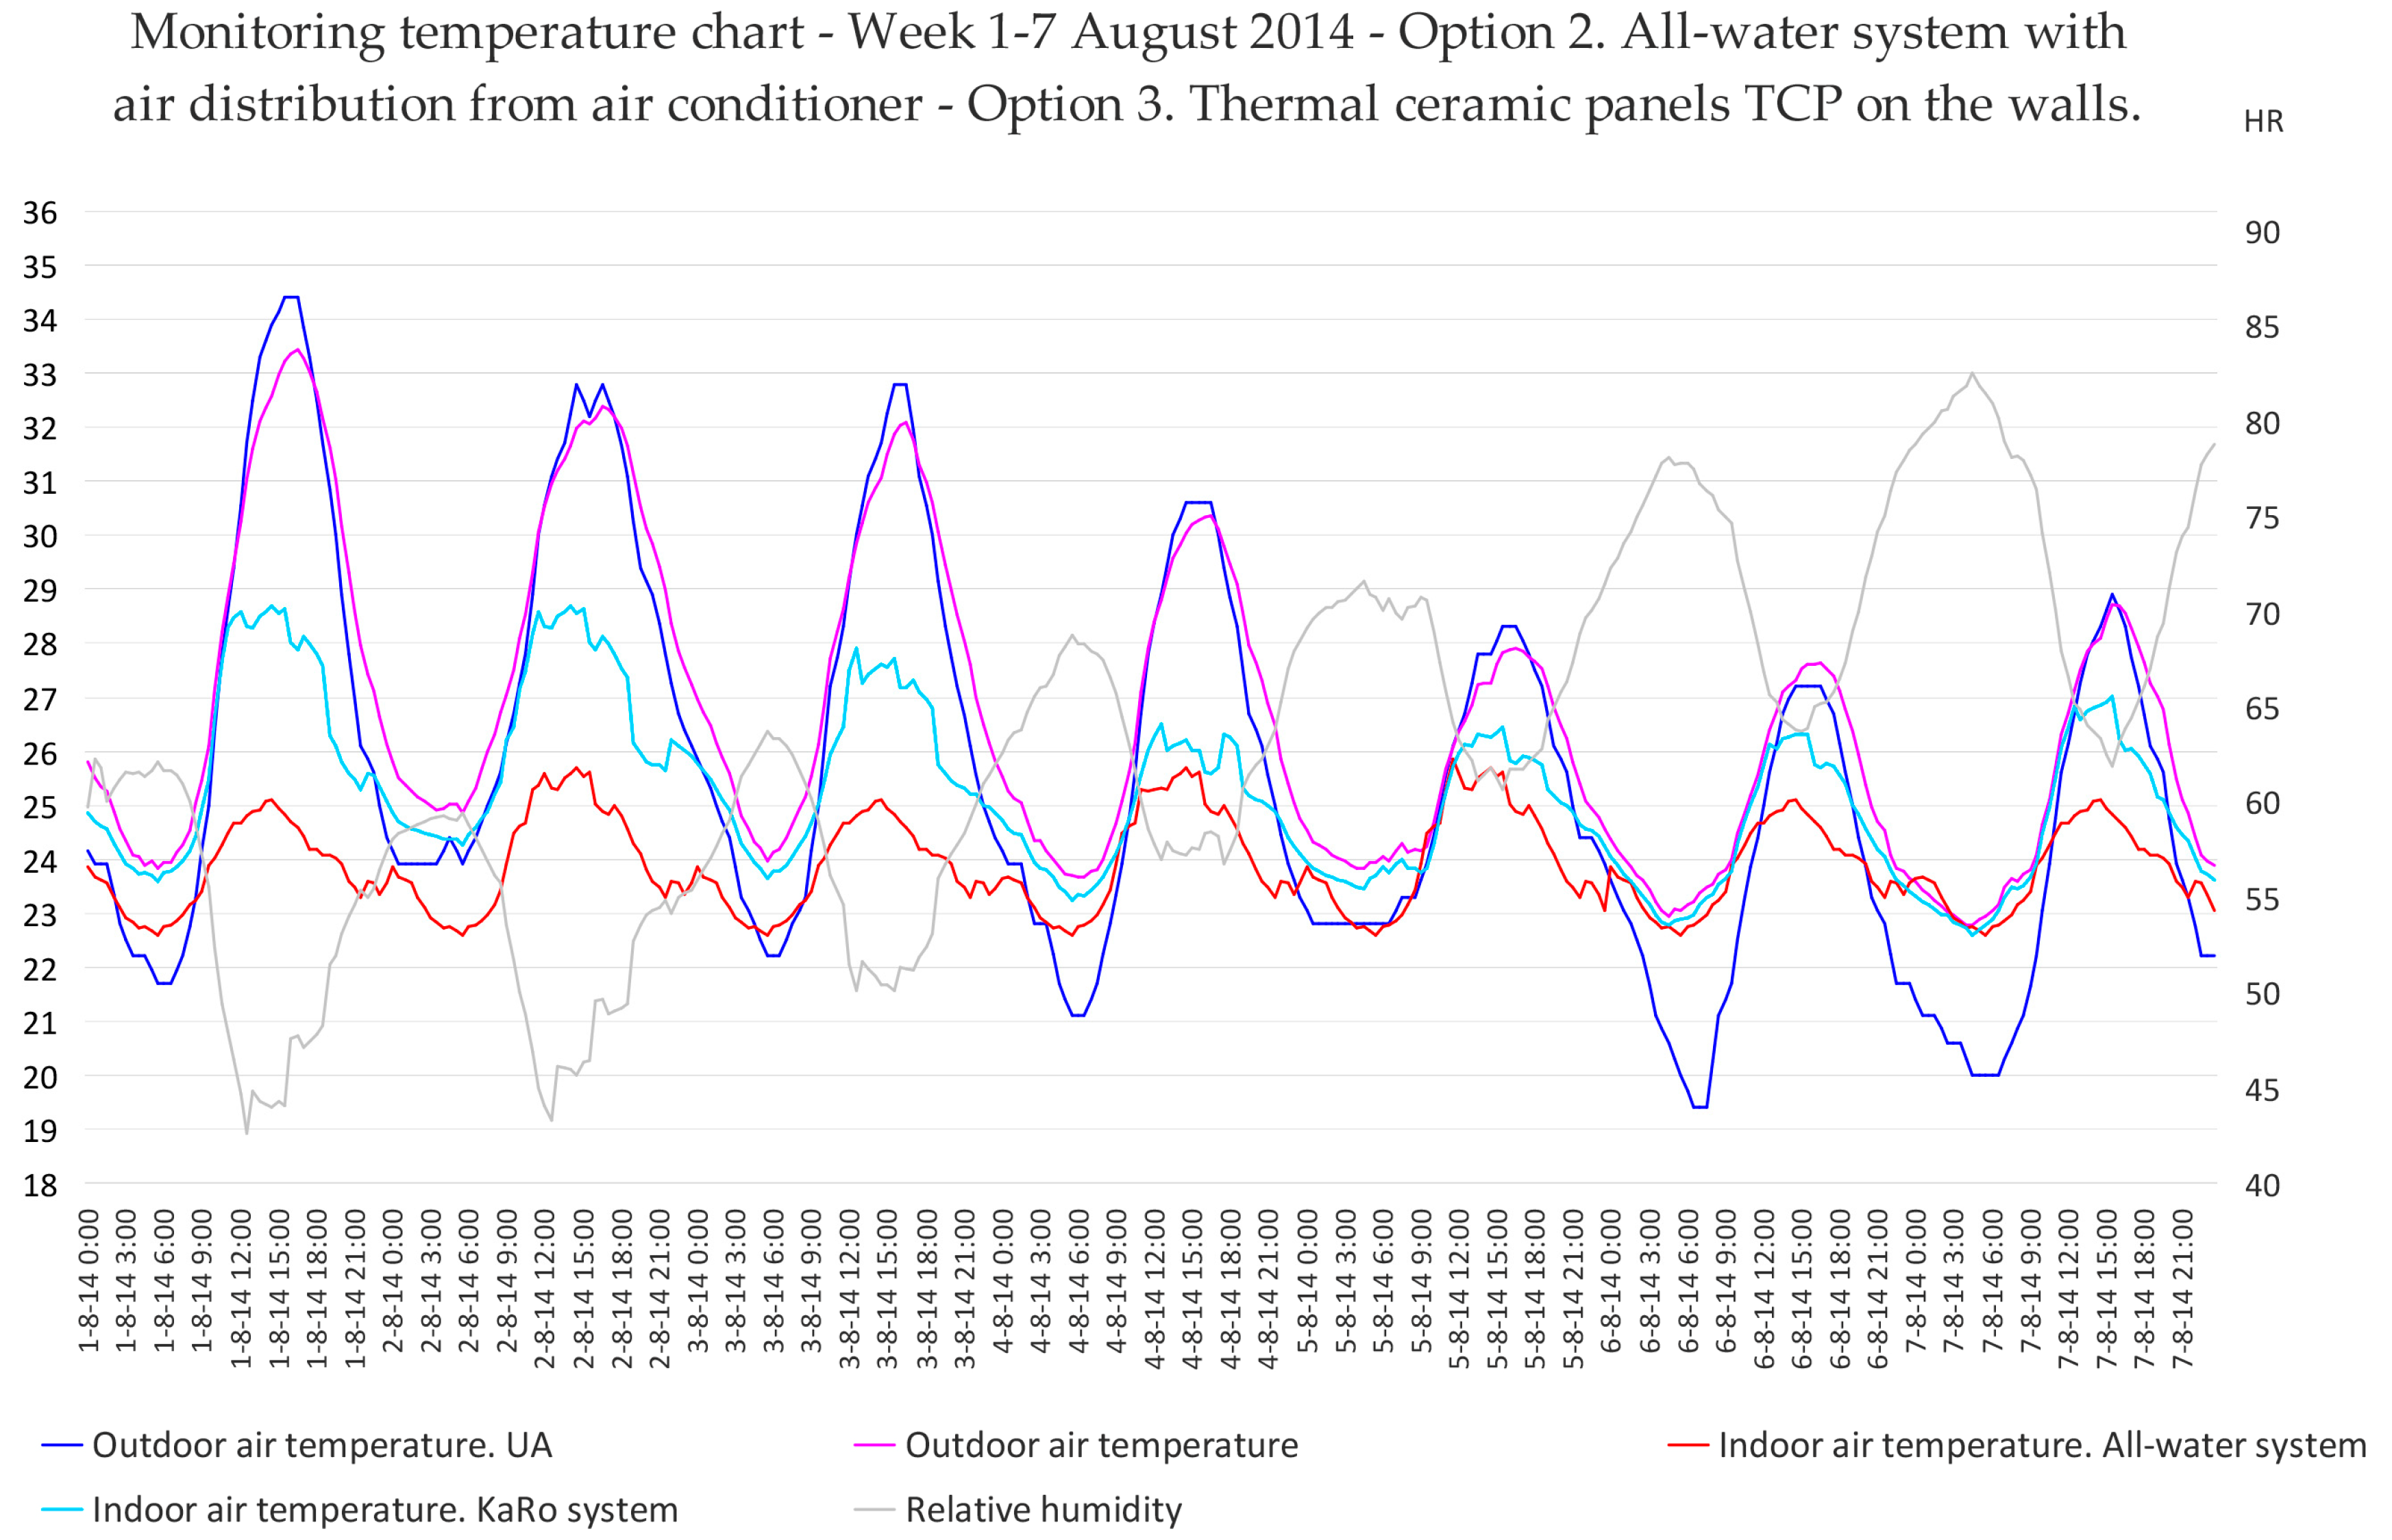
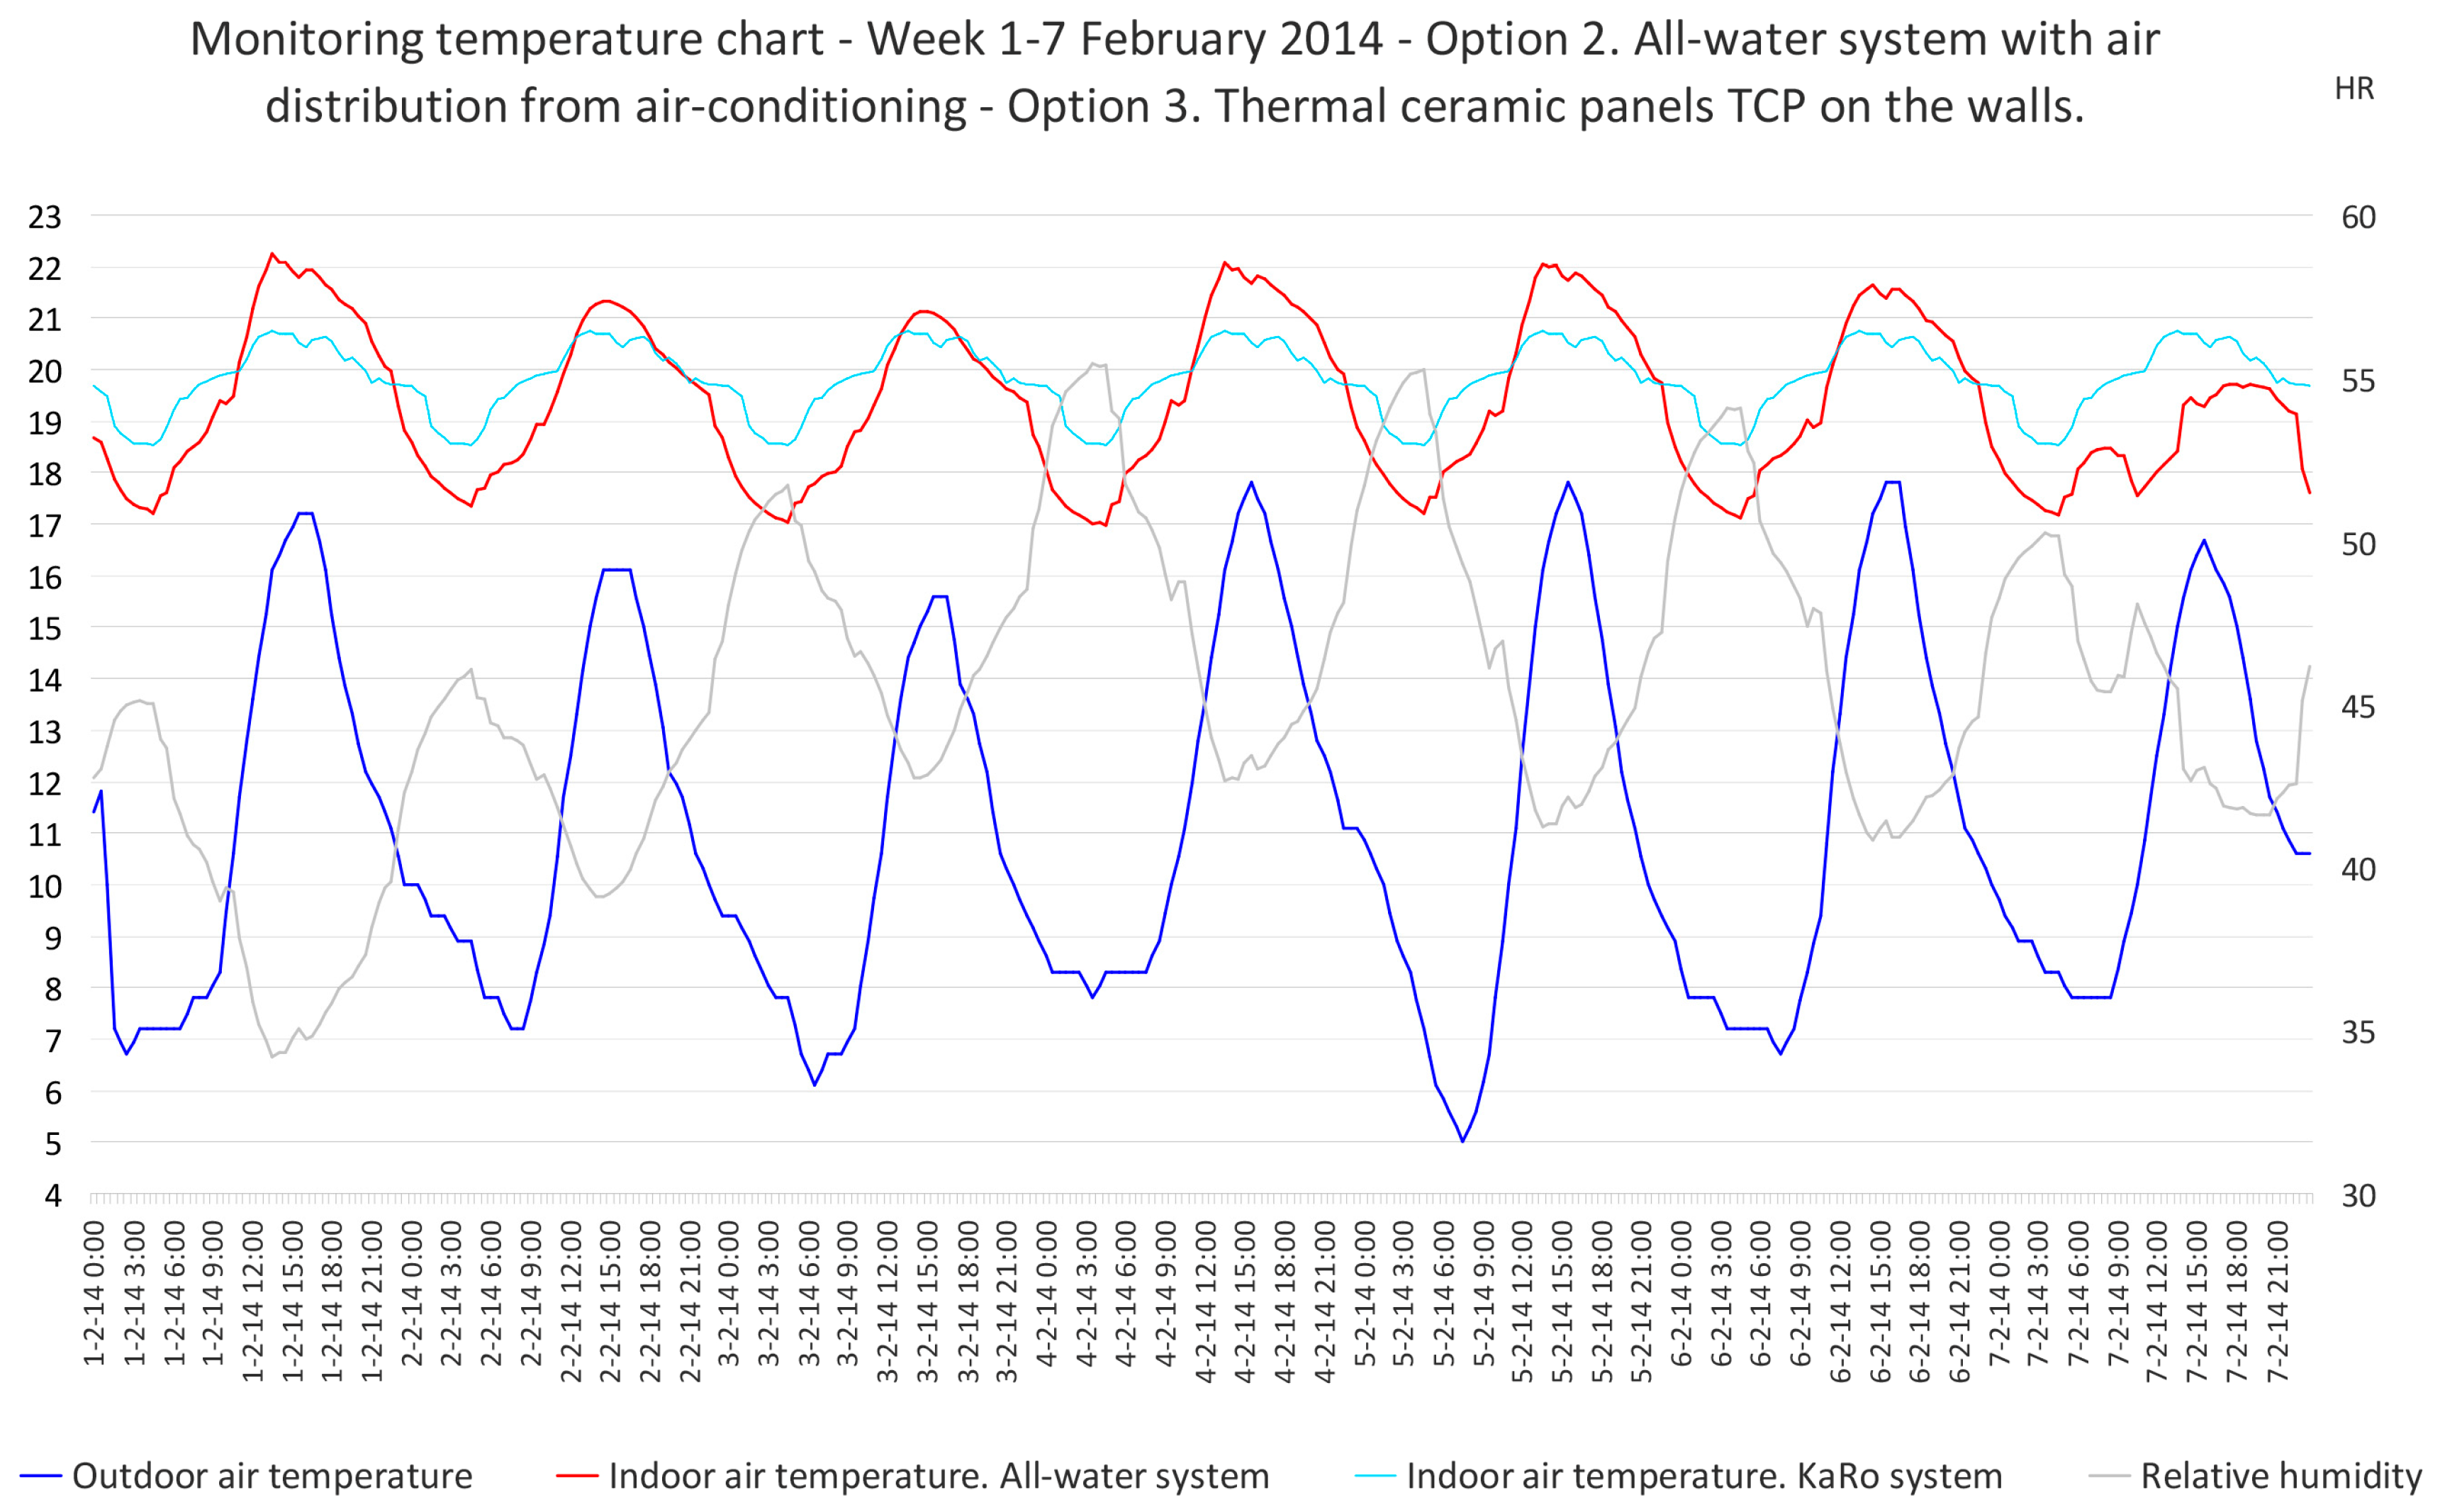
Figure 12 and Figure 13 show the results of monitoring of outdoor air temperature, relative humidity and indoor air temperature for convective system and air conditioning system with ATC panels, through simulations with the Design Builder tool, for the weeks of 1–7 August 2016, and 1–7 February 2017. The external air temperature and relative humidity values were collected by monitoring, while the indoor air temperature data was derived from the simulation.
Table 1 shows the comparative results of the quantitative analysis of comfort in the living room. As shown, the total losses of the individual qcvi + qrdi in OP 2 in the ground floor are 79% higher than for OP 1, mainly because air temperature is 2.09 °C lower, and wall Trm are generally 1.72 °C lower. Using the wall KaRo system, occupant losses are 45.8% higher due to the radiation effect. In the basement, total qcvi + qrdi losses are 43% higher than those of the ground floor in OP 2, and 17% in OP 3 (Table 2). It can be deduced a priori that appropriate usage of the basement as a passive conditioning system would allow dispensing with an additional air-conditioning system. Since usual comfort values of occupant losses are around 90–100 W when at rest, and 100–120 W at moderate activity, we can conclude that the basement room provides wonderful levels of comfort, and that the ground level room would have acceptable levels, although they could be insufficient during load peaks. Housing without a basement or OP 1 is far from the required comfort levels, and would require a HVAC system in summer.
7. Calculating the House’s Energy Demand
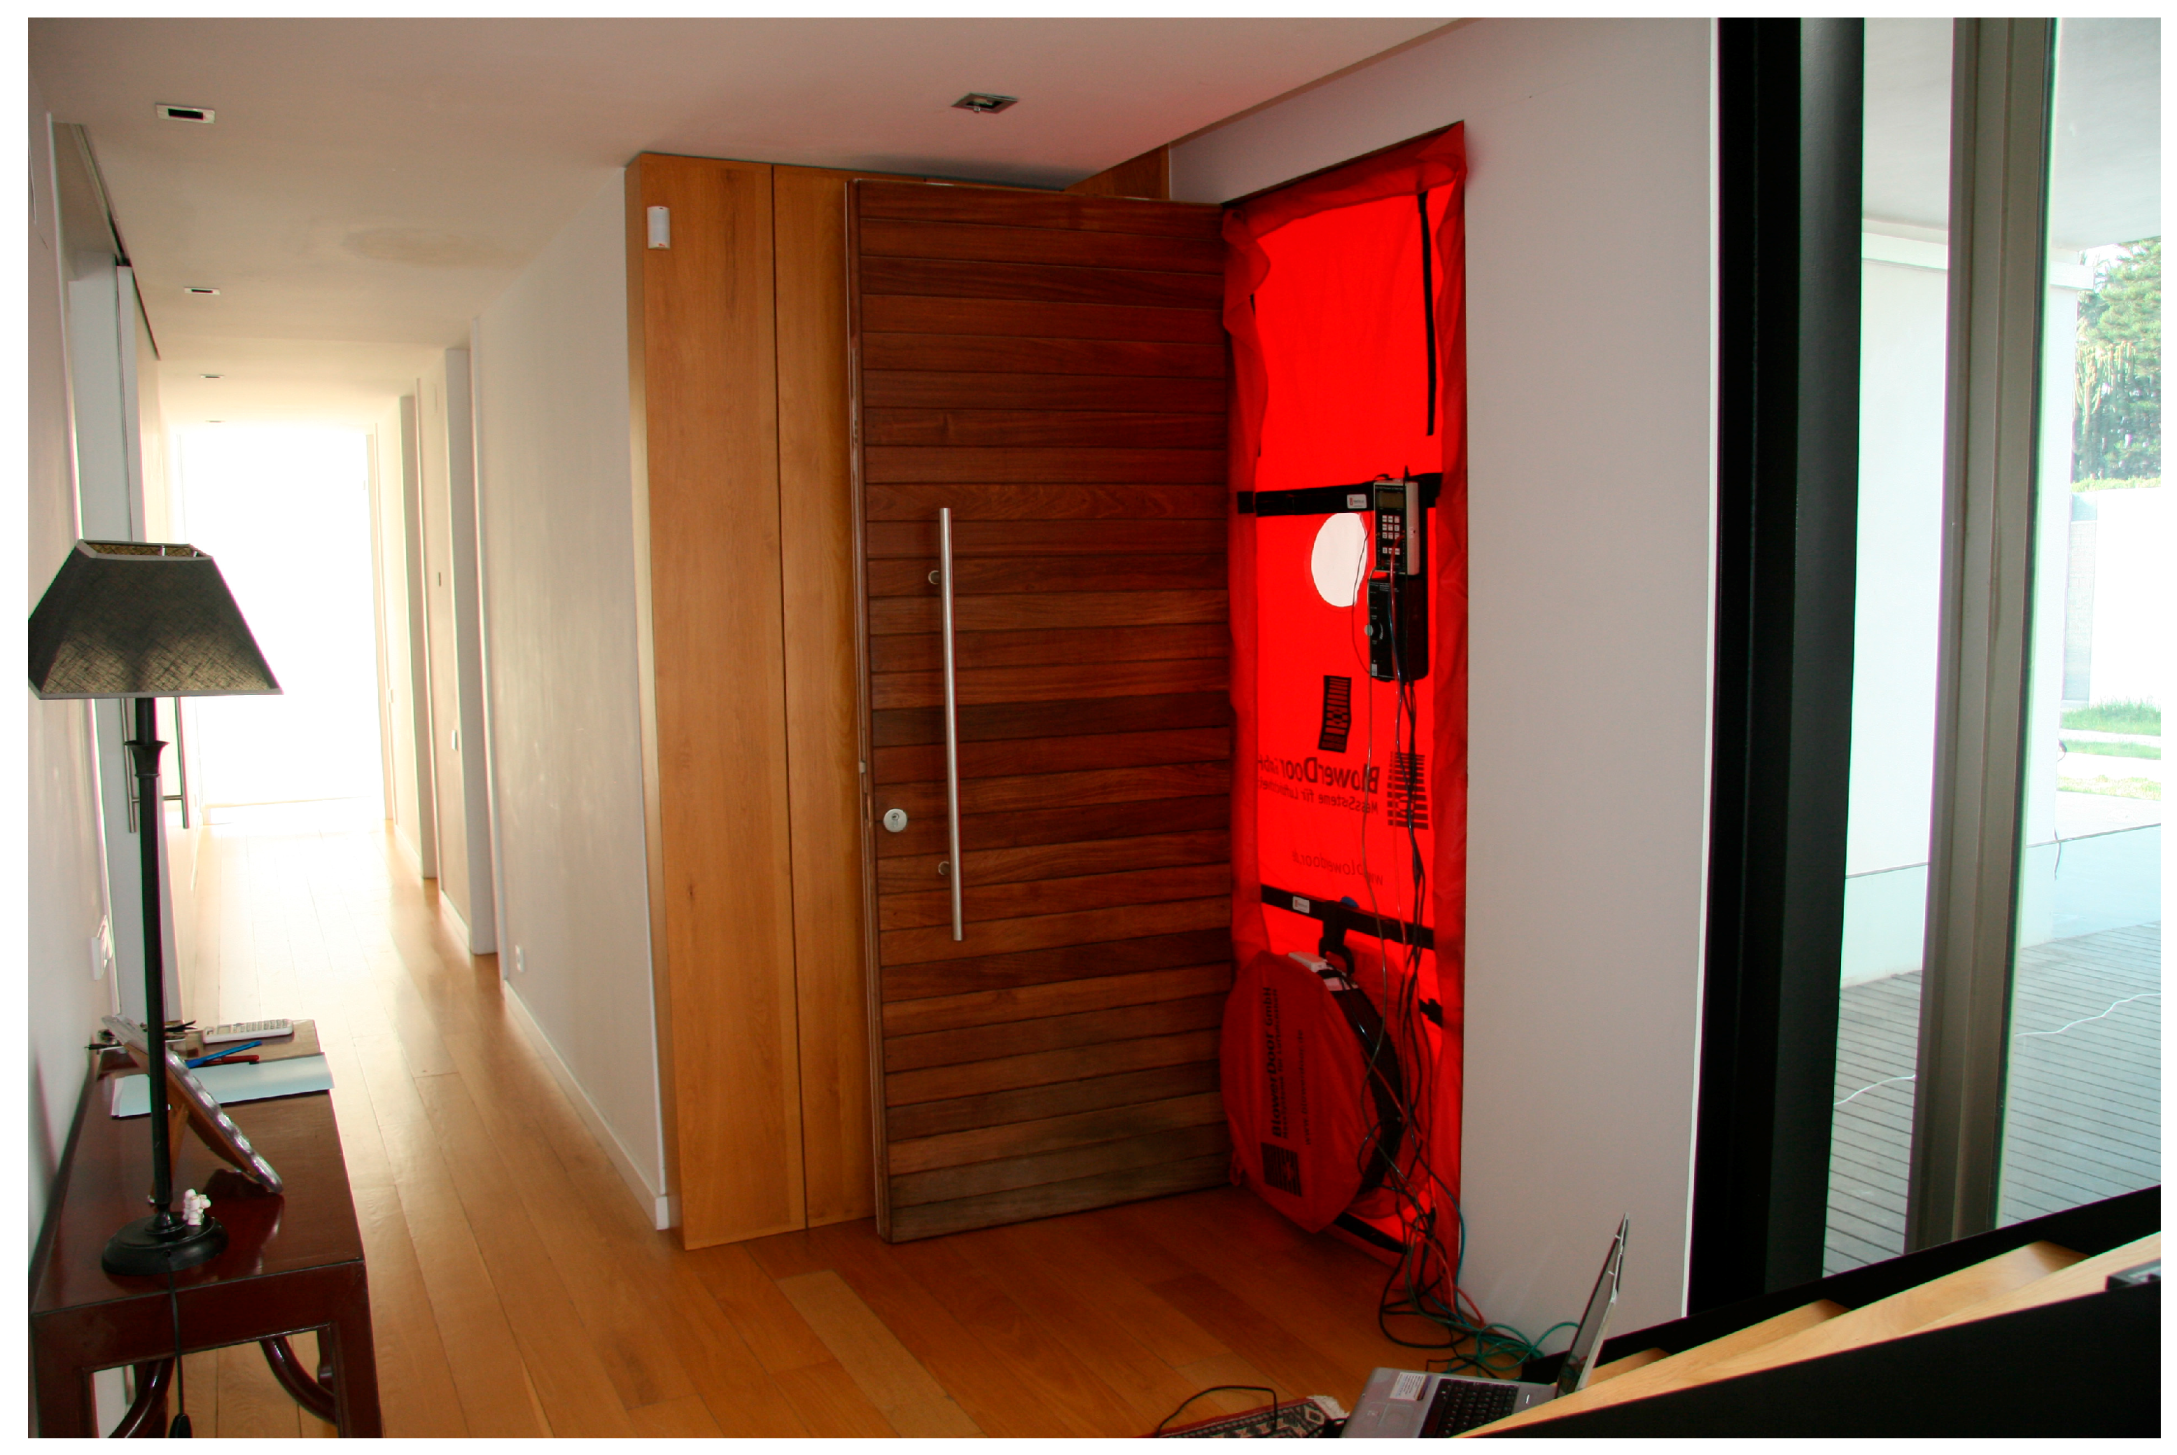
To perform the simulations of the building’s behaviour in terms of energy demand and indoor comfort parameters, the data below were introduced in the Design Builder tool (Figure 14). The winter period covers 1 December–30 April, and the summer period 1 May–30 November. Setpoint temperatures of indoor air were 20 °C in winter and 24 °C in summer. Occupation, for the standard calculation of air changes per hour (acH), was four people. In accordance with the current Technical Building Code (CTE), a rate of 0.63 acH of air changes per hour was established. Infiltration of air through the building’s envelope was moderate thanks to the quality of the frameworks and joinery. To assess it, the Blower Door test was carried out in accordance with EN 13829 using the BlowerDoor GmbH MessSysteme für Luftdichtheit (Figure 15). Results are shown in Table 3.
To obtain the calculated mean rate of air infiltration in the building—a difficult parameter to quantify—and make simulations in Design Builder to obtain the values of annual energy demand, we followed the protocol established in the UNE-EN 12831:2003 standard, which allows to convert the value of n50 to air changes per hour under normal pressure conditions using the formula:
nwinter = 2 × n50 × ei × εi
- n50
- air changes per hour at 50 pascals = 3.42;
- ei
- coefficient of wind protection = 0.05; and
- εi
- height factor corrector = 1.
The result of the n50 value of the Blower Boor test was 3.42 acH (Table 3), a low value for single-family housing in Spain, far from the standard p Passivhaus of n50 (<0.6 acH), but close to the value required by German regulations for natural ventilation buildings (3 acH). The converted value of air leakage or annual average was 0.342 by using the above expression, which was introduced into the Design Builder tool in the modelling phase.
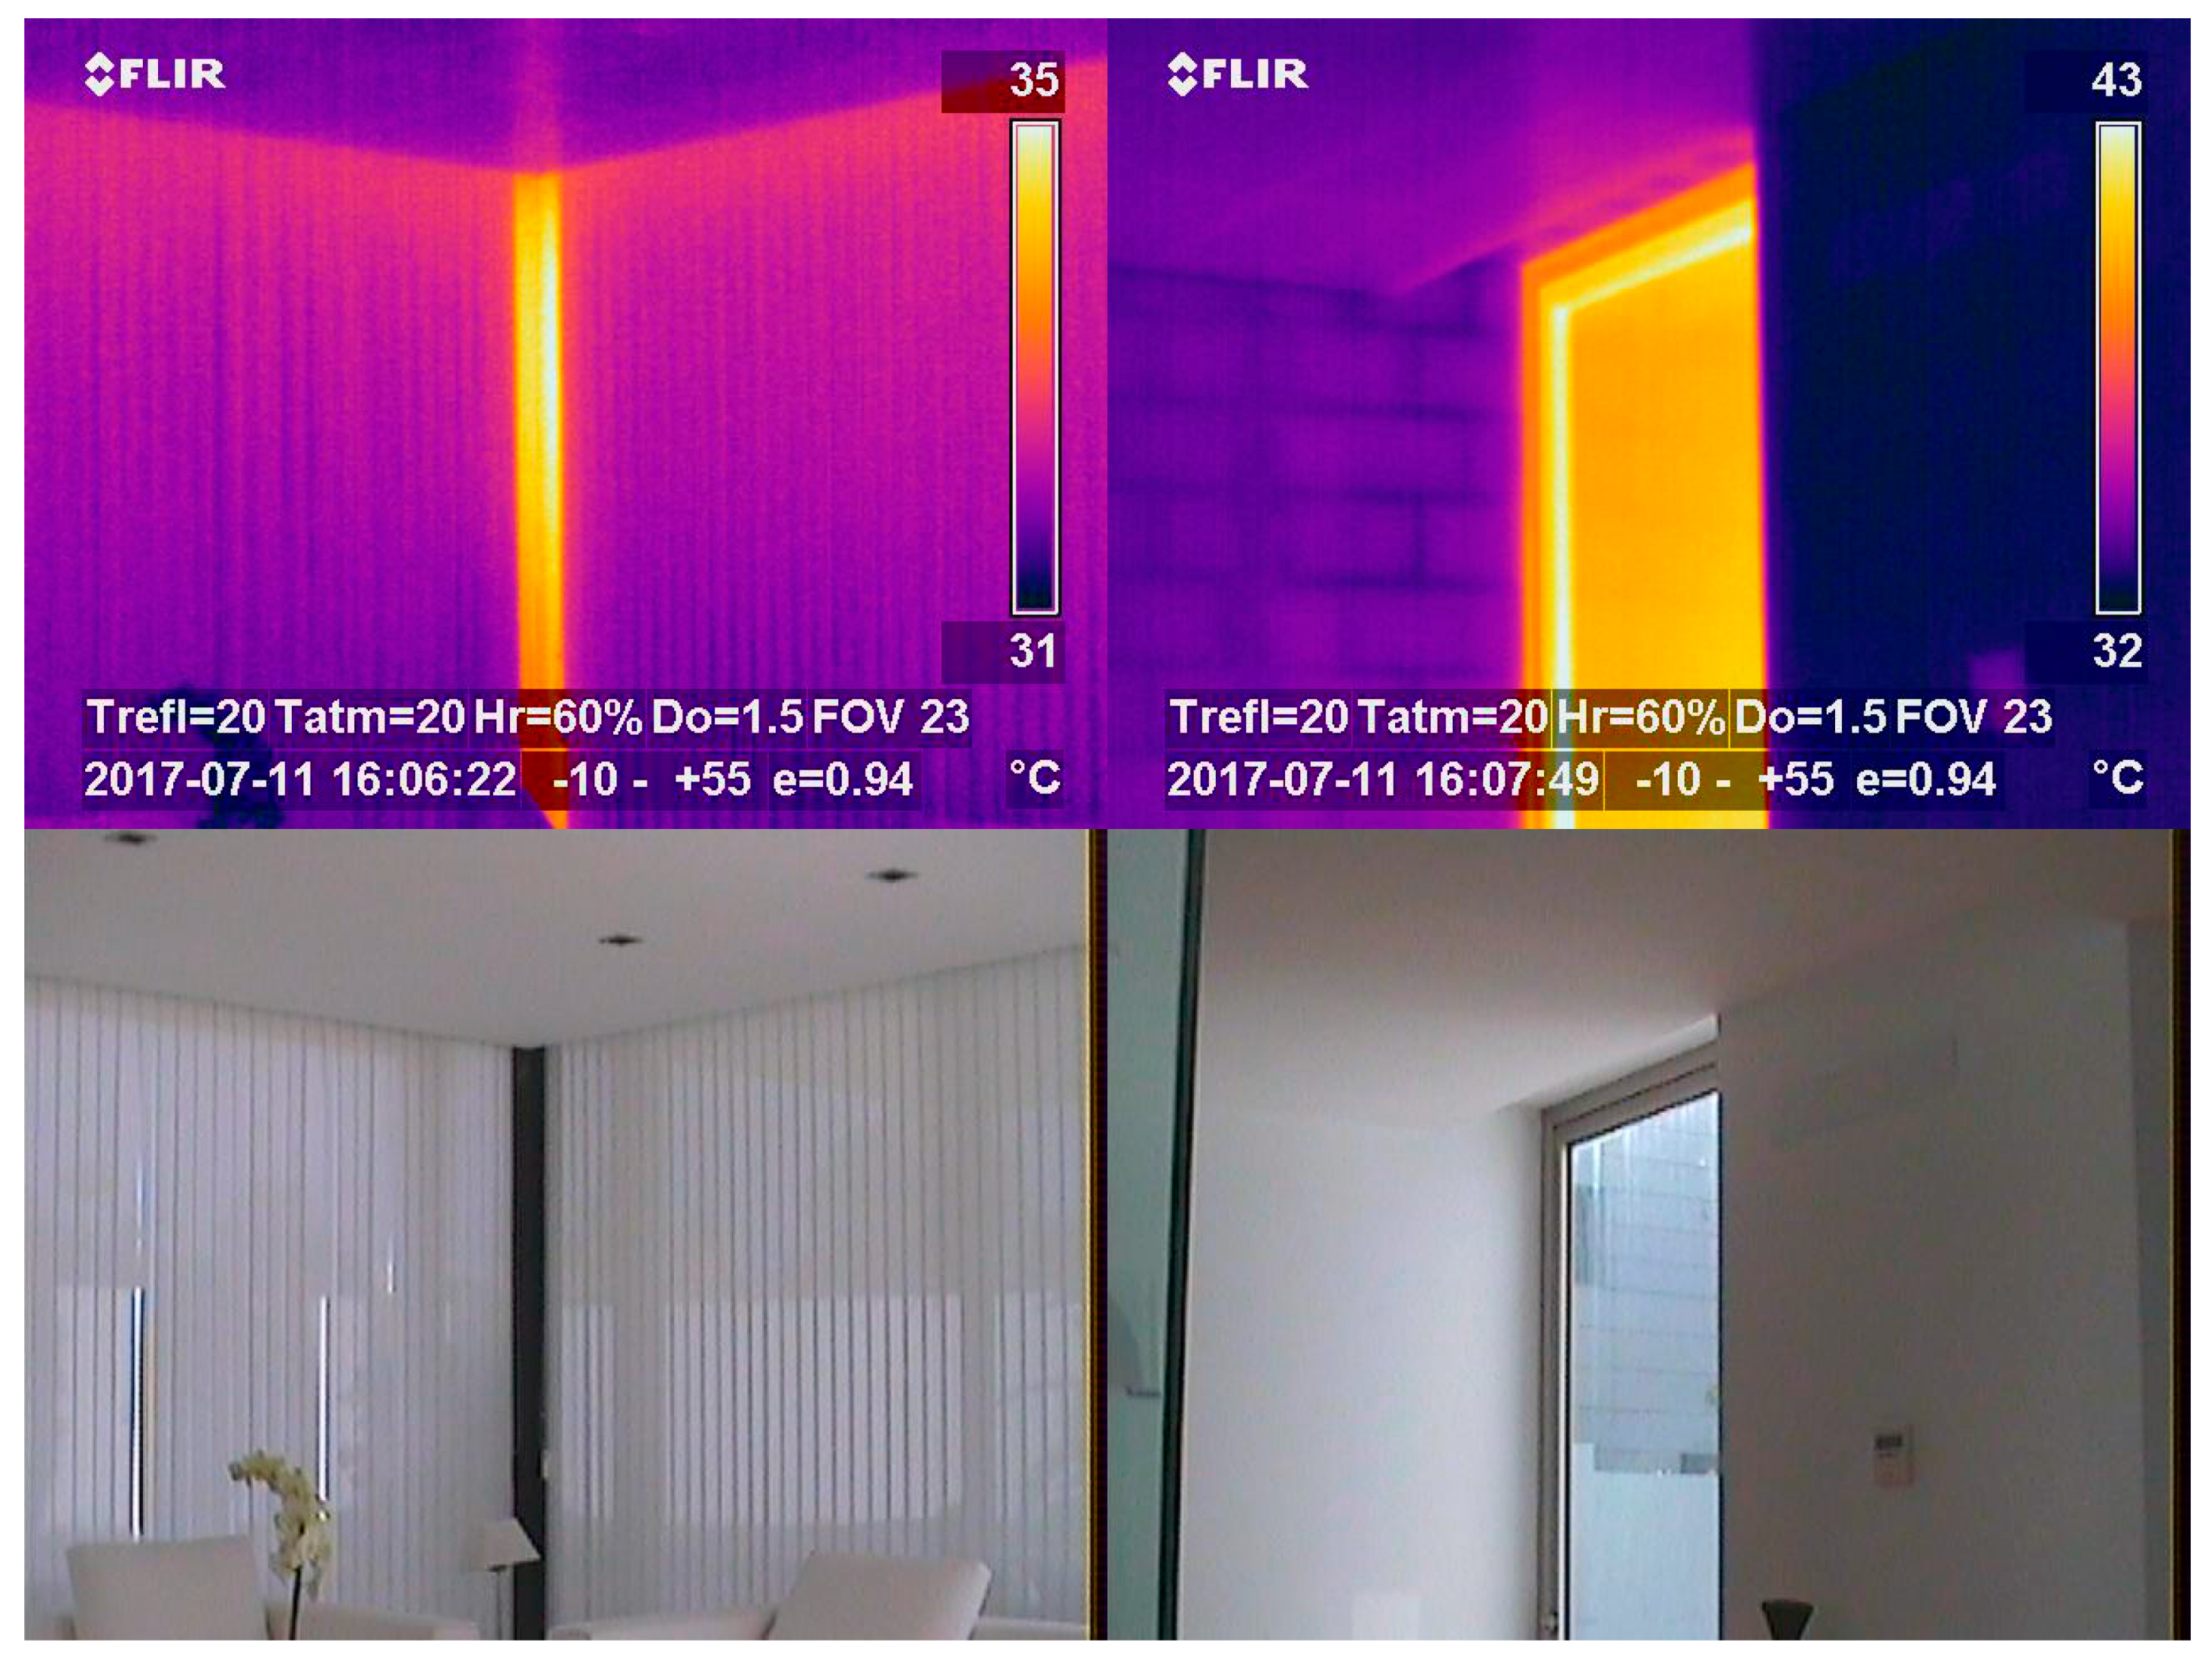
The Blower Door test tool was used to detect thermal bridges through thermal camera imaging using Thermocam P 25 from Flyr (Figure 16). They were quantified using the AnTherm program. Load gains or losses due to thermal bridges [38] were estimated at 3.5% of total thermal loads by U thermal transmittance of the building envelope, which is similar to the values obtained in previous studies [39,40].
To perform simulations of building behaviour with radiant surfaces, the Design Builder tool is complex in its modelling and calibration. For this purpose, the initial KaRo capillary mat design scheme was introduced in the modelling (Figure 17), and slow calibration was carried out by presetting the surface temperatures of the TCP panels at 18 °C to avoid the risk of surface condensation. Both fan-coils were also dehumidified, with a power of 3.9 kW and a power consumption of 4860 kWh/year.
Once the previous parameters of air infiltration, surface temperatures, air change rate, occupation, etc. were obtained, house behaviour was simulated applying the three options described above, with the aim of analysing occupant comfort sensation, temperature gradients existing in the rooms of the house (mainly the differences between basement rooms and those in the rest of the house), and comparing summer and winter energy demands (Table 4). This way, energy savings obtained from basement cooling, and even the investment payback period of a radiant surface system could be quantified versus a conventional convective system. Alternative systems would therefore be sought to intervene in the building envelope to reduce energy demand [41].
To adjust the parameters obtained by simulation to the actual data, and to calibrate the model, the values of indoor air temperatures and the basement retaining walls obtained by monitorisation were applied for OP 2 and OP 3. The climatic data file of external air temperatures, relative humidity, and levels of solar radiation measured using a pyranometer over the entire one year cycle, obtained in Alicante in previous publications [40], was also introduced. Wall surface temperature was corrected, and the infiltration rate was adjusted to 0.342 acH, so the model was calibrated by adjusting air and retaining wall temperatures to the values obtained from monitorisation. The sensors were applied based on a calibration certified by the technicians, and later confirmed in situ through Testo manual equipment (analiser Testo 435-2, temperature sensor NTC, ranges –50 to +50 °C, accuracy 0.1 °C; relative humidity K/T, accuracy 0.1% HR; air velocity sensor 0635.1535, ranges 0–20 m/s, accuracy 0.01 m/s).
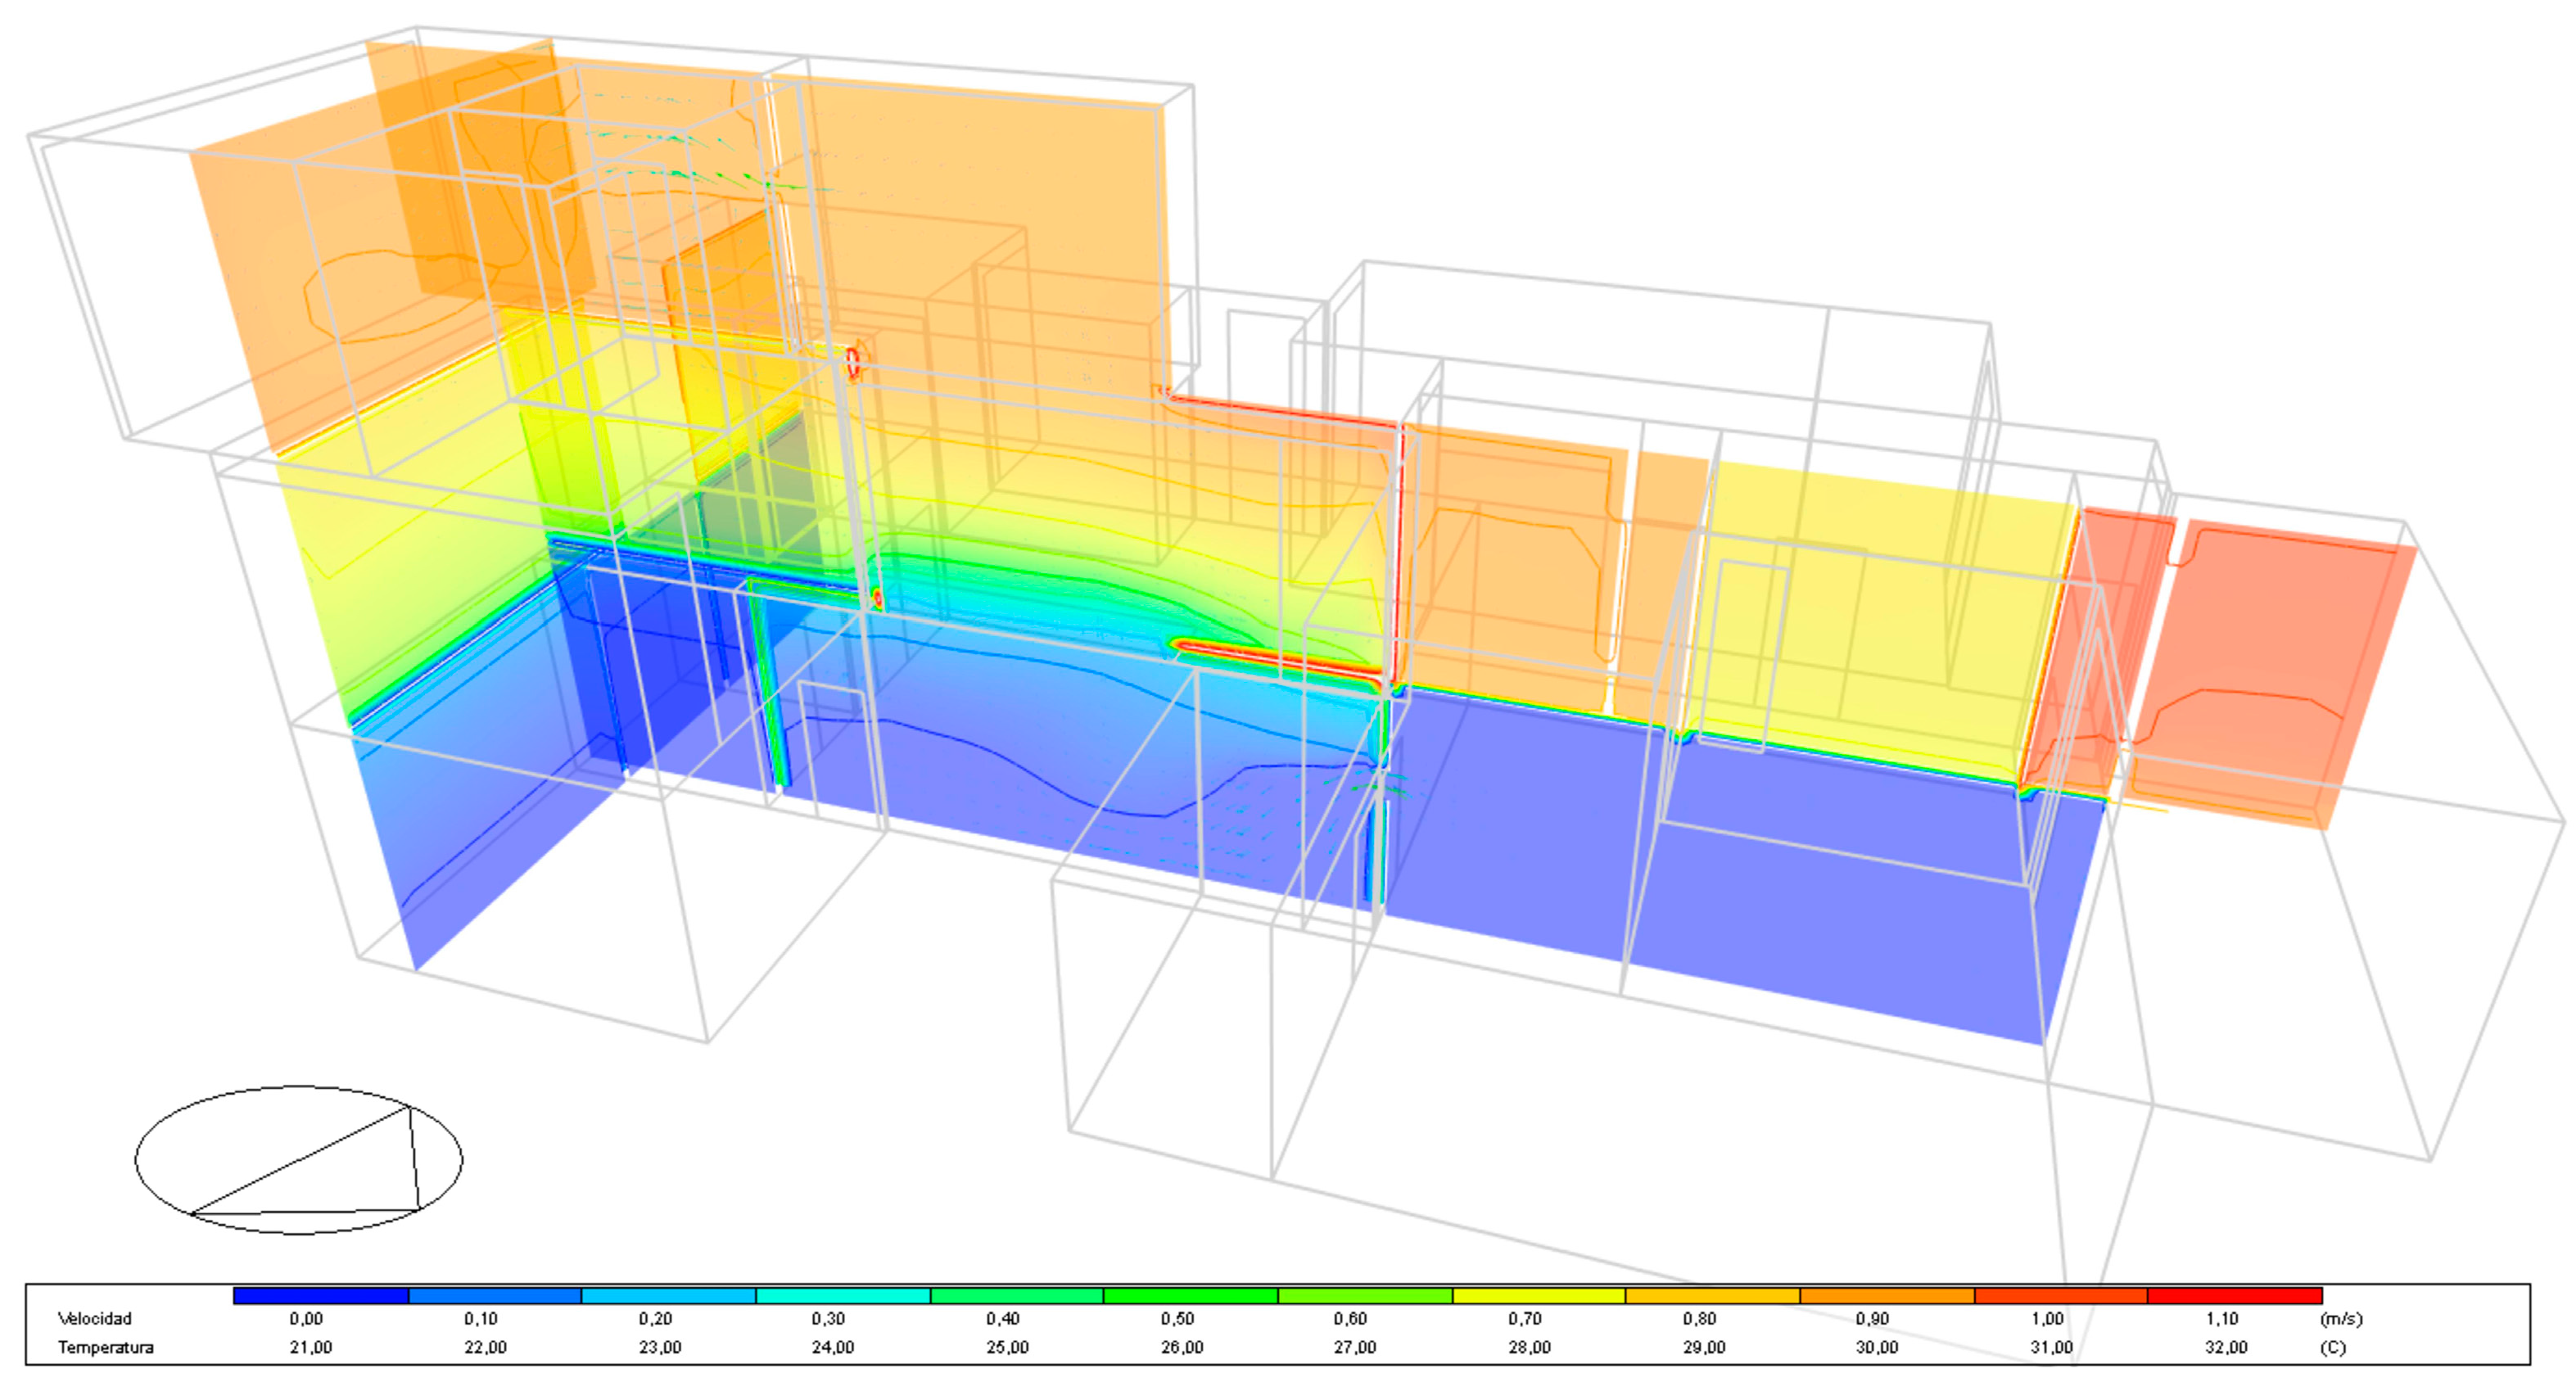
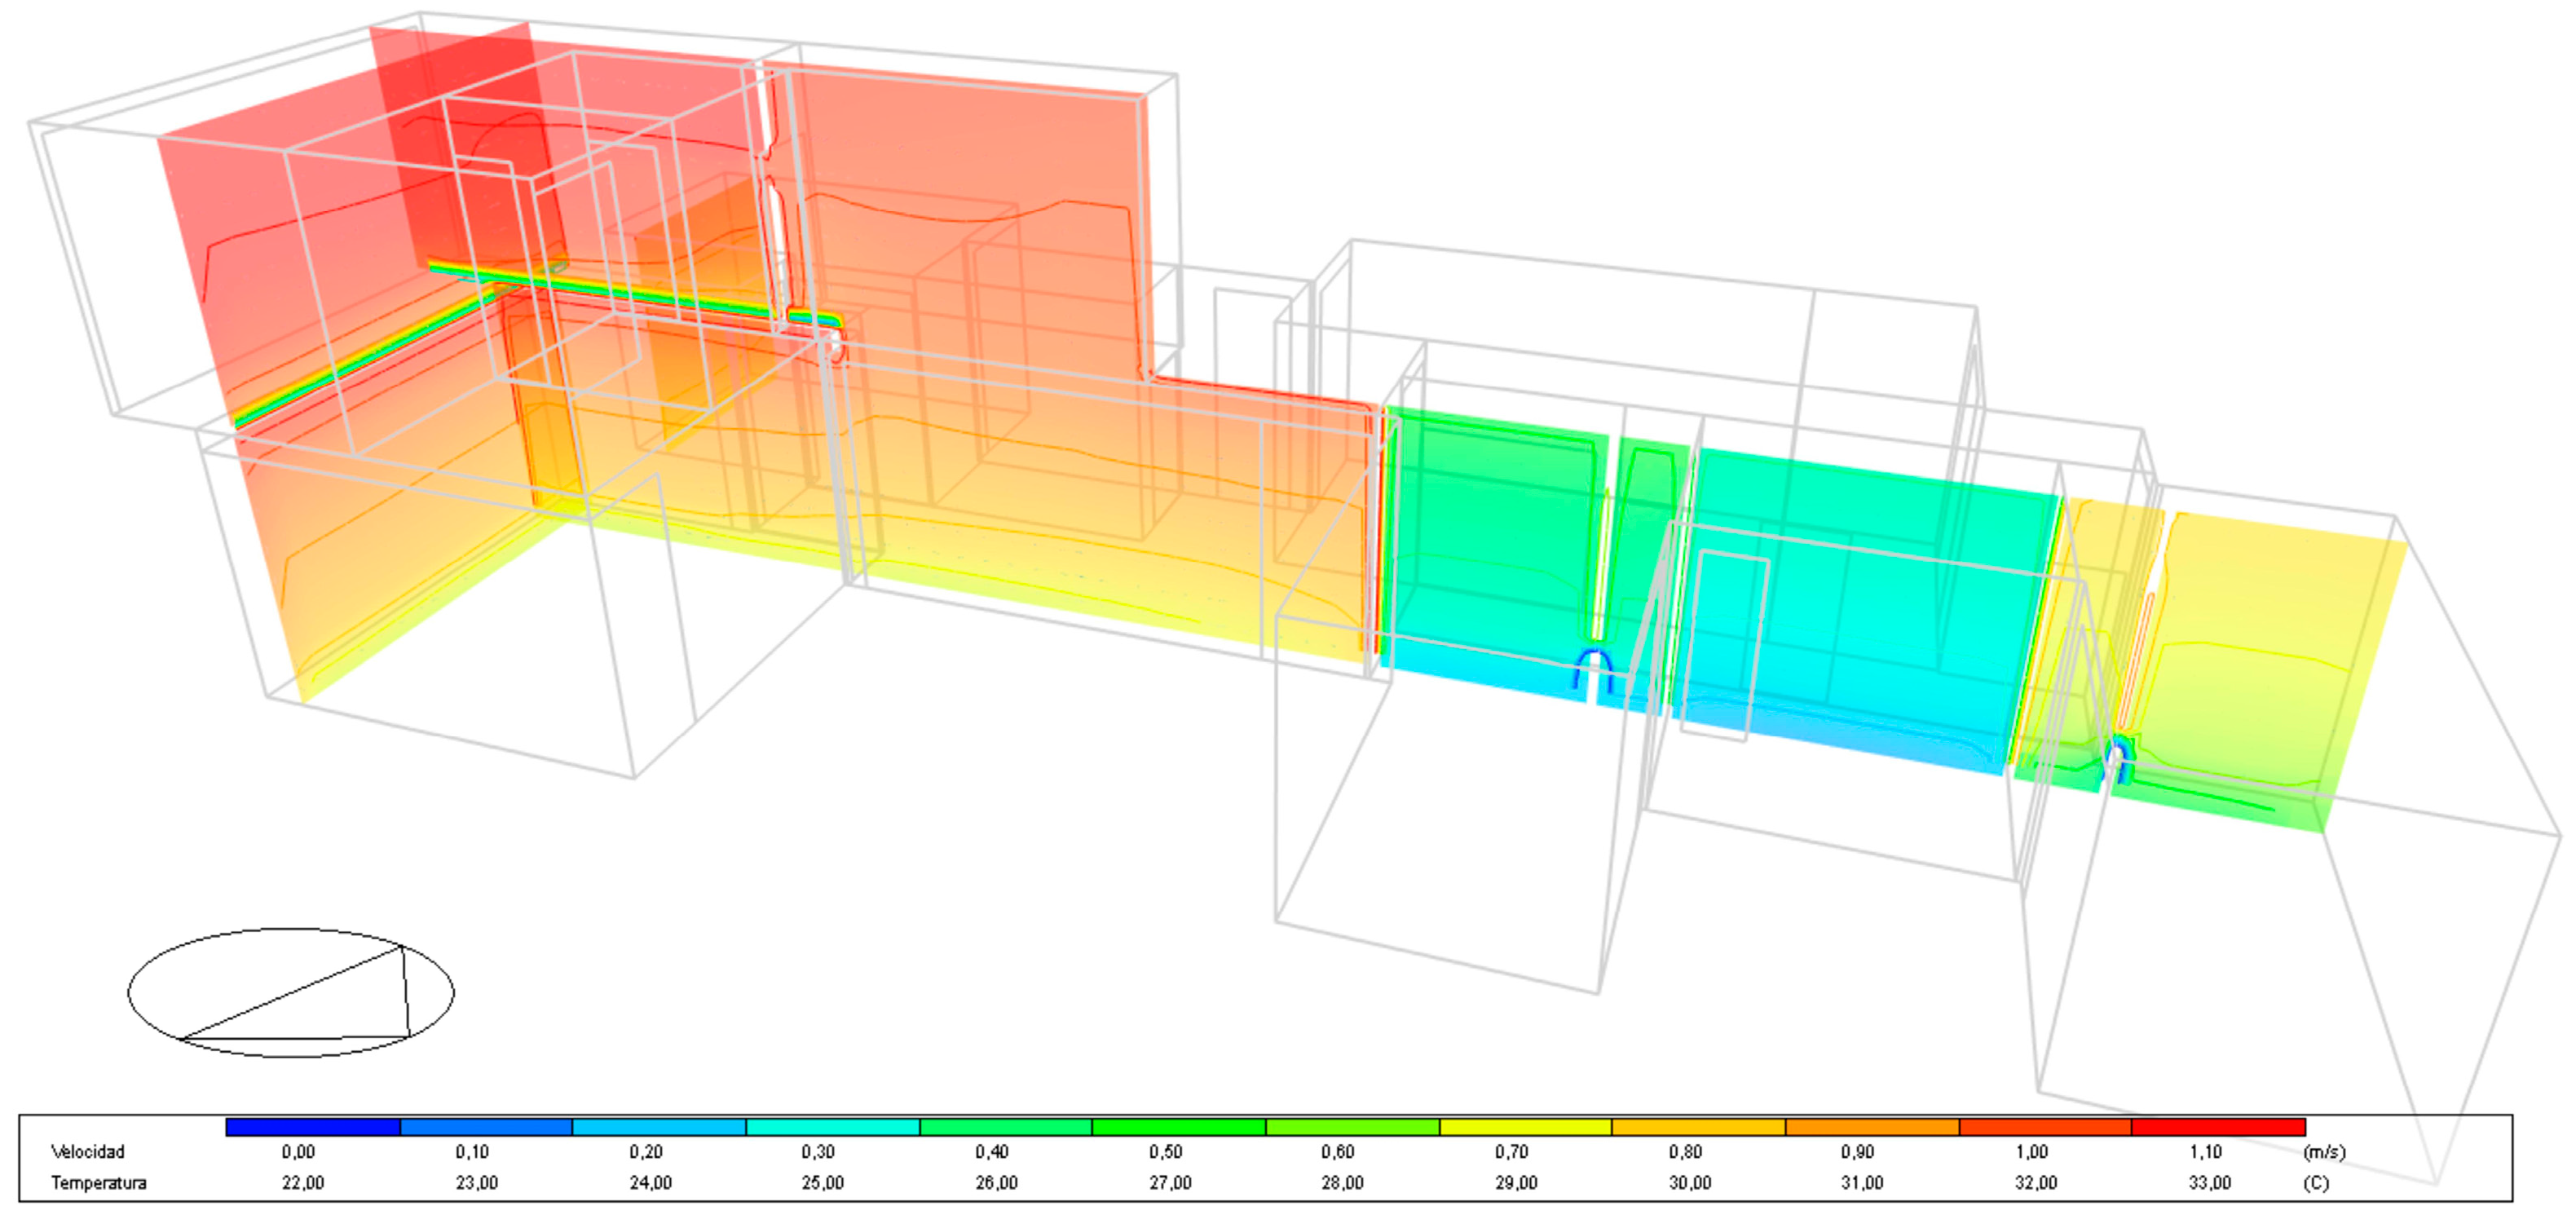
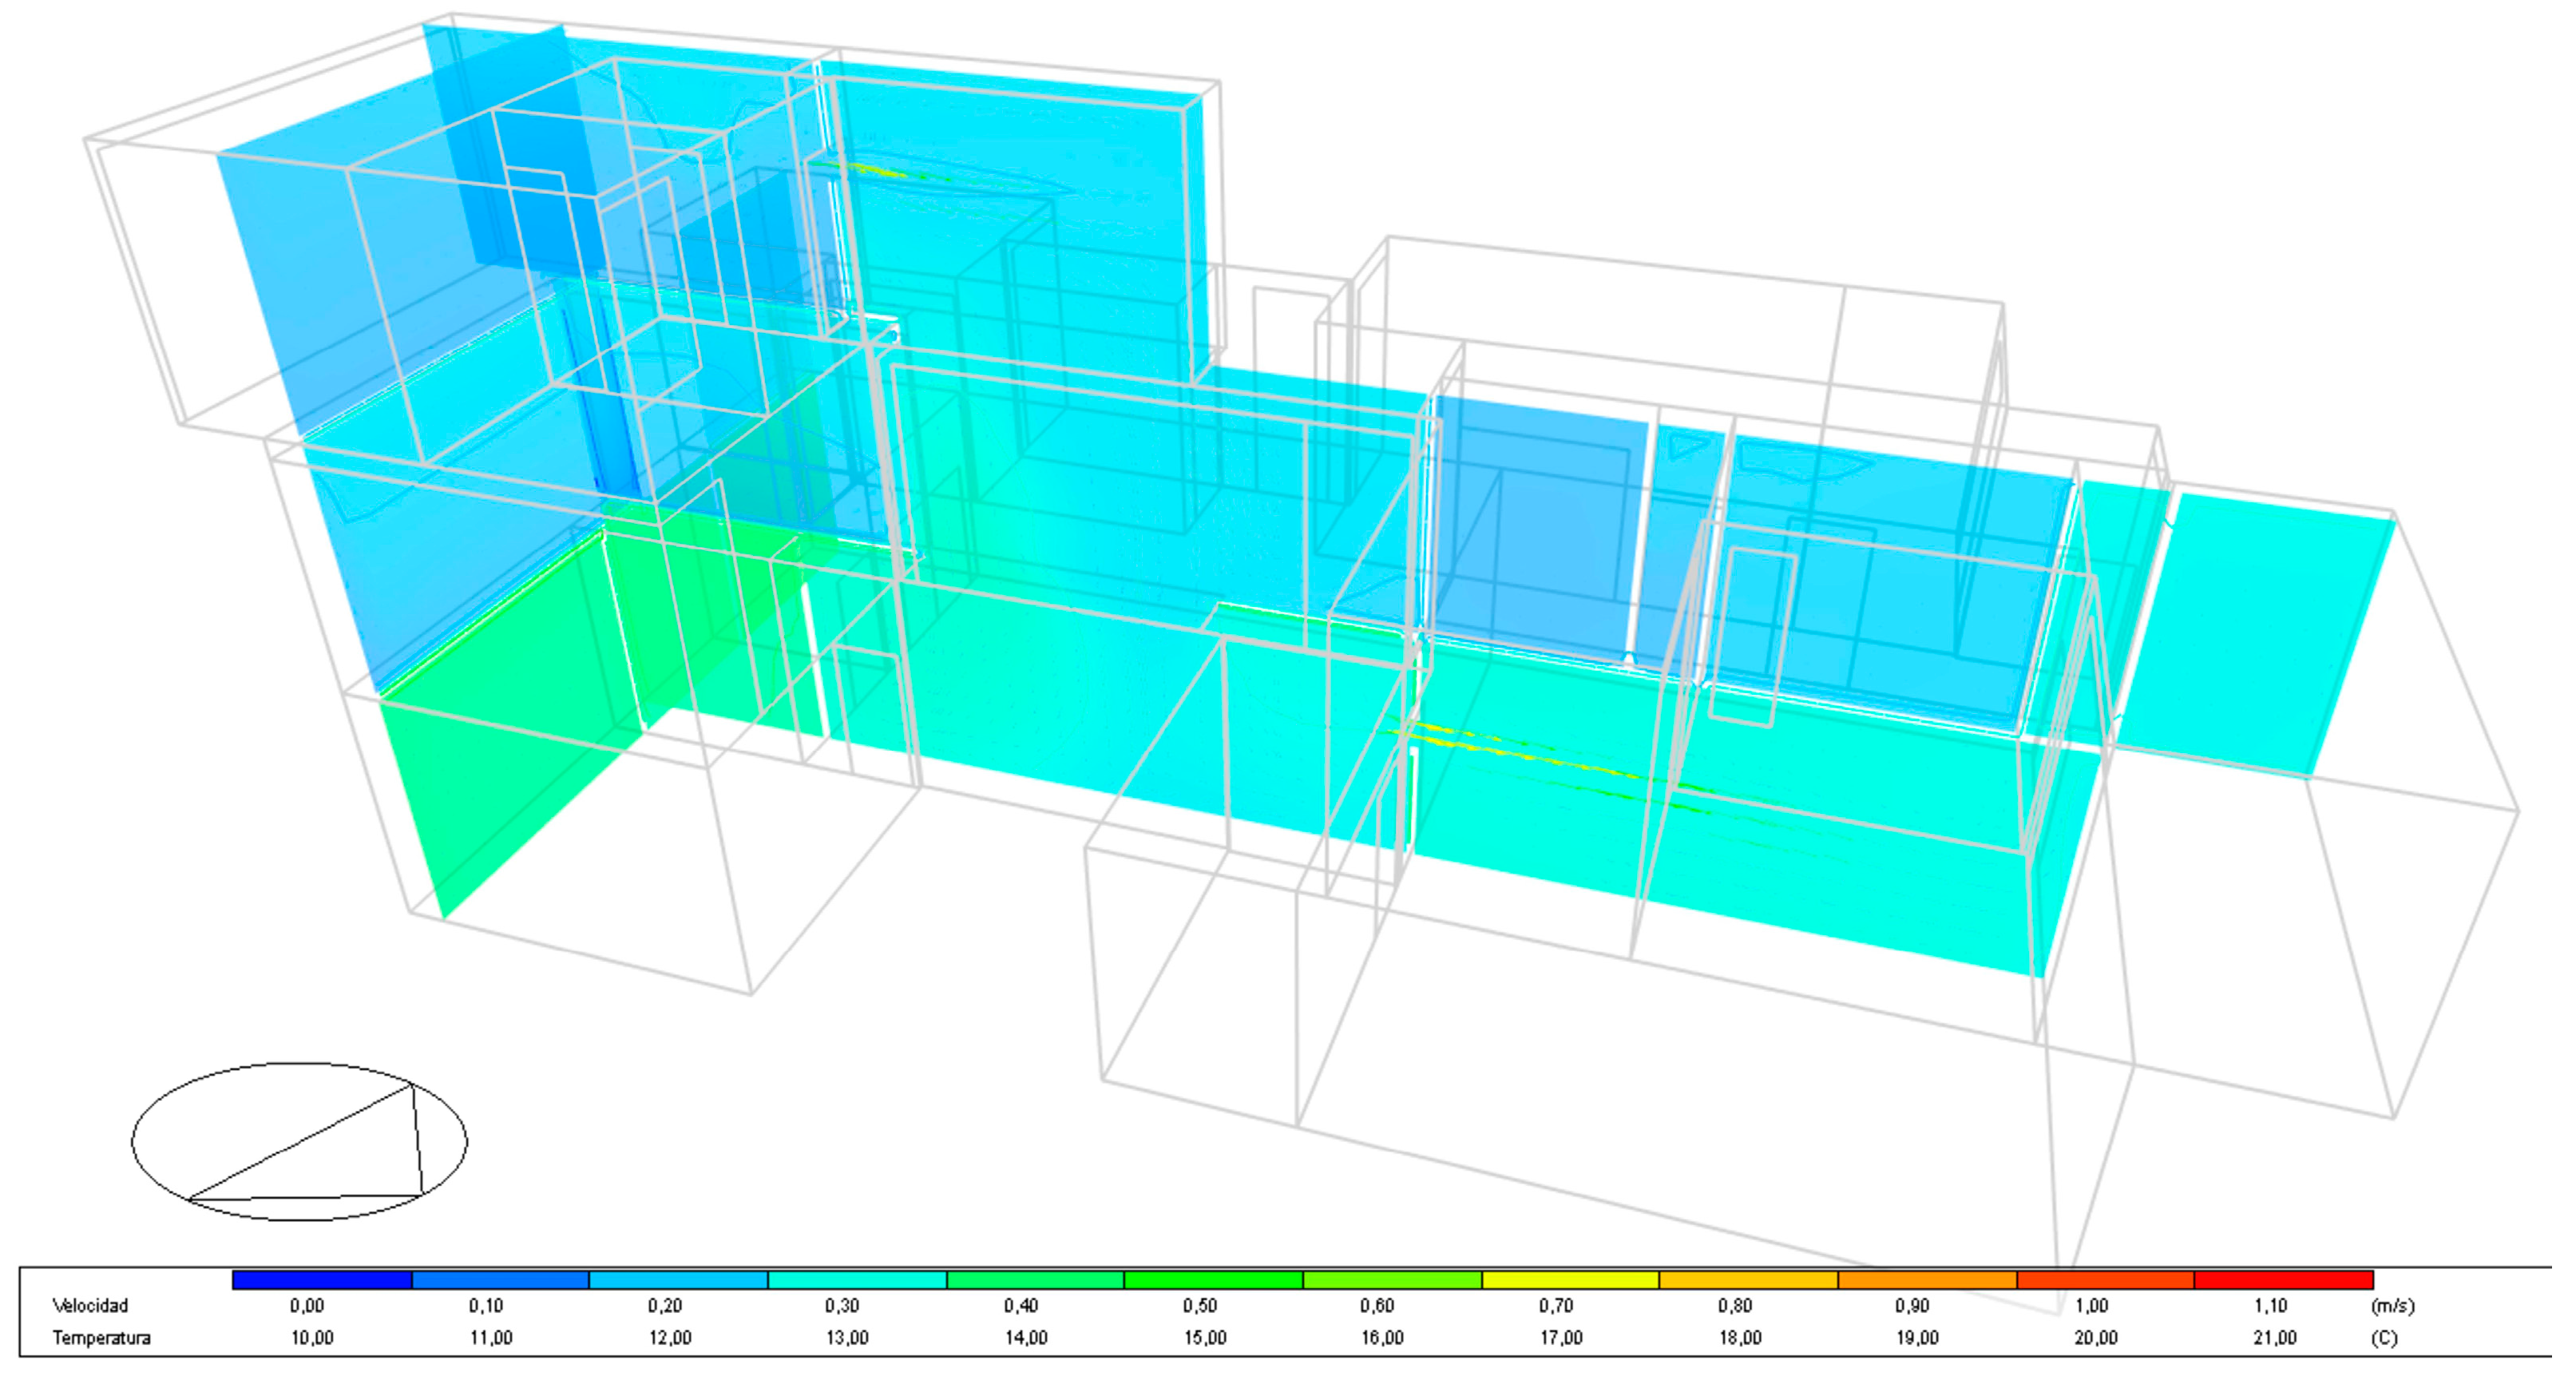
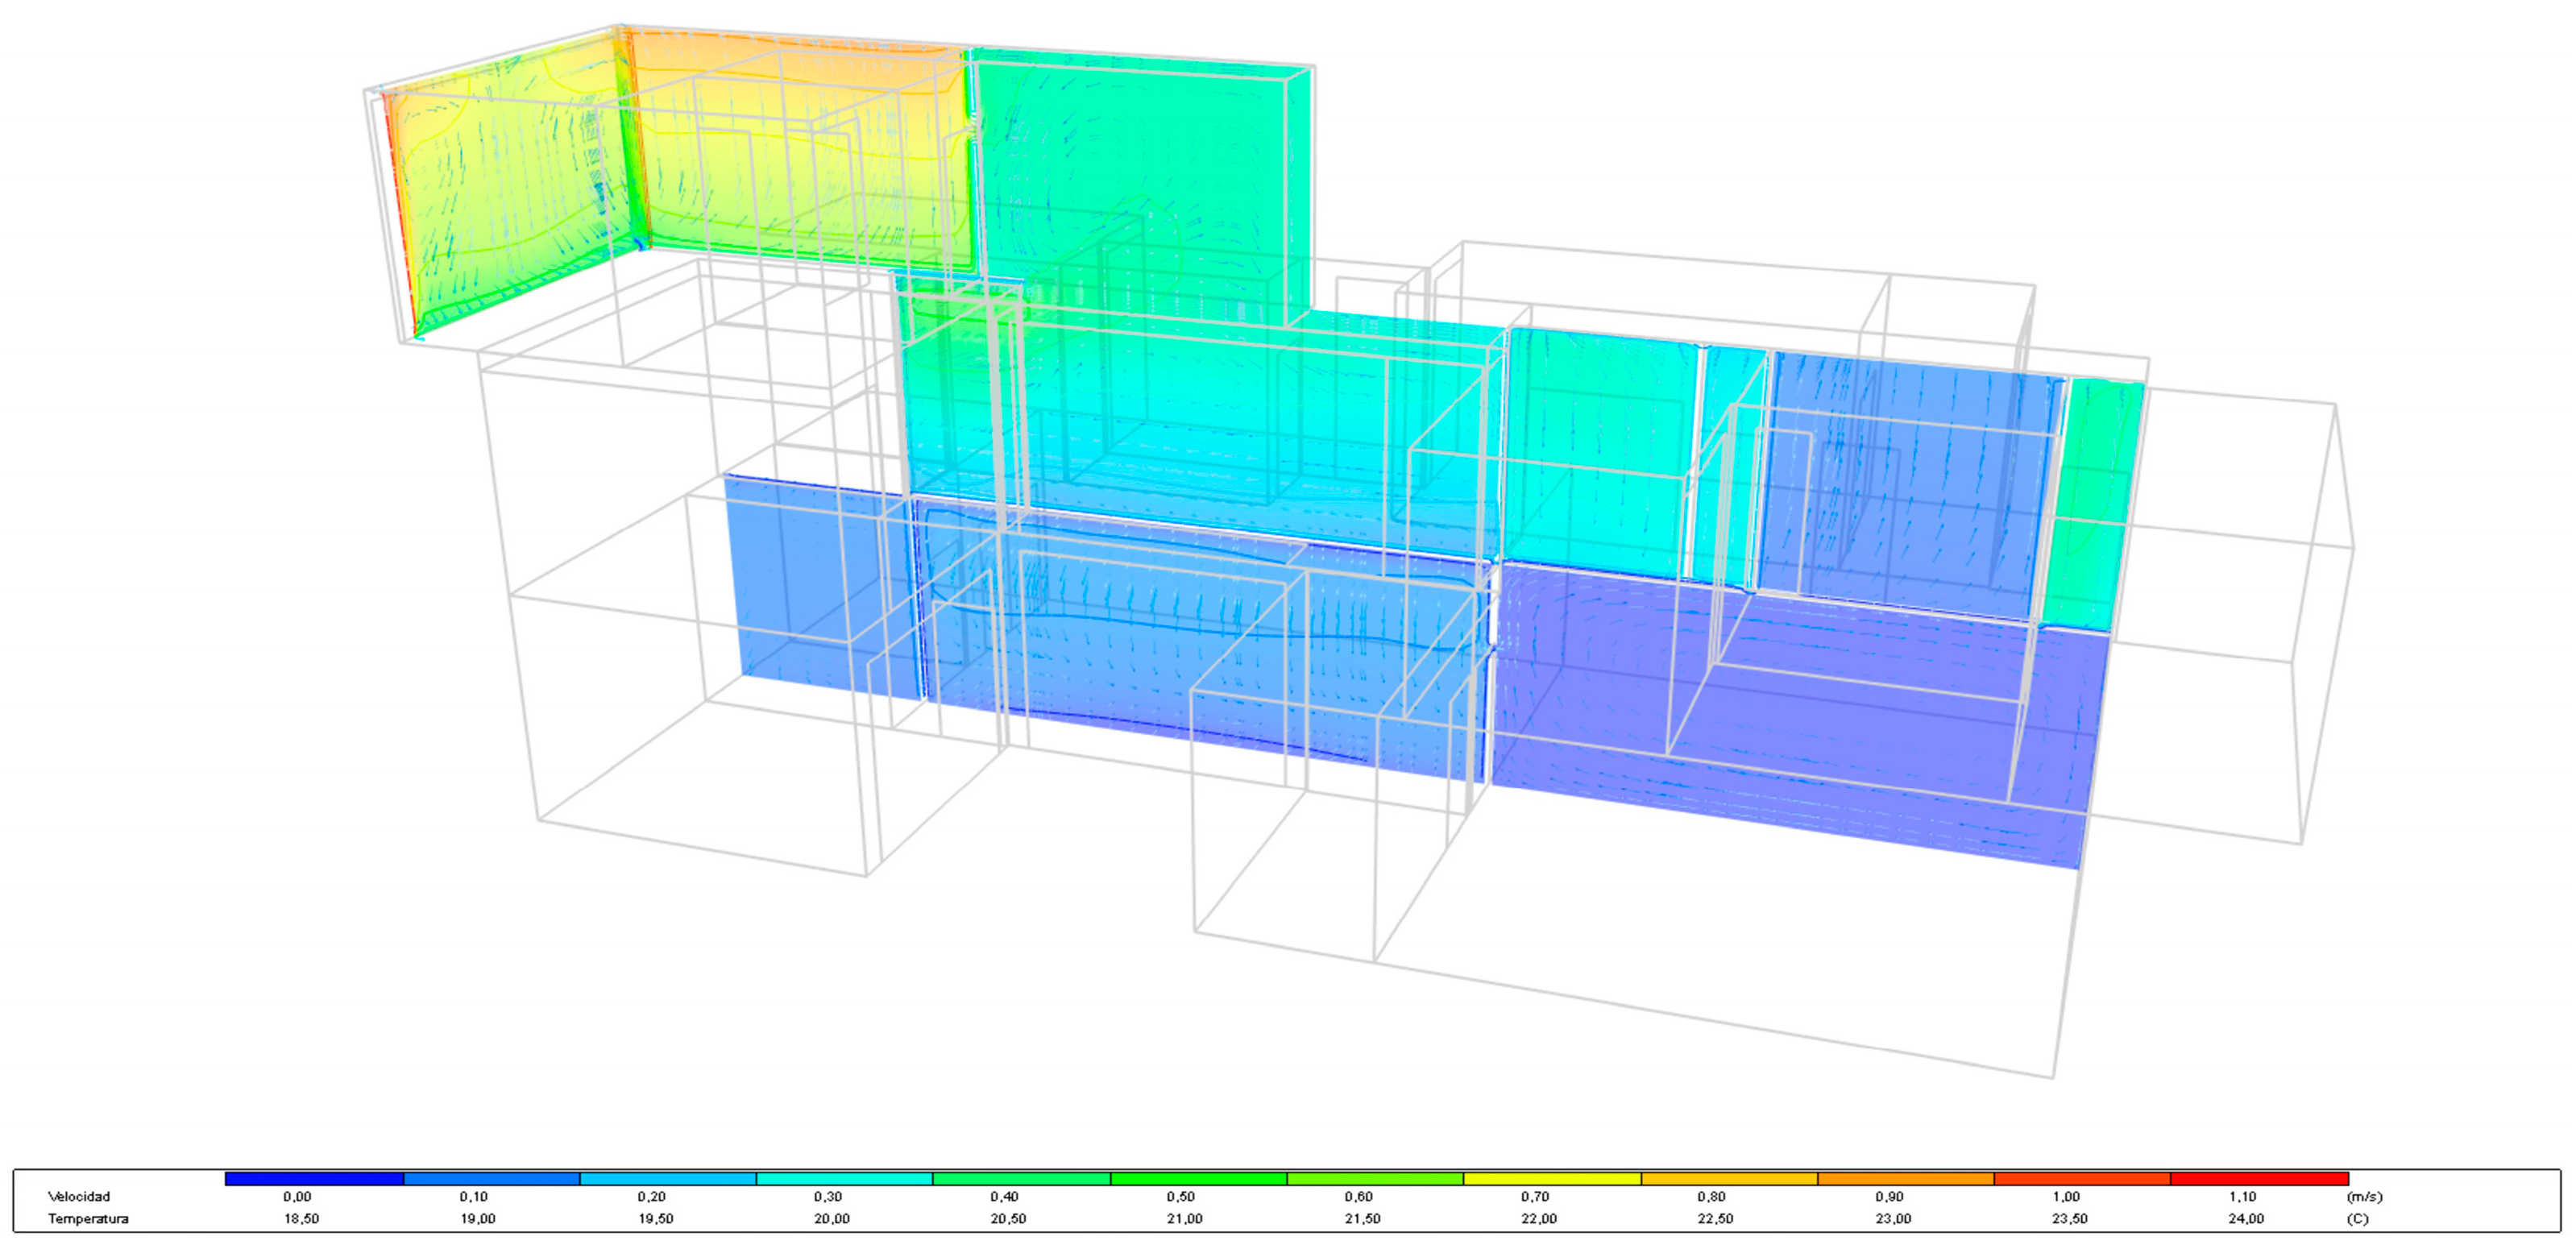
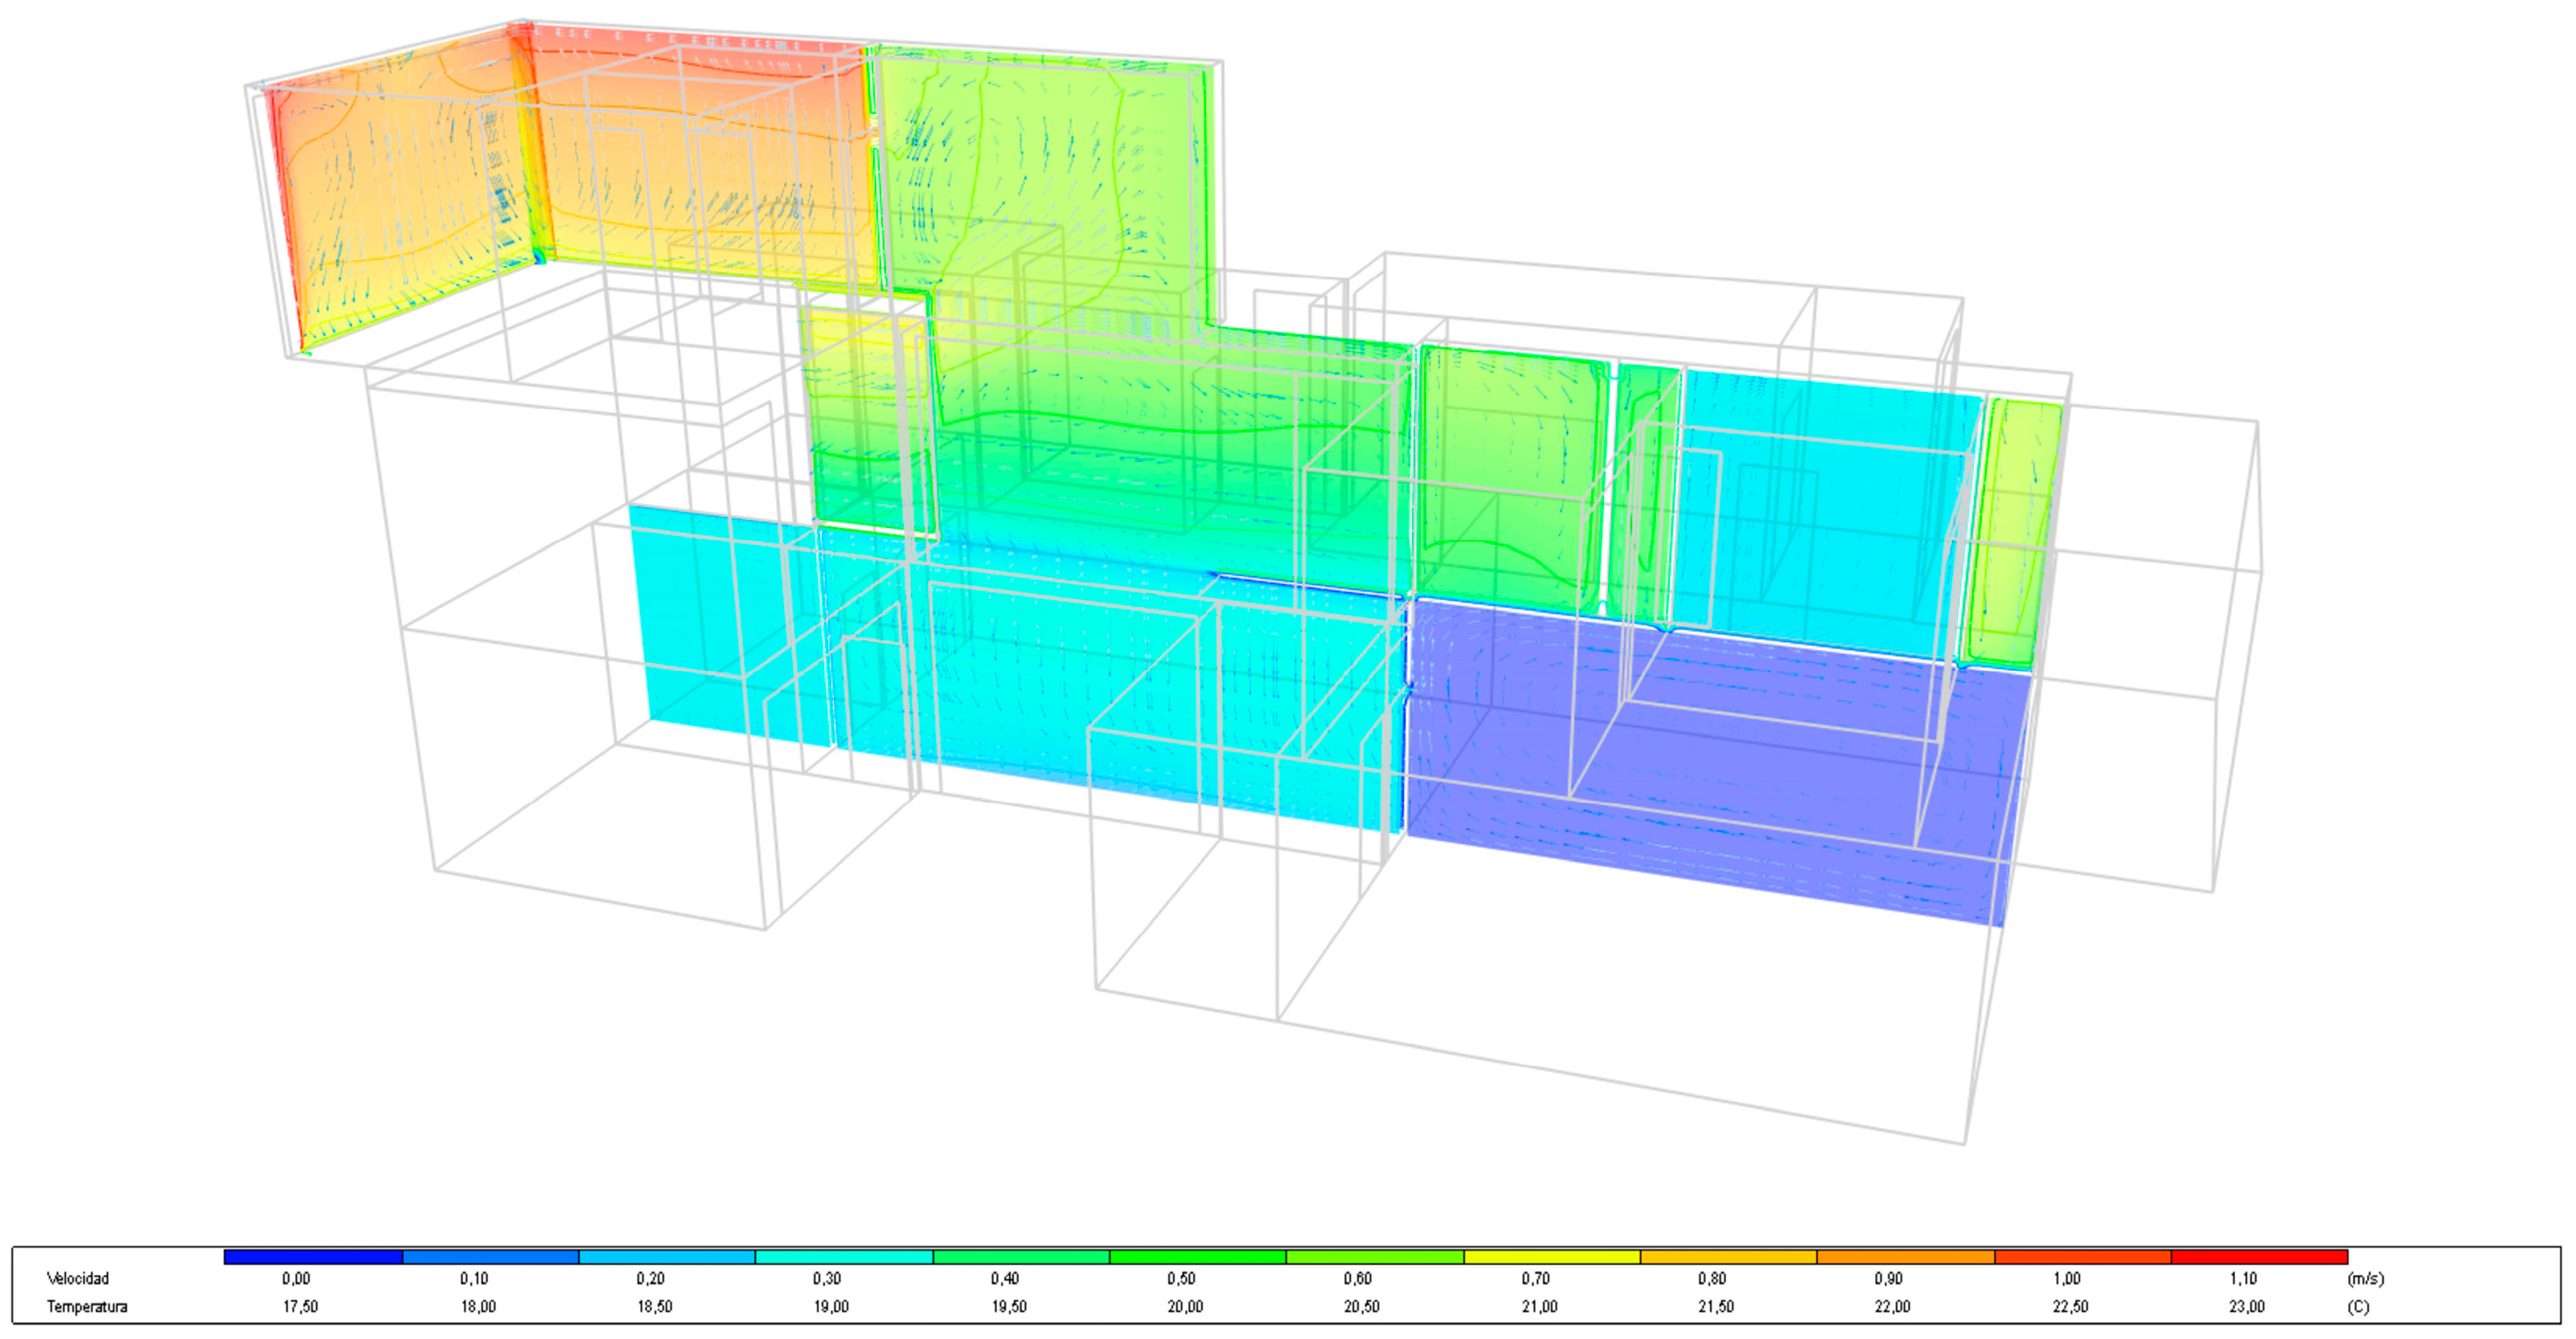
Figure 18, Figure 19 and Figure 20 show temperature gradients produced by different space simulations. In the house with a basement, air temperature reductions of around 3.2 °C were recorded compared to the OP1 solution with no basement. In the case of OP 2, to calculate energy demand with the indicated setpoint temperatures, an all-air conditioning system was adopted, with bathroom air conditioning and distribution of air through ducts. Figure 21, Figure 22 and Figure 23 show temperature gradients produced by different space simulations for OP 3, with TCP panels, in summer and winter.
Obtained results show a reduction of 10.25% of annual energy demand thanks to the introduction of the basement in the housing project, and a reduction of 31.6% in the case of using a radiant wall system in the house based on ATC panels, instead of an all-air system with heat pump, air-conditioner in the bathroom, and air distribution through ducts (Table 4).
To complement these simulations, energy consumptions were also broken down and analysed for (Table 5):
- OP 2.
- All-air installation based on a reversible air-water heat pump system, model 30RH026 from Carrier, with a cooling capacity of 23 kW and a heat capacity of 25.8 kW. Air conditioning in ground floor bathroom, with hot or cold air distribution through ducts throughout the house.
- OP 3.
- Installation of KaRo capillary tube mats, with the same previous heat pump water chiller, distribution of water to the substation located on the ground floor, and distribution of water in the secondary circuit by five independent 20 mm diameter PPR circuits to the whole house, and two fan-coils strategically placed for air dehumidification, with a 3.9 kW cooling capacity.
As illustrated, energy consumption of air distribution in OP 1 is 267% higher than for water distribution, and power consumption is lower for the reasons described in Section 3. Consumption due to dehumidification, with two fan coils, is 4.86 MWh/year in the radiant system, but this disadvantage is counterbalanced by significantly reduced energy consumption of the heat pump in the cooling system (43.8% lower) and in the heating system (36.3% lower).
CO2 emissions have been quantified in the electric mix using the ELCD database, according to which, for the production of 1 electric kWh, 0.41 kgCO2, 0.00122 kgCH4 and 0.0000465 kgN2O are emitted [42,43]. Subsequently, final energy consumption was quantified for the user. Finally, primary energy consumption and CO2 emissions were obtained based on the IDAE factors for 2010, namely 2.21 MWhp/MWhf and 0.27 tCO2eq/MWh.
These simulations, based on the calibration process described above, return a value of annual energy demand, which corresponds to that usually experienced and checked in office building energy consumption. In Central Europe, such energy savings have been shown to account for between 30% and 35% compared to convective systems. In our case study, simulations produced values of annual energy savings of 31.47%. Given that the investment value in the installation system of 135 m2 of KaRo capillary tube mats was 50% higher, we can calculate the investment payback period, as expressed in Table 6, applying a cost of 0.123 €/kWh [44]:
8. Discussion
Previous research shows that when using conditioning systems by radiant surfaces by capillary tube mats in false removable ceilings, annual energy demand of office buildings located in continental climatic zones, can be up to 30% lower, consequently reducing environmental impacts [11,22,24,45]. The most important reasons were explained in Section 3. In these cases, users do not have access to natural ventilation or the possibility of manipulating the system in an individualized way. Furthermore, energy consumption due to the necessary dehumidification through fan-coils represents only 10–20% of total HVAC energy consumption, throughout the cycle of a complete year.
Research on the application of these systems in coastal climates such as the Mediterranean is scarce. The relative humidity of outdoor air often reaches 70%, generating latent thermal loads due to ventilation air and infiltration air of much higher value. It is relevant to quantify the value of these thermal loads, and this must be carefully done to evaluate the system’s energy consumption over a one-year cycle.
The application of these systems of capillary tube mats can be prefabricated thanks to the appearance of large format ceramic sheets. High conductivity of the porcelain stoneware, and its inalterability, make these sheets an ideal material for interior finishings of buildings. Patent P201001626, Ceramic Thermal Conditioning Panel (TCP), allows the system to be prefabricated, reducing construction costs. The application of these TCP panels has recently been studied in a public building, the Museum of the University of Alicante, and energy consumption was quantified at around 23% of annual energy demand [40]. The most important factor was the high degree of air infiltration, coupled with the exaggerated value required by the CTE for indoor air renewal. TCP panels were also placed in an office room at the University of Alicante, where the comfort levels and energy consumption of this TCP radiant system were compared to a similar office room with fan-coil air conditioning.
There is little research done on these PPR capillary tube systems for home use. In this research, simulations using the Design Builder tool, were made where TCP panels were applied in a detached house isolated from the Mediterranean coast, based on the data obtained from the monitoring at the University of Alicante. This house contains a passive system of conditioning through the basement, with the advantage of disposing of phreatic-level waters at a depth of 1.5 m. The stability of basement surface temperatures generated a reduction of indoor air temperature of up to 3.2 °C in summer, and an increase of 3 °C in winter. These conditions led to a 10.25% reduction in annual energy demand. The house worked this way most days of the year, without any active HVAC system. In the case of peak loads, when the home could require an energy supply of air conditioning, the TCP panel system would lead to energy savings of around 31.8%, a significant improvement compared to convective systems.
In future research, we intend to quantify the performance of TCP panels installed at the University of Alicante, in terms of annual energy demand and user comfort, accurately calculating associated environmental impact reduction and investment payback period.
9. Conclusions
Passive conditioning systems using ground temperature damping capacity, based on basement use, are efficient and lead to significant energy savings. It was possible to experiment and evaluate this system’s effects on a detached single-family house on the Mediterranean coast. After collecting data on parameters of temperature, relative humidity, solar radiation, etc., monitoring throughout, and subsequent simulations of thermal and energetic behaviour of the building, a result of an energy saving of 10.25% was obtained. Furthermore, occupant’s comfort, evaluated in terms of energy transfer capacity to surroundings, was almost 80% higher. This bioclimatic technique could be combined with a system of natural air currents in summer, which would rely on the user opening the windows in the basement and on the first floor. In this way, an air conditioning system could be dispensed with in summer, though not during peaks of demand. Winter conditions would not meet the temperatures set by Spanish regulations (CTE), mainly due to the high value of air infiltration in the envelope. For these reasons, this technique was combined with an air conditioning system in two possible scenarios: the first with additional installation of all-air conditioning, and the second using a radiant surface system, based on TCP thermal ceramic wall panels, incorporating PPR capillary tube mats. Large-format porcelain stoneware TCP panels were recently installed in two offices located at the University of Alicante, with satisfactory results. This latter system is more energy-efficient and more comfortable. Annual energy demand was 31.8% lower. Comfort, similarly evaluated as previously, was 45.8% higher for the radiant system in the ground floor living room, and 17% higher in the basement living room. In this scenario, resulting operating temperature To improved compared to convective conditioning systems, although indoor air temperature was around 3 °C higher in summer, and 1.5 °C in winter, with a mean radiant temperature Trm value for summer that was 4.53 °C lower on the ground floor, and 2.03 °C lower on the basement floor, and though in winter, it was 5.72 °C lower on the ground floor, and 3.57 °C lower in the basement.
In addition, this healthier, more environmentally friendly radiant surface air-conditioning system significantly reduces CO2 emissions during the building’s phase of use, at more than 33,700 kg per year in the studied house. The combination of the TCP panel system with the basement bioclimatic technique is perfectly compatible, since it takes advantage of the initial reduction of 16.50% in energy demand in summer without reducing the levels of occupant comfort sensation. Managing the interior opening of the communication staircase between the basement and ground floor, and opening or closing windows, to generate healthy air currents, is compatible with the slight increase of interior air temperature, since the Trm is low enough to maintain adequate To. Worthy of note is that occupant’s feeling of comfort is far greater, and this air conditioning system is the most valued one in the office building market. In this research, the system was applied to housing conditions in the Mediterranean, with excellent results.
Investment in capillary mat system installation, which requires a complex substation to control the system’s secondary circuits, in addition to the cost of the TCP panels, could be amortised over a reasonable period of time, when compared to a chiller heat pump based all-air system with conditioning and duct distribution in the home. In the case of the house under study, the €14,226 surcharge would be amortised over 19.22 years, with a decrease in energy demand of 6020 kWh/year and a saving of €740 per year, with a cost of €0.1230/kWh in the electric mix.
Acknowledgments
This research was funded by the project “Generation of knowledge on the multisensory interaction of the human being with the environments for the development of new products and services in the ceramic sector (4 SENSES)”, reference PSE-020400-2007-1, of the Ministry of Science and Innovation (Spain), of the Single Strategic Plan (2007–2009). The research was also funded by the CDTI project of the Ministry of Economy, Industry and Competitiveness (Spain), entitled “Research and design of constructive solutions to improve the energy efficiency of buildings”, and reference IDI-20110240, requested by the company ECISA Compañía General de Construcciones S.A. (2011–2013).
Conflicts of Interest
The authors declare no conflict of interest.
References
- CTE. Código Técnico de la Edificación. R/D 314/2006, de 17 de Marzo. Available online: http://www.codigotecnico.org/images/stories/pdf/realDecreto/RD3142006.pdf (accessed on 9 September 2017).
- HULC. Herramienta Unificada Lider-Calener. Orden FOM/1635/2013, de 10 de Septiembre (BOE de 12 de Septiembre), por la Que Se Actualiza el Documento Básico DB HE «Ahorro de Energía», del CTE. Available online: https://www.codigotecnico.org/index.php/menu-recursos/menu-aplicaciones/282-herramienta-unificada-lider-calener.html (accessed on 9 September 2017).
- Bedoya, C.; Neila, J. Técnicas Arquitectónicas Y Constructivas de Acondicionamiento Ambiental; Ediciones Munilla-Lería: Madrid, Spain, 1997. [Google Scholar]
- Monge-Barrio, A.; Sánchez-Ostiz, A. Energy efficiency and thermal behaviour of attached sunspaces in the residential architecture in Spain. Summer Conditions. Energy Build. 2015, 108, 244–256. [Google Scholar] [CrossRef]
- García-Romero, A.; Diarce, G. Phase Change Materials, PCMs, for Thermal Energy Storage and their Use in Buildings. In Arquitectura Ecoeficiente; Hernández, R., Irulegui, O., Aranjuelo, M., Eds.; Servicio Editorial de la UPV/EHU: San Sebastián, Spain, 2012; Volume 1, Chapter 2; pp. 129–146. [Google Scholar]
- Sendra, J.J.; Domínguez-Amarillo, S.; Bustamante Rojas, P.; León, A.L. Energy Intervention in the residential sector in the south of Spain: Current challenges. Informes de la Construcción 2013, 65, 457–464. [Google Scholar] [CrossRef]
- Imanari, T.; Omori, T.; Bogaki, K. Thermal comfort and energy consumption of the radiant ceiling panel system: Comparison with the conventional all-airsystem. Energy Build. 1999, 30, 167–175. [Google Scholar] [CrossRef]
- Holmes, M.J.; Hacker, J.N. Climate change, thermal comfort and energy: Meeting the design challenges of the 21st century. Energy Build. 2007, 39, 802–814. [Google Scholar] [CrossRef]
- Simulaciones, Y.; Proyectos, S.L. Estudio de Viabilidad de los Sistemas: Climatización Invisible Uponor Y Sistema Convencional Mediante Fancoils; Uponor: Madrid, Spain, 2014; Available online: https://www.uponor.es/documentaci%C3%B3n/resultados-de-la-b%C3%BAsqueda.aspx?txt=Estudio%20de%20Viabilidad%20de%20los%20Sistemas:%20Climatizaci%C3%B3n%20Invisible%20Uponor%20&typ=1&cat=downloadcenter (accessed on 9 September 2017).
- Climate WellTM 10. Design Guidelines. Available online: http://www.solarcombiplus.eu/docs/SolarCombi_ClimateWell_trainingmaterial5.pdf (accessed on 12 July 2017).
- Stetiu, C. Energy and peak power savings potential of radiant cooling systems in US commercial buildings. Energy Build. 1999, 30, 127–138. [Google Scholar] [CrossRef]
- Beka. Capillary Tube Systems. Product Data Sheets. Technical Information G0; Beka Heiz-und Külmatten: Berlín, Germany, 2008. [Google Scholar]
- Echarri, V.; Oviedo, E.; Lázaro, V. Panel de Acondicionamiento Térmico Cerámico. Patent P201001626, 28 December 2010. [Google Scholar]
- Dynamobel. Manual de Climatización Tranquila. Manual Técnico. Tramas Karo. Available online: http://www.dynamobel.com/Productos/descargas/INSTALACIONES/CLIMATIZACION/manual%20tecnico%20climatizacion.pdf (accessed on 7 July 2017).
- Echarri Iribarren, V.; Espinosa Fernández, A.; Galiano Garrogós, A. Energy efficiency on flooded roofs: The University of Alicante Museum. WIT Trans. Eng. Sci. 2016, 106, 163–176. [Google Scholar]
- De Dear, R.J.; Akimoto, T.; Arens, E.A.; Brager, G.; Candido, C.; Cheonq, K.W.; Li, B.; Nishihara, N.; Sekhar, S.C.; Tanabe, S.; et al. Progress in thermal comfort research over the last twenty years. Indoor Air 2013, 23, 442–461. [Google Scholar] [CrossRef] [PubMed]
- Halawaa, E.; van Hoof, J. The adaptive approach to thermal comfort: A critical overview. Energy Build. 2012, 51, 101–110. [Google Scholar] [CrossRef]
- American Society of Heating, Refrigeration and Air Conditioning Engineers. Handbook of Fundamentals; ASHRAE: Atlanta, GA, USA, 2010. [Google Scholar]
- Fanger, O.P. Thermal Comfort. Analysis and Applications in Environmental Engineering; McGraw-Hill Book Company: New York, NY, USA, 1970. [Google Scholar]
- Ortega, M.; Ortega, A. Calefacción Y Refrescamiento por Superficies Radiantes; Paraninfo, S.A./Thomson Learning: Madrid, Spain, 2001. [Google Scholar]
- Miriel, J.; Serres, L.; Trombe, A. Radiant ceiling panel heating-cooling systems: Experimental and simulated study of the performances, thermal comfort and energy consumptions. Appl. Therm. Eng. 2002, 22, 1861–1873. [Google Scholar] [CrossRef]
- Khan, Y.; Khare, V.R.; Mathur, J.; Bhandari, M. Performance evaluation of radiant cooling system integrated with air system under different operational strategies. Energy Build. 2015, 97, 118–128. [Google Scholar] [CrossRef]
- Lan, L.; Wargocki, P.; Lian, Z. Quantitative measurement of productivity loss due to thermal discomfort. Energy Build. 2011, 43, 1057–1062. [Google Scholar] [CrossRef]
- Feng, J.; Bauman, F.; Schiavon, S. Experimental comparison of zone cooling load between radiant and air systems. Energy Build. 2014, 84, 152–159. [Google Scholar] [CrossRef]
- Wang, S.; Chen, Y. A simple procedure for calculating thermal response factors and conduction transfer functions of multilayer walls. Appl. Therm. Eng. 2020, 22, 333–338. [Google Scholar] [CrossRef]
- ISO 13786:2007. Thermal Performance of Building Components. Dynamic Thermal Characteristics. Calculation Methods. Available online: https://www.iso.org/standard/40892.html (accessed on 9 September 2017).
- Zamora, M. Proyecto Geocool: Empleo de Bombas de Calor Acopladas a Intercambiadores Geotérmicos. Available online: http://blog.energesis.es/wp-content/uploads/2008_03_ENERGETICA_XXI_.pdf (accessed on 9 September 2017).
- Shu, H.; Duanmu, L.; Xiangli, L.; Zhu, Y. Quasi-dynamic energy-saving judgment of electric-driven seawater source heat pump district heating system over boiler house district heating system. Energy Build. 2010, 42, 889–895. [Google Scholar]
- Zhang, L.; Hu, S. Research on the heat pump system using seawater as heat source or sink. Build. Energy Environ. 2006, 25, 34–38. [Google Scholar]
- Kavanaugh, S.P.; Rafferty, K. Ground-Source Heat Pump: Design of Geothermal Systems for Commercial and Institutional Buildings; ASHRAE Inc.: Atlanta, GA, USA, 1997. [Google Scholar]
- Dodoo, A.; Gustavsson, L.; Sathre, R. Primary energy implications of ventilation heat recovery in residential buildings. Energy Build. 2011, 34, 1566–1572. [Google Scholar] [CrossRef]
- Kosonen, R.; Saarinen, P.; Koskela, H.; Hole, A. Impact of heat load location and strength on air flow pattern with a passive chilled beam system. Energy Build. 2010, 42, 34–42. [Google Scholar] [CrossRef]
- Fredriksen, J.; Sandberg, M.; Moshfegh, A. Experimental investigation of the velocity field and airflow pattern generated by cooling ceiling beams. Build. Environ. 2001, 36, 891–899. [Google Scholar] [CrossRef]
- Tay, N.H.S.; Belusko, M.; Bruno, F. Designing a PCM storage system using the effectiveness-number of transfer units method in low energy cooling of buildings. Energy Build. 2012, 50, 234–242. [Google Scholar] [CrossRef]
- Hui, S.C.M.; Leung, J.Y.C. Thermal comfort and energy performance of chilled ceiling systems. In Proceedings of the Fujian-Hong Kong Joint Symposium, Fuzhou, China, 29–30 June 2012; pp. 36–48. [Google Scholar]
- Peel, M.C.; Finlayson, B.L.; McMahon, T.A. Updated world map of the Köppen-Geiger climate classification. Hydrol. Earth Syst. Sci. 2007, 11, 1633–1644. [Google Scholar] [CrossRef]
- IDAE. Consumos del Sector Residencial en España. Resumen de Información Básica. 2010–2011. Available online: http://www.idae.es/uploads/documentos/documentos_Documentacion_Basica_Residencial_Unido_c93da537.pdf (accessed on 13 July 2017).
- Dong, M.-N.; Lu, Z.; Mo, T.-Z.; Yang, J.-Y.; Leng, Y.-F.; Yang, L.-L. Quantitative analysis on the effect of thermal bridges on energy consumption of residential buildings in hot summer and cold winter region. J. Chongqing Jianzhu Univ. 2008, 30, 5–8. [Google Scholar]
- Echarri, V.; Galiano, A.; Pérez, M.I.; González, A.B. Conditioning systems by radiant surfaces: Comparative analysis of thermal ceramic panels versus the conventional systems in a museum. WIT Trans. Eng. Sci. 2014, 83, 287–301. [Google Scholar]
- Echarri Iribarren, V.; Galiano Garrigós, A.L.; González Avilés, A.B. Ceramics and healthy heating and cooling systems: Thermal ceramic panels in buildings. Conditions of comfort and energy demand versus convective systems. Inf. Constr. 2016, 68, 19–32. [Google Scholar]
- Domínguez, S.; Sendra, J.J.; León, A.; Esquivias, P. Towards Energy Demand Reduction in Social Housing Buildings: Envelope System Optimization Strategies. Energies 2012, 5, 2263–2287. [Google Scholar] [CrossRef]
- Oregi, X.; Hernández, P.; Gazulla, C.; Isasa, M. Integrating Simplified and Full Life Cycle Approaches in Decisión Making for Building Energy Refurbishment: Benefits & Barriers. Buildings 2015, 5, 354–380. [Google Scholar]
- ELCD Database. Available online: http://eplca.jrc.ec.europa.eu/ELCD3/datasetDownload.xhtml;jsessionid=E53923612E54E0BC82690F0919F349B6 (accessed on 12 July 2017).
- IDAE. Informe de Precios Energéticos Regulados. 2017. Available online: http://www.idae.es/sites/default/files/estudios_informes_y_estadisticas/tarifas_reguladas_julio_2017.pdf (accessed on 23 July 2017).
- Sodec, F. Economic viability of cooling ceiling systems. Energy Build. 1999, 30, 195–201. [Google Scholar] [CrossRef]
Figure 1.
Patent application No. P201001626. Ceramic thermal conditioning panel.

Figure 2.
(a) Distribution management substation; and (b) Thermal ceramic panels (TCP) applied in the UA office.
Figure 2.
(a) Distribution management substation; and (b) Thermal ceramic panels (TCP) applied in the UA office.

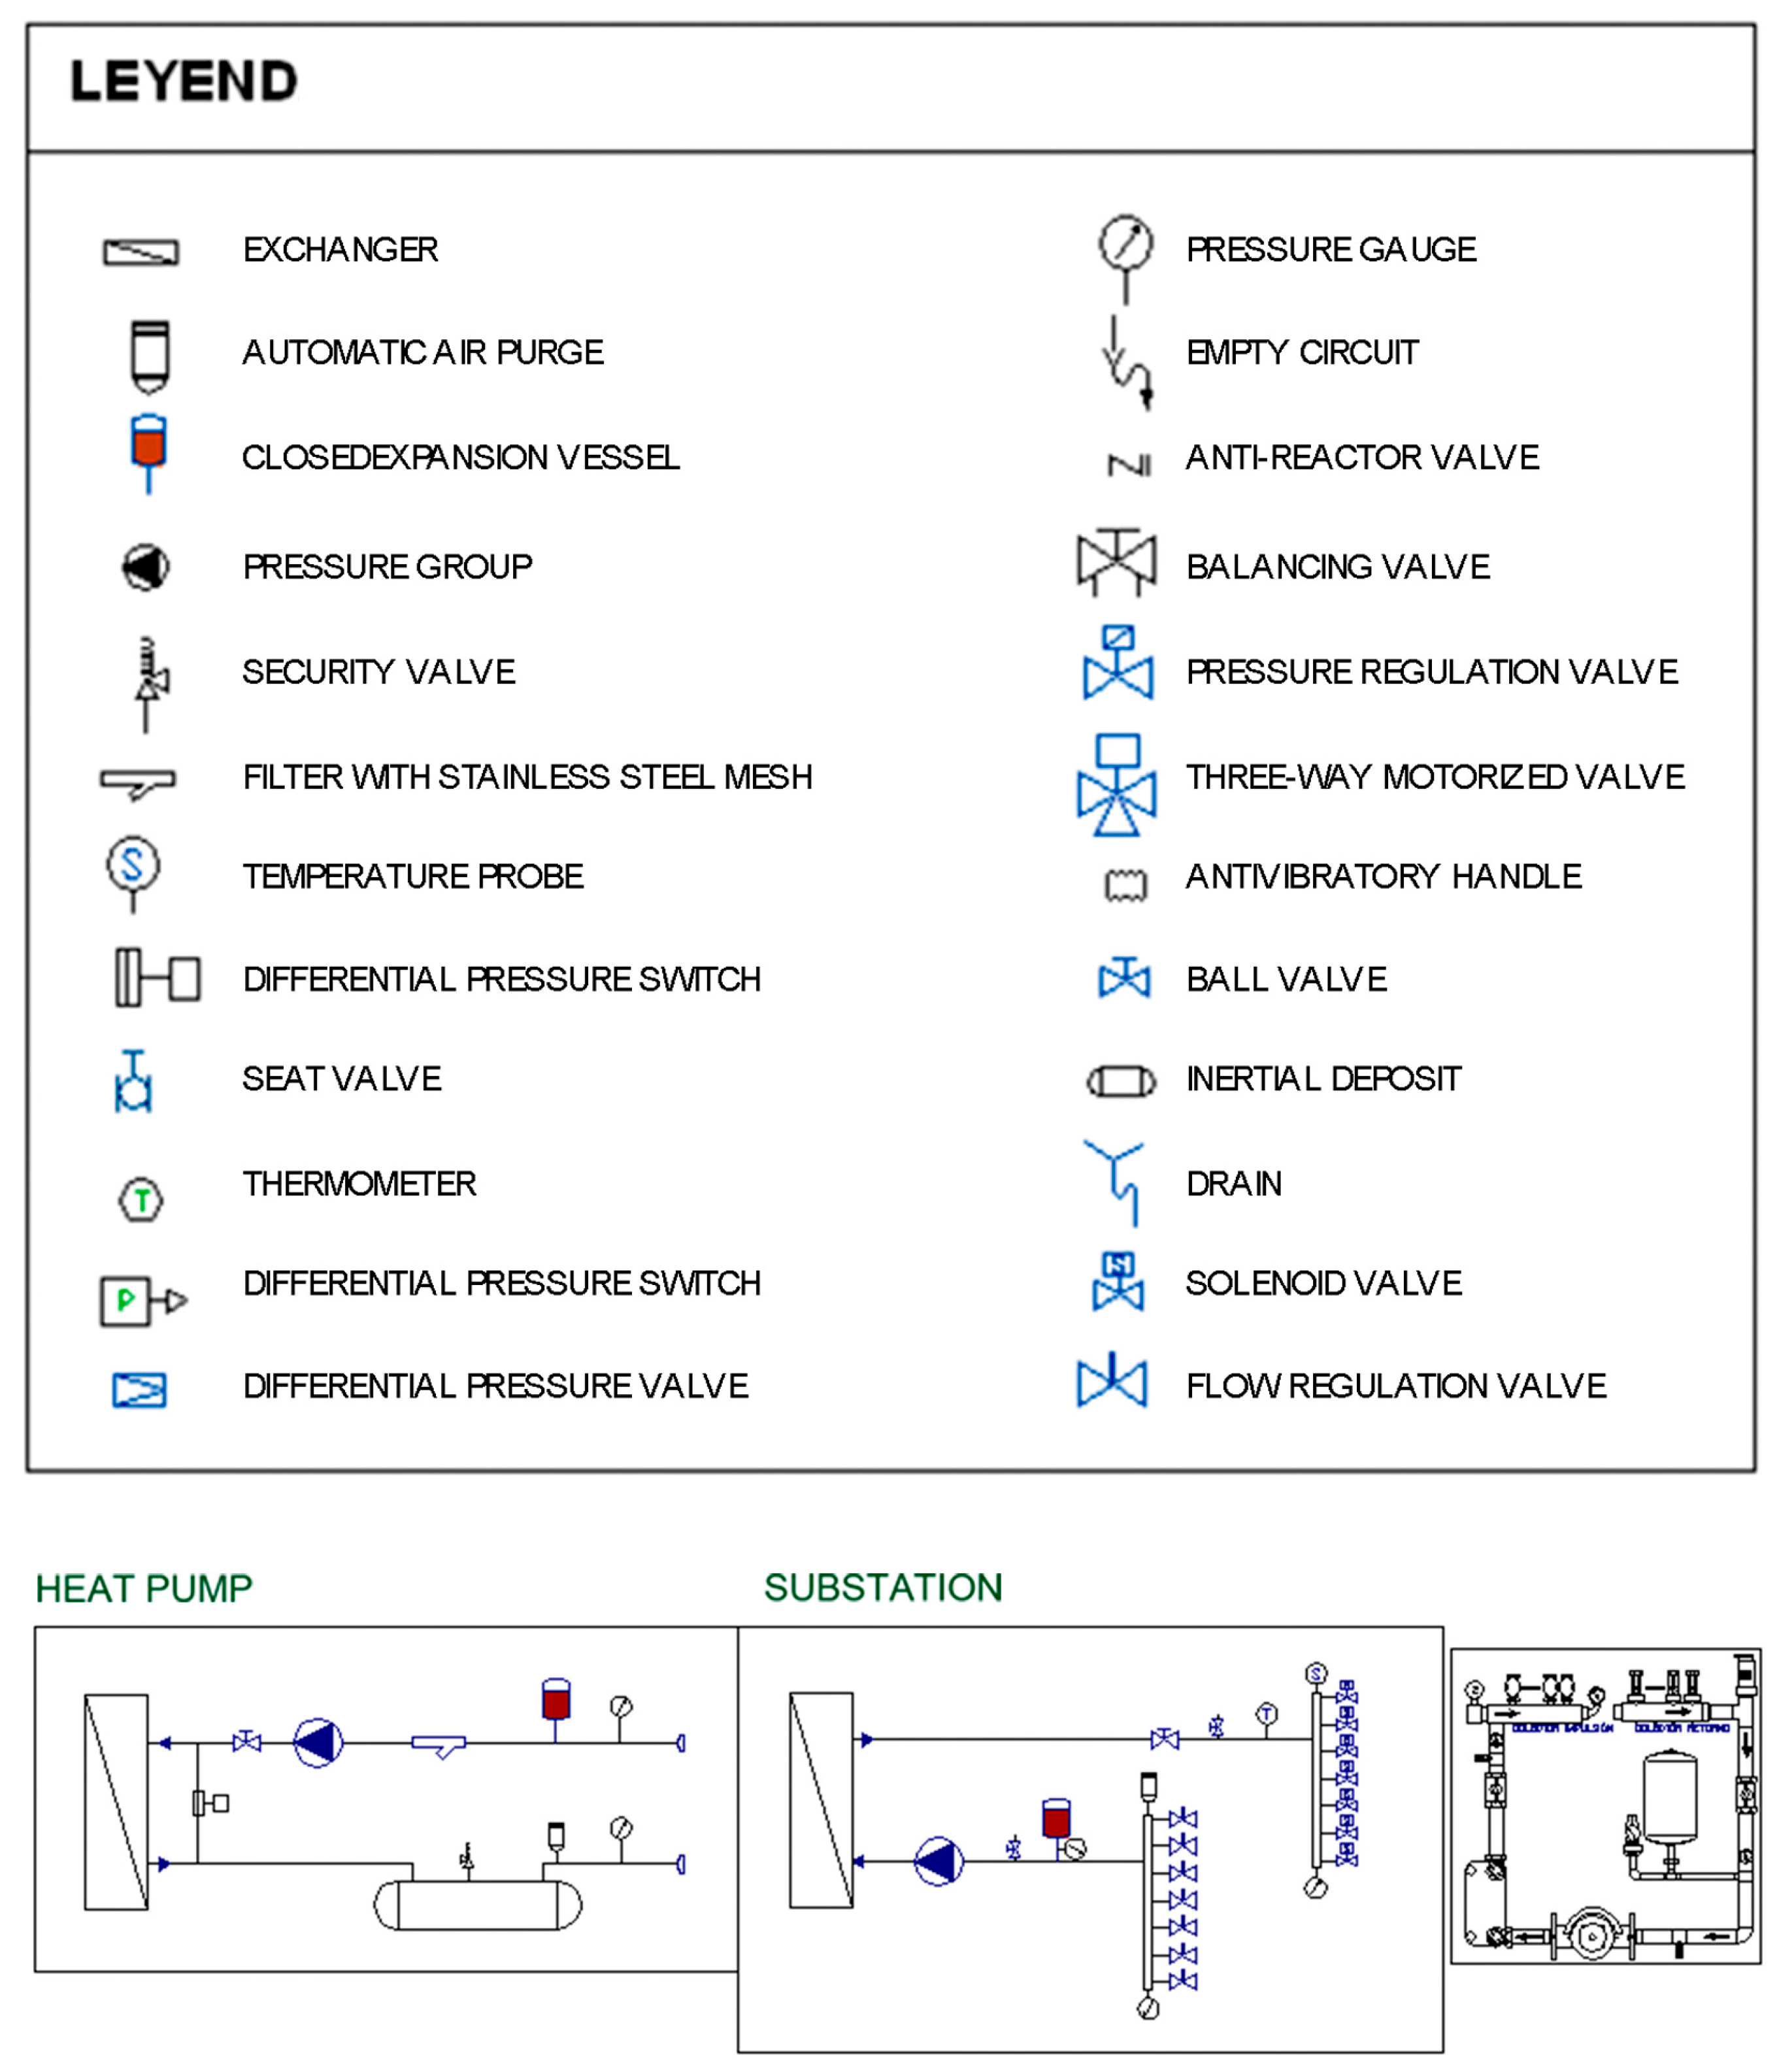
Figure 3.
Installation schematic diagram of two pipes with substations and renewable energies.

Figure 4.
View of the house. Northeast access facade. Albufereta beach, Alicante.

Figure 5.
View of the house. South facade. Albufereta beach, Alicante.

Figure 6.
(a) Basement; (b) ground floor; and (c) first floor of the house. Thermal ceramic panels (TCP) placed on the walls for the simulation process are marked in red.
Figure 6.
(a) Basement; (b) ground floor; and (c) first floor of the house. Thermal ceramic panels (TCP) placed on the walls for the simulation process are marked in red.

Figure 7.
Longitudinal section through the courtyard.

Figure 8.
Principles of installation of capillary tube mats.

Figure 9.
Principles of hydronic installation of capillary tube mats.

Figure 10.
(a) Analyser and basement sensors; and (b) roof pyranometer.

Figure 11.
Analyser and sensors in the basement. Wireless system.

Figure 12.
Parameters of outdoor and indoor air in a week in summer. X-axis is marked every 3 h during the week. Left Y-axis signals the values of temperature in °C. Right Y-axis indicates the values of relative humidity in percentage.
Figure 12.
Parameters of outdoor and indoor air in a week in summer. X-axis is marked every 3 h during the week. Left Y-axis signals the values of temperature in °C. Right Y-axis indicates the values of relative humidity in percentage.

Figure 13.
Parameters of outdoor and indoor air in a week in winter. X-axis is marked every 3 h during the week. Left Y-axis signals the values of temperature in °C. Right Y-axis indicates the values of relative humidity in percentage.
Figure 13.
Parameters of outdoor and indoor air in a week in winter. X-axis is marked every 3 h during the week. Left Y-axis signals the values of temperature in °C. Right Y-axis indicates the values of relative humidity in percentage.

Figure 14.
Design Builder modelling pictures.

Figure 15.
Blower Door test, June 2017.

Figure 16.
Thermographic images, thermal bridges.

Figure 17.
Schematic diagram of the installation of capillary tube mats and de-humidification by fan-coils, modelled in Design Builder.
Figure 17.
Schematic diagram of the installation of capillary tube mats and de-humidification by fan-coils, modelled in Design Builder.

Figure 18.
Temperatures of indoor air on 1 July at 3:00 p.m. with the basement (OP 2).

Figure 19.
Temperatures of interior air on 1 July at 3:00 p.m. without a basement (OP 1).

Figure 20.
Temperatures of indoor air on 31 January at 7:00 a.m. with a basement (OP 2).

Figure 21.
Temperatures of indoor air on 1 August at 3:00 p.m. with TCP panels (OP 3).

Figure 22.
Temperatures of indoor air on 1 February at 9:00 a.m. with TCP panels (OP 3).

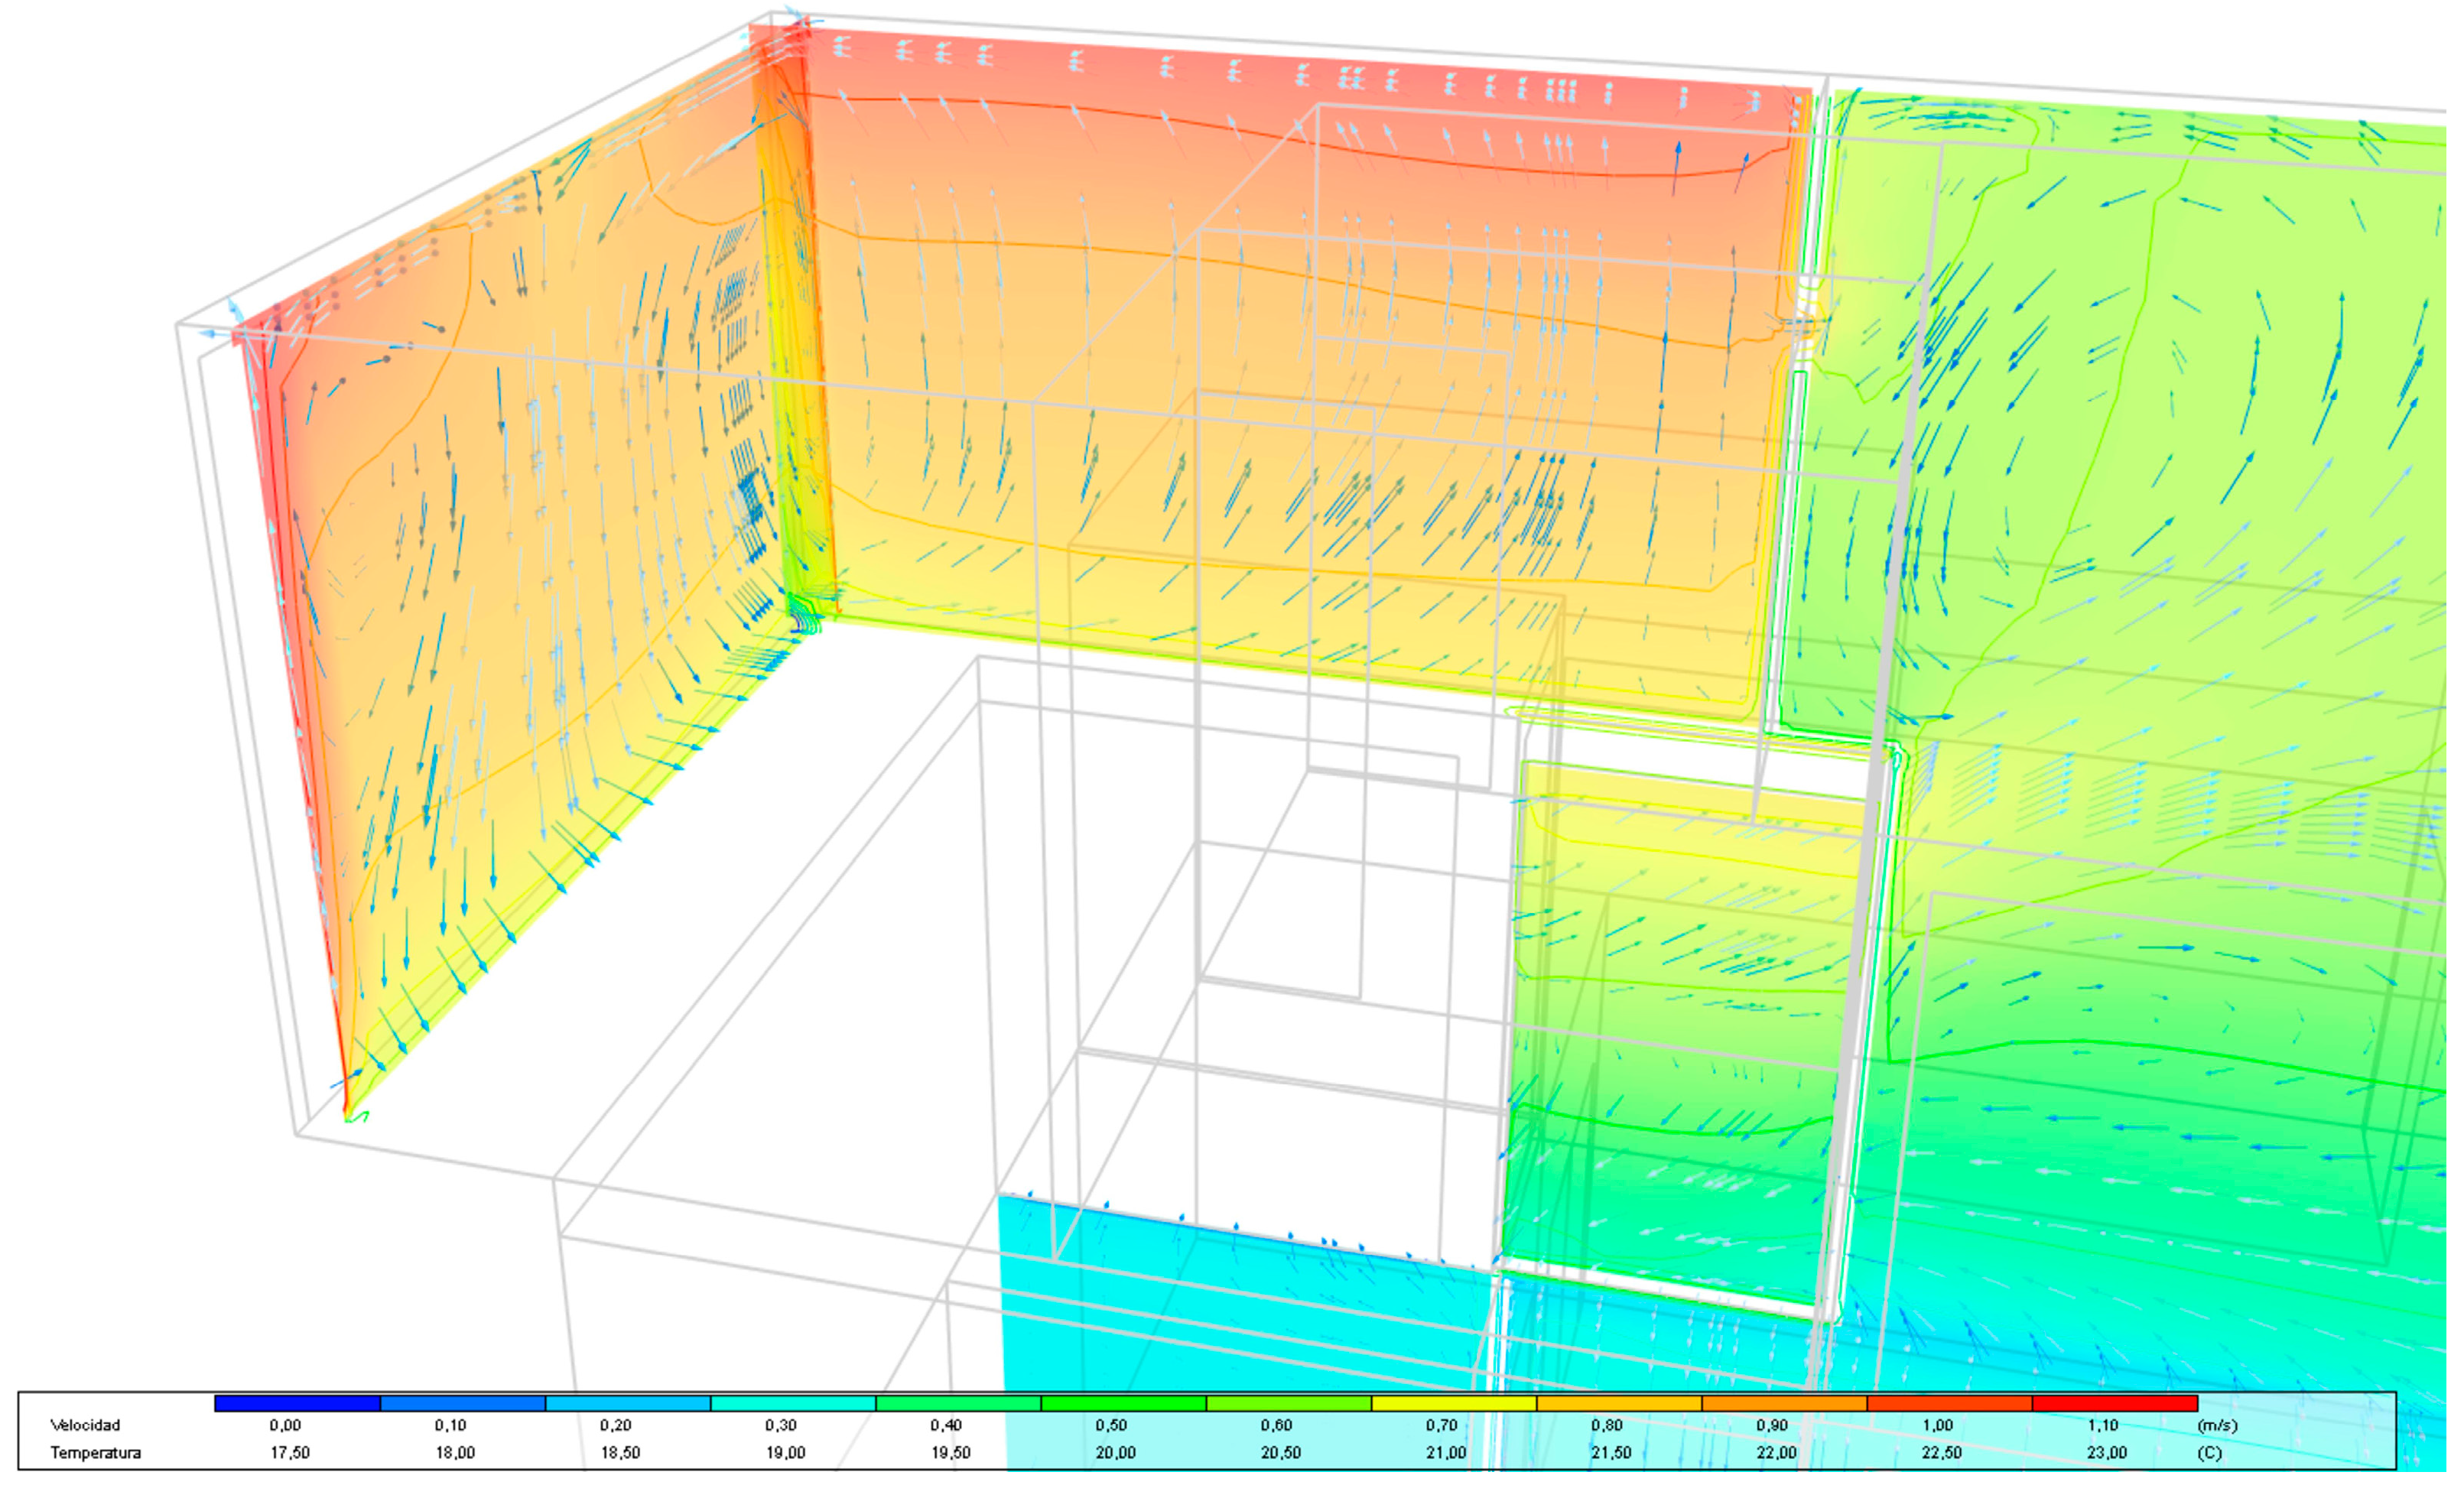
Figure 23.
Detail of Figure 22. Bedroom of the first floor.
Figure 23.
Detail of Figure 22. Bedroom of the first floor.


Table 1.
Occupant heat transfer in summer regime: living room, ground floor.
| v (m/s) | hc (W/°C) | Tp (°C) | Ta (°C) | hr (W/m2 °C) | Trm (°C) | qcvi (W) | qrdi (W) | TOTAL (W) | |
|---|---|---|---|---|---|---|---|---|---|
| OP 1 | 0.050 | 6.875 | 30.00 | 28.37 | 4.70 | 25.70 | 11.21 | 34.31 | 45.52 |
| OP 2 | 0.160 | 9.081 | 30.00 | 26.28 | 4.70 | 23.98 | 33.81 | 48.09 | 81.91 |
| OP 3 | 0.172 | 9.248 | 30.00 | 25.11 | 4.70 | 19.45 | 35.22 | 84.28 | 119.50 |
Table 2.
Occupant heat transfer in the summer regime: living room, basement.
| v (m/s) | hc (W/°C) | Tp (°C) | Ta (°C) | hr (W/m2 °C) | Trm (°C) | qcvi (W) | qrdi (W) | TOTAL (W) | |
|---|---|---|---|---|---|---|---|---|---|
| OP 2 | 0.062 | 7.239 | 30.00 | 23.36 | 4.70 | 21.28 | 48.02 | 69.67 | 117.67 |
| OP 3 | 0.069 | 7.427 | 30.00 | 23.05 | 4.70 | 19.25 | 51.87 | 85.89 | 137.76 |
Table 3.
Calculation of air infiltration through building envelope n50.
| n50 | Total | Cladding Only | nwinter | |
|---|---|---|---|---|
| Depressurisation | 3.37 | 3.05 | ||
| Pressurisation | 3.48 | 3.23 | ||
| Average value | 3.14 acH | 3.42 | 3.14 | 0.342 acH |
Table 4.
Calculation of energy demands and CO2 emissions of the three OPs.
| OP 1 | OP 2 | OP 3 | |
|---|---|---|---|
| Energy demand in summer kWh/m2 | 44.50 | 37.15 | 23.64 |
| Energy demand in winter kWh/m2 | 30.63 | 29.38 | 21.93 |
| Annual Energy Demand kWh/m2/year | 74.13 | 66.53 | 45.57 |
| Annual CO2 emissions at the Use Stage | 149,009 kg | 125,323 kg | 91,595 kg |
| Percentage | 100.00% | 89.75% | 61.15% |
Table 5.
Calculation of yearly energy consumption and comparison with convective systems.
| Summer from 1 May to 30 November Winter from 1 December to 30 April Occupation 4 PEOPLE | OP 2 All-Air | OP 3 KaRo Walls | ||
|---|---|---|---|---|
| 1 | Effective area | m2 | 287.22 | 287.22 |
| Ceramic panels area | m2 | 135 | ||
| 2 | Maximum thermal load | W/m2 | 80 | 75 |
| 4 | Minimal Airflow Renewal | m3/m2 h | 1.70 | 1.70 |
| 5 | Thermal water leap in summer | k | 6 | 3 |
| 6 | System operating time | h/year | 2160 | 2160 |
| Ventilation | ||||
| 7 | Air flow rate | m3/hm2 | 18.32 | 2.45 |
| 8 | Volume of air drive | m3/h | 2261 | 317 |
| 9 | Ventilator power | kW | 1.25 | 0.27 |
| 10 | Power Consumption | MWh/year | 4.82 | 1.096 |
| Cold pump | ||||
| 11 | Water flow | l/m2 h | 10.70 | 21.5 |
| 12 | Water volume | l/h | 3073 | 6175 |
| 13 | Power | 0.10 | 0.25 | |
| 14 | Power Consumption | MWh/year | 0.45 | 0.88 |
| Ventilators and pumps | ||||
| 15 | Power consumption | MWh/year | 5.27 | 1.97 |
| 16 | Comparison | % | 100% | 15.6% |
| Fan-Coils Dehumidifiers | ||||
| 17 | Power | kW | 3.90 | |
| 18 | Power Consumption | MWh/year | 4.86 | |
| Refrigeration system | ||||
| 19 | Emission power | W/m2 | 85 | 69 |
| 20 | Power | kW | 18.47 | 13.62 |
| 21 | Summer power consumption | MWh/year | 7.77 | 4.36 |
| Heating system | ||||
| 22 | Power | kW | 16.8 | 14.07 |
| 23 | Winter power consumption | MWh/year | 6.06 | 3.86 |
| 24 | Power consumption per year | MWh/year | 19.11 | 13.09 |
| Comparison | % | 100% | 68.53% |
Table 6.
Calculation of the investment payback period of OP 3 versus OP 2.
| OP 2 | OP 3 | ||
|---|---|---|---|
| All air installation with heat pump | € | €28.315 | |
| Installation KaRo mats with TCP panels | € | €42.541 | |
| Annual energy consumption | kWh/year | 19.110 | 13.090 |
| Annual savings | € | 740 | |
| Payback period | years | 19.22 |
© 2017 by the author. Licensee MDPI, Basel, Switzerland. This article is an open access article distributed under the terms and conditions of the Creative Commons Attribution (CC BY) license (http://creativecommons.org/licenses/by/4.0/).
Share and Cite
MDPI and ACS Style
Echarri, V. Thermal Ceramic Panels and Passive Systems in Mediterranean Housing: Energy Savings and Environmental Impacts. Sustainability 2017, 9, 1613. https://0-doi-org.brum.beds.ac.uk/10.3390/su9091613
AMA Style
Echarri V. Thermal Ceramic Panels and Passive Systems in Mediterranean Housing: Energy Savings and Environmental Impacts. Sustainability. 2017; 9(9):1613. https://0-doi-org.brum.beds.ac.uk/10.3390/su9091613
Chicago/Turabian StyleEcharri, Víctor. 2017. "Thermal Ceramic Panels and Passive Systems in Mediterranean Housing: Energy Savings and Environmental Impacts" Sustainability 9, no. 9: 1613. https://0-doi-org.brum.beds.ac.uk/10.3390/su9091613
Note that from the first issue of 2016, this journal uses article numbers instead of page numbers. See further details here.