Article

The Driving Force Analysis of NDVI Dynamics in the Trans-Boundary Tumen River Basin between 2000 and 2015

1
Key Laboratory of Land Surface Pattern and Simulation, Institute of Geographic Sciences and Natural Resources Research (IGSNRR), Chinese Academy of Sciences (CAS), Beijing 100101, China
2
University of Chinese Academy of Sciences, Beijing 100049, China
3
CAS Centre for Excellence in Tibetan Plateau Earth Sciences, Beijing 100101, China
4
Institute of Earth Environmental Information (IEEI), Pyongyang, Democratic People’s Republic of Korea
*
Author to whom correspondence should be addressed.
Sustainability 2017, 9(12), 2350; https://0-doi-org.brum.beds.ac.uk/10.3390/su9122350
Submission received: 14 November 2017 / Revised: 11 December 2017 / Accepted: 12 December 2017 / Published: 18 December 2017

Abstract

:
Vegetation dynamics in relation to climatic changes and anthropogenic activities is critical for terrestrial ecosystem management. The objective of this study was to investigate spatiotemporal change of vegetation and their driving forces during growing seasons (between April and October and including the spring, summer and autumn) in the Tumen River Basin (TRB) using Normalized Difference Vegetation Index (NDVI) and climate data spanning from 2000 to 2015. A linear regression, Pearson correlation coefficients and the residual trend (RESTREND) was applied for this study. Our results demonstrate that vegetation increased during different periods of the growing season in most of the areas of the TRB over 16 years. Our results demonstrate that vegetation increased during different periods of the growing season in most of the areas of the TRB over 16 years; those in growing season (spring, summer, and autumn) were characterized by the increase in rates by 0.0012/year, 0.0022/year, 0.0011/year, and 0.0019/year, respectively. Forested regions are characterized by the largest increase (0.0021/year) in NDVI compared with other vegetation types across the entire study area. The trends in NDVI across the study area were influenced by both climatic variations and human disturbances. The human activities such as reforestation and agricultural practices are the primary driver, greater than climatic factors, during growing season, including summer and autumn. Temperature and precipitation has had a significant influence on NDVI in a limited area (temp = 0.86%, p < 0.05 and precipitation = 1.93%, p < 0.05) during growing season. The significant role of precipitation on NDVI change throughout growing season and the summer is larger than that of temperature across the TRB, although the influence of the latter becomes most significant during the spring and autumn. The RESTREND method shows that human activity during the growing season, including the spring, summer, and autumn, have led to enhancements in NDVI across more than 70% of the TRB over the last 16 years, with the most significant improvements seen in forested land and farmland. At the same time, a significant reduction in residual (i.e., degraded areas) NDVI values for different growing seasons had characterized farmland and urban land at low altitudes. This study provides important background information regarding the influence of human activities on land degradation and provides a scientific foundation for the development of ecological restoration policies within the TRB. We found that the RESTREND method can be used to detect human drivers of vegetation in the regions with semi-humid and humid monsoon, where the significant correlation between NDVI and climatic factors exists.

1. Introduction

Vegetation is the dominant component of terrestrial ecosystems on earth and plays a critical role in energy exchange as well as water and biogeochemical cycles [1]. The land cover type is sensitive to environmental changes that result mainly from climatic fluctuations and human activities. As a result, understanding the factors underlying vegetation dynamics has been identified as a key issue in global climate variability [2], particularly in terrestrial ecosystems [3].
Monitoring vegetation dynamics and identifying the forces that contribute to variation has become a crucial issue in global climate variability research [4]. However, a limited number of studies to date have been performed to monitor vegetation change and the responses of this land cover type to climate at various spatial scales, including global [5], national [3,4], and provincial [6], as well as on plateaus [7] and within basins [8,9]. All of these previous studies utilized the time series Normalized Difference Vegetation Index (NDVI) obtained from satellite remote sensing (RS); this index is known to be significantly correlated with biomass, photosynthetic capacity, the leaf area index (LAI), and net primary productivity (NPP) [10]. Studies have shown that vegetation activity gradually increased globally between 1982 and 1990, especially in tropical regions including western Africa and south-eastern Asia [11] as well as at northern high and middle latitudes, and in parts of the tropics and subtropics between 1982 and 1998 [12]. In addition, significant relationships between NDVI and indicators of climate have been used to demonstrate that vegetation changes are closely related to variations in the latter [5,11]. Temperature and precipitation are the most significant factors influencing changes in the NDVI [13]; trends in this index in northern mid and high latitudes are controlled by increasing temperature while fluctuations in the semi-arid regions of the Southern Hemisphere are due to decreasing precipitation [5]. Precipitation is known to be more important than temperature as a climatic variable influencing changes in vegetation cover in arid and semi-arid regions [2,9,14], and it has also been suggested that the relationship between the NDVI and temperature is more marked than that between this index and precipitation in temperate monsoonal climate regions [15].
Previous studies in these regions have been based on satellite Remote Sensing (RS) data collected by the Global Inventory Modeling and Mapping Studies (GIMMS), Satellite pour l’Observation de la Terre (SPOT), and the Moderate Resolution Imaging Spectroradiometer (MODIS) as this information is known to be significantly correlated with biomass, photosynthetic capacity, LAI, and NPP [10]. Significantly, MODIS NDVI RS data have been widely applied in these studies addressing changes in vegetation across different regional scales because of their high spatiotemporal resolution and wide observational extent [16,17].
In addition, climatic parameters (temperature and precipitation), environmental protection policies and management strategies, human activities, and ecological construction projects are all also major factors leading to changes in vegetation dynamics [18]. For example, environmental protection policies can cause increases in vegetation cover as the conversion of croplands to forests alter plant productivity. This effect was discussed by Li et al. (2012) [19] who detected human-induced vegetation changes in the Xilingol grassland of Inner Mongolia, China. Evans and Geerken (2004) [20] were the first to advocate use of the residual trend (RESTREND) method to distinguish vegetation degradation due to climatic factors from human activities [21]; this study was carried out based on comparisons between Advanced Very High Resolution Radiometer (AVHRR) NDVI and rainfall data in Syria. The RESTREND method identifies the human driver of vegetation dynamics by analyzing trends in the residuals between observed and predicted NDVI values assuming that this index is positively correlated with climate variability. This approach has therefore been widely applied in a variety of research studies to identify the human drivers of vegetation dynamics in arid and semi-arid regions [22]. Results have demonstrated that the RESTREND method can be applied with confidence to effectively differentiate the effects of climate and human activities on the NDVI. He et al. (2015) [21] used it to differentiate human-induced drivers from climatic drivers of grassland degradation in the Liao River Basin, China. The result showed that this method is highly applicable in semi-arid and semi-humid regions by using the relationships between NDVI and temperature and precipitation.
The TRB consists of the region surrounding the Tumen River that forms the border between the China, Russia and Democratic People’s Republic of Korea (DPR Korea). The surrounds of this river basin, referred to as the Tuman Gang in the DPR Korea, is characterized by a typical temperate monsoonal climate zone with four seasons, spring, summer, autumn, and winter. However, the mechanisms and driving forces that underlie vegetation changes within the TRB remain poorly understood. In this context, determining the nature of these dynamics using MODIS NDVI will provide an important basis for future scientific studies within the TRB.
The main goals of this study are to explore spatiotemporal variations in the NDVI within the TRB as well as the forces driving these changes by considering the combined effects of climate variability and human activities on vegetation dynamics in growing seasons between 2000 and 2015. Vegetation changes within the growing season (between April and October) must include data from the spring, summer, and autumn seasons if we are to obtain a deeper understanding of vegetation dynamics. Thus, the specific objectives of this research were to: (1) quantify trends in the NDVI during both the growing season and the rest of the year at the basin scale using MODIS 13Q1 (Level 3 Product) data that encompasses the period between 2000 and 2015; (2) investigate the relationship between seasonal NDVI changes, temperature, and precipitation; and (3) apply the RESTREND method to differentiate human-induced and climatic drivers of vegetation degradation within the basin.

2. Study Area and Data Sources
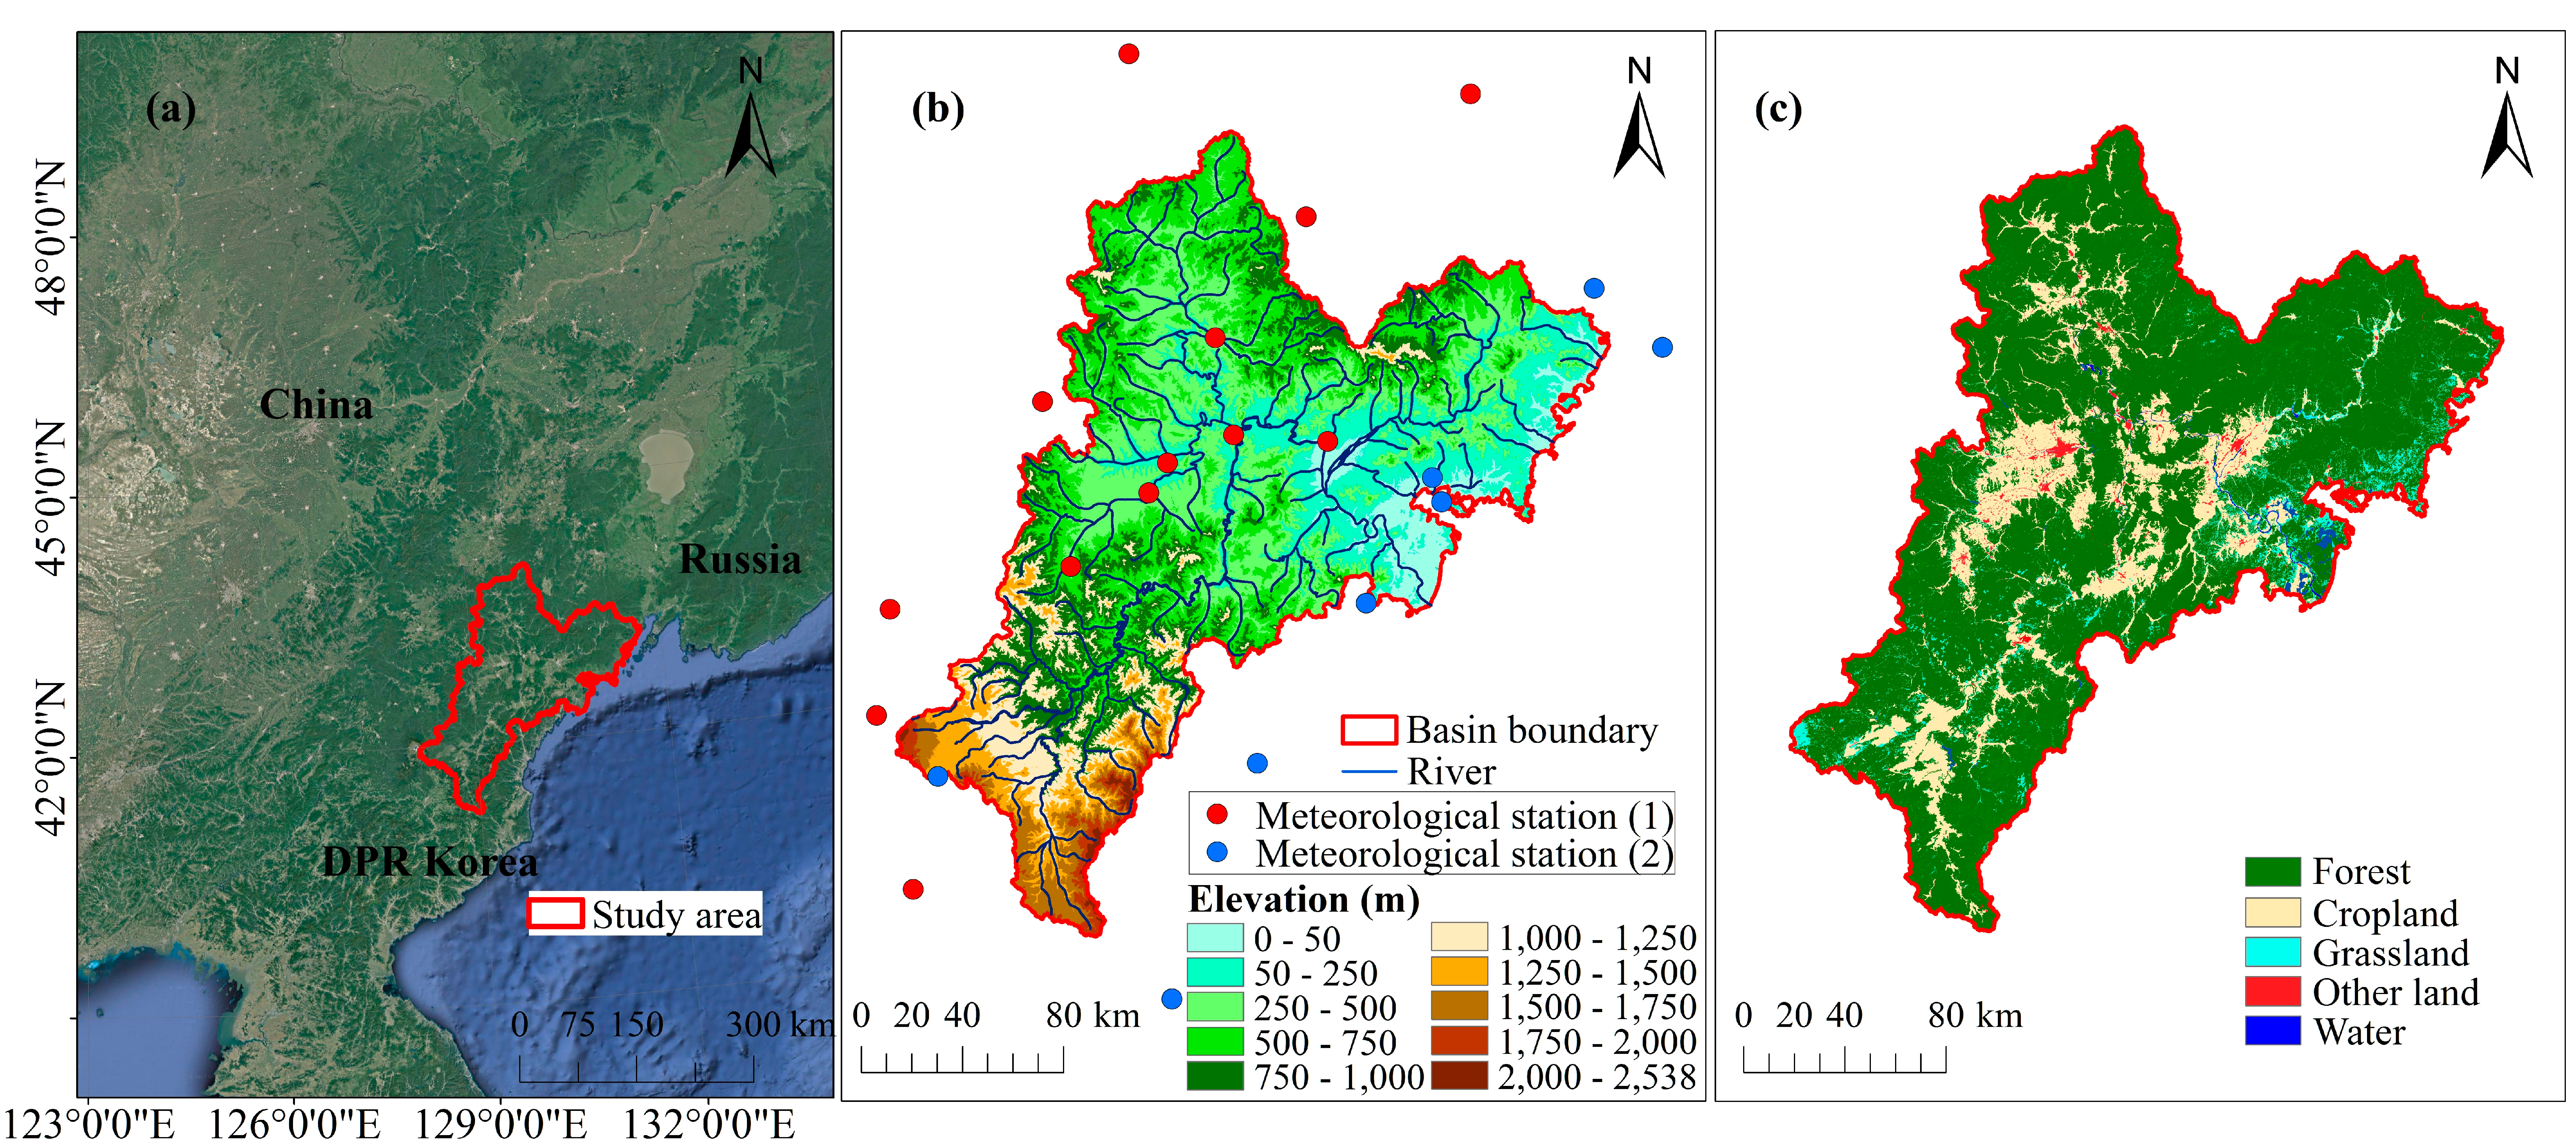
2.1. Study Area

The TRB encompasses an area of 35,732 km2 that ranges in latitude between 40°86′ N and 44°32′ N and between 127°70′ E and 132°09′ E in longitude (Figure 1a). This basin is a trans-boundary river basin in Northeast Asia that comprises the international boundaries between China, DPR Korea, and Russia [23]. A total 525 km long, the Tumen River originates from the eastern foot of mountains in Mt. Paektu on the DPR Korean side [24] and enters into the east sea of DPR Korea; there are many tributaries flowing into this river. The TRB is characterized by a typical temperate monsoon climate zone [24] and has a mean annual precipitation between 400 mm and 650 mm, and average, maximum, and minimum temperatures between 2 °C and 6 °C, between 34 °C and 38 °C, and between −34 °C and −23 °C, respectively [23]. Approximately 70% of the rainfall within the TRB occurs between June and September [25]. The elevation across the TRB increases from east to west and from north to south (Figure 1b) and includes plains and mountains. The major vegetation types across this region are forest land, cropland, and grassland (Figure 1c).

2.2. Data Sources

A MODIS 16-day composite NDVI dataset at 250 m spatial resolution (i.e., the MOD13Q1 product [26] was used for this study. These data are freely available at http://modis.gsfc.nasa.gov/ spanning from 2000 to 2015, and are titled H27V04 for this study area. A total of 368 NDVI data were first clipped and subsequently re-projected to an Albers equal-area projection by standard output projection parameters with the WGS84 datum using the MODIS re-projection Tool (MRT) downloaded from the National Aeronautics and Space Administration (NASA) website. The TIMESAT software was used to remove the noise in NDVI time series datasets by applying a Savitzky-Golay filter [27] which provided a simplified least-squares-fit convolution for smoothing and computing derivatives of a set of consecutive values [28]. Finally, the vegetation growing season (i.e., between April and October) was divided into spring (April and May), summer (between June and August), and autumn (September and October) [29]. Pixels with a mean growing season NDVI less than 0.05 were masked out from this study as they represent non-vegetated areas including deserts and water bodies [3]; these regions are irrelevant to our discussion of vegetation status.
Daily climate data (i.e., temperature and precipitation) from a total of 21 meteorological stations in and around the TRB available for the period of 2000 to 2015 were obtained from different sources. Climate data for the Chinese region of the TRB were downloaded from the China Meteorological Data Interchange Platform (http://data.cma.cn/), while those for the DPR Korea and Russia were extracted from the National Oceanic and Atmospheric Administration (NOAA) National Centers for Environmental Information database (http://www.noaa.gov/). Monthly mean temperature and total precipitation values were compiled from daily climate data using the MATLAB software. Further, as topography is a key factor impacting both temperature and precipitation, multiple linear regression models were applied based on the relationship between climate and topographic factors to determine monthly mean temperature and accumulated precipitation across the entire study period at a grid cell resolution of 250 m × 250 m [9]. Longitude, latitude, elevation and distance from the nearest coastline were selected as temperature-related topographic factors in multiple linear regression models, while the same set of variables plus slope and slope direction from Digital Elevation Model (DEM) data were utilized as precipitation-related topographic factors.
An open-access Shuttle Radar Topography Mission (SRTM) 30 m-resolution DEM was downloaded from the US Geological Survey Earth Resources Observation Systems data center. These DEM data were then re-sampled to grid cells with a resolution of 250 m × 250 m using the ArcGIS software in order to be consistent with MODIS NDVI pixels, before being used to define the boundary of the TRB. This DEM was also used to generate longitude, latitude, elevation, slope and slope direction in ArcGIS software. A 2010 vegetation map was generated from a Landsat TM5 satellite image (encompassing the row/paths 114/30, 115/30, 115/31, 116/30, and 116/31). This map comprised forested land (i.e., needle-leaved forest, broadleaf and mixed forest), dropland (paddy and dryland), grassland (tropical grassland), and other land (urban and barren land) (Figure 1c). In first step, a total 129 of ground-reference data for different land covers was collected by visual inspection from Google Earth images. Next, pre-processing stages include radiometric correction (Radiometric calibration and Flash atmospheric correction), image cutting and image mosaic within same season. All satellite imageries were classified into five land cover types by applying the Support Vector Machines (SVM) classification method [17] in the ENVI 5.1 software. Finally, the overall classification accuracy was 85.89%, with corresponding kappa coefficients of 0.86.

3. Methods

3.1. Linear Regression Model (LRM)

A LRM was applied in this study to analyze the trends in growing season NDVI as well as climatic factors between 2000 and 2015. Jiapaer et al. (2015) [6] and Lian et al. (2017) [30] used this method to monitor vegetation change trends in Xinjiang and in Part of the Agro-Pastoral Transitional Zone in Inner Mongolia of China, respectively. Thus, the smallest power-function linear regression equation proposed by previous studies was applied for each pixel, as follows:
Slope = n × i = 1 n X i Y i i = 1 n X i i = 1 n Y i n × i = 1 n X i 2 ( i = 1 n X i ) 2
In this expression, Slope refers to the trend in vegetation dynamics, and n is the cumulative number of years in the study period. Y i and X i are the values of the dependent and independent variables in the ith year, respectively. In general, these variables tend to increase if Slope is greater than zero, but decrease if the opposite is the case.
The significant nature of any trends was assessed using F statistics [31] for each pixel via programming in the MATLAB R2014a software [32]. Five distinct levels of variation [33] were recognized in this study encompassing a highly significant reduction (i.e., slope < 0; p < 0.01), a significant reduction (i.e., slope < 0, 0.01 < p < 0.05), no significant change (i.e., p > 0.05), a significant increase (i.e., slope > 0, 0.01 < p < 0.05), and a highly significantly increase (i.e., slope > 0, p < 0.01).

3.2. Pearson Correlation Analysis

The Pearson correlation coefficient was utilized in this study to determine the effects of climatic factors on NDVI changes over the period between 2000 and 2015. This approach has been widely applied to analysis the correlation between climate factors and NDVI changes [34,35,36,37,38] as well as the relationships between tree growth and NDVI [39] to know vegetation dynamics, as follows:
r x y = i = 1 n [ ( x i X ¯ ) ( y i Y ¯ ) ] ( x i X ¯ ) 2 i = 1 n ( y i Y ¯ ) 2
In this expression, r x y is the correlation coefficient between x and y, while x refers to the NDVI, y is the temperature or precipitation, n denotes the sample number, and X ¯ and Y ¯ are the average values of x and y, respectively. A t-test [38] was performed at each pixel and a p-value less than 0.05 was considered statistically significant for the purposes of this research.

3.3. The RESTREND Analysis

The RESTREND analysis was performed to understand the factors underlying changes in the NDVI except for climatic factors in this study. This approach is one of the most reliable trend analysis methods that can be utilized to disentangle the effects of climate from human-accelerated land degradation [40], when assuming that the climatic factor is the only driver in NDVI change [21]. It is well known that changes in vegetation are strongly influenced by climatic factors and human activities such as ecological restoration practices (seasonal cropping patterns, tree plantation and reducing deforestation); of these, temperature and precipitation exert a major influence but if significant climatic effects can be removed from long-term trends in the NDVI, land degradation induced by human activities can be distinguished more effectively within a study area [41,42].
A range of previous studies have applied the RESTREND method to quantitatively determine how human activities have influenced vegetation growth [21,22,31,40,41,42,43]. He et al. (2015) [21] had cleared that this method is highly applicable in semi-arid and semi-humid regions, when assuming that both temperature and precipitation influence a change in the NDVI; thus, this method was selected to isolate the contributions of precipitation and temperature to vegetation change from those due to human influence. Annual average NDVI, temperature, and total precipitation data of raster type for growing season periods between 2000 and 2015 were therefore applied. Climate data were logarithmically transformed to fulfill the assumptions of normal distribution [44]. In the first place, a multiple linear regression between observed NDVI and climatic factors (i.e., precipitation and temperature) was applied for each pixel and the statistically significant regression equation (p < 0.05) with the highest R2 was selected to predict the effects of NDVI change on climate. Secondly, residuals between observed and predicted NDVI values from the regression model were calculated for each pixel and residual trends were analyzed in order to detect slopes with respect to time via linear regression. A significant (p < 0.05) positive slope is therefore indicative of human influence perhaps attributable to conservation or reforestation efforts, while a significant negative slope denotes negative anthropogenic disturbance between 2000 and 2015 [43]. In this step, the significance level (p < 0.05) was tested by F test. Linear trends in the NDVI and climatic variables, Pearson correlation coefficients, and residual trends were calculated for each pixel using the MATLAB R2014a software in this study.

4. Results

4.1. Temporal and Spatial Trends in Growing Season NDVI

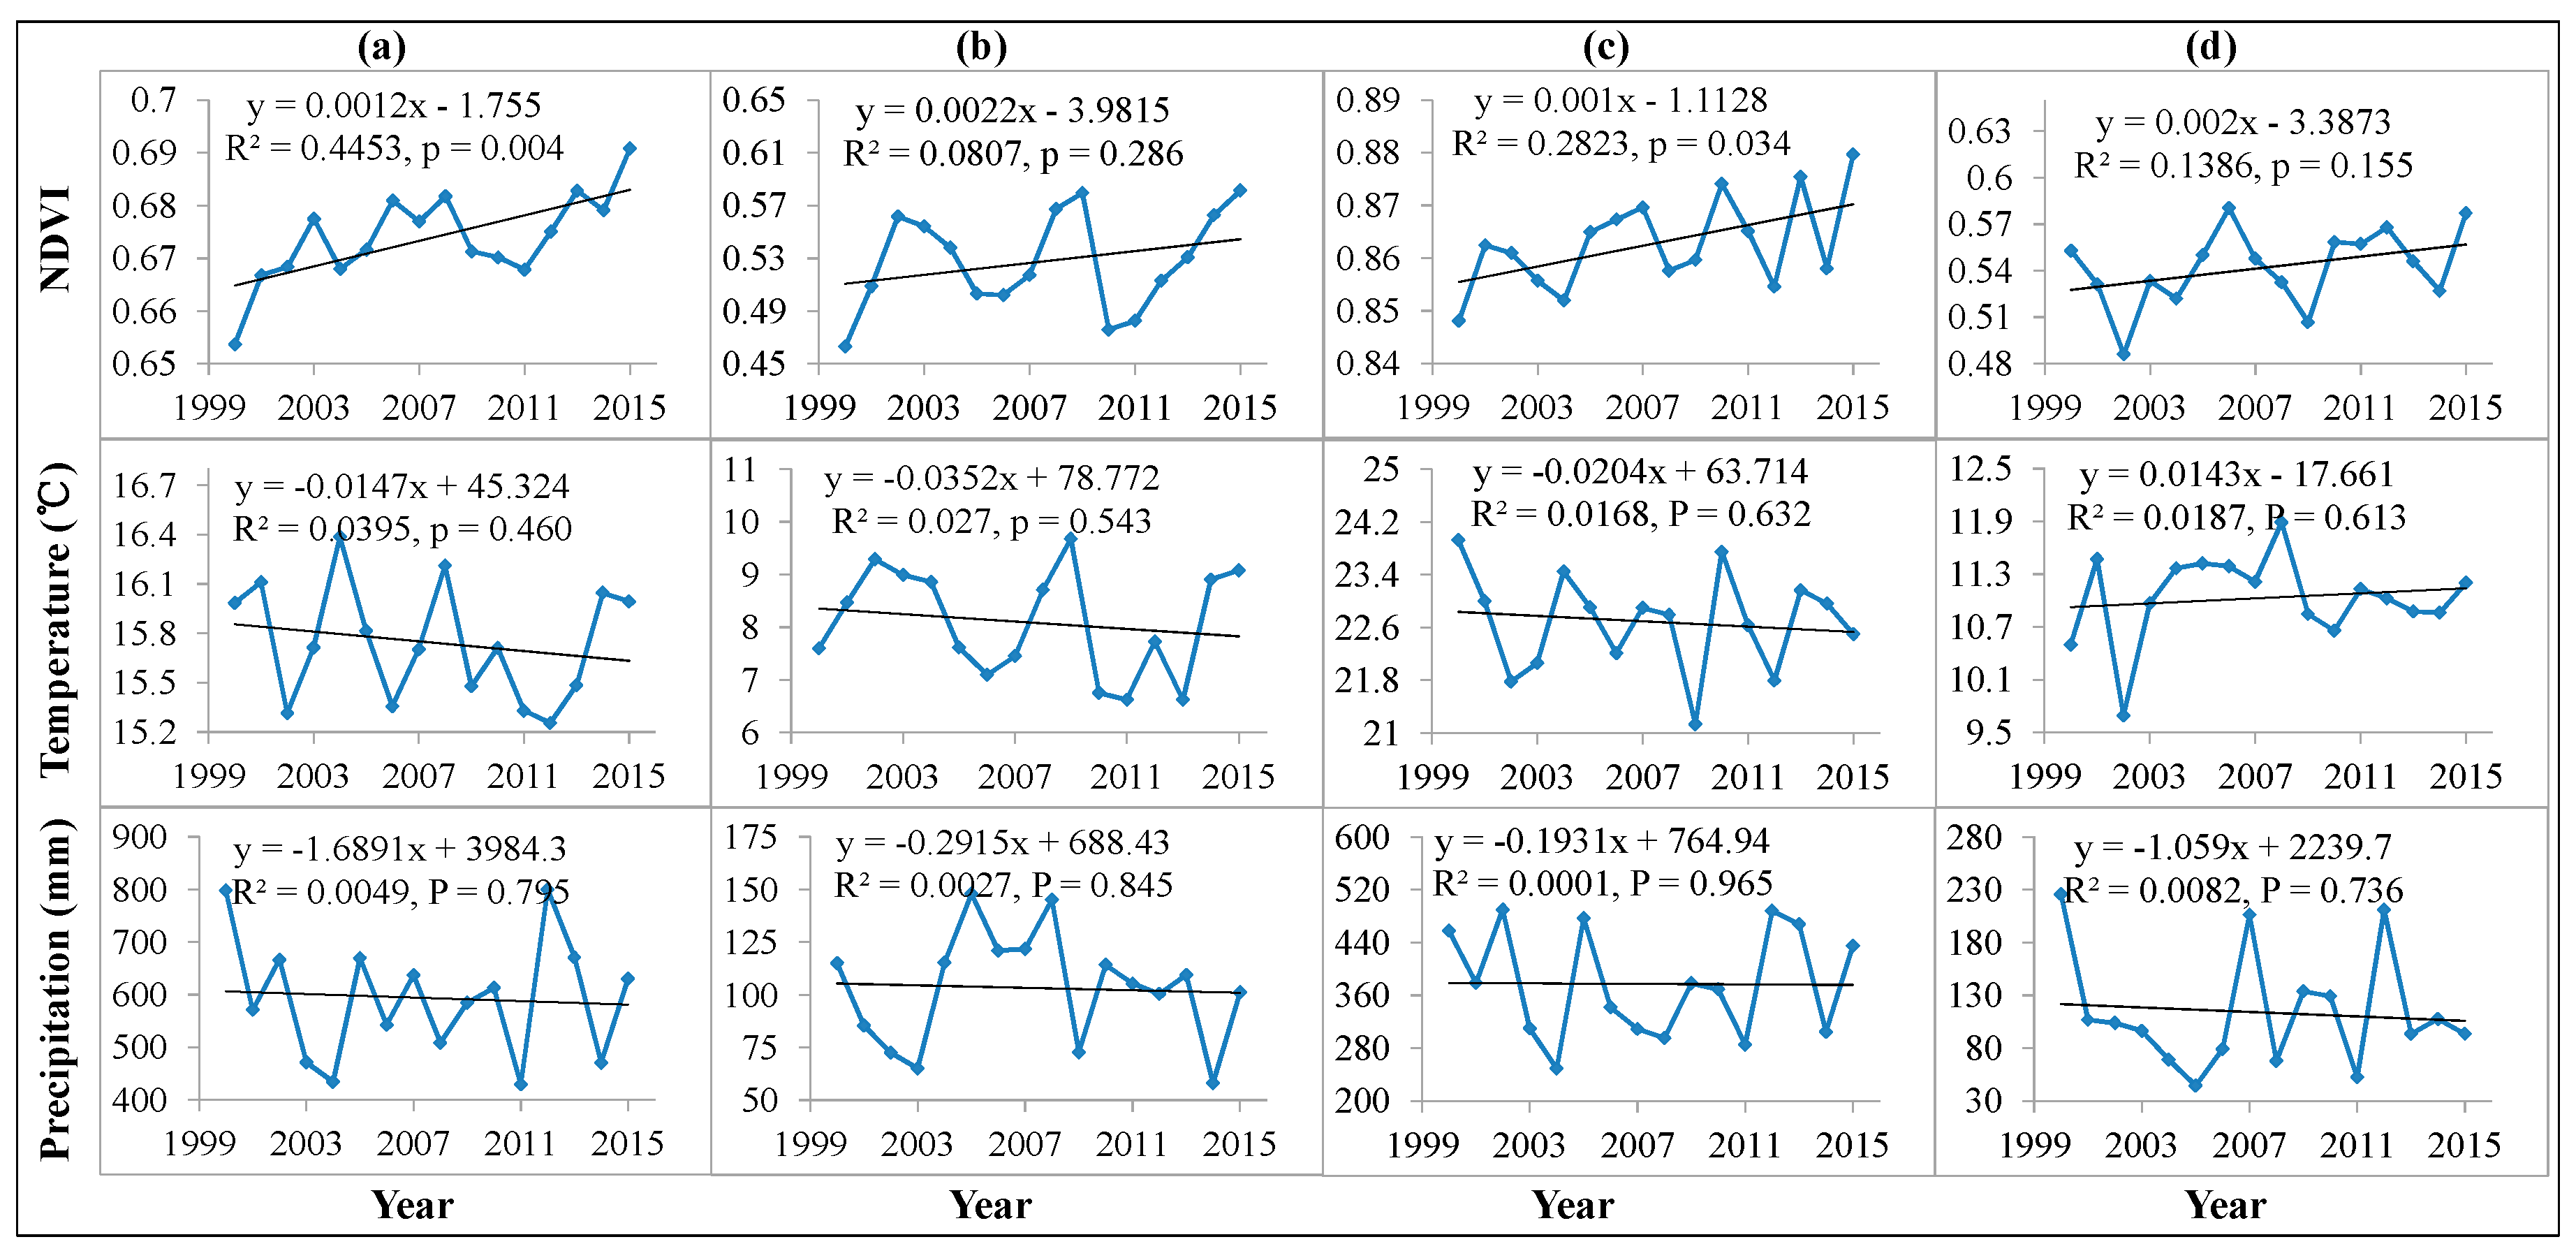
4.1.1. Temporal Trends in NDVI and Climatic Factors

The results of this study revealed that inter-annual linear variation in the NDVI and climatic variables (i.e., temperature and precipitation) for the TRB are different and heterogeneous depending on time during the growing season between 2000 and 2015 (Figure 2).
Data shows that fluctuations in the NDVI are manifested differently in different time periods of growing season, and that trends in this index have tended to increase throughout this period. Thus, the trends in the NDVI changed in the spring, summer, and autumn at rates of 0.0022/year (R2 = 0.081, p = 0.286), 0.0011/year (R2 = 0.282, p < 0.05), and 0.0019/year (R2 = 0.139, p = 0.155), respectively. These data show that the NDVI during the summer increased at the most significant rate, and that this trend encapsulated the smallest rise compared with the spring and autumn, while trends during these later two seasons were not significant. The trend in the NDVI during the growing season was characterized by a significant increase at an annual average rate of 0.0012/year (R2 = 0.45, p < 0.01); during the 2015 growing season this index increased to its highest mean level (0.699) throughout the whole study period, while the smallest annual mean NDVI value (0.65) was recorded in 2000.
Climatic trends recorded within the TRB demonstrate that mean temperature in growing season, spring and summer, decreased at the mean slopes of −0.015 °C/year, −0.035 °C/year, and −0.021 °C/year, respectively. In contrast, the mean autumn temperature has increased over the time period of this study at a mean rate of change of 0.014 °C/year, while precipitation change has remained inconsistent and heterogeneous throughout all periods of the growing season. Nevertheless, the largest reduction in precipitation was recorded in the autumn during the study period, at a rate of −1.06 mm/year, while trends in both climatic variables were not statistically significant (p > 0.05) across all the time periods of the growing season between 2000 and 2015.

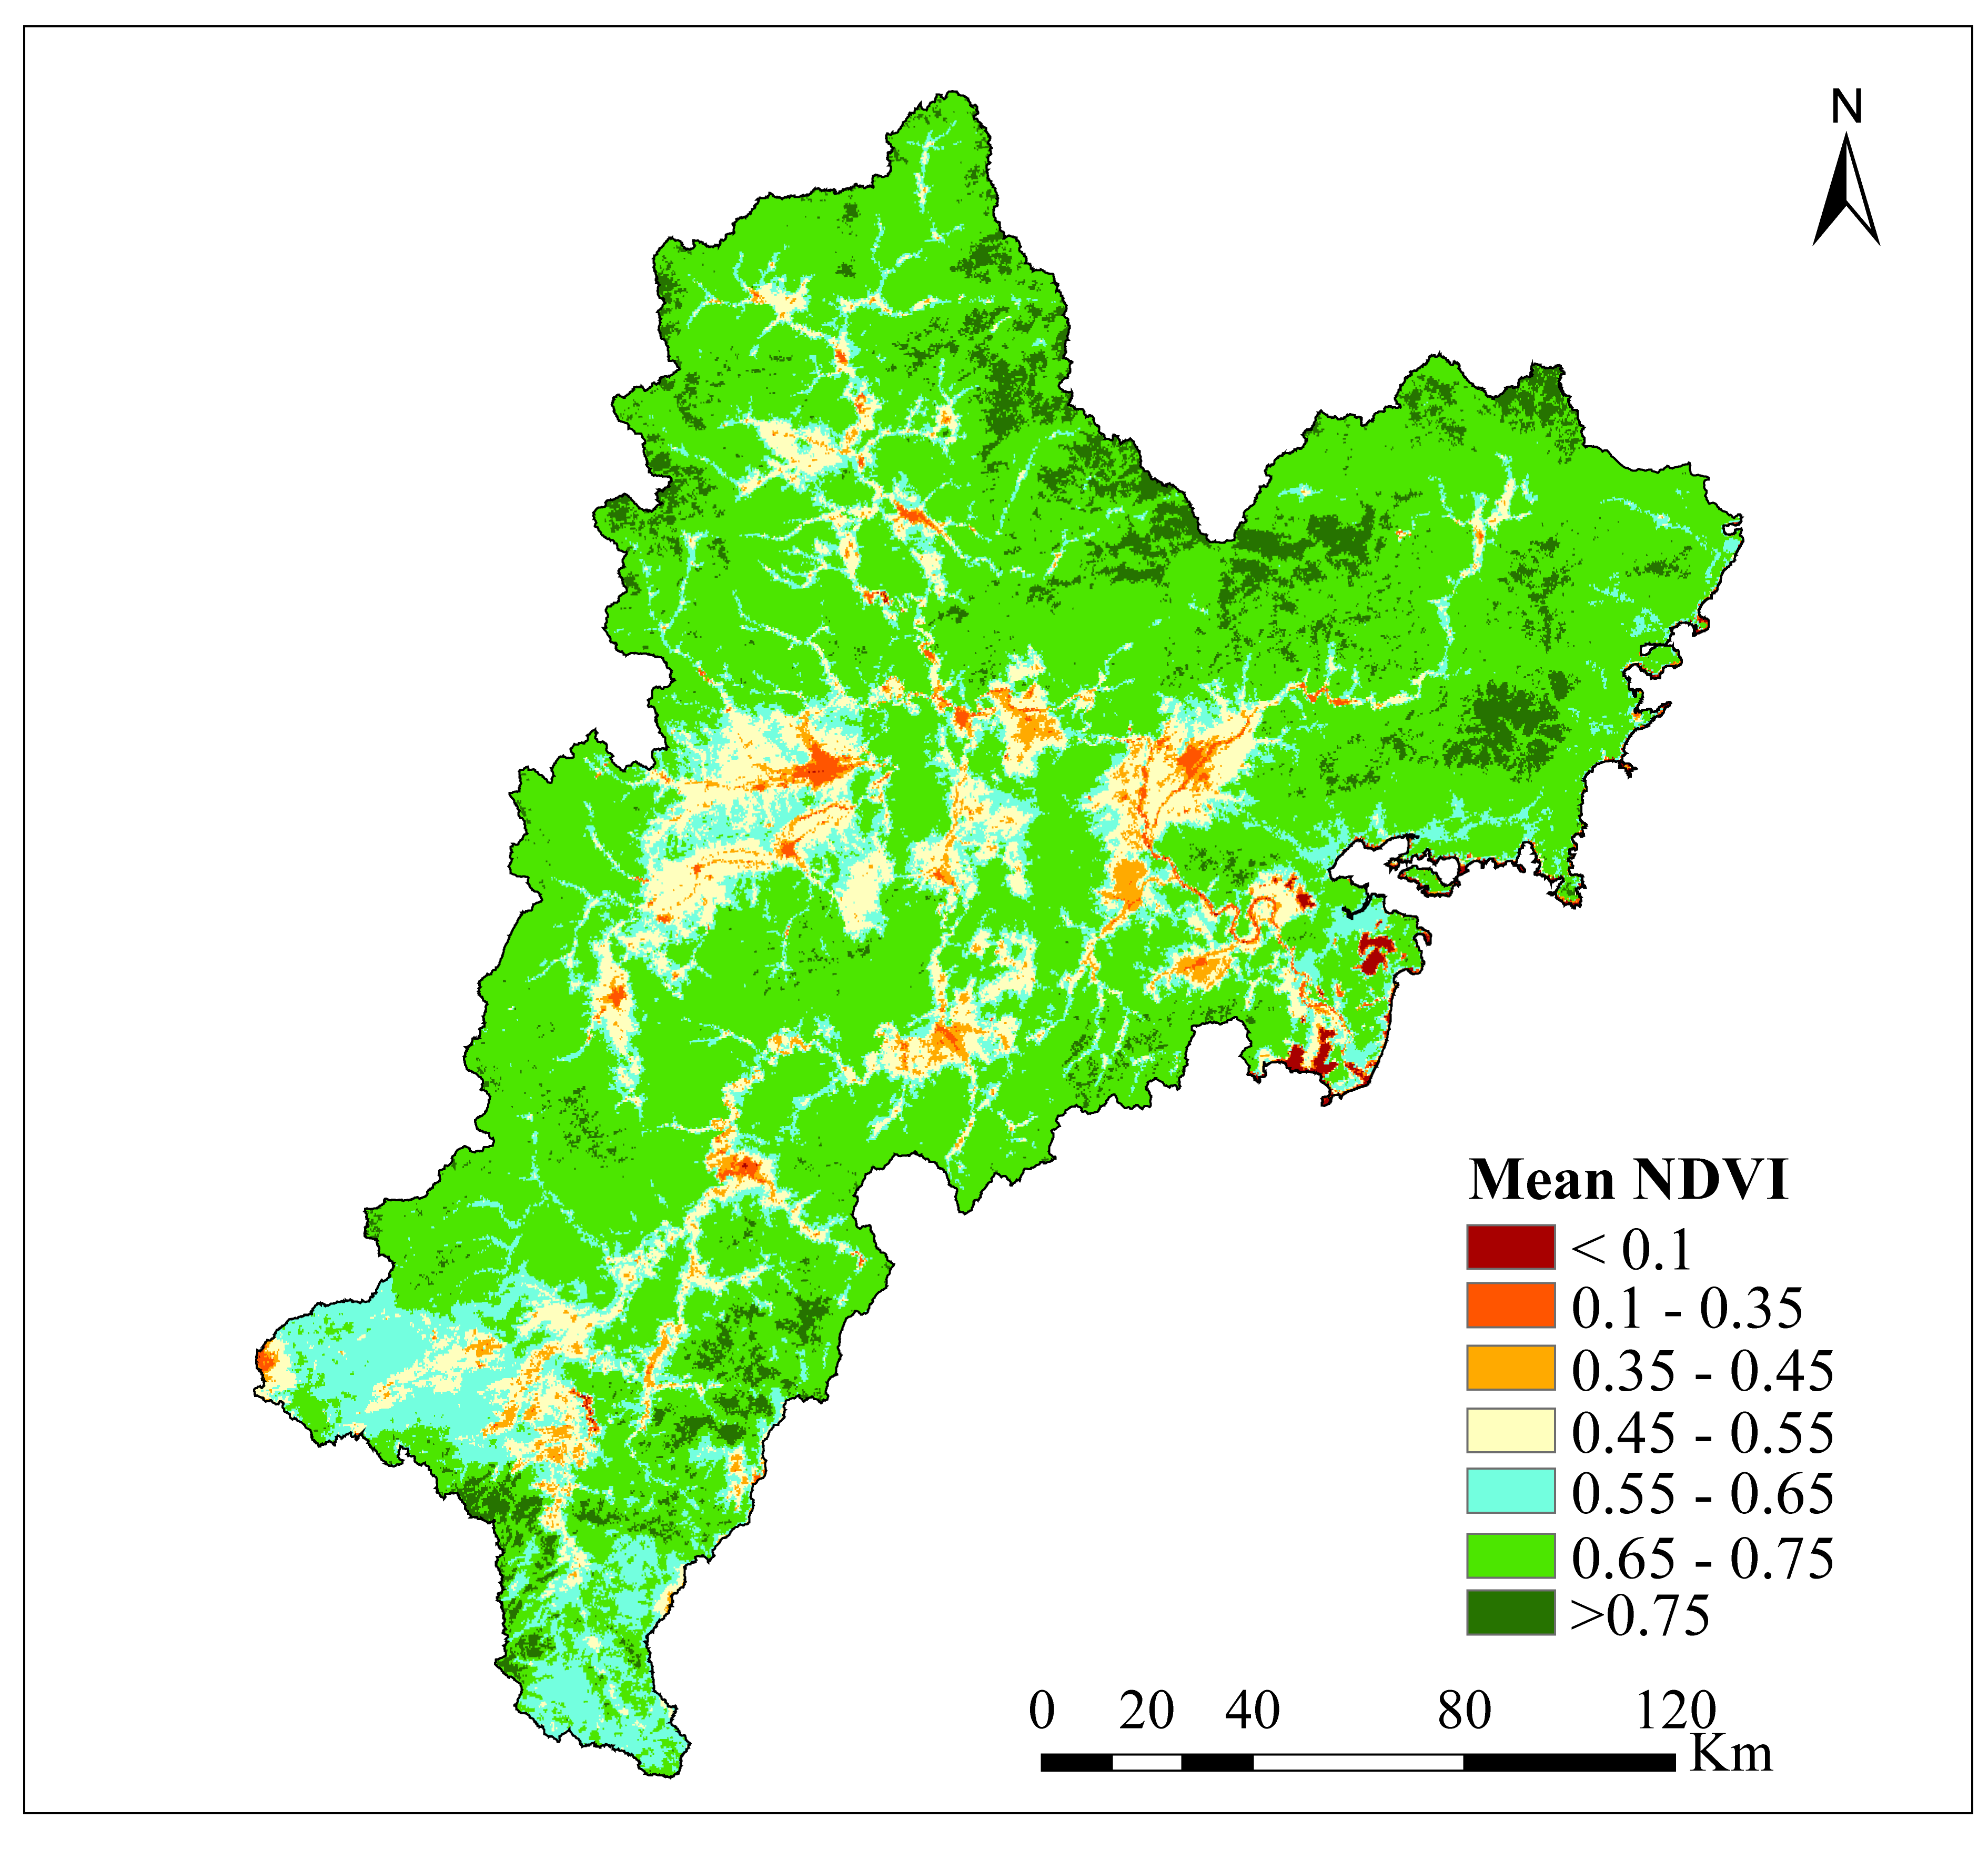
4.1.2. Spatial Variations in Seasonal NDVI

The spatial distribution of the mean NDVI in growing season of the study area between 2000 and 2015 is exposed by Figure 3. The mean NDVI greater than 0.75 was mainly distributed in northern and southern sections of the study area, which is mainly forested area. Mean NDVI in most of the forested area showed values between 0.65 and 0.75. In the water body area, the mean NDVI value of growing season was less than 0.1. Except for water area, the minimum value of mean NDVI appeared in other land regions, which was between 0.1 and 0.35. In the Chinese region of the study area, mean NDVI exhibited a maximum value of 0.678. The DPR Korea region of the TRB showed a minimum value of 0.633 and the value in the Russia region of the TRB was 0.675.
Annual mean change trends in the NDVI across all time periods of the growing season were analyzed in each pixel to evaluate the spatial heterogeneity in seasonal trends of this index over the 16-year period in this study. Thus, p-values for each growing season pixel were computed (Figure 4). In this analysis, areas that are characterized by significant negative trends are considered to be degraded while those characterized by significant positive trends are considered to be improved. Results show that the NDVI across different seasons has increased in large areas of the TRB; the increased areas in growing season, spring, summer and autumn were 84.6%, 78.3%, 72.2% and 77.9% of the whole area, respectively. The NDVI trend during spring and autumn season increased strongly in forested land, but during the summer season it appeared mainly in cropland area. However, decreasing trends in the spring, summer, and autumn seasons were primarily seen in eastern and southern areas, as well as in the center and northeastern section of the study area at the same time, where the altitudinal gradient tends to be lower (Figure 4b–d). Significant increases in the NDVI during the spring were mainly concentrated in the northern section of the study area, while increases in the summer occurred in the central part of the TRB, and autumnal increases tended to take place in northwestern and southwestern areas. Data show that increases in the NDVI tend to be widespread across most areas of the TRB throughout the entire growing season, even though reductions also occurred in partial regions of the eastern, center and southern area of the basin (Figure 4a). The mean rate of NDVI change across the whole TRB was 0.0017/year; results show that approximately 36.93% of the total basin area experienced a significant increase in this index (p < 0.05) at a mean rate of 0.0032/year (noted in areas where this rate significantly increased). Positive trends in NDVI dominated the western regions of the study area, while values for this index in 2.65% of the TRB significantly decreased (p < 0.05) at a mean rate of change of −0.0052/year. This decrease is mainly characteristic of the southwestern and central east regions of the TRB.
The results of this analysis revealed the percentage of areas within the TRB that have exhibited highly significant (p < 0.01) and significant (p < 0.05 and p > 0.01) trends in NDVI at seasonal scales over the last 16 years (Table 1). Highly significant changes in the NDVI (p < 0.01) during the summer were largest, as 1.39% of the areas considered in this study were characterized by highly significant decreases, and 9.51% were characterized by highly significant increases, which are mainly cropland regions. Values for the NDVI in autumn exhibited the smallest significant reductions, with just 0.55% of areas highly significant and 0.85% significant; autumn also exhibited the largest significant increases in this index (20.13% of areas with p < 0.05) compared with the spring and summer NDVI trends.
Changes in growing season NDVI across different vegetation types were then analyzed in order to develop an enhanced understanding of relevant patterns. Table 2 illustrates changes in mean growing season NDVI for different vegetation types across the regions of the TRB in all three countries over the last 16 years.
These results show that NDVI values varied across all vegetation types, in all areas of the TRB (a mean change trend in the Chinese area is 0.002/year; in Korean and Russian parts the trends are similar at 0.0015/year), and that increases were all greater than 0.001/year. Indeed, increases in this index for most vegetation types within China are marked; the mean rate of increase for growing season NDVI for forested land is the fastest in all three countries compared to other land-use types. These rates of change were 0.0027/year, 0.0017/year, and 0.0016/year for the Chinese, Korean, and Russian TRB regions, respectively, and were also the fastest increases compared to other vegetation types for the whole region over the 16 years of this study. Other land use types such as urban and barren land exhibited the smallest rates of NDVI increase throughout the growing season as values of 0.0011/year, 0.0012/year, and 0.0013/year were recorded for the Korean, Chinese, and Russian regions of the TRB, respectively. This land use type was also characterized by the lowest rate of change (0.0012/year) throughout the whole study area. The positive NDVI change in urban and barren land indicates dynamics of the ecosystems and good ecological restoration.

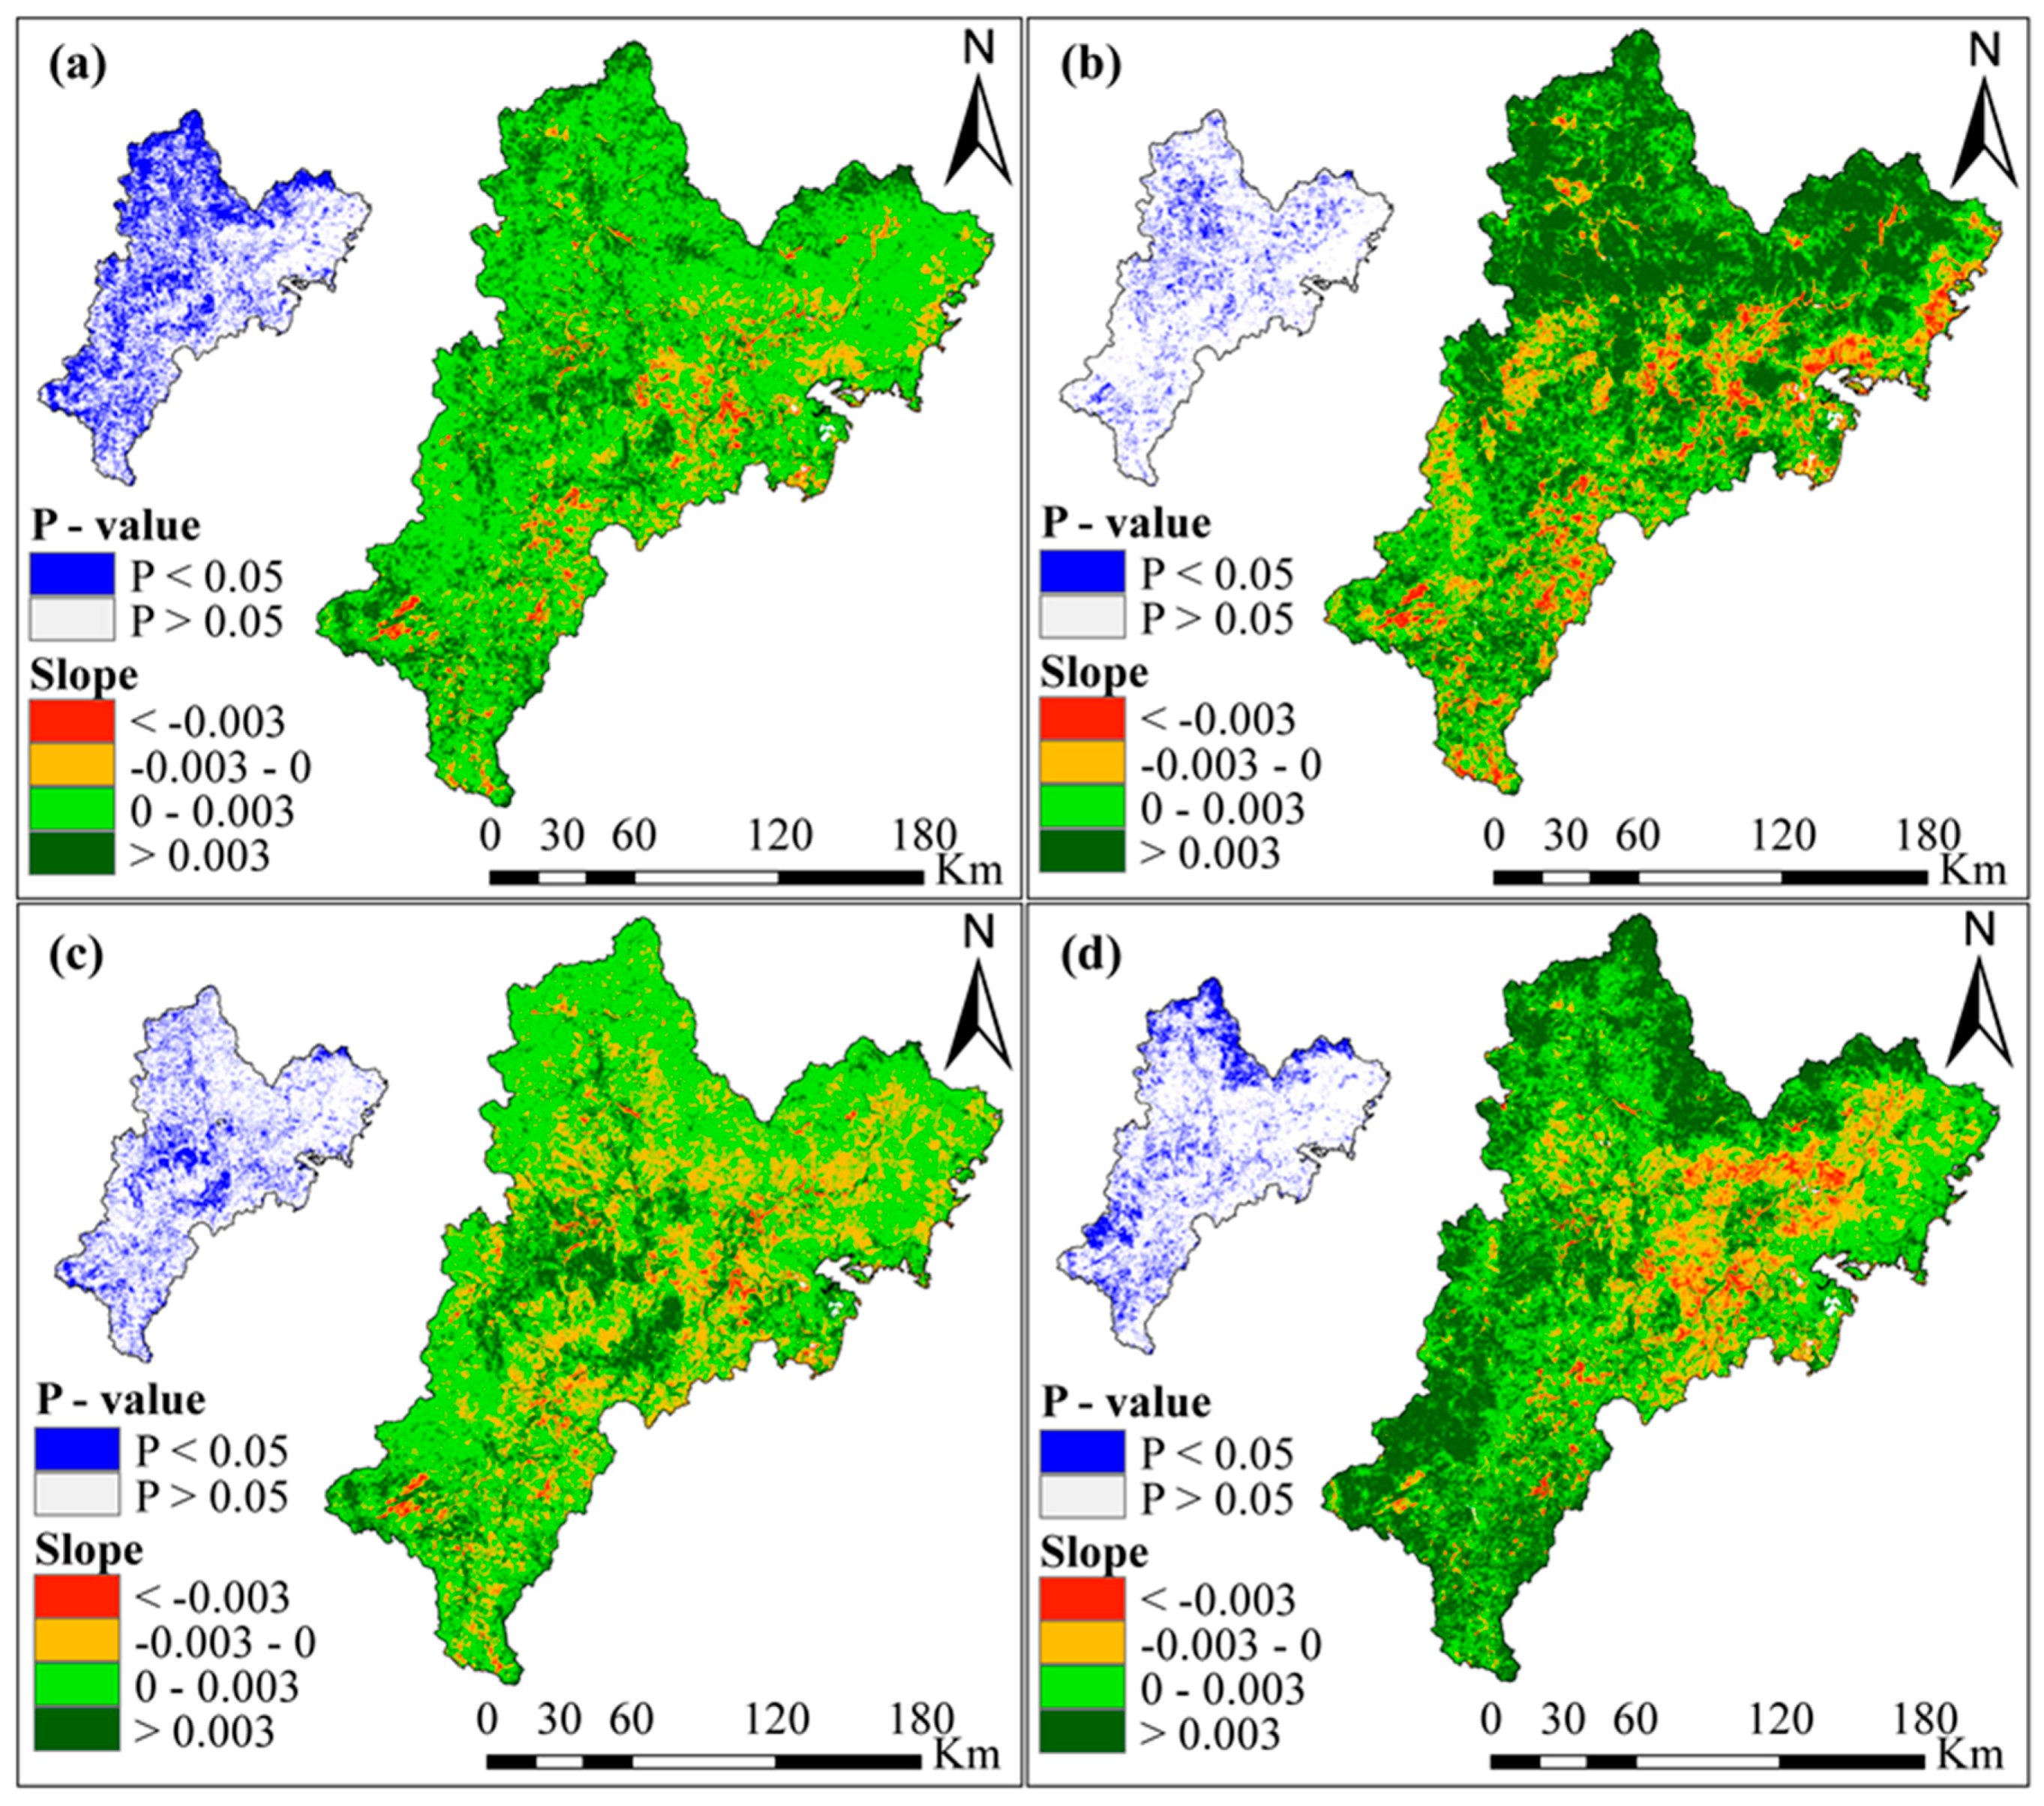
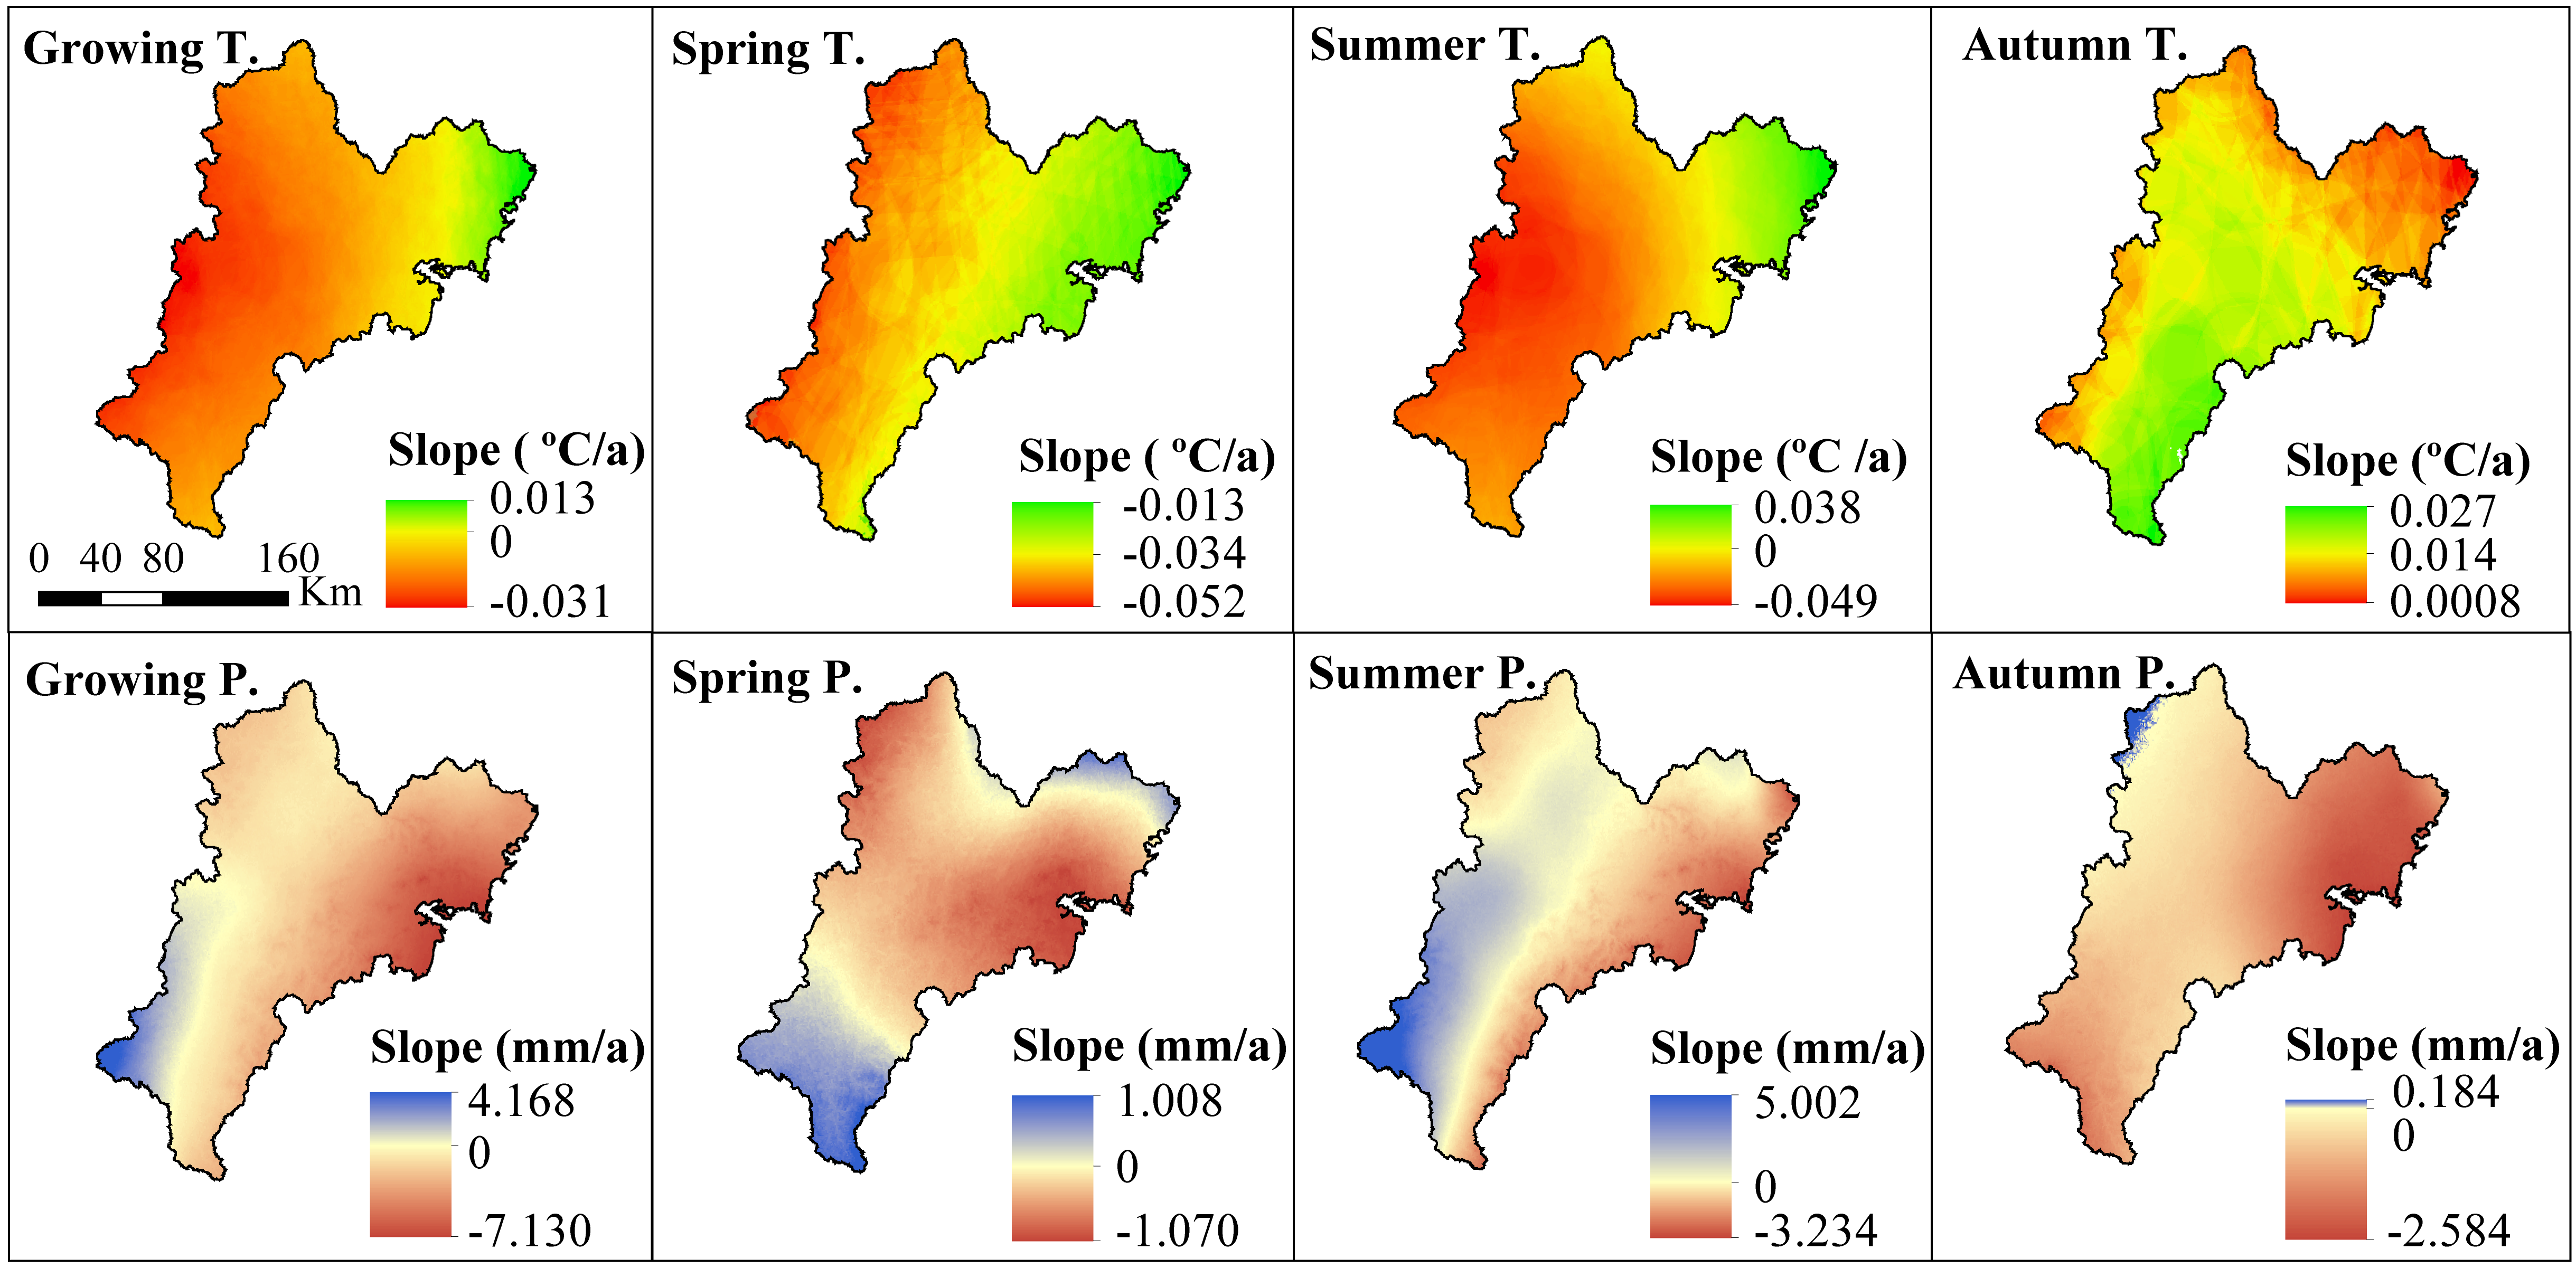
4.1.3. Seasonal Climatic Trends in Spatial Variability

The spatial distribution of seasonal climatic trends between 2000 and 2015 are summarized in Figure 5; these data show that seasonal temperature and precipitation do not coincide well with one another. Significant trends in temperature and precipitation throughout all seasons were not detected for 16 years in the TRB.
The temperature changes can be characterized by a range of different spatial trends across all seasons (Figure 5). These variables are increased, for example, during the growing season including into the summer in some parts of the Russian TRB, decreased in other areas, and the decrease trend in growing season, spring and summer remained high across the eastern to western region of the study area. At the same time, data shows that spring temperature has decreased over the whole study area and the rate of reduction remained mainly small across the western to eastern regions of the study area. However, temperature in the autumn increased over whole study area, and a large increase was observed from the northern to southern areas of the TRB.
The precipitation changes also show the different spatial trends across all seasons (Figure 5). Precipitation during the growing season is characterized by a marked increase in the southwestern area of the basin, although this mainly decreased in most areas and was especially marked from the west to the east across the study area. Increasing spring and summer precipitation levels mainly occurred in high-altitude areas in the southwest of the study area, mirrored by a decreasing trend that predominated in low-altitude regions of the northeast. Autumn is mostly characterized by a reduction in precipitation across most areas, a trend that is especially marked in western to northeastern low-altitude parts of the TRB.

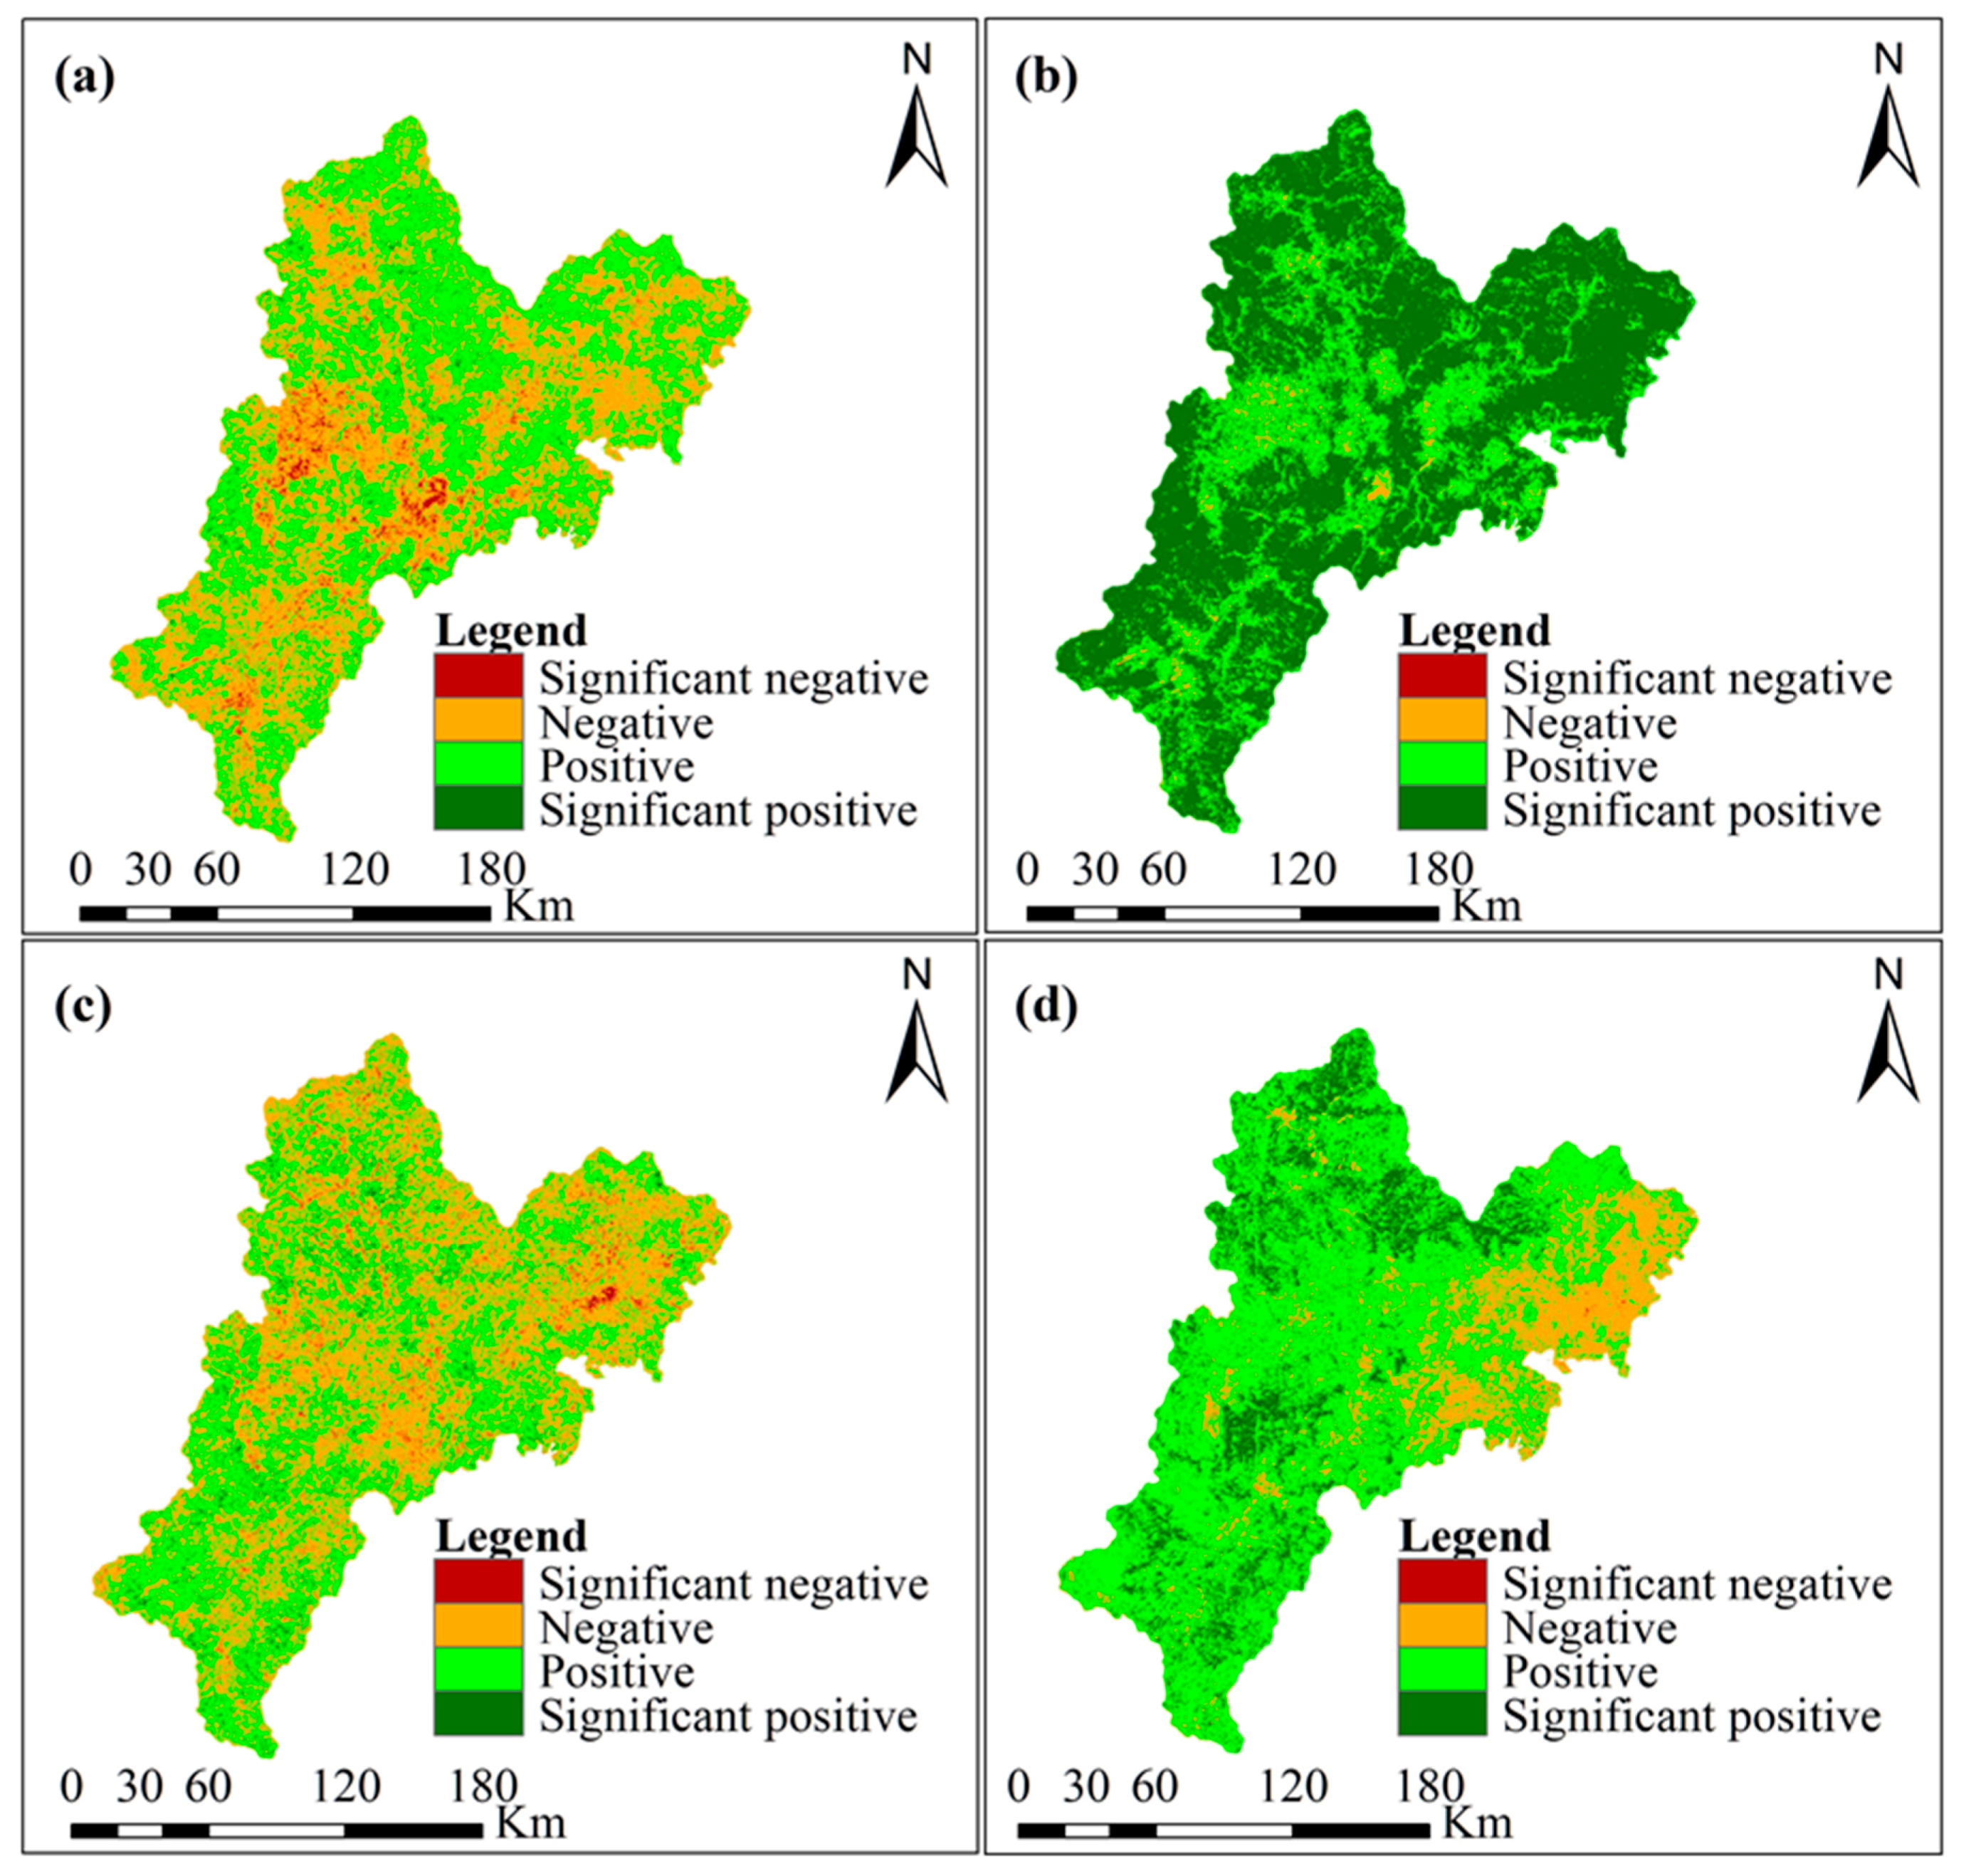
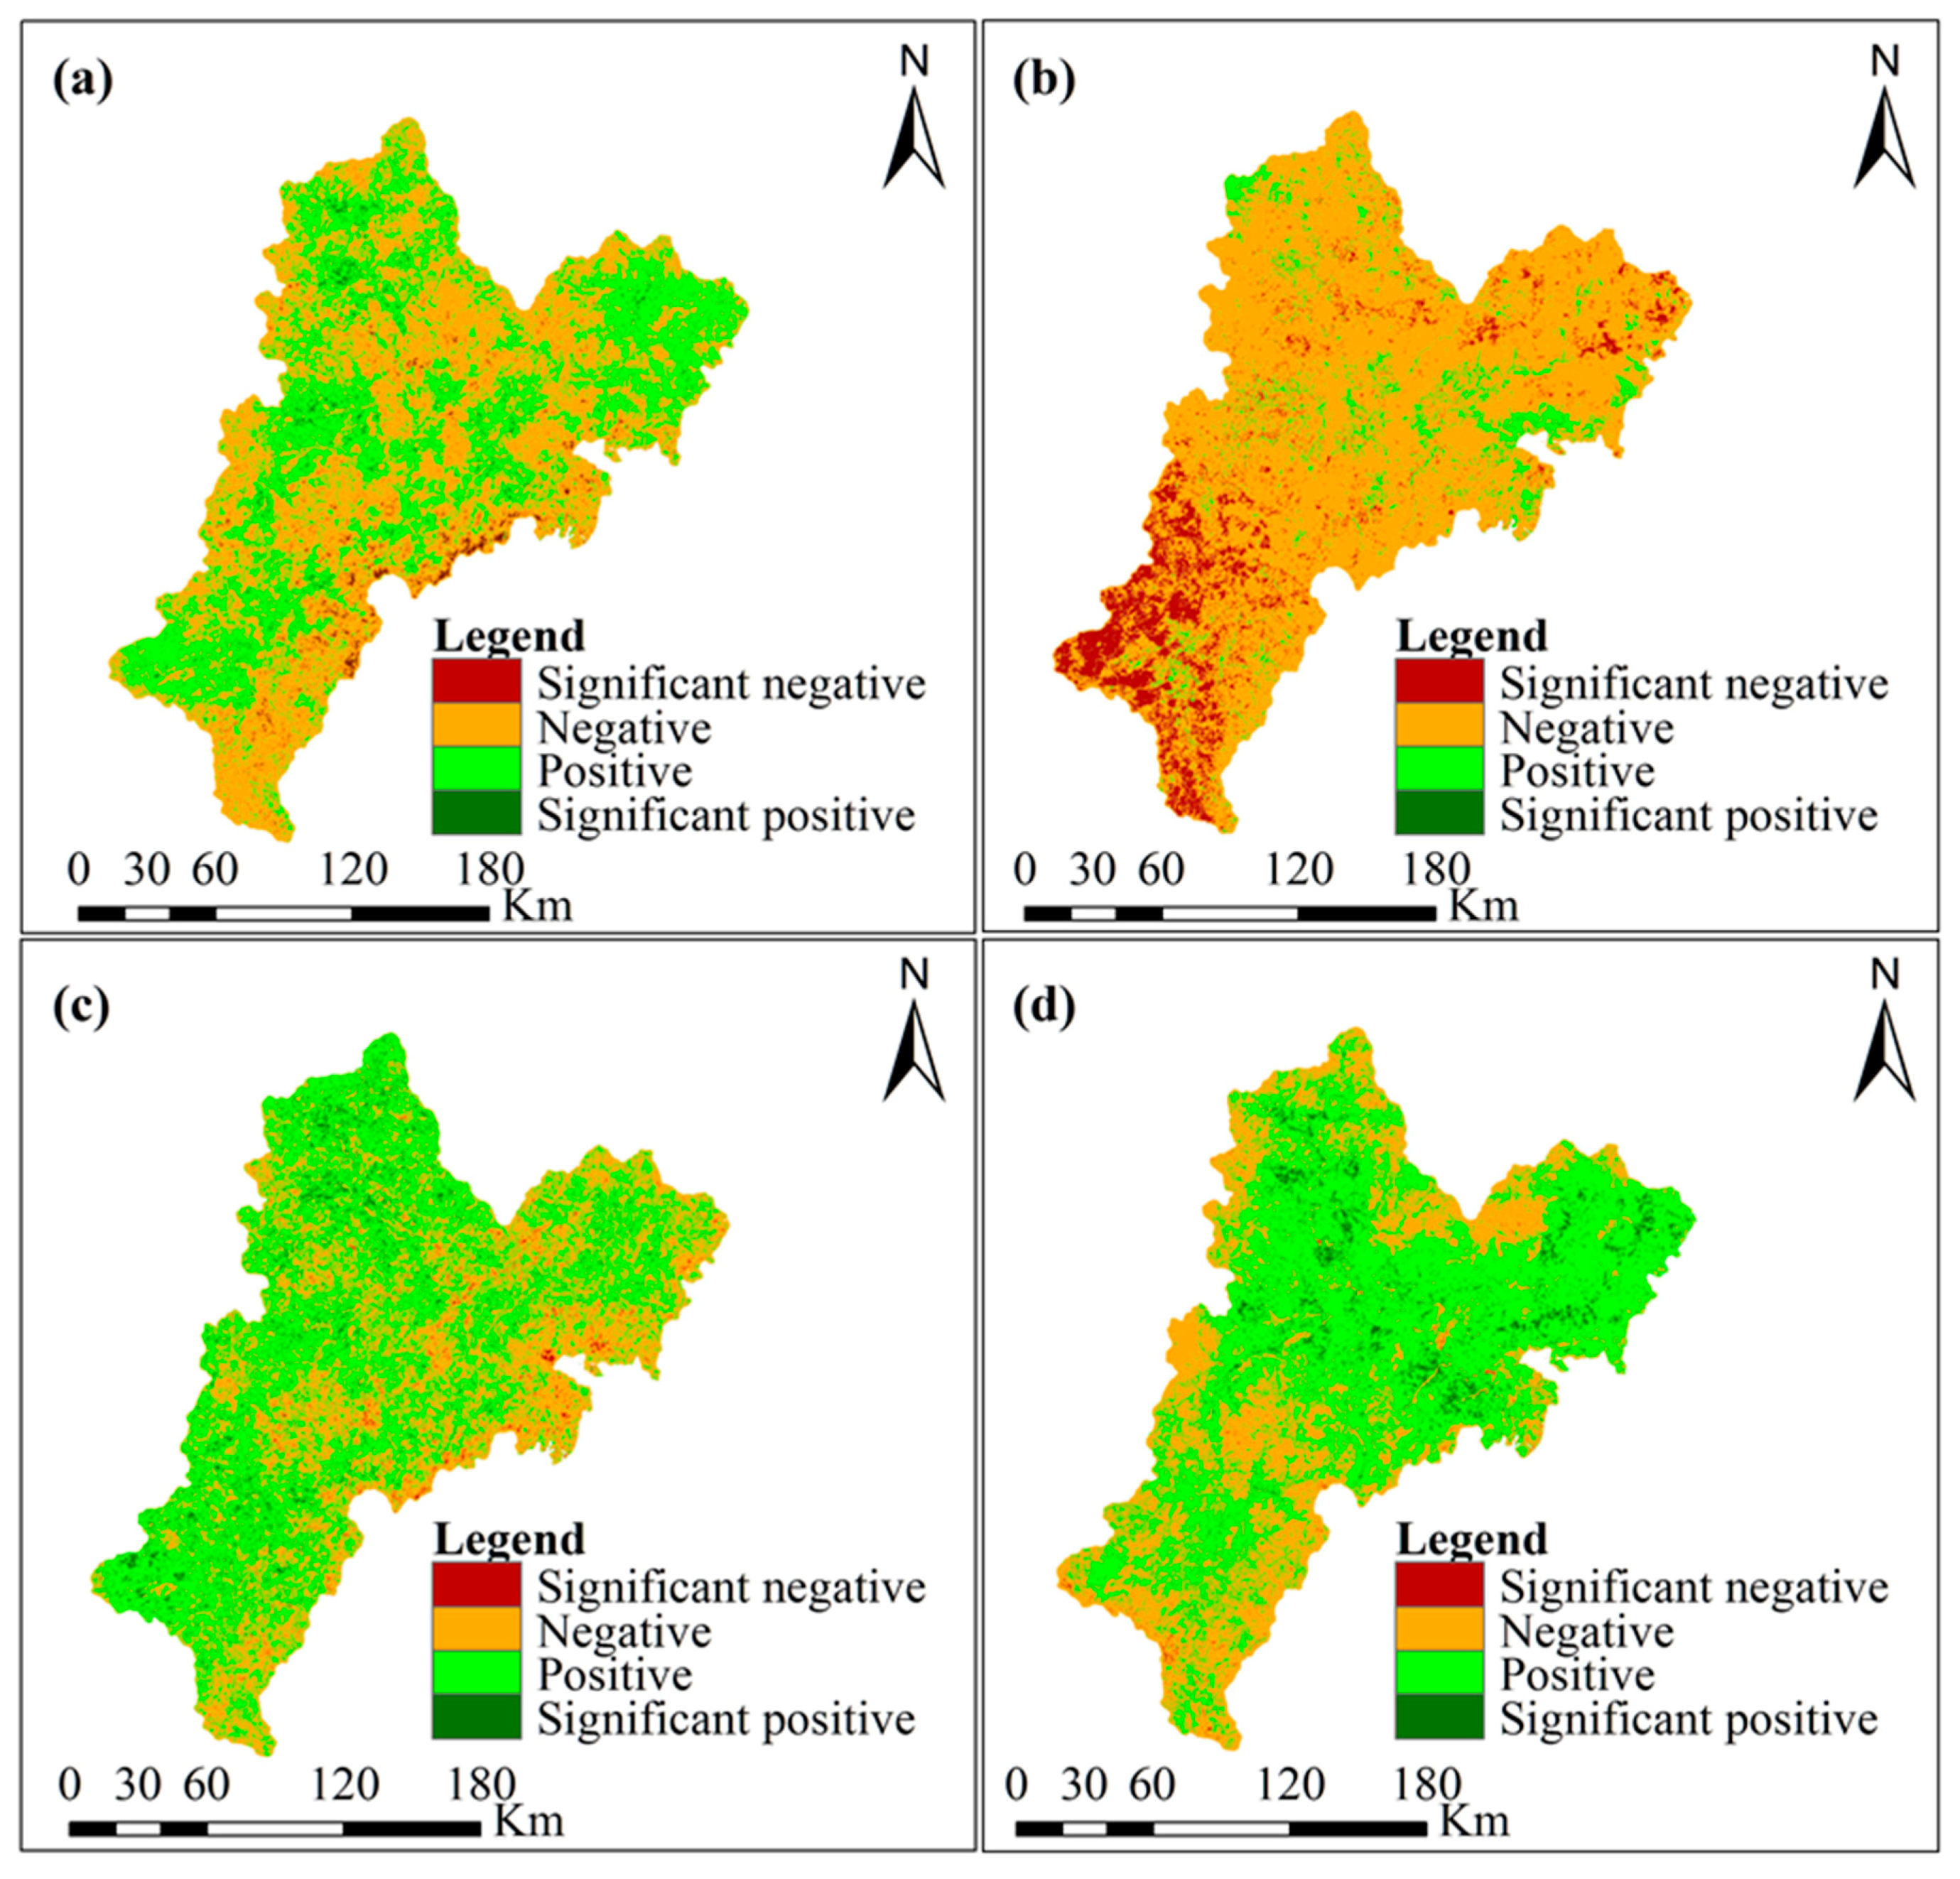
4.2. The Effects of Climate Variability on the NDVI

The effects of climate variability on NDVI trend during different periods of the growing season were explored. Thus, as discussed, the relationship between NDVI and climatic factors from 2000 to 2015 were investigated using Pearson correlation coefficients. It is noteworthy that previous studies to address changes in vegetation have demonstrated close relationships with climatic variations at global or regional scale [45]; temperature and precipitation are known to be the most significant factors influencing variation in the NDVI. Correlation coefficients between the NDVI and temperature and precipitation were calculated for each pixel to determine spatial correlation between variables (i.e., the effects of temperature and precipitation) within the TRB between 2000 and 2015 (Figure 6 and Figure 7). As noted above, a significant correlation between the NDVI and a climatic variable was accepted when the relevant p-value exceeded the 95% confident interval.
The results of these comparisons show that the overall proportion of positive correlations with respect to NDVI was greater than that for negative correlations throughout the growing season over the 16 years evaluated in this study (Figure 6a). Correlations between NDVI and temperature in the spring and autumn were positive across a large proportion of the TRB and this positive correlation in the summer was lower than in either spring or autumn seasons. The corresponding area of positive TRB correlations in the spring and autumn seasons were 97.81% (68.59% significant) and 83.69% (16.86% significant), respectively, while this positive correlation occurs in 52.85% (significant for 2.31%) of the region in the summer. These data clearly indicate that temperature and the NDVI are closely related to one another within the TRB. Indeed, temperature appears to be the dominant factor influencing vegetation growth within the TRB to a greater and more significant extent in the spring and autumn.
The results of this study highlight a positive correlation between the NDVI and temperature throughout the growing season in 54.06% of the study area, and that this is significantly correlated in 0.86% of the region. This outcome suggests that temperature influences the growth of vegetation throughout the TRB during the whole growing season, but at a low level of significance. Figure 7 highlights the distribution pattern of correlation coefficients between seasonal mean NDVI and total precipitation.
Data show that both positive and negative correlations between the NDVI and precipitation during the growing season as well as in the summer and autumn coexisted across the study area between 2000 and 2015. A positive correlation between NDVI and summer precipitation characterizes 62.25% of the TRB, of which 3.64% is significant (p < 0.05). A significant positive correlation is seen mostly in the western areas of the TRB, while in the autumn, such a correlation between NDVI and precipitation occurs in 66.2% (significant in 3.8%) of the study area, mainly in the northern TRB. In contrast, values for the spring tend to be negatively correlated across most of the area, encompassing 90.62% (significantly negative in 11.92%) of the total TRB area. Results also show that an area of 45.46% of the TRB (significantly correlated in 1.93%) is positively correlated with precipitation throughout the entire growing season, concentrated mainly in low-altitude regions of cropland and around them. These results imply that the significant role of precipitation to NDVI change during the growing season and the summer is larger than that of temperature within the TRB. In addition, the impact of temperature on NDVI changes during the spring and autumn is greater than that of precipitation.

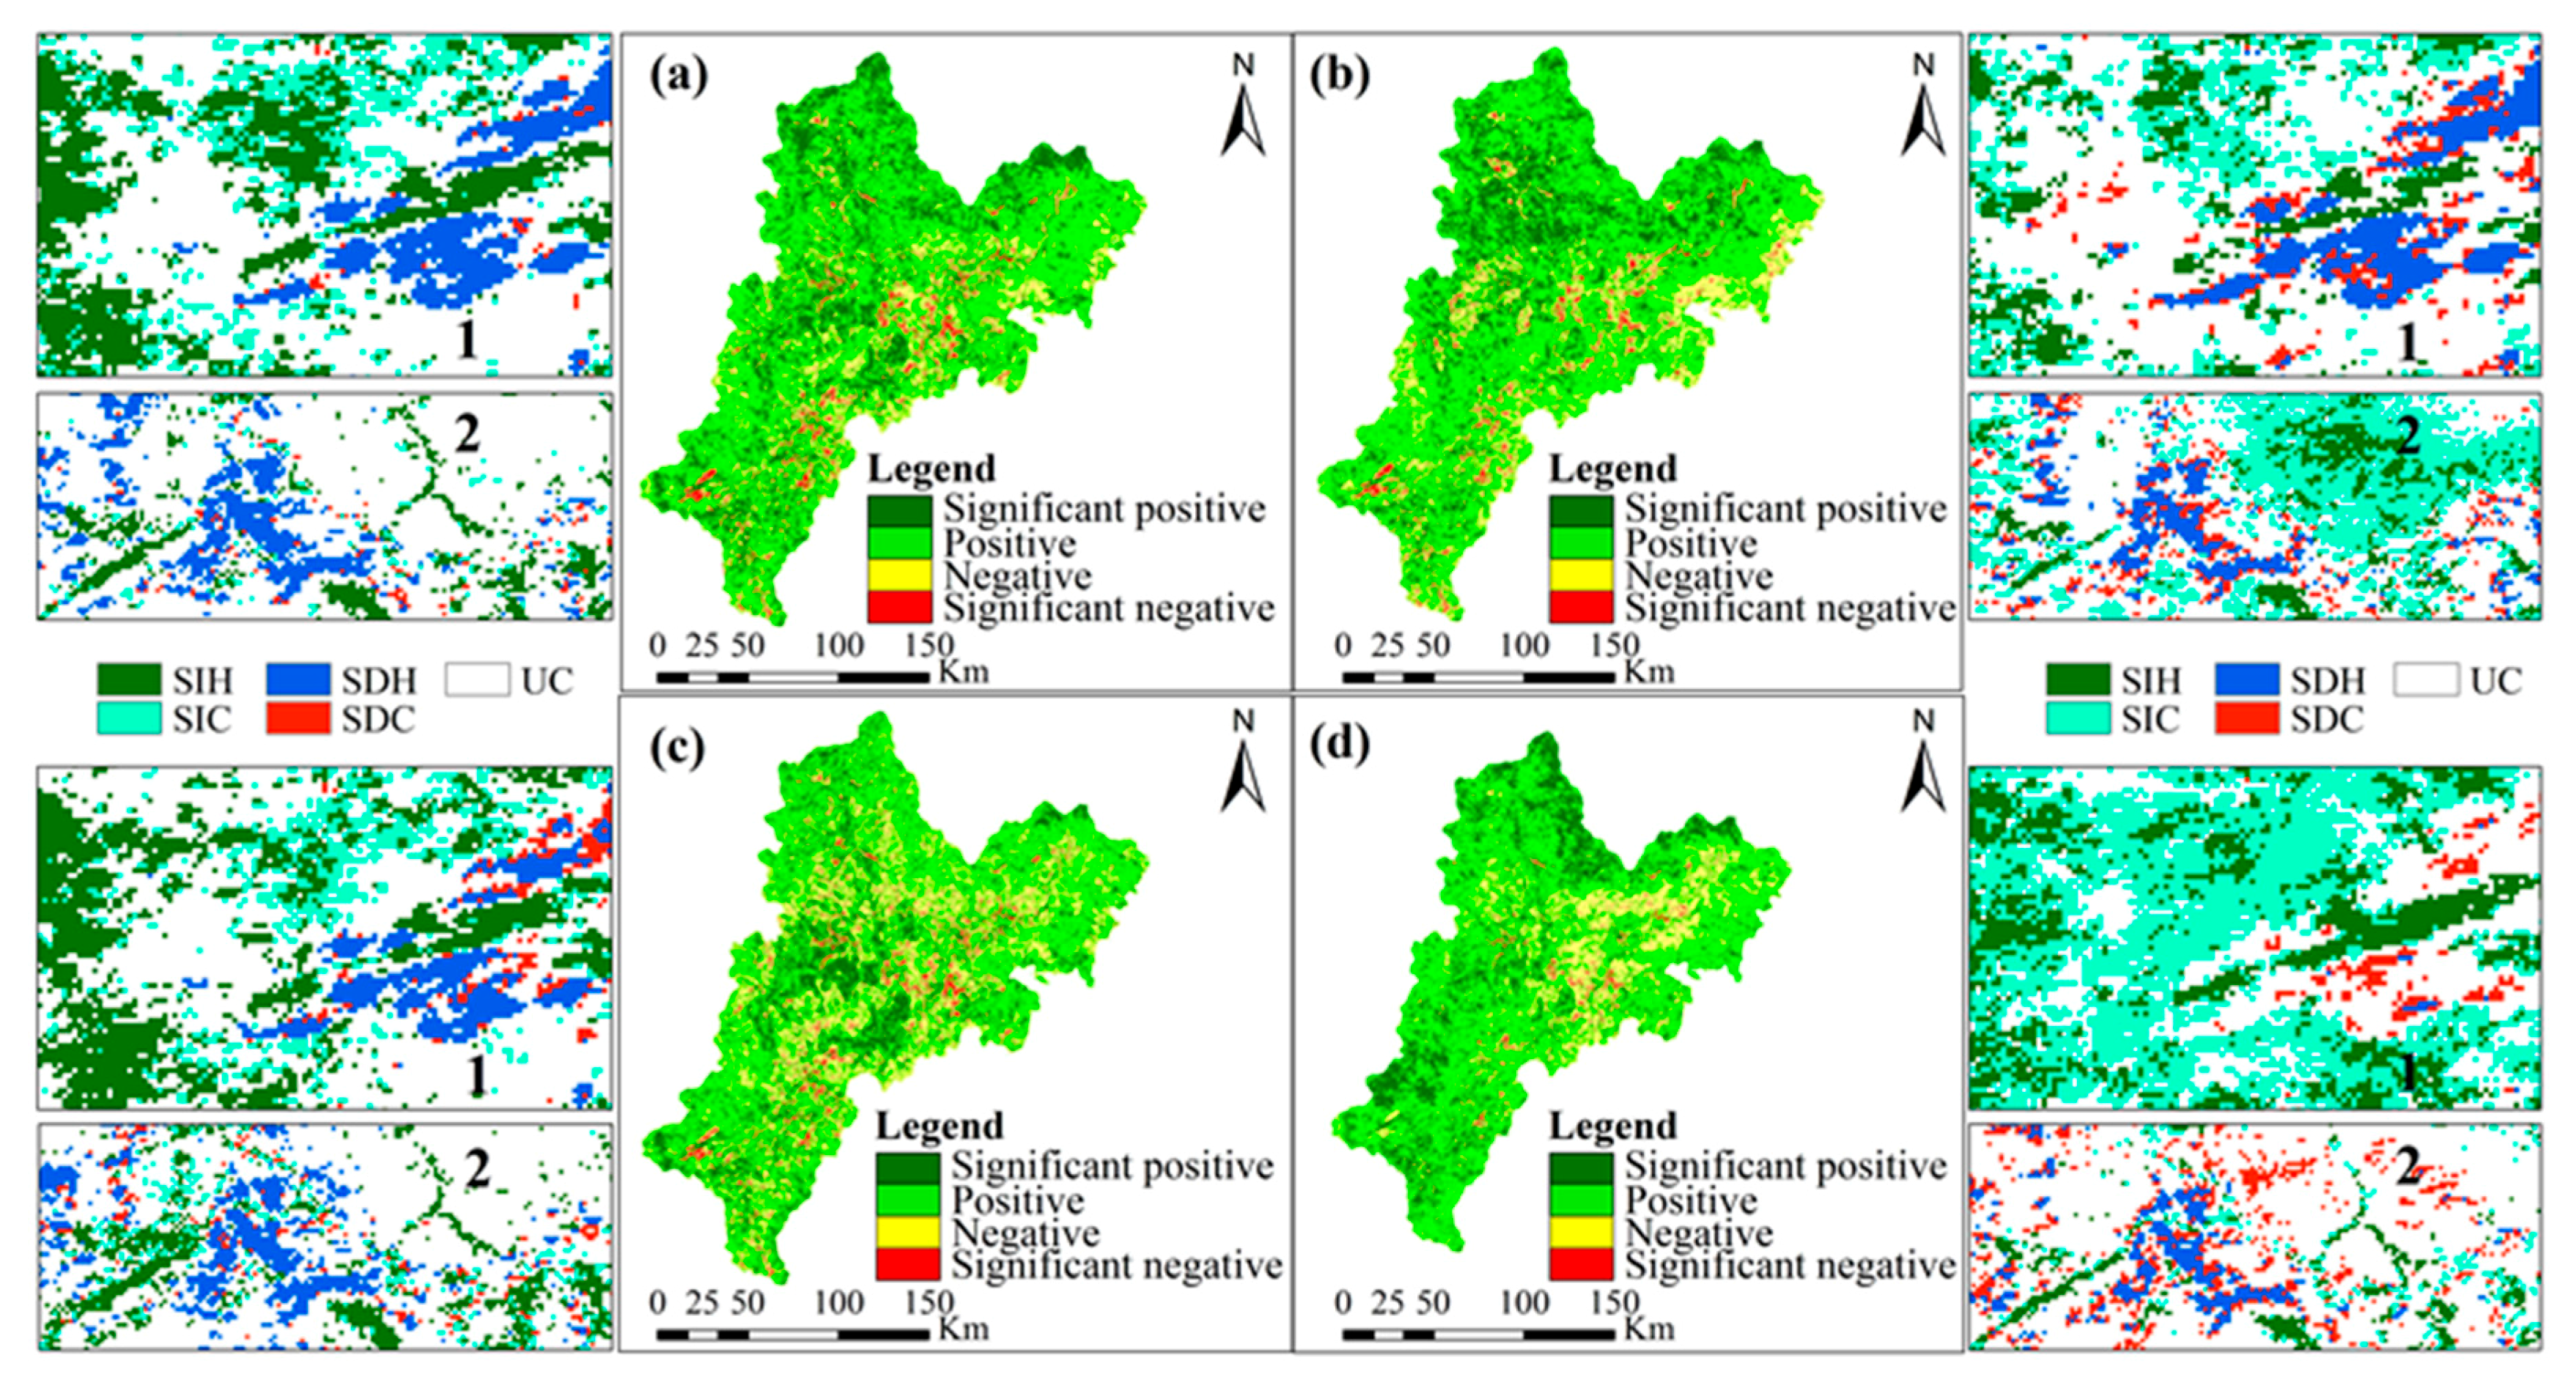
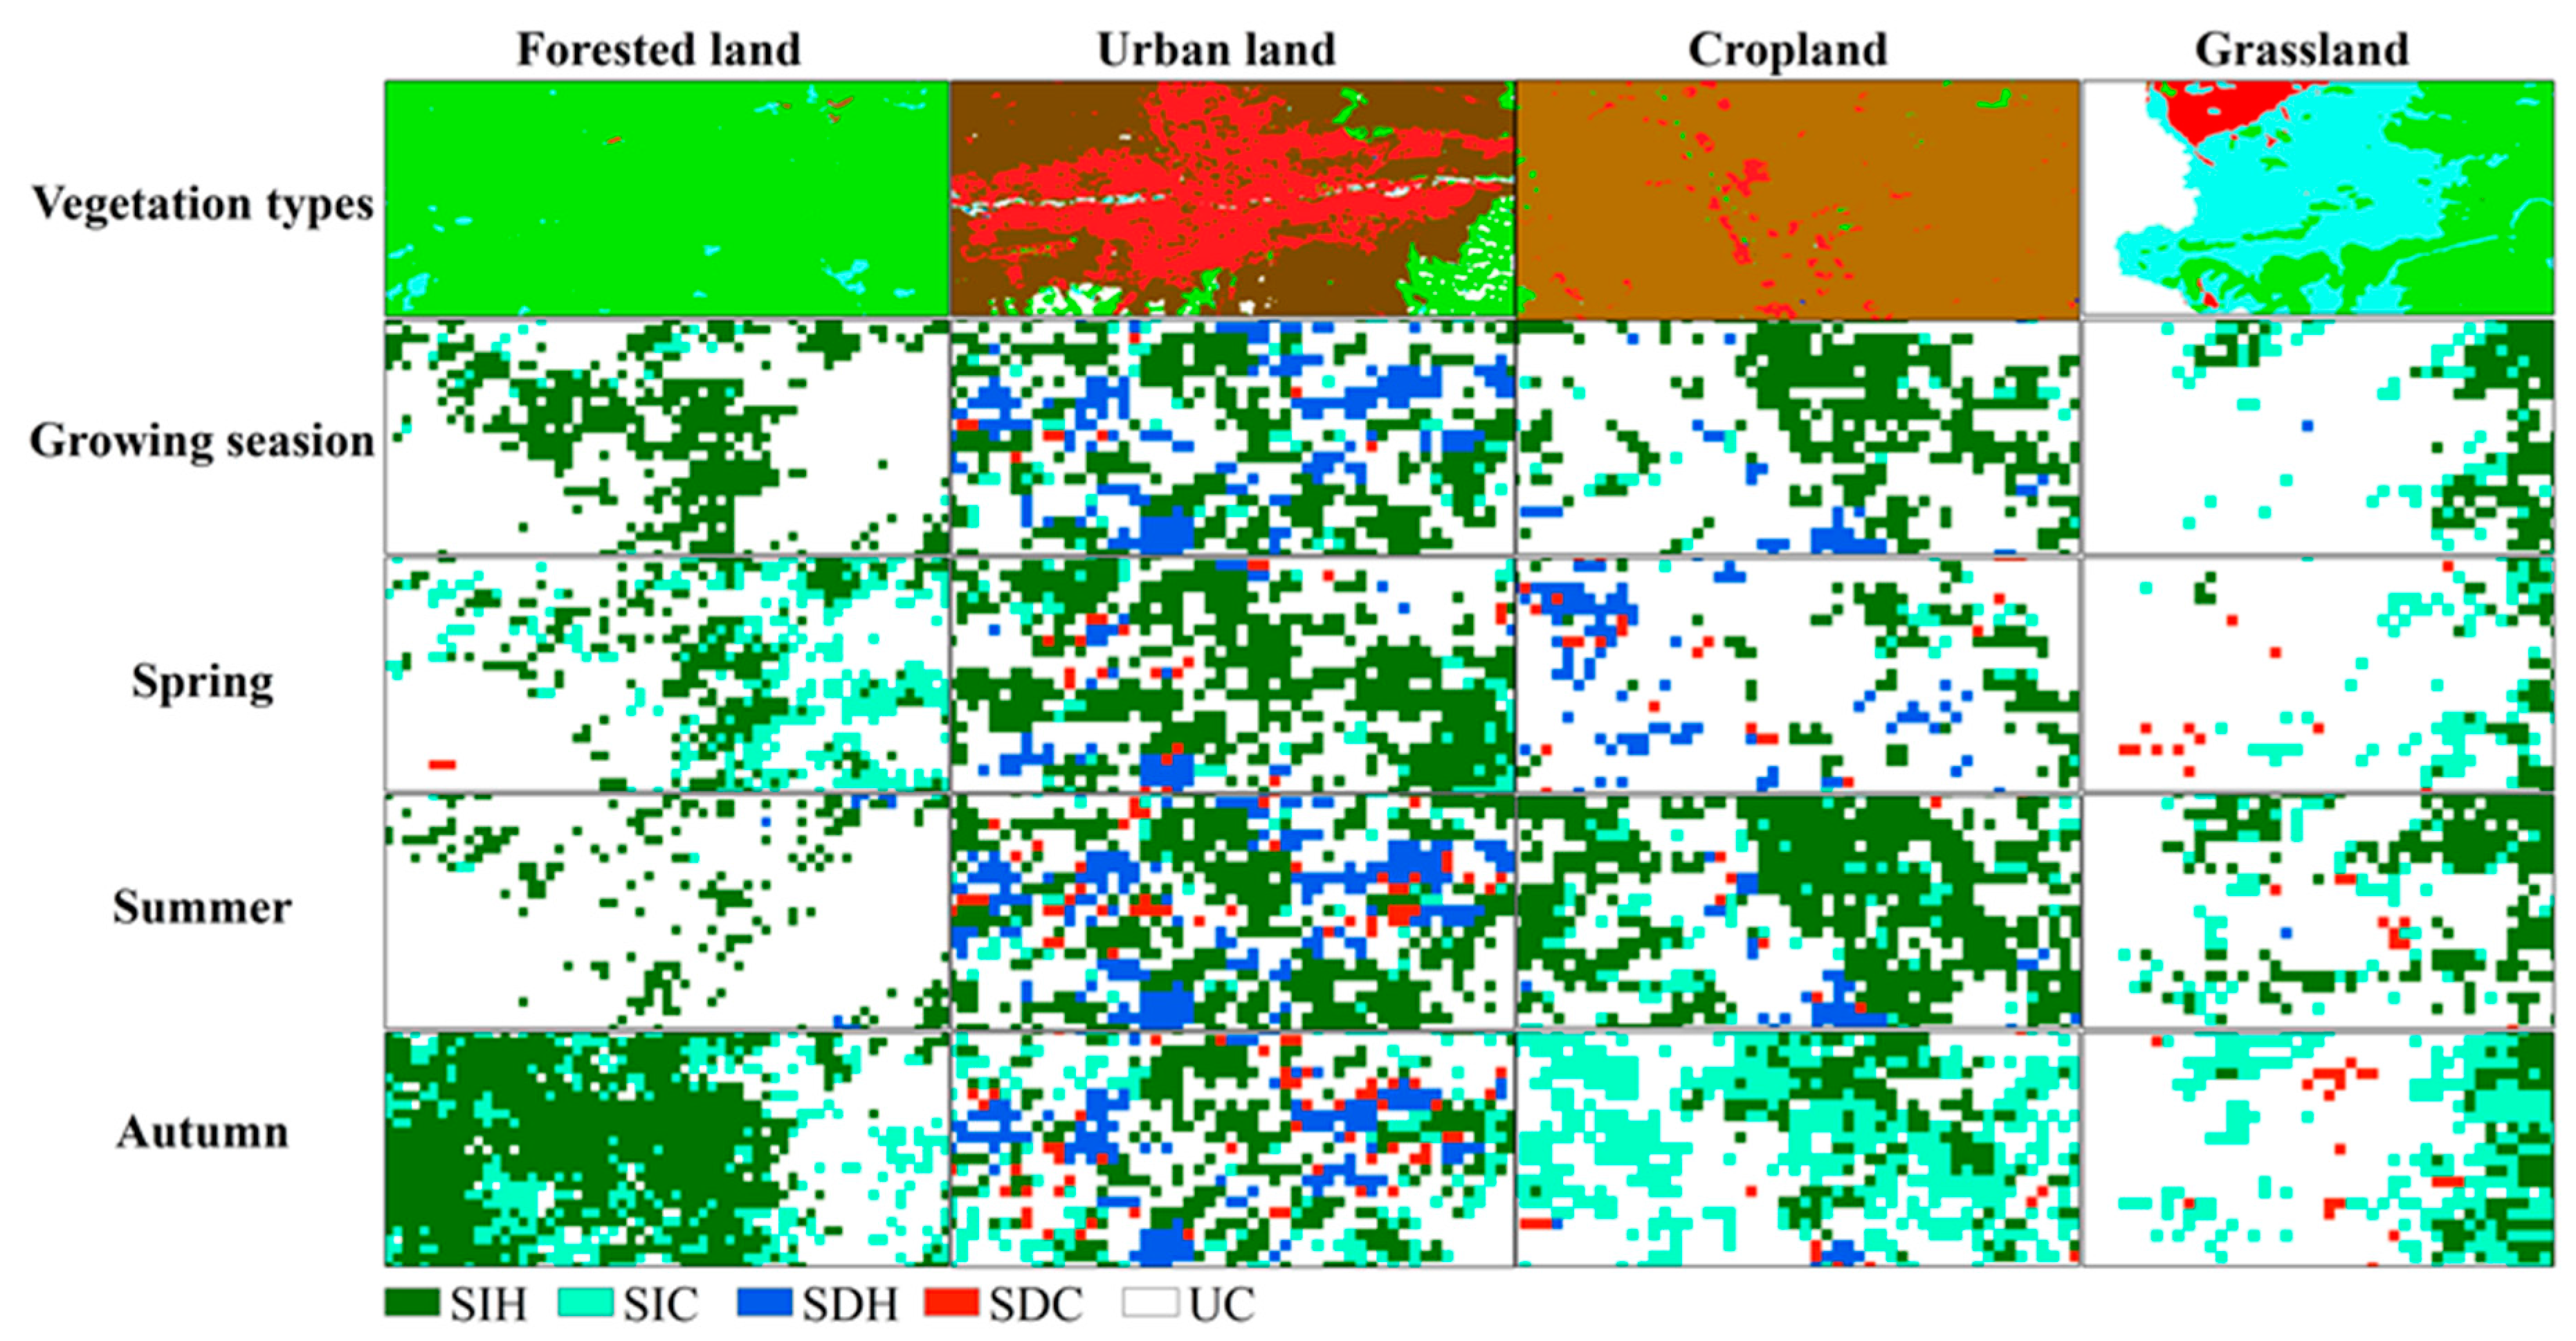
4.3. Trends in the Influence of Human Activities during the Growing Season over the Last 16 Years

A range of environmental protection initiatives including human activities and ecological restoration have also contributed to changes in the NDVI within the TRB in addition to temperature and precipitation. This means that regions where no significant positive correlation between this index and climatic factors is present can be influenced by anthropogenic effects [18,31]. A significant decreasing trend in residuals indicates the human-induced vegetation degradation [20,22]. Thus, an analysis of residual NDVI values that are not explained by climatic change over time can provide additional information on the land degradation process [40]. Human-induced vegetation changes in regions that are characterized by significant negative or positive trends in the residual NDVI at p-value less than 0.05 were evaluated using the RESTREND method incorporating mean temperature and cumulative precipitation. This was done at the level of individual pixels across the study area as NDVI changes are positively correlated with both temperature and precipitation in the TRB, and so p-values based on an F test were calculated in each case. Finally, in order to map significant changes in the NDVI as a result of human activity, residual and p-value maps were overlapped with one another for the growing season and for other times throughout the year. Significant changes in residual NDVI due to human activities at different times throughout the growing seasons are shown in Figure 8. The figure on the left and right rows (1 and 2) in Figure 8 shows the associations between climate and anthropogenic factors in these regions during different seasons, respectively in the study area.
Otherwise, Figure 9 shows the associations between climate and anthropogenic factors for different vegetation types, which was selected randomly.
Results show that areas characterized by both significant negative and positive residual trends coexisted in the study area over 16 years (Figure 8 and Table 3).
In entire study area, trends in residual NDVI for the growing season as well as for the spring, summer, and autumn increased at averages of 0.0012/year, 0.0024/year, 0.0009/year, and 0.0022/year, respectively, over 16 years. This result means that human activities continue to have an enhanced influence on NDVI across all seasons even though areas characterized by a significant positive change in Russia had lower values than in China and DPR Korea. Data also indicate a more marked effect of human activities on vegetation regeneration in these latter regions than in Russia and highlight the fact that anthropogenic vegetation regeneration in the autumn and spring was more significant than in the summer (Table 3). Regions that were significantly enhanced by this process were mainly forested land (in spring and autumn) and farmland (in summer) (e.g., Figure 9). While significant reductions in NDVI residuals (i.e., degradation areas) in spring and summer were more intensive than that in autumn. A significant reduction throughout the growing and other seasons tended to occur adjacent to farmland and urban land in the Korean and Chinese sectors of the TRB (e.g., Figure 9). The significantly negative trend was seen in the Korean region compared to the other seasons.

5. Discussion

It is generally acknowledged that since the 1980s vegetation greenness has tended to increase at both global and continental scales [46]. The growing season NDVI increased continuously during the period 2001–2012, in China [3]. The data presented in this paper show that within the TRB, values for the NDVI in the whole growing season as well as the spring, summer, and autumn have tended to significantly increase overall, encompassing 36.93%, 10.56%, 18.91%, and 20.13% of the whole area, respectively, over the last 16 years. Spring NDVI exhibited the fastest increase at 0.0022/year in the TRB. That was also found in previous studies; in eastern China previous studies have reported that the fastest increase in NDVI has occurred in spring over the last two decades of the 20th century [47]. NDVI change trend greatly differs by vegetation type [48]. In our study, area, NDVI trend in spring and autumn increased strongly in forested land, but the was a significantly increased trend in summer NDVI, which occurred mainly in cropland area (Figure 4).
The use of multiple LRMs based on relationships between climatic and other topographic factors have proved useful in areas of mountainous terrain [9] and can be utilized to further describe the spatial distribution of temperature and precipitation within the TRB.
Climate is one of the most important factors controlling plant growth globally; a closely correlated relationship between weather variables and vegetation growth has been captured in previous studies [29,47,48,49] and is consistent with present results. However, previous research results [8] showed that the vegetation growth was variously and significantly affected by temperature or precipitation in different periods. In our study area, both temperature and precipitation have differently influenced on NDVI increases in every season; the impact of temperature on NDVI change during the spring and autumn has been higher than precipitation within the TRB. Spring temperature and spring NDVI had a strong significant positive correlation in comparison with other seasons, especially in the forested area (Figure 6b). This is consistent with the results of Zhang et al. (2013) [47], in the semi-humid to humid areas of eastern China during the period 1982–2006. It might be that most of the existing vegetation types could be sensitive to spring temperature. Autumn temperature and NDVI had also a high positive correlation in the most of the TRB. Autumn is a pleasant season with cool climate in the study area, and the raising temperature in this season played positive role in NDVI growth and the lengthening of growing season. For precipitation, the influence of precipitation on variations of this index during the growing season and summer has been more significant than that of temperature. Autumn precipitation had also a positive relationship, with the significant area of 3.8%. Therefore, the growing season NDVI in the study area was primarily affected by autumn and summer precipitation, rather than that by spring. In contrast, the precipitation in spring showed a negative correlation with the NDVI in most of the TRB area. The lower relative precipitation during this season might have a small contribution towards NDVI variation. Temperature and other socio-economic variables, such as human activities (e.g., reforestation and agricultural practices), contributed more than precipitation of the study area within past 16-year scenarios (Figure 6, Figure 7b and Figure 8b). That might be a reason that it shows a negative correlation with precipitation. These results show that the overall growth of this index across the whole growing season was not significantly affected by these climatic variables when the whole TRB region is taken into account. This result suggests that vegetation change cannot be fully explained by climatic factors in the entire TRB region, in addition to temperature and precipitation, environmental protection initiatives including anthropogenic activities and ecological restoration have also contributed to NDVI changes especially in regions where significant positive correlations with climatic factors were not recovered [18,31].
In order to distinguish human-induced vegetation changes from those driven by climate variability, the RESTREND analysis has been used widely in a lot of studies [19,20,21,22]. He et al. (2015) [21] used the RESTREND method to distinguish grassland degradation due to climatic variations from that caused by human activities in semi-arid and semi-humid regions. The TRB can be characterized as semi-humid or humid [24,25] which differs depending on the season. The results of this study show that RESTREND analysis utilizing temperature and precipitation was effective for the division of climatic and human drivers of vegetation degradation across the TRB because growth in the NDVI as a result of climate characterizes this region. Results show that human-induced vegetation regeneration in the spring and autumn was larger than in the summer season in the entire TRB and the human effects on vegetation duration in spring and summer were stronger than that in autumn. The results from different seasons indicate that human activities have a significant positive influence on vegetation changes over the same period, especially in Chinese and Korean parts of the basin (Figure 8). Ecological restoration programming, such as afforestation or reforestation was the major human activity in these regions, which was more intense in the Chinese region of the basin than in the Korean part. For instance, human-induced vegetation growth in spring and autumn mainly appeared in forested areas, which is mainly in the Chinese area of the TRB, and a large area of cropland was positively influenced by human activities in summer, while the degraded areas were mostly seen in, or near to, farmland and urban land in the lower-altitude sectors of the basin. Previous studies have also demonstrated increases in farmland area as well as reductions in forested land and grassland due to concomitant increases in human activity in some regions of the TRB over the last 30 years [50]. This is likely to be a significant cause of land degradation, because of anthropogenic factors such as urbanization, agricultural activities and road construction.
This study focused only on changes in NDVI trends and their relationship with climate variability and human activities across the entire basin. Thus, the effects of these factors on vegetation changes at the level of different foliage types were not considered and regional differences in the forces driving NDVI change at the level of different countries were also not taken into account. The RESTREND method estimates other factors than climate factors, including a human-induced influence of vegetation changes. Excluding climatic factors, vegetation degradation could result from a number of sources such as natural disturbances (e.g., severe droughts or floods) and human activities (e.g., deforestation, agriculture, urbanization, and land reclamation). Natural disturbances mainly cause short-lived changes, however, while human activities tend to lead to more abrupt perturbations [51], a further issue which was not explored in this research. Thus, there are still some challenges for future studies to quantitatively analyze the types of human factors and natural disturbances. Random Forest (RF) method was used to estimate quantitative relationships between ground-based RWI, climate, and phenological metrics derived from NDVI time series in the latest research [39]. It is a multivariate non-parametric regression method based on a machine learning algorithms. It needs sampling data for training. In our study, we used only the relationships between NDVI and climate variability, due to limitation of relevant observation data. In order to estimate quantitatively the various driving forces on vegetation dynamics, collection of sampling data and application of RF method is required, which needs further study in the future.

6. Conclusions

Linear regression in combination with Pearson correlation and residual trend analyses were applied in this study to evaluate the driving forces in vegetation dynamics during the growing season and at different encapsulated time periods between 2000 and 2015. The results of this study revealed clear spatial patterns of increasing and decreasing vegetation cover across the TRB within the growing season over a period of 16 years. Although increases in vegetation characterize most of the TRB, both significant increases and decreases in the NDVI during different periods of the growing season were also seen in parts of China and DPR Korea over the course of the study period. The forested area showed the largest significant increasing trend, with an average increment of 0.0021/year over the entire basin area. Mean temperature of the growing season across the whole basin as well as the spring and summer has decreased at mean rates of −0.015 °C/year, −0.035 °C/year, and −0.021 °C/year, respectively. Similarly, mean autumn temperature has increased at a mean rate of 0.014 °C/year, while annual total precipitation has decreased over all periods of the growing season. However, these trends in both temperature and precipitation were not statistically significant in any of the seasons.
Both climatic factors and human activities are responsible for seasonal variations in vegetation change within the TRB. However, human activities’ influence on vegetation change was a more dominant factor than climate variability in growing season as well as in summer and autumn. Among climatic factors, precipitation has played a more significant role in increasing NDVI values during the growing season and summer, eclipsing the effect of temperature. In contrast, the influence of temperature on NDVI changes during the spring and autumn has been higher than precipitation. These results clearly indicate that the role of these two climatic variables change depending on the season. Areas of vegetation degradation due to human activities seen during the growing season and throughout the other seasons tested in this study tend to occur adjacent to farmland and urban land with the Korean and Chinese regions of this basin. The summertime is characterized by a larger and more significant amount of vegetation degradation by human activities than the spring and autumn, encompassing 3.28% of the whole basin area. The results of our study showed that the RESTREND method can be used in similar regions to our study area. We hope that the results of this study offer important baseline data for the environmental protection of the TRB.

Acknowledgments

This research was supported by the Chinese Government Scholarship for international PhD students and the Key Research Program of the Chinese Academy of Sciences (Grant No. ZDRW-ZS-2016-6-4). The authors are grateful to the editor and anonymous reviewers for their constructive comments and suggestions.

Author Contributions

Yili Zhang, Cholhyok Kang and Yilgwang Jo had the original idea for this research, and Yili Zhang, Linshan Liu, Zhaofeng Wang and Cholhyok Kang designed the research. Cholhyok Kang and Huamin Zhang were responsible for data collecting and preparation. Cholhyok Kang analyzed data and wrote the paper.

Conflicts of Interest

The authors declare no conflict of interest.

References

  1. Peng, J.; Liu, Z.H.; Liu, Y.H.; Wu, J.S.; Han, Y.N. Trend analysis of vegetation dynamics in Qinghai-Tibet Plateau using Hurst Exponent. Ecol. Indic. 2012, 14, 28–39. [Google Scholar] [CrossRef]
  2. Ning, T.T.; Liu, W.Z.; Lin, W.; Song, X.Q. NDVI variation and its responses to climate change on the northern Loess Plateau of China from 1998 to 2012. Adv. Meteorol. 2015, 2015, 725427. [Google Scholar] [CrossRef]
  3. Liu, X.F.; Zhu, X.F.; Li, S.S.; Liu, Y.X.; Pan, Y.Z. Changes in growing season vegetation and their associated driving forces in China during 2001–2012. Remote Sens. 2015, 7, 15517–15535. [Google Scholar] [CrossRef]
  4. Eckert, S.; Hüsler, F.; Liniger, H.; Hodel, E. Trend analysis of MODIS NDVI time series for detecting land degradation and regeneration in Mongolia. J. Arid Environ. 2015, 113, 16–28. [Google Scholar] [CrossRef]
  5. Ichii, K.; Kawabata, A.; Yamaguchi, Y. Global correlation analysis for NDVI and climatic variables and NDVI trends: 1982–1990. Int. J. Remote Sens. 2002, 23, 3873–3878. [Google Scholar] [CrossRef]
  6. Jiapaer, G.; Liang, S.L.; Yi, Q.X.; Liu, J.P. Vegetation dynamics and responses to recent climate change in Xinjiang using leaf area index as an indicator. Ecol. Indic. 2015, 2015, 64–76. [Google Scholar] [CrossRef]
  7. Ding, M.J.; Zhang, Y.L.; Liu, L.S.; Zhang, W.; Wang, Z.F.; Bai, W.Q. The relationship between NDVI and precipitation on the Tibetan Plateau. J. Geogr. Sci. 2007, 17, 259–268. [Google Scholar] [CrossRef]
  8. Zhang, Y.L.; Gao, J.G.; Liu, L.S.; Wang, Z.F.; Ding, M.J.; Yang, X.C. NDVI-based vegetation changes and their responses to climate change from 1982 to 2011: A case study in the Koshi River Basin in the middle Himalayas. Glob. Planet. Chang. 2013, 108, 139–148. [Google Scholar] [CrossRef]
  9. Tang, Z.G.; Ma, J.H.; Peng, H.H.; Wang, S.H.; Wei, J.F. Spatiotemporal changes of vegetation and their responses to temperature and precipitation in upper Shiyang River Basin. Adv. Space Res. 2017, 60, 969–979. [Google Scholar] [CrossRef]
  10. Li, C.B.; Qi, J.G.; Yang, L.S.; Wang, S.B.; Yang, W.J.; Zhu, G.F.; Zou, S.B.; Zhang, F. Regional vegetation dynamics and its response to climate change—A case study in the Tao River Basin in Northwestern China. Environ. Res. Lett. 2014, 9, 125003. [Google Scholar] [CrossRef]
  11. Kawabata, A.; Ichii, K.; Yamaguchi, Y. Global monitoring of interannual changes in vegetation activities using NDVI and its relationships to temperature and precipitation. Int. J. Remote Sens. 2001, 22, 1377–1382. [Google Scholar] [CrossRef]
  12. Xiao, J.; Moody, A. Geographical distribution of global greening trends and their climatic correlates: 1982–1998. Int. J. Remote Sens. 2005, 26, 2371–2390. [Google Scholar] [CrossRef]
  13. Li, H.D.; Li, Y.K.; Gao, Y.Y.; Zou, C.X.; Yan, S.G.; Gao, J.X. Human impact on vegetation dynamics around Lhasa, Southern Tibetan Plateau, China. Sustainability 2016, 8, 1146. [Google Scholar] [CrossRef]
  14. Yang, Y.G.; Zhao, C.Y.; Han, M.; Li, Y.K.; Yang, R.H. Temporal patterns of shrub vegetation and variation with precipitation in Gurbantunggut Desert, Central Asia. Adv. Meteorol. 2015, 2015, 157245. [Google Scholar] [CrossRef]
  15. He, Y.H.; Guo, X.L.; Dixon, P.; Wilmshurst, J.F. NDVI variation and its relation to climate in Canadian ecozones. Can. Geogr. 2012, 56, 492–507. [Google Scholar] [CrossRef]
  16. Wang, T. Vegetation NDVI change and its relationship with climate change and human activities in Yulin, Shaanxi Province of China. J. Geosci. Environ. Prot. 2016, 4, 28–40. [Google Scholar] [CrossRef]
  17. Liu, Q.; Yang, Z.P.; Han, F.; Wang, Z.G.; Wang, C.R. NDVI-based vegetation dynamics and their response to recent climate change: A case study in the Tianshan Mountains, China. Environ. Earth Sci. 2016, 75, 1189. [Google Scholar] [CrossRef]
  18. Han, G.F.; Yang, Y.C.; Yan, S.Y. Vegetation activity trend and its relationship with climate change in the Three Gorges Area, China. Adv. Meteorol. 2013, 2013, 235378. [Google Scholar] [CrossRef]
  19. Li, A.; Wu, J.G.; Huang, J.H. Distinguishing between human-induced and climate-driven vegetation changes: A critical application of RESTREND in inner Mongolia. Landsc. Ecol. 2012, 27, 969–982. [Google Scholar] [CrossRef]
  20. Evans, J.; Geerken, R. Discrimination between climate and human-induced dryland degradation. J. Arid Environ. 2004, 57, 535–554. [Google Scholar] [CrossRef]
  21. He, C.Y.; Tian, J.; Gao, B.; Zhao, Y.Y. Differentiating climate-and human-induced drivers of grassland degradation in the Liao River Basin, China. Environ. Monit. Assess. 2015, 187, 4199. [Google Scholar] [CrossRef] [PubMed]
  22. Wessels, K.J.; Prince, S.D.; Malherbe, J.; Small, J.; Frost, P.E.; VanZyl, D. Can human-induced land degradation be distinguished from the effects of rainfall variability? A case study in South Africa. J. Arid Environ. 2007, 68, 271–297. [Google Scholar] [CrossRef]
  23. Zheng, X.J.; Sun, P.; Zhu, W.H.; Xu, Z.; Fu, J.; Man, W.D.; Li, H.L.; Zhang, J.; Qin, L. Landscape dynamics and driving forces of wetlands in the Tumen River Basin of china over the past 50 years. Landsc. Ecol. Eng. 2017, 2013, 237–250. [Google Scholar] [CrossRef]
  24. Gao, W.Y.; Zhu, C.F.; Wang, Y.S. Analysis on Characteristic of hydrology and meteorology for Tumenjiang Basin. Jilin Water Resour. 2000, 12, 22–24. [Google Scholar]
  25. Li, C.J.; Li, S.C.; Lv, B.S. Discuss of the rainstorm flood characteristic and reservoir function in 2000 of Tumen River basin. J. Agric. Sci. Yanbian Univ. 2007, 29, 170–173. [Google Scholar]
  26. Huete, A.; Didan, K.; Miura, T.; Rodriguez, E.P.; Gao, X.; Ferreira, L.G. Overview of the radiometric and biophysical performance of the MODIS vegetation indices. Remote Sens. Environ. 2002, 83, 195–213. [Google Scholar] [CrossRef]
  27. Chen, J.; Jönsson, P.; Tamura, M.; Gu, Z.H.; Matsushita, B.; Eklundh, L. A simple method for reconstructing a high-quality NDVI time-series data set based on the Savitzky–Golay filter. Remote Sens. Environ. 2004, 91, 332–344. [Google Scholar] [CrossRef]
  28. Gong, Z.; Kawamura, K.; Ishikawa, N.; Goto, M.; Wulan, T.; Alateng, D.; Yin, Y.; Ito, Y. MODIS normalized difference vegetation index (NDVI) and vegetation phenology dynamics in the Inner Mongolia grassland. Solid Earth 2015, 6, 1185–1194. [Google Scholar] [CrossRef]
  29. Piao, S.L.; Wang, X.H.; Ciais, P.; Zhu, B.; Wang, T.A.O.; Liu, J.I.E. Changes in satellite-derived vegetation growth trend in temperate and boreal Eurasia from 1982 to 2006. Glob. Chang. Biol. 2011, 17, 3228–3239. [Google Scholar] [CrossRef]
  30. Lian, J.; Zhao, X.Y.; Li, X.; Zhang, T.H.; Wang, S.K.; Luo, Y.Q.; Zhu, Y.C.; Feng, J. Detecting sustainability of desertification reversion: Vegetation trend analysis in part of the Agro-Pastoral Transitional Zone in Inner Mongolia, China. Sustainability 2017, 9, 211. [Google Scholar] [CrossRef]
  31. Duo, A.; Zhao, W.J.; Qu, X.Y.; Jing, R.; Xiong, K. Spatio-temporal variation of vegetation coverage and its response to climate change in North China plain in the last 33 years. Int. J. Appl. Earth Obs. Geoinf. 2016, 2016, 103–117. [Google Scholar] [CrossRef]
  32. Luo, Z.H.; Yu, S.X. Spatiotemporal variability of land surface phenology in China from 2001–2014. Remote Sens. 2017, 9, 65. [Google Scholar] [CrossRef]
  33. Huang, F.; Xu, S.L. Spatio-temporal variations of rain-use efficiency in the West of Songliao Plain, China. Sustainability 2016, 8, 308. [Google Scholar] [CrossRef]
  34. Duan, H.; Yan, C.Z.; Tsunekawa, A.; Song, X.; Li, S.; Xie, J.L. Assessing vegetation dynamics in the Three-North Shelter forest region of China using AVHRR NDVI data. Environ. Earth Sci. 2011, 64, 1011–1020. [Google Scholar] [CrossRef]
  35. Sun, J.; Qin, X.J. Precipitation and temperature regulate the seasonal changes of NDVI across the Tibetan Plateau. Environ. Earth Sci. 2016, 75, 291. [Google Scholar] [CrossRef]
  36. Jin, J.X.; Wang, Y.; Jiang, H.; Cheng, M. Recent NDVI-based variation in growth of boreal intact forest landscapes and its correlation with climatic variables. Sustainability 2016, 8, 326. [Google Scholar] [CrossRef]
  37. Tsai, H.P.; Yang, M.D. Relating vegetation dynamics to climate variables in Taiwan using 1982–2012 NDVI3g data. IEEE J. Sel. Top. Appl. Earth Obs. Remote Sens. 2016, 9, 1624–1639. [Google Scholar] [CrossRef]
  38. Zhang, G.L.; Xu, X.L.; Zhou, C.P.; Zhang, H.B.; Ou, Y.H. Responses of grassland vegetation to climatic variations on different temporal scales in Hulun Buir Grassland in the past 30 years. J. Geogr. Sci. 2011, 21, 634–650. [Google Scholar] [CrossRef]
  39. Bhuyan, U.; Zang, C.; Vicente-Serrano, S.M.; Menzel, A. Exploring relationships among tree-ring growth, climate variability, and seasonal leaf activity on varying timescales and spatial resolutions. Remote Sens. 2017, 9, 526. [Google Scholar] [CrossRef]
  40. Ibrahim, Y.Z.; Balzter, H.; Kaduk, J.; Tucker, C.J. Land degradation assessment using residual trend analysis of GIMMS NDVI3g, soil moisture and rainfall in Sub-Saharan West Africa from 1982 to 2012. Remote Sens. 2015, 7, 5471–5494. [Google Scholar] [CrossRef]
  41. Wessels, K.J.; van den Bergh, F.; Scholes, R.J. Limits to detectability of land degradation by trend analysis of vegetation index data. Remote Sens. Environ. 2012, 125, 10–22. [Google Scholar] [CrossRef]
  42. Huang, S.W.; Kong, J.M. Assessing land degradation dynamics and distinguishing human-induced changes from climate factors in the Three-North Shelter forest region of China. ISPRS Int. J. Geo-Inf. 2016, 5, 158. [Google Scholar] [CrossRef]
  43. Liu, P.L.; Hao, L.; Pan, C.; Zhou, D.C.; Liu, Y.Q.; Sun, G. Combined effects of climate and land management on watershed vegetation dynamics in an arid environment. Sci. Total Environ. 2017, 2017, 73–88. [Google Scholar] [CrossRef] [PubMed]
  44. Brinkmann, K.; Dickhoefer, U.; Schlecht, E.; Buerkert, A. Quantification of above ground range land productivity and anthropogenic degradation on the Arabian Peninsula using Landsat imagery and field inventory data. Remote Sens. Environ. 2011, 115, 465–474. [Google Scholar] [CrossRef]
  45. Li, Z.H.; Deng, X.Z.; Yin, F.; Yang, C.Y. Analysis of climate and land use changes impacts on land degradation in the North China Plain. Adv. Meteorol. 2015, 2015, 976370. [Google Scholar] [CrossRef]
  46. Du, Z.Q.; Zhang, X.Y.; Xu, X.M.; Zhang, H.; Wu, Z.T.; Pang, J. Quantifying influences of physiographic factors on temperate dryland vegetation, Northwest China. Sci. Rep. 2017, 2017, 40092. [Google Scholar] [CrossRef] [PubMed]
  47. Zhang, X.Z.; Dai, J.H.; Ge, Q.S. Variation in vegetation greenness in spring across eastern China during 1982–2006. J. Geogr. Sci. 2013, 23, 45–56. [Google Scholar] [CrossRef]
  48. Guo, L.H.; Wu, S.H.; Zhao, D.S.; Yin, Y.H.; Leng, G.Y.; Zhang, Q.Y. NDVI-Based vegetation change in Inner Mongolia from 1982 to 2006 and its relationship to climate at the biome scale. Adv. Meteorol. 2014, 2014, 692068. [Google Scholar] [CrossRef]
  49. Song, Y.; Ma, M.G. A statistical analysis of the relationship between climatic factors and the Normalized Difference Vegetation Index in China. Int. J. Remote Sens. 2011, 32, 3947–3965. [Google Scholar] [CrossRef]
  50. Nan, Y.; Ji, Z.; Dong, Y.H.; Ni, X.J. Study of land use/cover dynamic change in Tumen River across national border region during the last 30 years. J. Nat. Sci. Hunan Norm. Univ. 2012, 35, 82–89. [Google Scholar]
  51. Xu, L.L.; Li, B.L.; Yuan, Y.C.; Gao, X.Z.; Zhang, T.; Sun, Q.L. Detecting different types of directional land cover changes using MODIS NDVI time series dataset. Remote Sens. 2016, 8, 495. [Google Scholar] [CrossRef]
Figure 1. The location (a), altitude and meteorological station (b), and vegetation types (c) of the study area. In (b), meteorological station (1) indicates the station from the China Meteorological Data Interchange Platform; station (2) is the station of the National Oceanic and Atmospheric Administration (NOAA) National Centers for Environmental Information database.
Sustainability 09 02350 g001
Figure 2. Inter-annual variations in mean NDVI during the growing season and at different time phases of growing season over the last 16 years within the TRB: (a) growing season; (b) spring; (c) summer; and (d) autumn.
Sustainability 09 02350 g002
Figure 3. Annual mean NDVI for growing season over 16 years.
Sustainability 09 02350 g003
Figure 4. Slope changes in the NDVI and the significance (p-value) of these trends throughout different seasons in the study area between 2000 and 2015: (a) growing season; (b) spring; (c) summer; (d) autumn.
Sustainability 09 02350 g004
Figure 5. The spatial distribution of climatic trends within the TRB (i.e., temperature, T, and precipitation, P) during different growing season time periods between 2000 and 2015: Growing indicates growing season.
Sustainability 09 02350 g005
Figure 6. The spatial distribution of correlations between seasonal mean NDVI values and temperature: (a) growing season; (b) spring; (c) summer; and (d) autumn.
Sustainability 09 02350 g006
Figure 7. The distribution pattern of correlation coefficients between seasonal mean NDVI and total precipitation: (a) growing season; (b) spring; (c) summer, and; (d) autumn.
Sustainability 09 02350 g007
Figure 8. Residual slope distributions resulting from human activities across the TRB throughout the growing season between 2000 and 2015: (a) growing season; (b) spring; (c) summer; and (d) autumn. SIH indicates significantly increased regions induced by human activities; SIC is significantly increased in regions induced by climate variability; SDH is significantly degraded in regions induced by human activities, SDC indicates significantly degraded regions induced by climate variability; UC is non-significantly changed regions.
Sustainability 09 02350 g008
Figure 9. Example to explain the associations between climate and anthropogenic factors for different vegetation types. SIH, SIC, SDH, SDC and UC are same with those of Figure 8.
Sustainability 09 02350 g009
Table 1. Area statistics describing significant NDVI trends at the seasonal scale over 16 years.
Change CategoriesGrowing Season (%)Spring (%)Summer (%)Autumn (%)
Highly significant decrease1.491.211.390.55
Significant decrease1.161.371.620.85
Significant increase16.127.459.4012.33
Highly significant increase20.813.119.517.80
Table 2. Trends of mean growing season NDVI over the last 16 years for different vegetation types.
Vegetation TypesChina (year−1)DPR Korea (year−1)Russia (year−1)TRB (year−1)
Forested land0.00270.00170.00160.0021
Cropland0.00210.00150.00150.0017
Grassland0.00190.00160.00150.0016
Other (urban and barren land)0.00120.00110.00130.0012
mean0.00200.00150.00150.0017
Table 3. Area of anthropogenic vegetation changes within the TRB.
SeasonSignificantly Positive (%)No Significant (%)Significantly Negative (%)
Growing season21.2675.782.95
Spring19.5078.162.34
Summer16.7280.342.94
Autumn19.6179.301.09

