Article

Hydrochloric Acid Leaching of Philippine Coal Fly Ash: Investigation and Optimisation of Leaching Parameters by Response Surface Methodology (RSM)

by
Al Mon E. Dahan
1,
Richard D. Alorro
2,
Mona Lisa C. Pacaña
1,
Ronben M. Baute
1,
Leaniel C. Silva
1,
Carlito B. Tabelin
3 and
Vannie Joy T. Resabal
1,*
1
Department of Materials and Resources Engineering Technology, Mindanao State University–Iligan Institute of Technology, Tibanga, Iligan City 9200, Philippines
2
Western Australia School of Mines: Minerals, Energy and Chemical Engineering, Curtin University, Kalgoorlie, WA 6430, Australia
3
School of Minerals and Energy Resources Engineering, University of New South Wales, Sydney, NSW 2052, Australia
*
Author to whom correspondence should be addressed.
Submission received: 17 November 2021 / Revised: 20 January 2022 / Accepted: 25 January 2022 / Published: 1 February 2022

Abstract

:
Coal Fly Ash (CFA) is a hazardous waste from coal-fired power plants, but has increasingly become a popular supplementary cementitious material for cement in the construction industry. As a secondary resource of REE, its main advantage lies in its fine particle size that eliminates the need for costly and energy-intensive comminution. In this study, the potential of CFA from the Philippines as a secondary REE resource was investigated by direct leaching of REEs with hydrochloric acid (HCl). The CFA sample came from a coal-fired power plant with a circulating fluidized bed combustion (CFBC) technology. For the leaching tests, the effects of HCl concentration, leaching time and leaching temperature on REE extractions were elucidate optimized via Response Surface Methodology (RSM). The RSM results showed that the optimum leaching occurred at 3M HCl, 65 °C and 270 min with extractions of Nd, Er, Eu, Tb and Dy at 70.8%, 76.34%, 88.02%, 90.01% and 73.38%, respectively. According to these results, the CFA from the Philippines is a promising secondary resource of REE and the extraction method employed was effective in achieving a relatively high REE dissolution. Moreover, the empirical model that was established accurately predicted the dissolution of REE with an accuracy of 98.20%, 96.66%, 97.09%, 98.17% and 97.78% for Nd, Er, Eu, Tb and Dy, respectively.

1. Introduction

Rare earth elements (REE) are the 17 elements in the periodic table which comprise the 15 lanthanides plus scandium and yttrium. REEs are essential for many high-technology applications such as consumer electronics, military hardware, renewable energy and clean storage technologies. A three-megawatt wind turbine, for example, requires three tons of REEs [1]. With the global push to decarbonize society to combat climate change, the demand for REEs is projected to increase by 5–9% for the next 25 years [1]. However, the demand for REEs is outstripping its supply by about 3000 tons per year [2,3]. This supply–demand imbalance in the market is driving up the REE prices, which in turn is fueling the need to explore new REE resources and cost-effective extraction technologies [4,5,6].
Recent research findings found that coal fly ash (CFA) can be a potential alternative source of many elements including the valuable heavy REEs and other strategic elements [7,8,9,10,11,12,13,14,15,16,17]. CFA is a combustion by-product from burning of coal in coal-fired power plants characterized by its fine particle size and high amorphous content. On one hand, high amorphous content of CFA has made it popular in geopolymers and as supplementary cementitious material [2]. On the other hand, this waste material is hazardous and contains environmentally regulated contaminants like boron, selenium and arsenic [3,4]. Millions of tons of CFA is produced annually in countries such as South Africa, the USA, China, Australia, Greece, Japan and Poland [16]. In the Philippines, more than 1.4 M metric tons of CFA is generated annually [18] and this quantity is expected to increase by around 10% annually [19]. As of August 2021, there are 50 coal-fired power plants operating in the Philippines and several more are approved for construction in the coming years [20]. To reduce the volume of CFA disposed of in landfills and minimize environmental and disposal issues associated with this industrial waste, its utilization and valorization, especially as a potential source of rare earth elements, has been the focus of much research in recent years. Findings of studies conducted on CFAs from the USA, Poland and Russia showed that the average REE content in CFA is around 400-600 ppm, which is approximately three times higher than that of the conventional REE ore [8,9].
The conventional way of extracting REEs from many of its natural ores, including waste materials, is leaching. This method involves dissolution of the target components in a sample by lixiviants such as acids or bases. In the past, acid leaching has been used to extract hazardous elements from CFAs to decontaminate them before disposal [21,22,23,24]. More recently, these methods were improved to facilitate the selective extraction of valuable elements from CFA, such as Fe, Al and REEs [25,26,27,28,29,30,31,32]. Hydrochloric acid (HCl) is the lixiviant commonly used to extract REE from CFAs and is preferred over cheaper sulfurc acid because it does not form gypsum, a mineral that causes significant REE loss [30,31,32,33]. HCl is also cheaper than nitric acid (HNO3) and is better than sodium hydroxide (NaOH) because it limits silica dissolution that interferes with CFA dissolution and filtration through the formation of silica gel [15]. The investigation of the effects of HCl concentration, temperature, stirring speed, solid-to-liquid ratio and leaching time on the extraction of lanthanum (La), cerium (Ce) and neodymium (Nd) has already been conducted on Chinese CFA [31]. To further improve the extraction of the REEs, pretreatment methods are employed, such as magnetic separation, caustic cracking and roasting [33,34]. To recover the REEs from the leachates, adsorption is the primary existing method that is being used [35,36,37].
In this study, the combined effects of HCl concentration, temperature and leaching time were elucidated on the REE extraction from Philippine CFA using batch-type experiments. The set of parameters investigated in this study is quite similar to the previous study of Cao et al. [31] but particularly distinct in the following: (a) leaching time beyond 2 h was considered since according to King et al. [32] the HCl continues to leach from CFA up to 35 days; (b) the recovery of all six critical REEs was investigated, rather than just La, Ce and Nd only; (c) optimization of parameters using central composite design (CCD) was conducted in combination with Response Surface Methodology (RSM) leading to the development of a model based on the experimental design to determine the optimum leaching conditions for REE extraction, and; (d) Philippine CFA was used as the raw material. Different types of CFA have different responses to HCl [32] and the degree of surface deposition and accompaniment of REE in CFA is greatly affected by the type of the original coal and combustion conditions such as temperature, oxygen, concentration, residence time and cooling rate of CFA particles [29].

2. Materials and Methods

2.1. Material

The CFA used in this study came from a coal-fired power plant with a circulating fluidized bed technology. Grab sampling and Jones riffle was used on site to collect the samples, which were then sieved in the laboratory using a 120-mesh (125 microns) Tyler standard sieve. Samples that passed through the 120-mesh were dried in the oven for 48 h at 105 °C and then analyzed by scanning electron microscopy with energy dispersive X-ray spectroscopy (SEM-EDS, InTouchScopeTM, JSM-IT200, JEOL Ltd., Hokkaido, Japan) and X-ray Diffraction (PANalytical X’Pert MPD Pro, Hokkaido, Japan) to obtain the mineralogical characteristics. Elemental maps were also taken with SEM-EDS using an accelerating voltage of 15 keV at 10,000 cps with a 1.0 ms time constant under ultrahigh vacuum. The chemical composition was determined by inductively-coupled plasma-mass spectroscopy (ICP-MS, Agilent 7700, Agilent Technologies, Manila, Philippines) (margin of error = ±2%).

2.2. Methods

A series of experiments were conducted to determine the optimum dissolution of REEs from the CFA. For this purpose, leaching experiments were carried out using an improvised water bath with a 125-mL Erlenmeyer flask (Figure 1) containing 50 mL of HCl with 5 g of CFA. To make sure that the temperature was maintained during the entire leaching duration, the Erlenmeyer flask was immersed in water in an aluminum container placed on a hot plate and the temperature of the water was monitored using a thermometer. To prevent the escape of vapor, the Erlemeyer flask was fully covered and the solution was kept homogeneous by constant stirring with a magnetic stirrer. After subsequent leaching, the solutions were filtered through 0.45 µm filters and the leachates were analyzed using ICP-MS (ICP-MS, Agilent 7700, Agilent Technologies, Santa Clara, CA, USA) (margin of error = ±2%).

2.3. Multivariate Design of Experiment

It has been known that several independent variables can affect the dissolution of REEs in the CFA and it is therefore necessary to select those variables that make major contribution to the response variable through the screening of variables [38,39,40,41,42,43]. In this study, screening was carried out using a 3-factor factorial design to determine which among the independent variables (acid concentration, leaching time and leaching temperature) significantly contributed to the response variable and also to find out if there are interactions among the chosen parameters. The acid concentration, leaching temperature and leaching time were varied at four levels (0.25 M, 0.5 M, 1 M and 3 M), two levels (25 °C and 65 °C), and five levels (30 min, 60 min, 180min and 360 min), respectively. The stirring speed and the solid:liquid ratio were kept constant at 260 rpm and 1:10, respectively. The significance of the parameters and their interactions were analyzed using 3-way analysis of variance (ANOVA).
Based on the results of the screening test, the independent variables to be optimized as well as their corresponding levels were set-up using central composite design (CCD) response surface methodology (RSM) and the range of each factor of interest is presented in Table 1 [43].
To minimize the error and effect of uncontrolled factors, the experimental runs were randomized. The order of the runs is summarized in Table 2 and the response was used to generate an empirical model based on a second-degree polynomial equation (Equation (1)):
Y = β 0 + i = 1 n B i X i + i = 1 n β i i X i 2 + i = 1 n j = 1 n β i j X i X j + ε
where Y is the predicted response; β 0 is the constant coefficient; β i are the linear coefficients; β i i are the quadratic coefficients; β i j are the interaction coefficients; n is the number of factors of interest; X i and X j are the coded values of the variable leaching parameters; and ε is the random error [42].
ANOVA was used to describe the interaction between the process variables and the response variable. The Design Expert version 11 Software by State-Ease Inc., Minneapolis, USA was used to obtain the following: (a) regression analysis of the experimental data; (b) statistical significance of independent variables through F-test; and (c) R 2 coefficient to determine the accuracy of the fitted model. The significant model terms were evaluated by the probability value (p-value) at 95% confidence interval.

3. Results and Discussion

This section covers the discussion on the characterization of the CFA raw material and the extraction of critical REEs, particularly Dy, Nd, Er, Eu and Tb. There was no data obtained for Y because its presence was below the detection limit of the ICP-MS used in the analysis and hence it is not included in the discussion. The extraction of major elements Al, Fe, Ca and Fe are also presented in relation to the extraction of REEs.

3.1. Characterization of CFA

The REE composition of the CFA determined by ICP-MS analysis is summarized in Table 3. The elements are presented according to the economic classification of Seredin and Dai (2010) which is based on the current market trend of the individual REE rather than on the traditional classification of light REE as not valuable and heavy REE as valuable. This economic classification is the basis for the grading of the REE ore through an index called outlook coefficient which measures the ratio of the total critical REE to the total excessive REE, and the relative amount of the critical REE. An ore is regarded as promising REE raw material for economic development if its outlook coefficient is within 0.7 to 1.9 and the relative amount of critical REE is between 30% and 51% [15]. Based on this classification, the CFA used in this study qualifies as a promising REE raw material with an outlook coefficient of 1.03 and critical elements percentage of 33.3%.
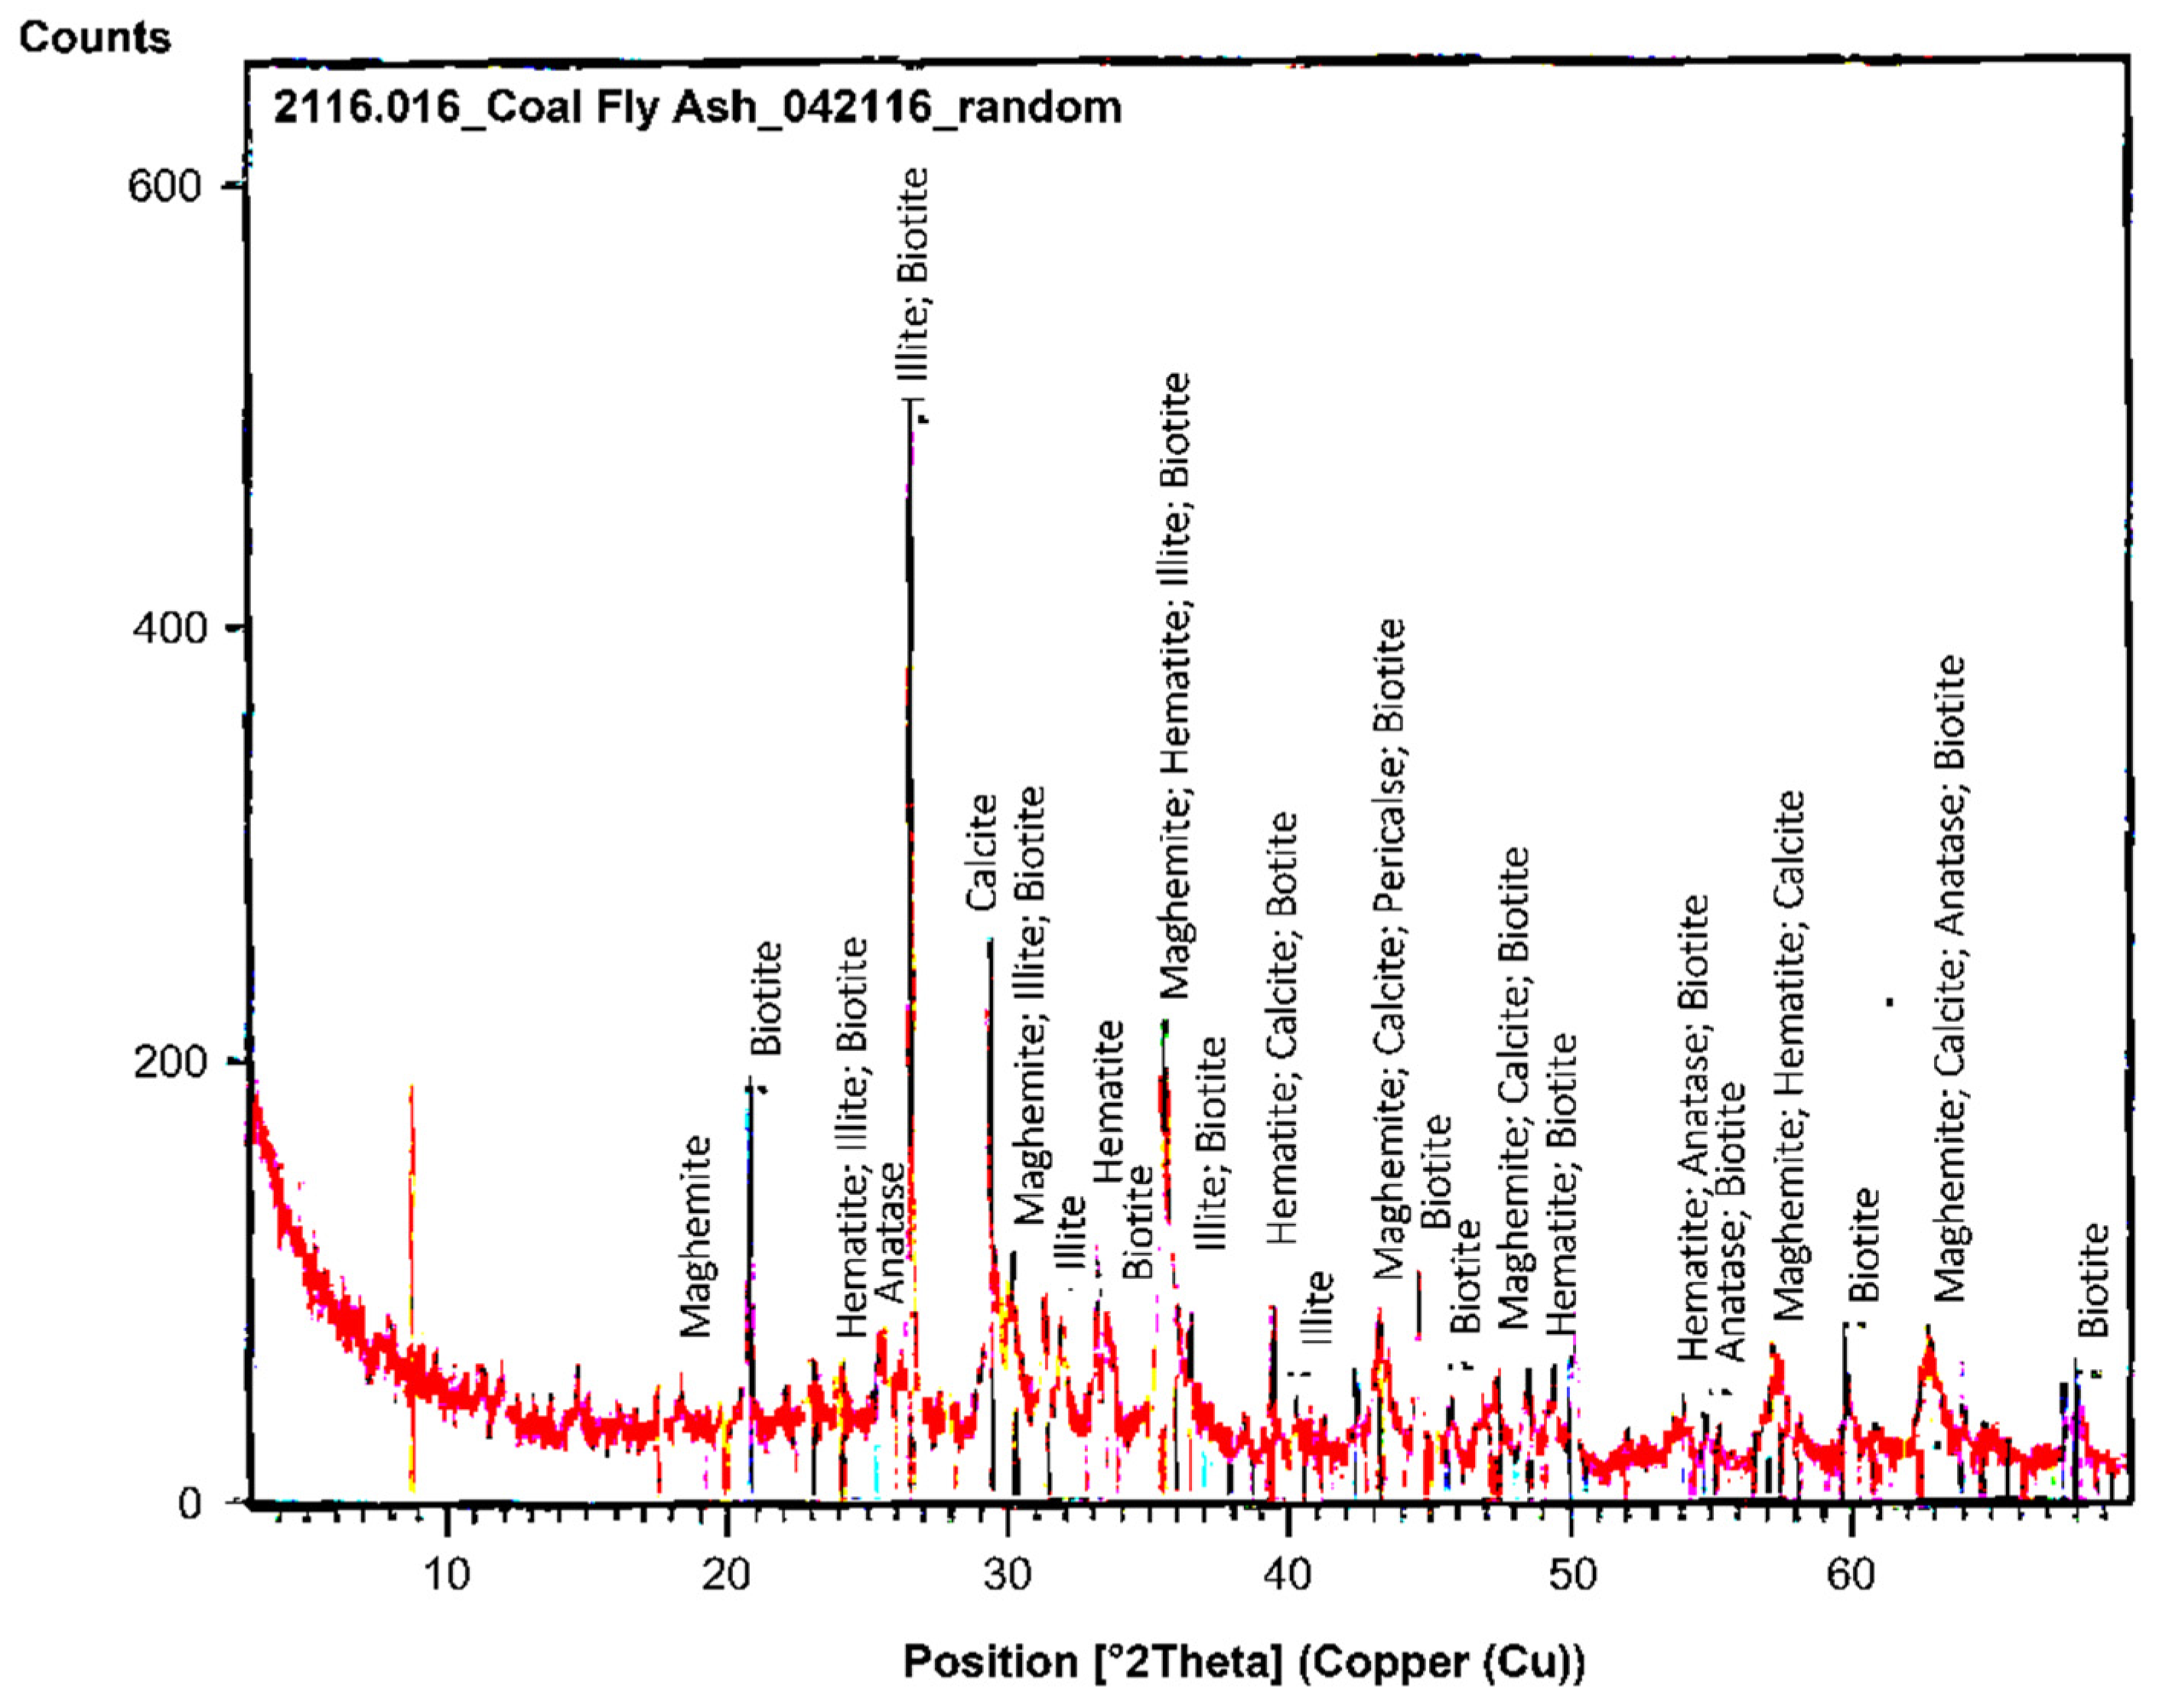
Figure 2 shows the XRD pattern of the CFA samples and it can be seen that the dominant minerals present are quartz (SiO2), calcite (CaCO3), iron oxide minerals such as magnetite (Fe2O4), hematite (Fe2O3) and maghemite (γ-Fe2O3), and aluminosilicates such as illite ( ( K , H 3 O ) ( Al ,   Mg , Fe ) 2 ( Si , Al ) 4 O 10 [ ( OH ) 2 , ( H 2 O ) ] ) and biotite ( K ( Mg , Fe ) 3 ( AlSi 3 O 10 ) ( F , OH ) 2 ).
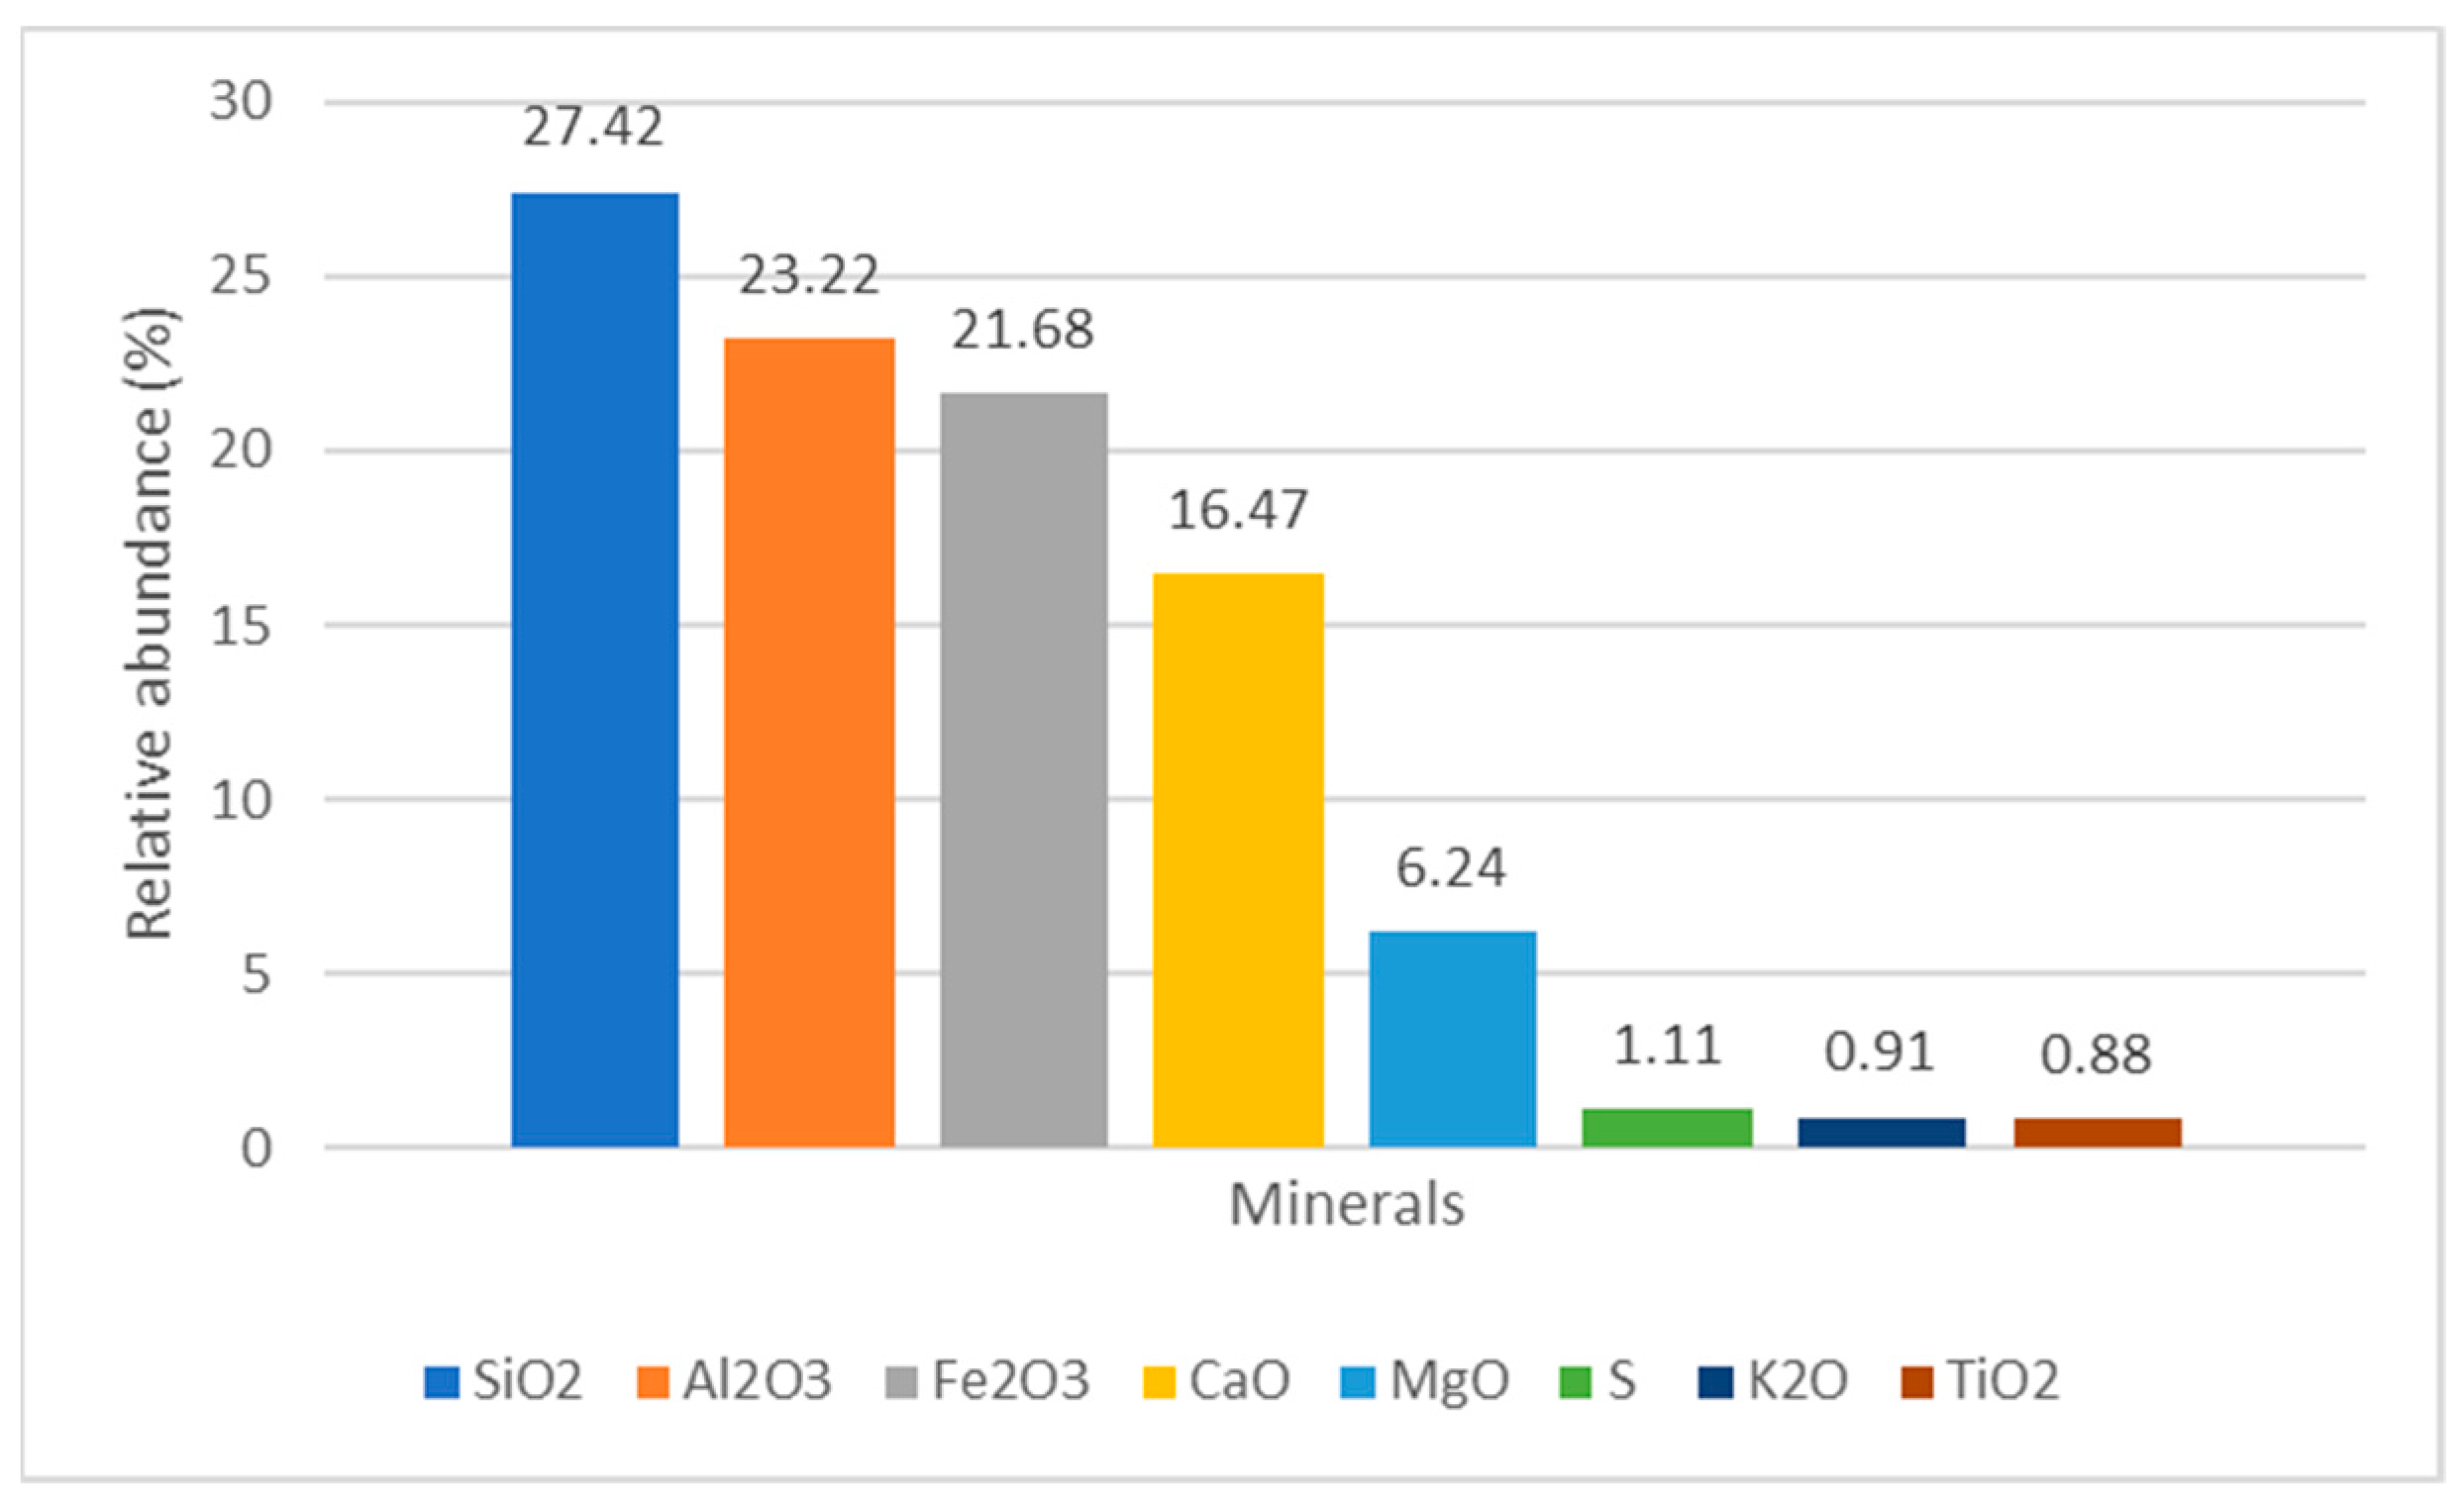
The quantity of the abundant minerals present was determined by XRF analysis. The results presented in Figure 3 show that SiO2 is the most abundant mineral, followed by Al2O3, Fe2O3 and CaO with small amounts of MgO, S, K2O and TiO2. A high amount of silica may not be desirable for leaching due to the formation of a silica gel layer which prevents diffusion of ions. However, the presence of calcium ions can somewhat counteract the gelling effect of the silica through the reaction of calcium ions with silica forming calcium silicates, thereby destabilizing the gel layer and reducing the amount of silicate [32]. The CaO present in the CFA has to be dissolved so that it can react with the silica, and based on thermodynamics, CaO is easily dissolved by HCl [44]. This is therefore one of the bases for the choice of HCl as lixiviant in this study.
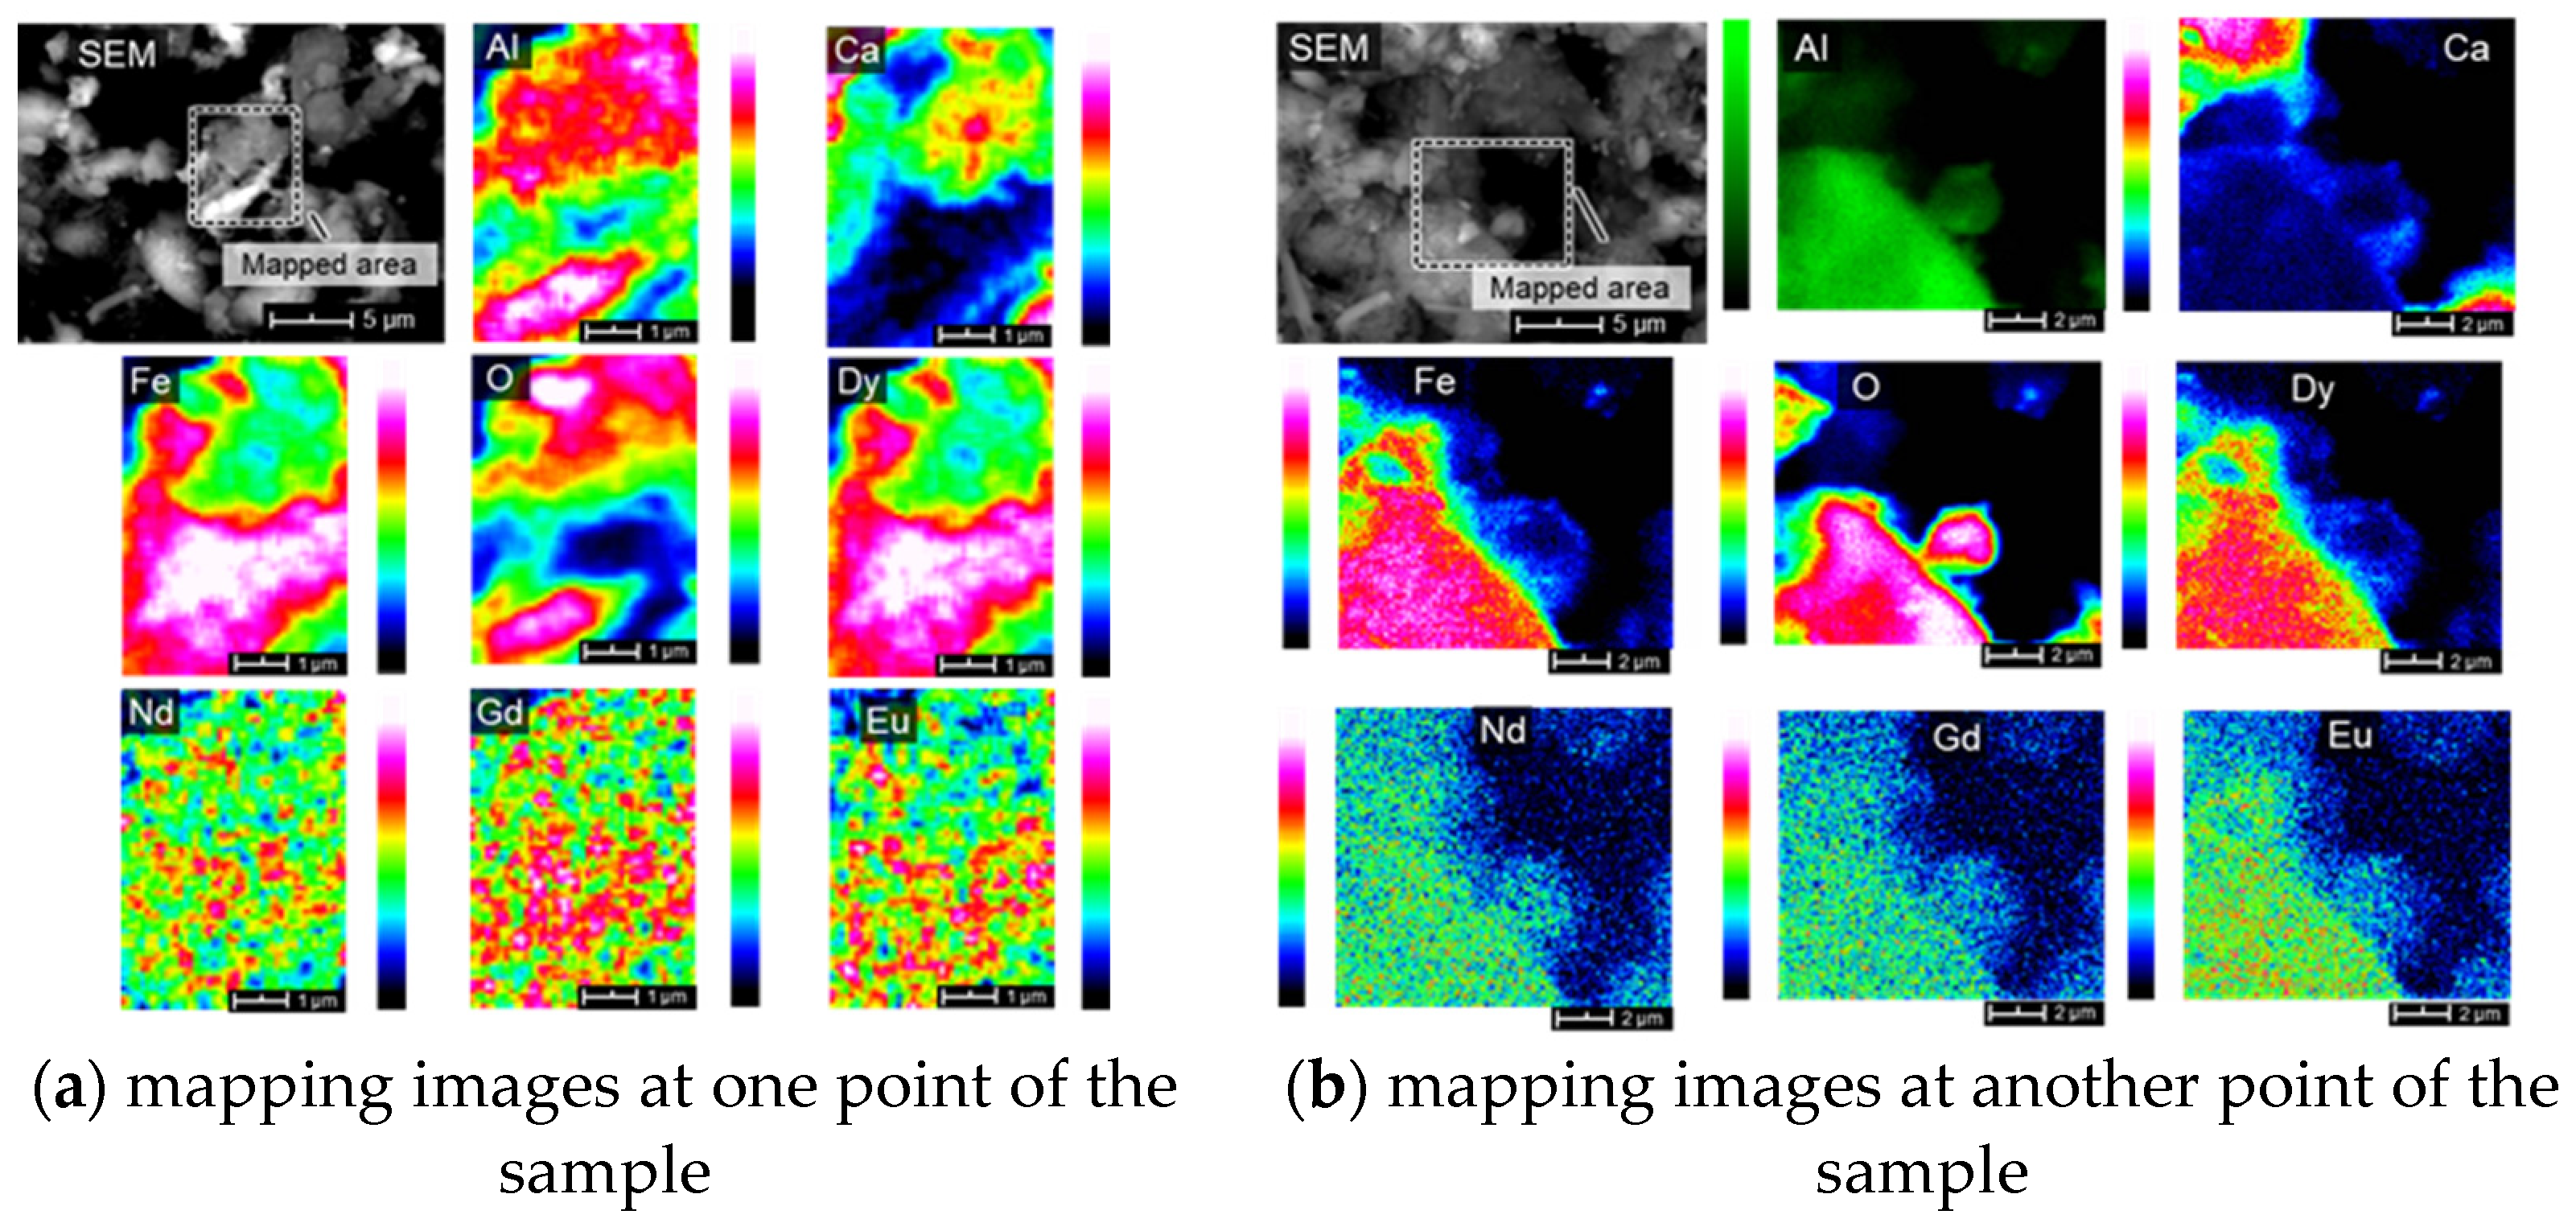
To better understand how the other relatively abundant minerals present in the CFA may possibly interfere with the extraction of the REEs of interest, it is important to know the association of the REEs with these dominant minerals. 
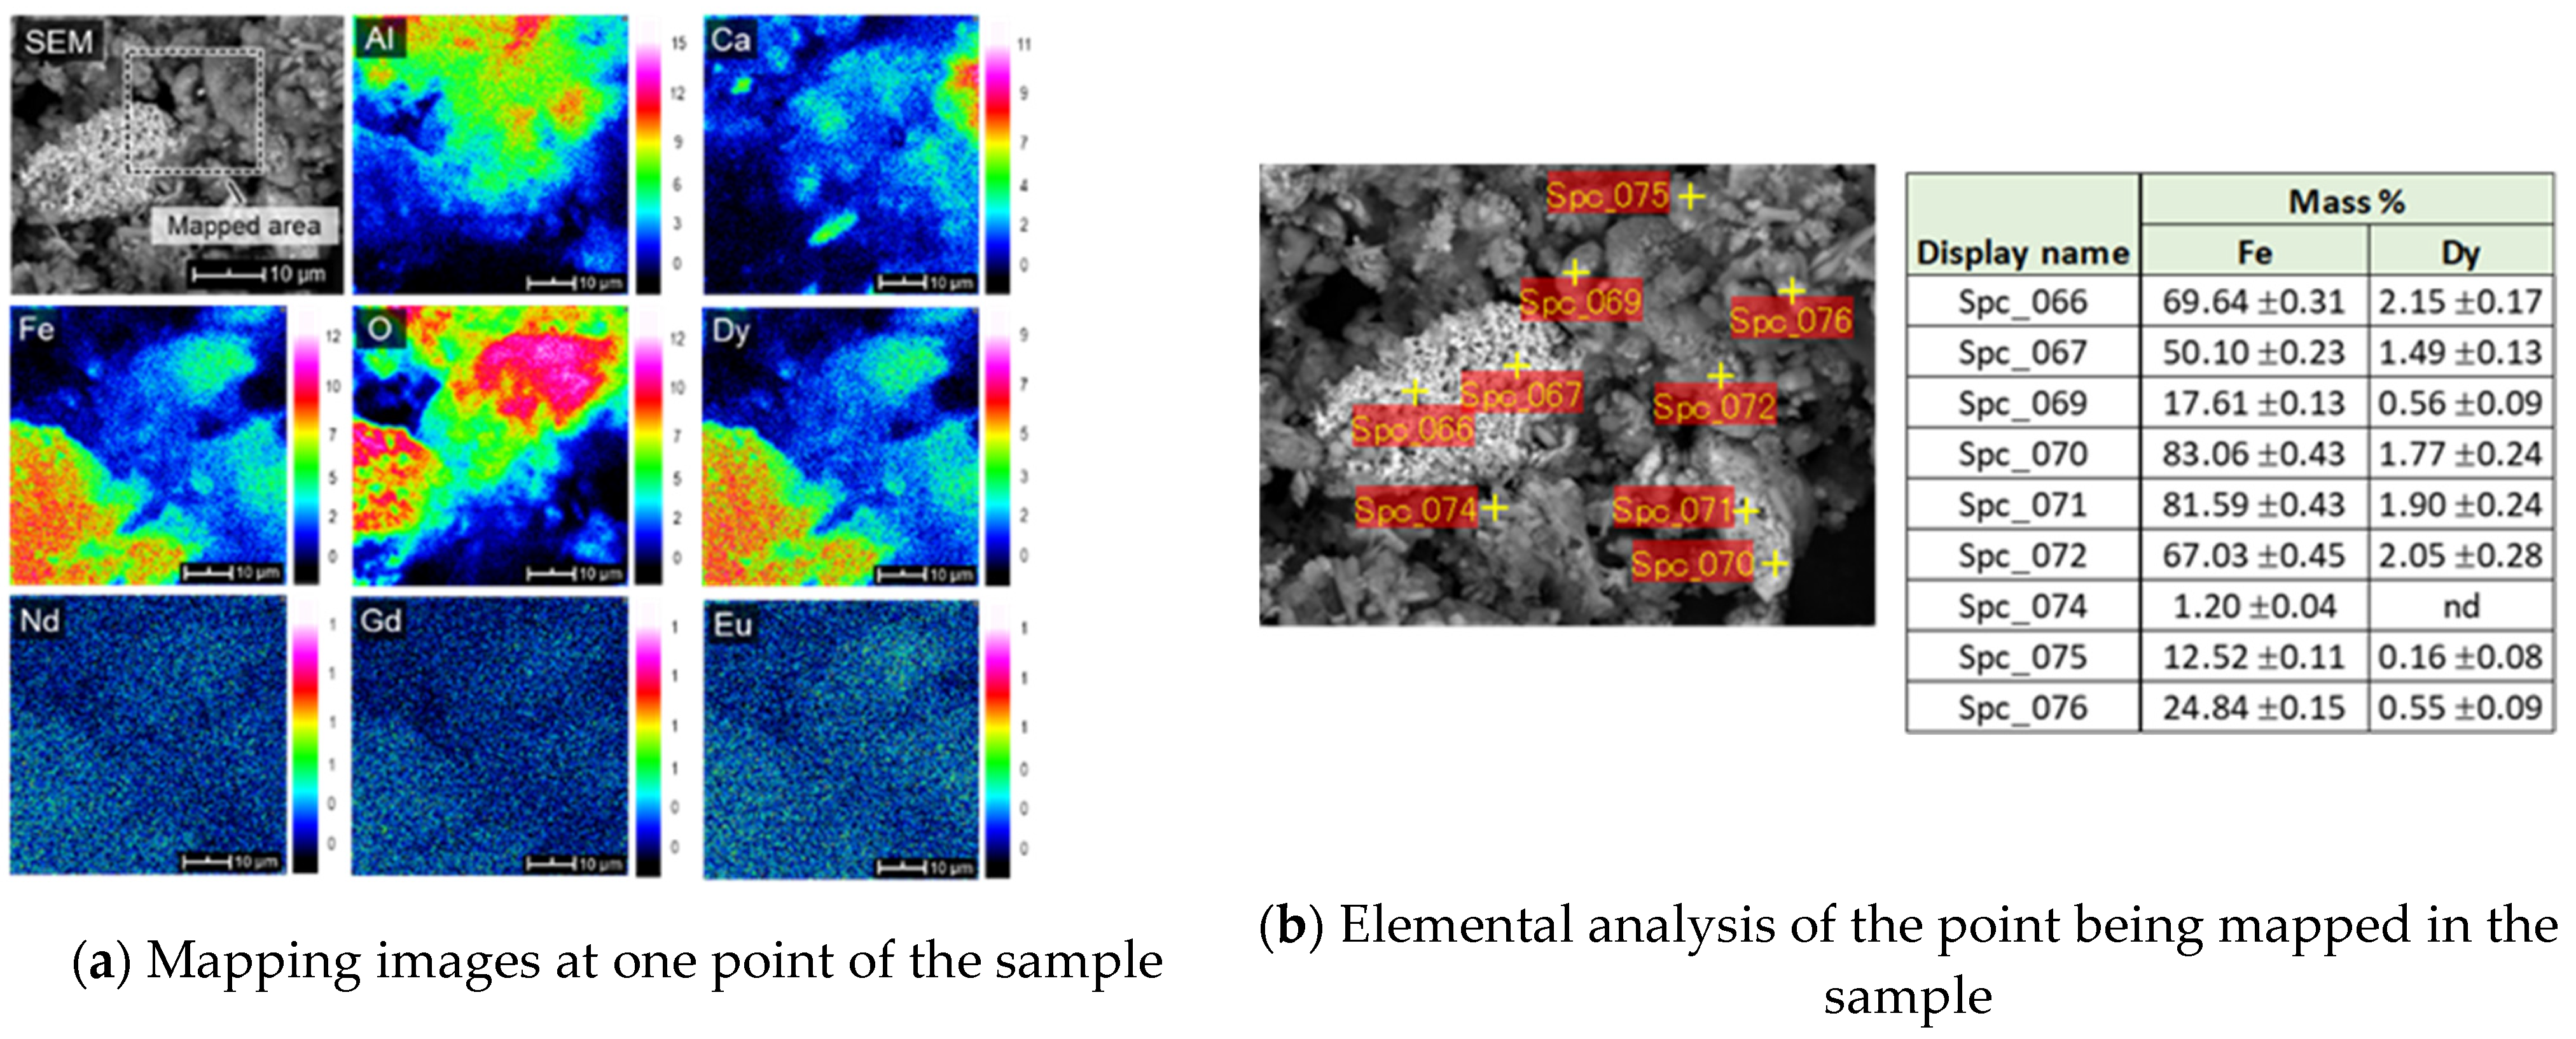
Figure 4 shows the SEM-EDS images with elemental map at different locations. It can be seen that the elemental map of Dy is almost identical with that of Fe, indicating a close association of Dy with Fe. Other REEs appear to be finely disseminated Throughout the matrix and show some associations with Al and Ca but they tend to appear more associated with Fe.
Figure 5 shows a SEM-EDS image with elemental map and point analysis. The elemental map confirms the close association of Dy with Fe qualitatively and the point analysis quantifies the association and shows a general trend that the amount of Dy is directly proportional to the amount of Fe except at some points.

3.2. Optimization of Leaching Parameters Using Central Compiste Design-Response Surface Methodolgy

The highest extractions of Dy, Nd, Er, Eu and Tb were obtained at 3 M HCl, 65 °C and a leaching time of 270 min (Table 4) while the lowest extraction occurred at the lowest acid concentration 0.3M where concentrations of Dy, Er, and Eu were no longer detected by ICP-MS. This implies that the acid concentration of HCl was too weak to leach out the REE in the CFA. Also, at this acid concentration, only calcium (Ca), among the major elements that existed in the CFA, was leached out (Table 5). This inability of HCl at 0.3 M concentration to extract the major elements except Ca can be futher elucidated through the thermodynamic principles using the formula Δ G r x n = Δ G p r o d u c t s Δ r e a c t a n t s . At T = 323   K , the Δ G corresponding to the following reactions are shown [44]:
Al 2 O 3 + 6 HCl = 2 AlCl 3 + 3 H 2 O ; Δ G 323 K = 401.5   kJ / mol
CaO + 2 HCl = CaCl 2 + H 2 O ; Δ G 323 K = 120.1   kJ / mol
Fe 2 O 3 + 6 HCl = 2 FeCl 3 + 3 H 2 O ; Δ G 323 K = 150.8   kJ / mol
SiO 2 + 4 HCl = SiCl 4 + 2 H 2 O ; Δ G 323 K = 286.2   kJ / mol
Among the four reactions, only the leaching reaction of calcium oxide (Equation (3)) has a negative Δ G , which means that it is the only spontaneous reaction at 0.3 M HCl concentration. The failure of the 0.3 M HCl concentration to leach out the REEs can be explained through the application of material balance where 5g of coal fly ash was leached with 50 mL of xM HCl. At very low HCl concentration, almost all of the H + ions were consumed by CaO which leaves a very small amount for the reaction with REE. Consequently, since no data was obtained at 0.3 M HCl concentration, it was excluded from the experimental design as including it would negatively affect the RSM analysis (ANOVA, diagnostics, Model graph, and optimization) in the Design Expert version 11 software.
To ensure a good model fitting, it was necessary to test for the significance of the regression model and its individual model coefficients. The significance of the factors were determined through the ANOVA where a factor or interaction between factors was considered significant if the p-value was less than 0.05. Otherwise, it was insignificant and thus excluded from the empirical model.
The results of the ANOVA for the quadratic model (Equation (1)) are shown in Table 6, Table 7, Table 8, Table 9 and Table 10 for Dy, Er, Eu, Nd and Tb, respectively. As can be seen in the tables, the three main factors, namely, acid concentration, leaching temperature and leaching time, have significant effects on the extraction of Dy, Er, Eu, Nd and Tb. The interactions between acid concentration and leaching temperature (AB) for all the critical REEs investigated were significant while all interactions involving leaching time (AC and BC) were insignificant except for the case of Eu (Table 8) where the interaction between acid concentration and leaching time (AC) was significant.
Table 11 shows the final empirical model which includes only the terms that were found to be significant. The negative values indicate antagonistic effects, whereas the positive values indicate synergistic effects [39].
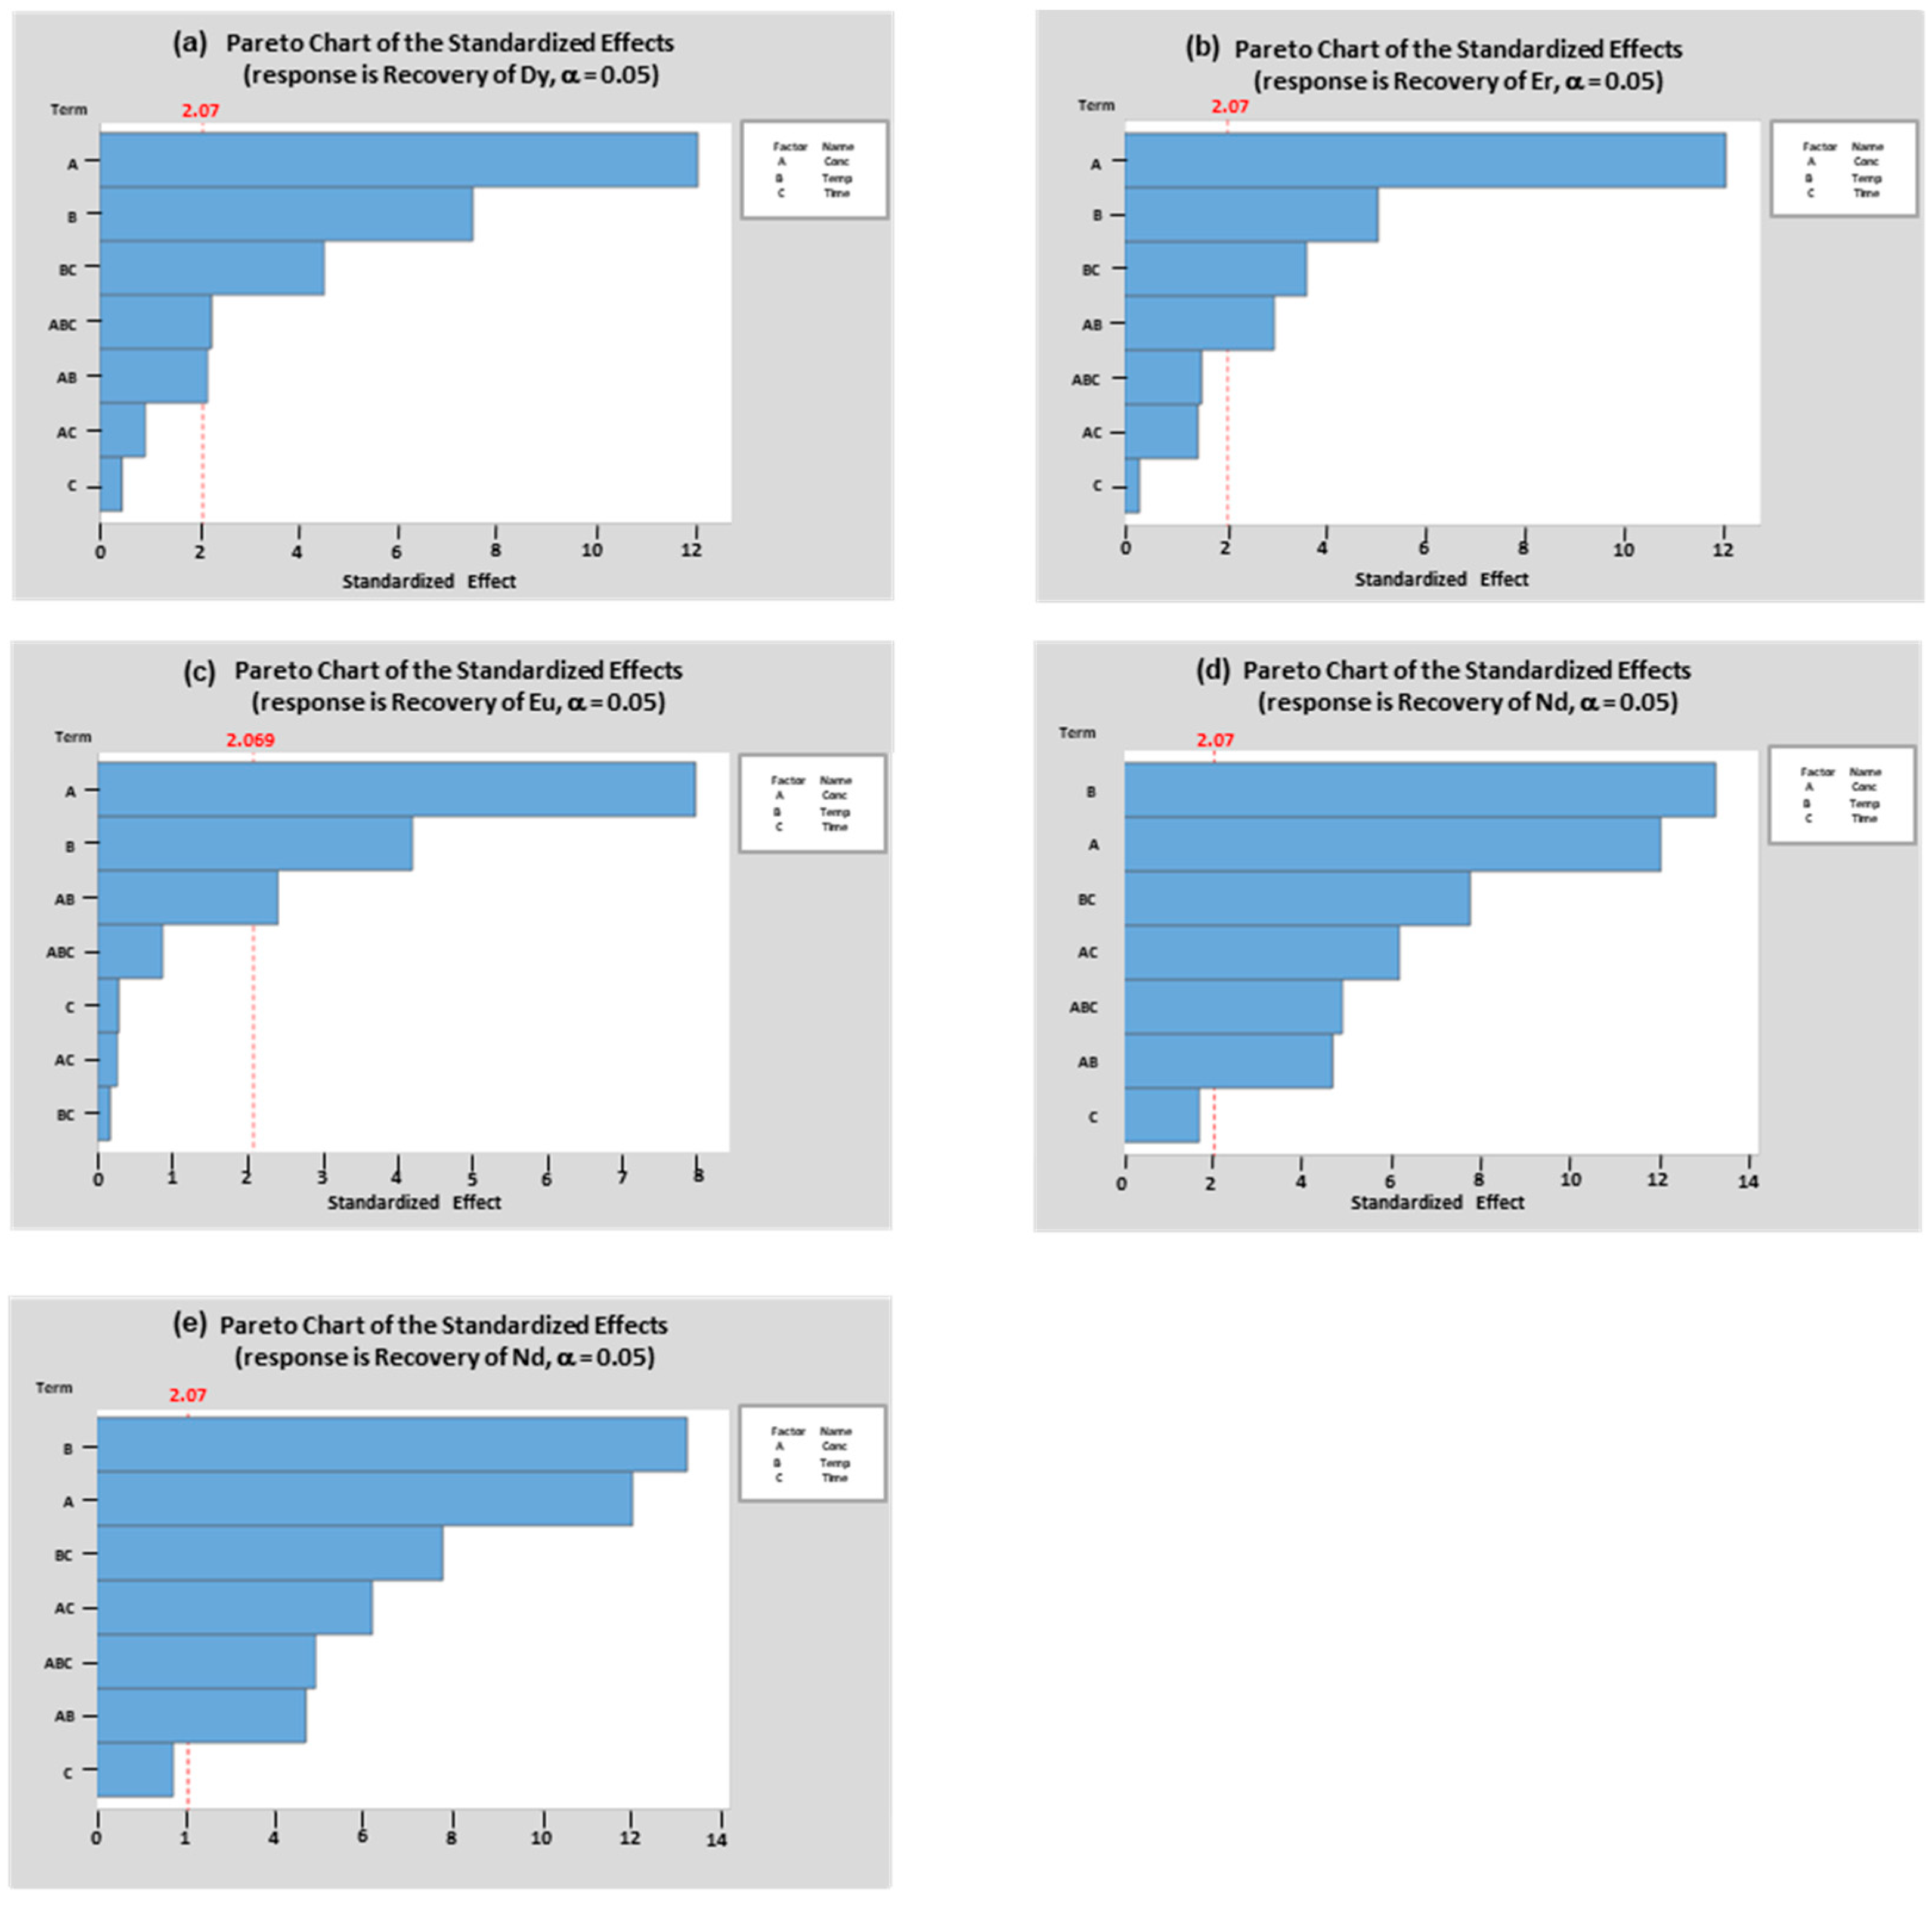
The magnitude of significance of the factors on the extraction of Dy, Er, Eu, Nd and Tb was measured through the Pareto chart of the standardized effects and is presented in Figure 6. It can be seen that the greatest effect on the extraction of the REEs of interest was contributed by the acid concentration, except for Nd where the effect of leaching temperature was more significant than the acid concetration.
The adequacy of the developed model plays an important role in validating the analysis of the experimental data. Thus, fit statistics and diagnostics of the model were done and the results are summarized in Table 12. The predicted R 2 is a measure of how well the model predicts a response variable while the adjusted R 2 is used to determine the reliability of the correlation and how much is determined by the addition of independent variables. A good model should have a difference between predicted R 2 and adjusted R 2 not exceeding 0.2. Based on the fit statistics in the table, all models for the extraction of the REEs of interest qualify for a good model.
Another value that should be considered is the adequate precision (Adeq Precision), which compares the range of the predicted values at the design points to the average prediction error. It is used to measure the signal to noise ratio and a ratio of greater than 4 is desirable. According to Table 12, the Adeq Precision is greater than 17 for all extraction models indicating an adequate signal. Thus, the models can be used to navigate the design space.
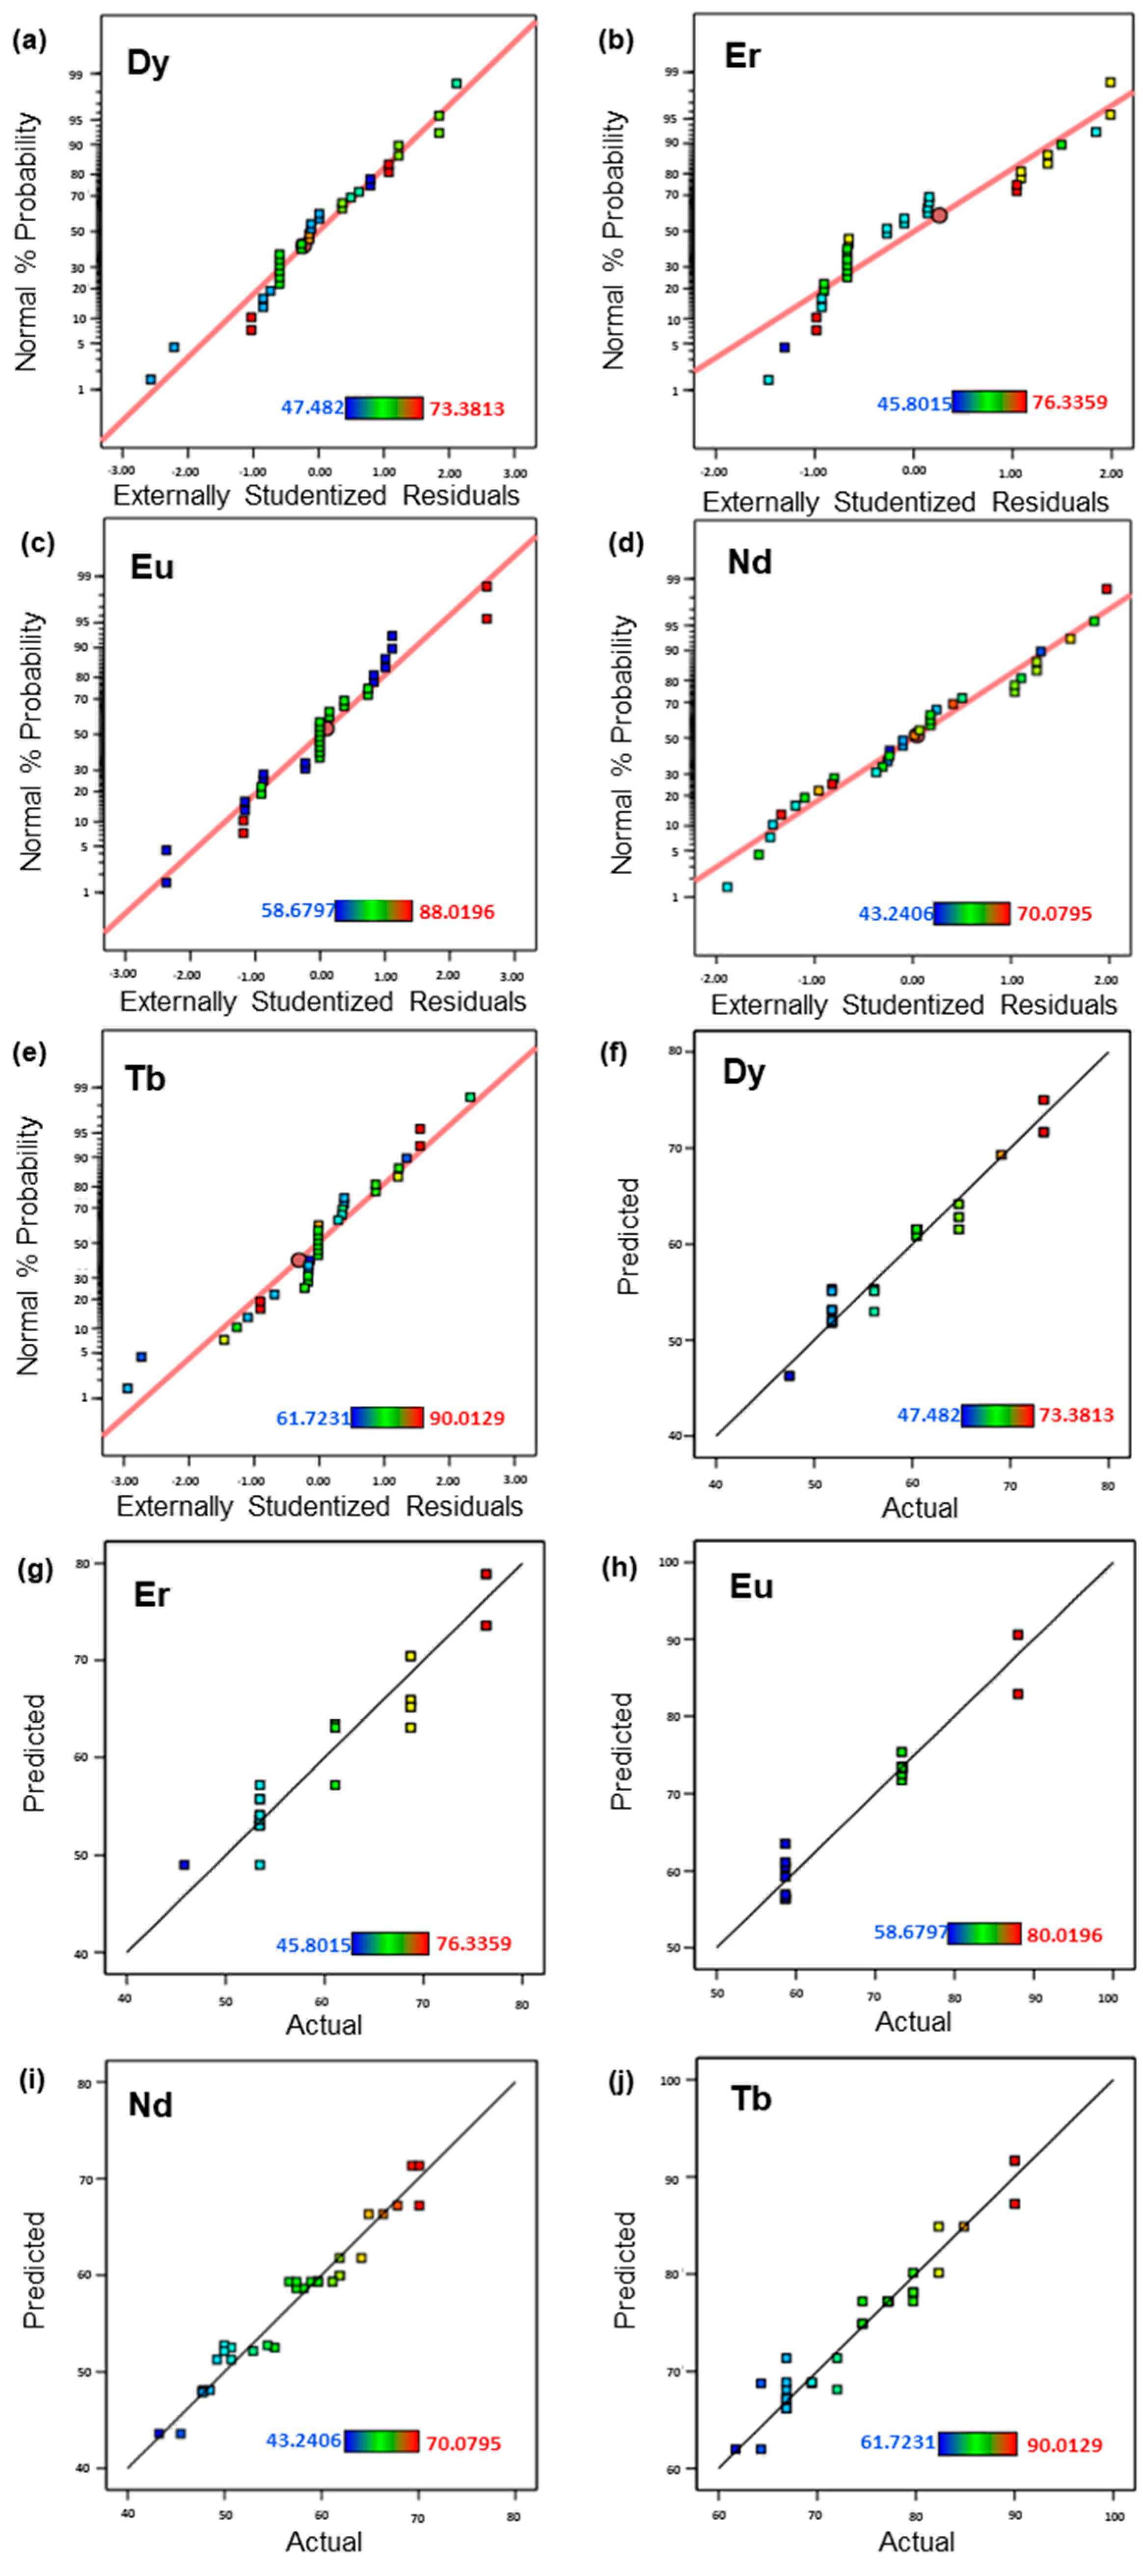
Diagnostic plots such as the normal probability plots and the plots for predicted vs actual are shown in Figure 7. These plots are based on Externally Studentized Residuals method rather than on the Internally Studentized Residuals, as the former is more sensitive for finding the problems with the analysis compared to the latter. The Studentizing residuals map all the different normal distributions to a single standard normal distribution.
Figure 7a–e follow a straight line, which indicates that the data set follows a normal probability and thus there is no need for data transformations like logarithmic, square root or arc sine square root transformations. Moreover, Figure 7f–j showed straight lines for the predicted vs actual plots which means that the data set can be easily predicted by the model.

3.3. Optimization of Factors by RSM

The most important part of this study is the determination of the optimum leaching process condition where maximum critical REE extraction can be obtained from CFA. The optimum leaching condition was generated by the Design Expert Software for the REEs of interest and was found to fall at 3 M HCl concentration, 65 °C and 270 min of leaching time, which are the highest levels for each factor. There was a consistent increase in the REE extractions as the levels of the factors were increased within the chosen range for each factor. While the optimum extraction is expected as the levels of the factors are increased, this may not be necessarily true if precipitation of the target REEs occur. In the case of this study, a significant decrease in the extraction was not observed as the levels of the factors were increased, indicating that leaching with HCl at the chosen range of concentration, temperature and time did not lead to any precipitation and the optimum condition was successfully achieved.
The accuracy of the empirical models was tested by comparing the experimental and the predicted values at the optimum conditions; the results are summarized in Table 13. To be able to say that the model is accurate, the % error (i.e., the deviation of the predicted value from the experimental value) must be less than 5%. Based on the results in Table 13, all models showed errors less than 5%, therefore it is safe to say that the models established predicted the extraction of the REEs accurately.

4. Conclusions

This research has proven that the Philippine CFA is a potential secondary resource of REEs based on the criteria of Seredin and Dai (2012) with an outlook coefficient of 1.03 and a relative percentage of critical elements of 33.3%. The REEs were found to be finely disseminated throught the matrix of the CFA sample; that is, they are associated with the other minerals present that are relatively abundant such as the aluminosilicates, oxides of iron and calcium. Strong associations of the REEs with Fe, espcieally Dy, was observed which indicates that Fe will be extracted together with the REEs. The statistical analyses conducted have shown that the three main factors (HCl concentration, leaching temperature and leaching time) investigated have significant effects on the extraction of Dy, Er, Eu, Nd and Tb, with HCl concentration as the factor that has the greatest effect on the response variable. The emperical models established through CCD-RSM for the extraction of the REEs of interest were found to be accurate with a prediction error of less than 5%. The optimum leaching conditions obtained using the RSM were 3M HCl concentration, 65 °C and 270 min with an extraction of 73.38%, 76.34%, 88.02%, 70.08% and 90.01% for Dy, Er, Eu, Nd and Tb, respectively.

Author Contributions

Conceptualization, R.D.A. and C.B.T.; methodology, A.M.E.D.; software, A.M.E.D.; validation, A.M.E.D.; formal analysis, A.M.E.D.; investigation, A.M.E.D. and R.D.A.; resources, A.M.E.D., R.D.A. and V.J.T.R.; data curation, M.L.C.P. and R.M.B.; writing—original draft preparation, A.M.E.D.; writing—review and editing, R.D.A., M.L.C.P., L.C.S., C.B.T. and V.J.T.R.; visualization, C.B.T., M.L.C.P. and R.M.B.; supervision, L.C.S. and V.J.T.R.; project administration, V.J.T.R., M.L.C.P. and R.M.B.; funding acquisition, V.J.T.R. All authors have read and agreed to the published version of the manuscript.

Funding

This research was funded by The Department of Science and Technology, Philippines, grant number 2020-05-A2-1096 and The APC was funded by Curtin University.

Data Availability Statement

Not applicable.

Conflicts of Interest

The authors declare no conflict of interest. The funders had no role in the design of the study; in the collection, analyses, or interpretation of data; in the writing of the manuscript, or in the decision to publish the results.

References

  1. IEA. World Energy Outlook; IEA: Paris, France, 2014. [Google Scholar]
  2. Isaak, A. A Rare Metal Called Neodymium Is in Your Headphones, Cellphone and Electric Cars Like Tesla’s Model 3—And China Controls the World’s Supply. CNBC. 2018. Available online: https://www.cnbc.com/2018/10/18/neodymium-china-controls-rare-earth-used-in-phones-electric-cars.html (accessed on 14 March 2020).
  3. Klinger, J.M. Rare Earths Frontiers: From Terrestrial Subsoils to Lunar Landscapes; Cornell University Press: New York, NY, USA, 2017. [Google Scholar]
  4. Alonso, E.; Sherman, A.; Wallington, T.; Everson, M.; Field, F.; Roth, R.; Kirchain, R. Evaluating Rare Earth Element Availability: A Case with Revolutionary Demand from Clean Technologies. Environ. Sci. Technol. 2012, 46, 3406–3414. [Google Scholar] [CrossRef] [PubMed]
  5. McLellan, B.C.; Corder, G.D.; Golev, A.; Ali, S.H. Sustainability of the Rare Earths Industry. Procedia Environ. Sci. 2014, 20, 280–287. [Google Scholar] [CrossRef] [Green Version]
  6. Tkaczyk, A.H.; Bartl, A.; Amato, A.; Lapkovskis, V.; Petranikova, M. Sustainability evaluation of essential critical raw materials: Cobalt, niobium, tungsten and rare earth elements. J. Phys. D Appl. Phys. 2018, 51, 203001. [Google Scholar] [CrossRef] [Green Version]
  7. Franus, W.; Wiatros-Motyka, M.M.; Wdowin, M. Coal fly ash as a resource for rare earth elements. Environ. Sci. Pollut. Res. 2015, 22, 9464–9474. [Google Scholar] [CrossRef] [Green Version]
  8. Blissett, R.S.; Smalley, N.; Rowson, N.A. An investigation into six coal fly ashes from the United Kingdom and Poland to evaluate rare earth element content. Fuel 2014, 199, 236–239. [Google Scholar] [CrossRef] [Green Version]
  9. Binnemans, K.; Tom, P.; Blanpain, B.; Gerven, T.V. Towards zero-waste valorisation of rare-earth-containing industrial process residues: A critical review. J. Clean. Prod. 2015, 99, 17–38. [Google Scholar] [CrossRef] [Green Version]
  10. Smolka-Danielowska, D. Rare earth elements in fly ashes created during the coal burning process in certain coal- fired power plants operating in Poland—Upper Silesian Industrial Region. J. Environ. Radioact. 2010, 101, 965–968. [Google Scholar] [CrossRef]
  11. Taggart, R.K.; Hower, J.C.; Dwyer, G.S.; Hsu-Kim, H. Trends in the Rare Earth Element Content of U.S.-Based Coal Combustion Fly Ashes. Am. Chem. Soc. 2016, 50, 5919–5926. [Google Scholar] [CrossRef]
  12. Zhang, W.; Rezaee, M.; Bhagavatula, A.; Li, Y.; Groppo, J.; Honaker, R. A Review of the Occurrence and Promising Recovery Methods of Rare Earth Elements from Coal and Coal By-Products. Int. J. Coal Prep. Util. 2015, 35, 295–330. [Google Scholar] [CrossRef]
  13. Mayfield, D.B.; Lewis, A.S. Environmental Review of Coal Ash as a Resource for Rare Earth and Strategic Elements. In Proceedings of the 2013 World of Coal Ash Conference, Lexington, KY, USA, 22–25 April 2013. [Google Scholar]
  14. Seredin, V.V. A new method for primary evaluation of the outlook for rare earth element ores. Geol. Ore Depos. 2010, 52, 428–433. [Google Scholar] [CrossRef]
  15. Seredin, V.V.; Dai, S. Coal deposits as potential alternative sources for lanthanides and yttrium. Int. J. Coal Geol. 2012, 94, 67–93. [Google Scholar] [CrossRef]
  16. Abhilash; Akcil, A. Critical and Rare Earth Elements, 1st ed.; CRC Press, Taylor & Francis Group: New York, NY, USA, 2020. [Google Scholar] [CrossRef]
  17. Cornelius, M.-L.U.; Ameh, A.E.; Eze, C.P.; Fatoba, O.; Sartbaeva, A.; Petrik, L.F. The Behaviour of Rare Earth Elements from South African Coal Fly Ash during Enrichment Processes: Wet, Magnetic Separation and Zeolitisation. Minerals 2021, 11, 950. [Google Scholar] [CrossRef]
  18. Kalaw, M.E.; Culaba, A.; Hinode, H.; Kurniawan, W.; Gallardo, S.; Promentilla, M.A. Optimizing and Characterizing Geopolymers from Ternary Blend of Philippine Coal Fly Ash, Coal Bottom Ash and Rice Hull Ash. Materials 2016, 9, 580. [Google Scholar] [CrossRef] [PubMed]
  19. Tamang, D.J.T. Energy Reform Energy Reform Agenda Agenda (ERA). 2013. Available online: https://www.unescap.org/sites/default/d8files/Phillippines_SDG%207%20Universal%20Access%202030_Tamang.pdf (accessed on 22 November 2019).
  20. Philippines and Coal. Available online: https://www.gem.wiki/Philippines_and_coal#Coal_Consumption (accessed on 10 January 2021).
  21. Gutiérrez, B.; Pazos, C. Characterization and leaching of coal fly ash. Waste Manag. Res. 1993, 11, 279–286. [Google Scholar] [CrossRef]
  22. Dutta, B.K.; Khanra, S.; Mallick, D. Leaching of elements from coal fly ash: Assessment of its potential for use in filling abandoned coal mines. Fuel 2009, 88, 1314–1323. [Google Scholar] [CrossRef]
  23. Blissett, R.S.; Rowson, N.A. A review of the multi-component utilisation of coal fly ash. Fuel 2012, 97, 1–23. [Google Scholar] [CrossRef]
  24. Izquierdo, M.; Querol, X. Leaching behaviour of elements from coal combustion fly ash: An overview. Int. J. Coal Geol. 2012, 94, 54–66. [Google Scholar] [CrossRef] [Green Version]
  25. Singh, R.; Singh, L.; Singh, S.V. Beneficiation of iron and aluminium oxides from fly ash at lab scale. Int. J. Miner. Processing 2015, 145, 32–37. [Google Scholar] [CrossRef]
  26. Bai, G.; Qiao, Y.; Shen, B.; Chen, S. Thermal decomposition of coal fly ash by concentrated sulfuric acid and alumina extraction process based on it. Fuel Processing Technol. 2011, 92, 1213–1219. [Google Scholar] [CrossRef]
  27. Yan, F.; Jiang, J.; Li, K.; Tian, S.; Zhao, M.; Chen, X. Performance of Coal Fly Ash Stabilized, CaO-based Sorbents under Different Carbonation–Calcination Conditions. ACS Sustain. Chem. Eng. 2015, 3, 2092–2099. [Google Scholar] [CrossRef]
  28. Yan, L.; Shang, J.; Wang, Y.; Li, J.; Liu, H.; Qu, T. Experimental parameter optimization study on the acid leaching of coal fly ash. Desalination Water Treat. 2016, 57, 10894–10904. [Google Scholar] [CrossRef]
  29. Valeev, D.; Mikhailova, A.; Atmadzhidi, A. Kinetics of iron extraction from coal fly ash by hydrochloric acid leaching. Metals 2018, 8, 533. [Google Scholar] [CrossRef] [Green Version]
  30. Kashiwakura, S.; Kumagai, Y.; Kubo, H.; Wagatsuma, K. Dissolution of Rare Earth Elements from Coal Fly Ash Particles in a Dilute H2SO4 Solvent. Open J. Phys. Chem. 2013, 03, 69–75. [Google Scholar] [CrossRef] [Green Version]
  31. Cao, S.; Zhou, C.; Pan, J.; Liu, C.; Tang, M.; Ji, W.; Zhang, N. Study on Influence Factors of Leaching of Rare Earth Elements from Coal Fly Ash. Energy Fuels 2018, 32, 8000–8005. [Google Scholar] [CrossRef]
  32. King, J.F.; Taggart, R.K.; Smith, R.C.; Hower, J.C.; Hsu-Kim, H. Aqueous acid and alkaline extraction of rare earth elements from coal combustion ash. Int. J. Coal Geol. 2018, 195, 75–83. [Google Scholar] [CrossRef]
  33. Verbaan, N.; Bradley, K.; Brown, J.; Mackie, S. A review of hydrometallurgical flowsheets considered in current REE projects. In Symposium on Critical and Strategic Materials, British Columbia Geological Survey Paper; British Columbia Ministry of Energy and Mines: Victoria, BC, Canada, 2015; pp. 147–162. [Google Scholar]
  34. Park, I.; Kanazawa, Y.; Sato, N.; Galtchandamani, P.; Jha, M.K.; Tabelin, C.B.; Jeon, S.; Ito, M.; Hiroyoshi, N. Beneficiation of low-grade rare earth ore from Khalzan Buregtei deposit (Mongolia) by magnetic separation. Minerals 2021, 11, 1432. [Google Scholar] [CrossRef]
  35. Elwakeel, K.Z.; Atia, A.A.; Guibal, E. Fast removal of uranium from aqueous solutions using tetraethylenepentamine modified magnetic chitosan resin. Bioresour. Technol. 2014, 160, 104–114. [Google Scholar] [CrossRef]
  36. Elwakeel, K.Z.; Hamza, M.F.; Guibal, E. Effect of agitation mode (mechanical, ultrasound and microwave) on uranium sorption using amine- and dithizone-functionalized magnetic chitosan hybrid materials. Chem. Eng. J. 2021. [Google Scholar] [CrossRef]
  37. Wei, Y.; Salih, K.A.M.; Rabie, K.; Elwakeel, K.; Zayed, Y.; Hamza, M.; Guibal, E. Development of phosphoryl-functionalized algal-PEI beads for the sorption of Nd(III) and Mo(VI) from aqueous solutions—Application for rare earth recovery from acid leachates. Chem. Eng. J. 2021, 412, 127399. [Google Scholar] [CrossRef]
  38. Behera, S.K.; Meena, H.; Chakraborty, S.; Meikap, B.C. International Journal of Mining Science and Technology Application of response surface methodology (RSM) for optimization of leaching parameters for ash reduction from low-grade coal. Int. J. Min. Sci. Technol. 2018. [Google Scholar] [CrossRef]
  39. Myers, R.H.; Montgomery, D.C.; Anderson-Cook, C.M. Response Surface Methodology—Process and Product Optimization Using Designed Experiments, 3rd ed.; John Wiley and Sons Inc.: Hoboken, NJ, USA, 2009. [Google Scholar]
  40. Fisher, R.A. Statistical Methods, Experimental Design and Scientific Interference; Oxford University Press: Oxford, UK, 1990. [Google Scholar]
  41. Box, G.E.P.; Hunter, J.S.; Hunger, W.G. Statistics for Experiments, 2nd ed.; John Wiley and Sons Inc.: Hoboken, NJ, USA, 2005. [Google Scholar]
  42. Montgomery, D.C. Design and Analysis of Experiments, 8th ed.; John Wiley and Sons: New York, NY, USA, 2014. [Google Scholar]
  43. Napier-Munn, T.J. The Central Composite Rotatable Design JKMRC; The University of Queensland: Brisbane, Australia, 2000. [Google Scholar]
  44. Levenspiel, O. Chemical reaction engineering. Ind. Eng. Chem. Res. 1962, 11, 1055–1076. [Google Scholar] [CrossRef]
Figure 1. A schematic diagram of the leaching experiment set-up.
Suschem 03 00006 g001
Figure 2. X-ray diffraction pattern of the CFA raw material.
Suschem 03 00006 g002
Figure 3. Relative abundance of dominant minerals in the CFA sample.
Suschem 03 00006 g003
Figure 4. SEM-EDS images at ×5000 magnification with elemental map at different locations of the CFA sample.
Suschem 03 00006 g004
Figure 5. SEM-EDS image at ×2300 magnification with elemental map and point analysis.
Suschem 03 00006 g005
Figure 6. Pareto charts of the standardized effects for individual critical REEs.
Suschem 03 00006 g006
Figure 7. Diagnostic plots.
Suschem 03 00006 g007
Table 1. A central composite design RSM matrix for three design variables.
Independent VariableSymbolLevels of Coded Variables
−αLowMediumHigh
−1.6817−101+1.6817
Acid conc (M)X10.31233.7
Temp (°C)X22535506575
Time (min)X33090180270330
Table 2. Experimental runs in coded units using central composite design RSM.
Standard Run No.RunIndependent Variable in Coded Form
X1X2X3
18−1−1−1
24+1−1−1
35−1+1−1
414−1−1+1
51+1+1−1
618+1−1+1
76−1+1+1
83+1+1+1
913−α00
101200
1120−α0
121500
131600−α
14700
1517000
1610000
179000
1811000
Table 3. Relative abundance of REEs in the CFA.
CategoryREE ElementHead Grade (ppm)
StrategicScandium (Sc)16.67
UncriticalLanthanum (La)31.2
Gadolinium (Gd)5.56
Praseodymium (Pr)7.13
Samarium (Sm)5.43
CriticalDysprosium (Dy)4.63
Erbium (Er)2.62
Europium (Eu)1.36
Neodymium (Nd)26.8
Terbium (Tb)0.78
Yttrium (Y)28.0
ExcessiveCerium (Ce)58.6
Holmium (Ho)0.90
Lutetium (Lu)0.35
Thulium (Tm)0.34
Ytterbium (Yb)2.19
Table 4. Percent extraction of Dy, Er, Eu, Nd and Tb corresponding to each combination of independent variables.
Independent Variable in Coded Form% Dy Extracted % Er Extracted % Eu Extracted % Nd Extracted % Tb Extracted
X1X2X3Trial 1Trial 2Trial 1Trial 2Trial 1Trial 2Trial 1Trial 2Trial 1Trial 2
1359047.547.545.853.458.758.743.245.561.764.3
3359056.151.85 3.453.458.758.755.250.772.066.9
1659051.851.853.453.458.758.748.547.766.966.9
13527051.851.853.453.458.758.747.747.766.966.9
3659069.169.168.768.773.473.466.464.984.982.3
33527060.460.461.161.173.473.458.257.474.674.6
16527051.856.153.453.458.758.749.250.766.972.0
36527073.473.476.376.388.088.069.370.190.090.0
0.3501800.000.000.000.000.000.000.750.7512.912.9
3.75018064.864.868.768.773.473.464.161.982.379.7
22518056.151.861.153.458.758.754.450.069.464.3
27518073.473.476.376.388.088.067.870.190.090.0
2502951.851.853.453.458.758.750.052.966.969.4
25033164.864.868.768.773.473.461.961.979.779.7
25018060.460.461.161.173.473.459.659.677.277.2
25018064.860.468.761.173.473.461.156.777.274.6
25018060.460.461.161.173.473.458.959.677.277.2
25018060.464.861.168.773.473.457.461.177.279.7
X 1 = acid   concentration   ( M ) ; X 2 = leachingtemperature (°C); X 3 = leaching   time   ( mins ) .
Table 5. Percent extraction of Al, Ca, Fe and Si corresponding to each combination of independent variables.
Independent Variable in Coded Form% Al Extracted % Ca Extracted % Fe Extracted % Si Extracted
X1X2X3Trial 1Trial 1Trial 1Trial 1
1359021.278.213.220.3
3359026.079.921.118.8
1659024.481.611.920.3
13527022.878.213.220.3
3659037.479.948.820.3
33527029.379.927.718.8
16527024.483.36.5920.3
36527042.383.359.318.8
0.3501800.0049.30.000.00
3.75018034.281.643.56.2
22518024.479.918.521.9
27518039.085.047.523.4
2502924.478.219.820.3
25033132.581.633.020.3
25018030.9181.6229.0121.88
25018030.9181.6229.0121.88
25018029.2881.6226.3721.88
25018029.2879.9226.3721.88
X 1 = acid   concentration   ( M ) ; X 2 = leachingtemperature (°C); X 3 = leaching   time   ( mins ) .
Table 6. ANOVA for Dy Extraction.
SourceSum of SquaresdfMean SquareF-Valuep-Value
Model1888.769209.8655.21<0.0001significant
A-Conc778.171778.17204.72<0.0001significant
B-Temp661.341661.34173.98<0.0001significant
C-Time223.261223.2658.73<0.0001significant
AB116.451116.4530.64<0.0001significant
AC4.6614.661.230.2793insignificant
BC4.6614.661.230.2793insignificant
139.971139.9736.82<0.0001significant
10.26110.262.700.1135insignificant
38.11138.1110.030.0042significant
Residual91.23243.80
Lack of Fit35.3348.833.160.0363significant
Pure Error55.90202.79
Cor Total1979.9933
Table 7. ANOVA for Er Extraction.
SourceSum of SquaresdfMean SquareF-Valuep-ValueRemarks
Model2079.349231.0422.66<0.0001significant
A-Conc823.651823.6580.79<0.0001significant
B-Temp646.581646.5863.42<0.0001significant
C-Time293.401293.4028.78<0.0001significant
AB178.461178.4617.510.0003significant
AC32.78132.783.220.0856insignificant
BC3.6413.640.35720.5556insignificant
144.201144.2014.140.0010significant
16.07116.071.580.2214insignificant
35.29135.293.460.0751insignificant
Residual244.672410.19
Lack of Fit98.99424.753.400.0283significant
Pure Error145.68207.28
Cor Total2324.0133
Table 8. ANOVA for Eu Extraction.
SourceSum of SquaresdfMean SquareF-Valuep-Value
Model3067.519340.8347.21<0.0001significant
A-Conc979.761979.76135.72<0.0001significant
B-Temp906.661906.66125.60<0.0001significant
C-Time427.221427.2259.18<0.0001significant
AB215.211215.2129.81<0.0001significant
AC215.211215.2129.81<0.0001significant
BC0.000010.00000.00001.0000insignificant
319.351319.3544.24<0.0001significant
0.091110.09110.01260.9115insignificant
170.261170.2623.59<0.0001significant
Residual173.25247.22
Lack of Fit173.25443.31
Pure Error0.0000200.0000
Cor Total3240.7633
Table 9. ANOVA for Nd Extraction.
SourceSum of SquaresdfMean SquareF-Valuep-ValueRemarks
Model1779.439197.7156.64<0.0001significant
A-Conc938.951938.95268.98<0.0001significant
B-Temp505.941505.94144.94<0.0001significant
C-Time147.331147.3342.21<0.0001significant
AB86.85186.8524.88<0.0001significant
AC3.4713.470.99510.3284not significant
BC1.2511.250.35830.5551not significant
185.221185.2253.06<0.0001significant
1.2411.240.35500.5569not significant
32.36132.369.270.0056significant
Residual83.78243.49
Lack of Fit30.9847.742.930.0465significant
Pure Error52.80202.64
Cor Total1863.2133
Table 10. ANOVA for Tb Extraction.
SourceSum of SquaresdfMean SquareF-Valuep-Value
Model2050.339227.8145.61<0.0001significant
A-Conc782.001782.00156.56<0.0001significant
B-Temp822.271822.27164.62<0.0001significant
C-Time205.571205.5741.15<0.0001significant
AB133.941133.9426.81<0.0001significant
AC6.6116.611.320.2612insignificant
BC0.000010.00000.00001.0000insignificant
130.631130.6326.15<0.0001significant
1.9911.990.39820.5340insignificant
41.10141.108.230.0085significant
Residual119.88245.00
Lack of Fit53.74413.434.060.0143significant
Pure Error66.14203.31
Cor Total2170.2133
Table 11. Final % Extraction Equation in terms of coded factors (eliminating insignificant terms; p-value > 0.05).
%Extraction = X1 (Conc)X2 (Temp)X3 (Time)X1X2X1X3X12X32
Nd+59.3+7.25+4.3+2.32+2.33 −3.44−1.16
Er+63.1+6.79+4.87+3.28+3.34 −3.04
Eu+73.4+7.40+5.76+3.95+3.67+3.67−4.52−2.65
Tb+77.2+6.61+5.49+2.74+2.89 −2.89−1.3
Dy+61.5+6.60+4.92+2.86+2.70 −2.99−1.26
Table 12. Fit statistics for the Extraction Models of critical REEs.
ModelStd. Dev.MeanC.V. %Adjusted R²Predicted R²Adeq Precision
Dy Extraction1.9559.83.260.95390.93660.907927.1937
Er Extraction3.1961.525.190.89470.85520.794117.2442
Eu Extraction2.6969.033.890.94650.92650.878623.4966
Nd Extraction1.8757.13.270.9550.93820.907327.3827
Tb Extraction2.2375.192.970.94480.9240.878424.4924
Table 13. Comparisons between experimental and predicted results at the optimum level.
Critical REEExperimentalPredicted% Error
Dy73.38%75.01%2.22%
Er76.34%78.89%3.34%
Eu88.02%90.58%2.91%
Nd70.08%71.34%1.80%
Tb90.01%91.66%1.83%
Publisher’s Note: MDPI stays neutral with regard to jurisdictional claims in published maps and institutional affiliations.

