Geometrical Information Flow Regulated by Time Lengths: An Initial Approach


Administrative Sectorial Group, Continuous Services Sector, Secretary of State for Education of Paraná, Curitiba 80240-070, Brazil
Symmetry 2018, 10(11), 645; https://0-doi-org.brum.beds.ac.uk/10.3390/sym10110645
Submission received: 26 September 2018
/
Revised: 22 October 2018
/
Accepted: 6 November 2018
/
Published: 16 November 2018
(This article belongs to the Special Issue Solution Models based on Symmetric and Asymmetric Information)
Abstract
:The article analyzes Bernoulli’s binary sequences in the representation of empirical events about water usage and continuous expenditure systems. The main purpose is to identify among variables that constitute water resources consumption at public schools, the link between consumption and expenditures oscillations. It was obtained a theoretical model of how oscillations patterns are originated and how time lengths have an important role over expenditures oscillations ergodicity and non-ergodicity.
1. Introduction
When considering a large number of administrative agents within a public institution, several aspects of how those agents execute public services must be considered to establish a proper analysis of public expenditures and public budgets [1]. Those aspects can be attributed, for example, to how public services are affected by variables set in a complex environment. Policy making, expenditure provision, unstable budgets, and government attempt to organize a big and very complex system, commonly, found limitations due to the multilevel of aspects that influence the provision of services to society in any public sector [2]. In this article, it will be considered one example of the public provision of service of water, and its correlation between the usage by public schools and the random behavior of expenditures presented with this continuous expenditure.
A public institution, due to the multiple relations with distinct sectors of society, assumes a complex organization of how expenditure is produced [1]. To control water expenditure, it is necessary to understand the variables under this context and starting from it, understand how information unit flow among variables that compose this service. This article points an approach that analyzes variables maximum oscillations inputs and outputs in their possible interactions, iterations, frequency of iterations, and time regulations. These analysis outputs can be used as a tool for predictive management towards a massive number of administrative units that are commonly found in big countries, cities, or states.
The main positive result of this type of analysis is the variety of paths in which it is possible to interact with a public expenditure. For example, in order to reduce the expenditure with water usage at schools, uncommonly, the problem goes beyond the administrative scope, flowing into docent activities, students, parents, local community, and society as a whole. For this solution, it is required, for example, to start a water saving campaign in the schools that constitute one of many options that compose the great variable’s scenario of how water is used by nowadays life. But how much the frequency in which students consume or use water is relevant to the public expenditure? Or which variables affect this event to be considered relevant in order to have the best optimum control of public provision of service and expenditures? Is there a method that makes it possible to predict risks about messing with one of those variables? For these questions, this article addresses the possibility of adopting information flow as a measure of the expenditure system level of randomness by a theoretical view a methodological proposal.
A very similar approach to this article’s scope of investigation can be found in Buchberger and Wu [3] where time-dependent Markovian queuing system is used to estimate temporal and spatial variations of the flow regime of water demands at one block of heterogeneous homes. However, this model is not suitable for the large number of variables and sample size when analyzing a public system of a state, city or country. This same argument can be addressed and confirmed by own author’s studies, Guercio, Magini and Pallavicini [4] where, the basis method of Buchberger and Wu are carried out adapted to larger sample sizes. In this research [4], 85 residences of four blocks were analyzed extending the scope and methodology to be applied in larger samples sizes. Thou, heteroscedasticity was not considered since only homogeneous samples of users for the estimation of water usage were used as parameter.
In analyzing the article “Methodology for Analysis of Water Consumption in School Buildings” [5], it can be seen that the flows of oscillations present in continuous expenditures were related directly with water usage at public schools. Using coefficient of determination- to verify water usage characteristics among 149 public educational establishments of Secretary of State for education at Paraná, it was hypothetically confirmed that the water usage is influenced by different variables that can assume different intensities and categories at the different regions of the State with 199.315 km2 of area, 51 water utilities, and 2274 water distribution points (schools and administrative units). In this way, public schools present a large variety of features (variables, Figure 1) [2] that make difficult for managers to set a unique method to determine how to manage water consumption or other natural resource types that is of use in other public provision services. Therefore, the proposed methodology in the article [5] of knowing in large samples how water consumption in schools occurs through linear time series of analysis and coefficient of determination-, trying to extract universal indicators that can serve as a reference for the whole State, was shown to be limited, due to impossibility of evaluating and predict for future time how consumption behavior will be expressed.
Generally, indicators, such as school population size (per capita model), are used to estimate urban public provision of services, however, according to Figure 2, population factor itself can affect the consumption of water in a very smooth way, sustaining a continuous growth of consumption that accompanies the population, but does not indicate a direct ratio between population and consumption of the resource in a directly proportional order (Figure 2). The intensity in which the school population influences the consumption of water is not proportional in a quantitative aspect, and thus it is assumed that other variables exert their own internal mechanics in the event and generates modifications in the dynamics of the system [5,6].
2. Methodology
In more recent studies, linear time series and cross-checking of variable’s categories were performed [6,7], in a sequence of analysis started with Guercio, Magini, and Pallavicini [4] and Buchberger and Wu [3] in order to identify intensities and coupling effects of variables among them, or through coefficient of determination- [5], but results, subjectively understood in the graph lines, may not be sensitive enough [8,9,10,11] to a management analysis with a view to controlling the system by producing intervention actions on the variables with each other, or in isolation, or estimating what results will be possible with precision when interfering in certain processes of the event.
The per capita model, in which quantitative indicators, for example, % of the population, are used as objective parameters whose purpose is to describe the behavior of dependent variables in a system. For example, the relation between population variable and water usage per individual. Therefore, per capita model states that the larger the population, the greater the water consumption, and if not observable by Figure 2, this statement could remain as the best optimal approximation to measurement of water usage by population, assuming the cross-checking of variables [6,7] already under consideration. Although, there are other variables that influence the system so that the population factor does not have enough force to produce high vibration in the system, enough to generate the observed maximum and minimum oscillations in the consumption (Figure 2) [12]. One empirical experiment [13] for predator-prey dynamics, understanding it as resources-consumption by analogy, observations lead to the conclusion that large population and no controlled dynamics have not a per capita model explanation, enough to sustain oscillations in the ratio-dependence between resources availability and consumption. Also, the per capita model, according to Dahl, Bhattacharyya, and Timilsina [9,11], is a reduced method of investigation when the variables in the system present dynamics, therefore, assuming heteroscedasticity form.
From this brief historical point of view, methodologies to estimate water usage in buildings have shared main concepts, evolving towards new knowledge, and mainly serving as empirical methods for specific analysis. This feature allows for water usage estimation to be investigated only by real situations, not giving a glance of a possible theoretical view of the problem. In other words, a method in which oscillations of water usage can be predicted by a theoretical view, composing administrative knowledge of private and public organizations. This knowledge could cause positive effects for planetary distribution of resources at every dimension of human organization, being it residences, commerce, industry, cities, states, and countries [11].
In Figure 2, it is possible to see ranges of population in blue (μ = 0–200; 500–700; 1000–1200; 1400–1700) from public schools at State of Paraná, Brazil. Those ranges are compared to water consumption in red and the objective of these data was to arrange a discrepant rising for population variable intending to see if water consumption follows population increases proportionally. The observable result was an influence of population sizes at water consumption in a very smooth way. In this sense, using demographic bases with per capita methodology as management indicators might be imprecise and controversial criteria [14], since, in fact, there may be hidden variables [15] that influence the final set of the event.
For better methodological results and risk analysis in this article, it would be more accurate to analyze the variables of a system in ideal sense rather than a realistic data as Figure 2. The reasons to opt for it is to investigate if there is a prior organization of the event influenced by other aspects, in which it becomes possible to make approaches on the quantitative aspect of frequency [16] with which the variable population and water consumption interact, excluding other traditional data correlation. Though, the frequency aspect of consuming water by population was not considered in an exact sense (real time for each trial), but an ideal model reflecting the binary mode system of Bernoulli’s method of analysis. Following this way, it is possible to indicate possible sequences of interactions between variables more than the set of intensities in which the variables express themselves [8,17], trying to see if organization of elements in the event through time assumes more relevant outputs regarding expenditure oscillations, than only considering the quantitative aspects of how much water each individual consumed. This approach is not suitable for Granger causality techniques due to particularities of variables and samples range of variance that can reach a broad output and heteroscedasticity [9,11,18] (Figure 2—red data).
The analysis of this article brings not to trivial ways in calculating by the method of Bernoulli the probabilities of an event in occurrence at first, but the analysis of static parameters of information (deterministic starting condition) inside a system of linear binary sequences, being this last characteristic investigated relative to the number of iterations, frequency, and time of which can result in many possible expressions when the function of time distorts variable’s expressions. Binary trajectories do not express probabilistic modifications through time regarding the presence or absence of variables, but in the model given, express frequencies distortions, which may lead to new properties of information flow and probabilistic time dependent variables. In this way any binary system with the same mathematical starting conditions already reflects the same methodology that was developed in this article and the main objective for this that is to analyze oscillations of systems by a multivariate and intuitively stochastic model based on numerical information that was extracted from Bernoulli sequence method [19,20].
The main approach to this method for dynamical systems will be shown as how oscillations of panel data (Figure 2) can be caused by time regulation flows at small events (microstructure) that compose the entire system (macrostructure). Leading to posterior pathways regarding entanglements of other small events [16]. In this way, chaotic behavior could achieve equilibrium and a freeze phase state of patterns in variables that promotes oscillations [16]. It means also in other words, to regulate flows of information by time, understanding it as to regulate the order of iterations in its expression’s frequencies. For this reason, linear time series method is useful only for checking data variance on time, but do not constitute as a method for problem issued by this article, since the phenomenon is not an expression of iteration of time to be measurable, but a frequency in which iterations assume on time, a specific order (pathways) [13,16,21].
Presume for the non-ergodicity of data in Figure 2 for water consumption, as well it follows analogously for the expenditures at a public institution, as caused by the smallest time flow of information for each pathway (variables affecting the system in their coupling functions) and its frequency of iteration along it. In this sense, the flow of information in the system assumes geometrical or non-geometrical properties possibly periodic by time lengths. For the observer, consume seems to be random, but for the internal movements of sequences, the geometrical properties of variables can be extracted when considering an information theory approach. Population and consume is one example to be issued in this article, but not limited to it. The aim of analyzing oscillations by information theory and Bernoulli sequences is to indicate whether the numerical information can be used as a tool for predicting the behavior of stability or instability of expenditure systems rather than probability density functions or queue theory. This way it becomes possible for the manager the decision making process and management purposes.
2.1. Theoretical Framework of Experiment
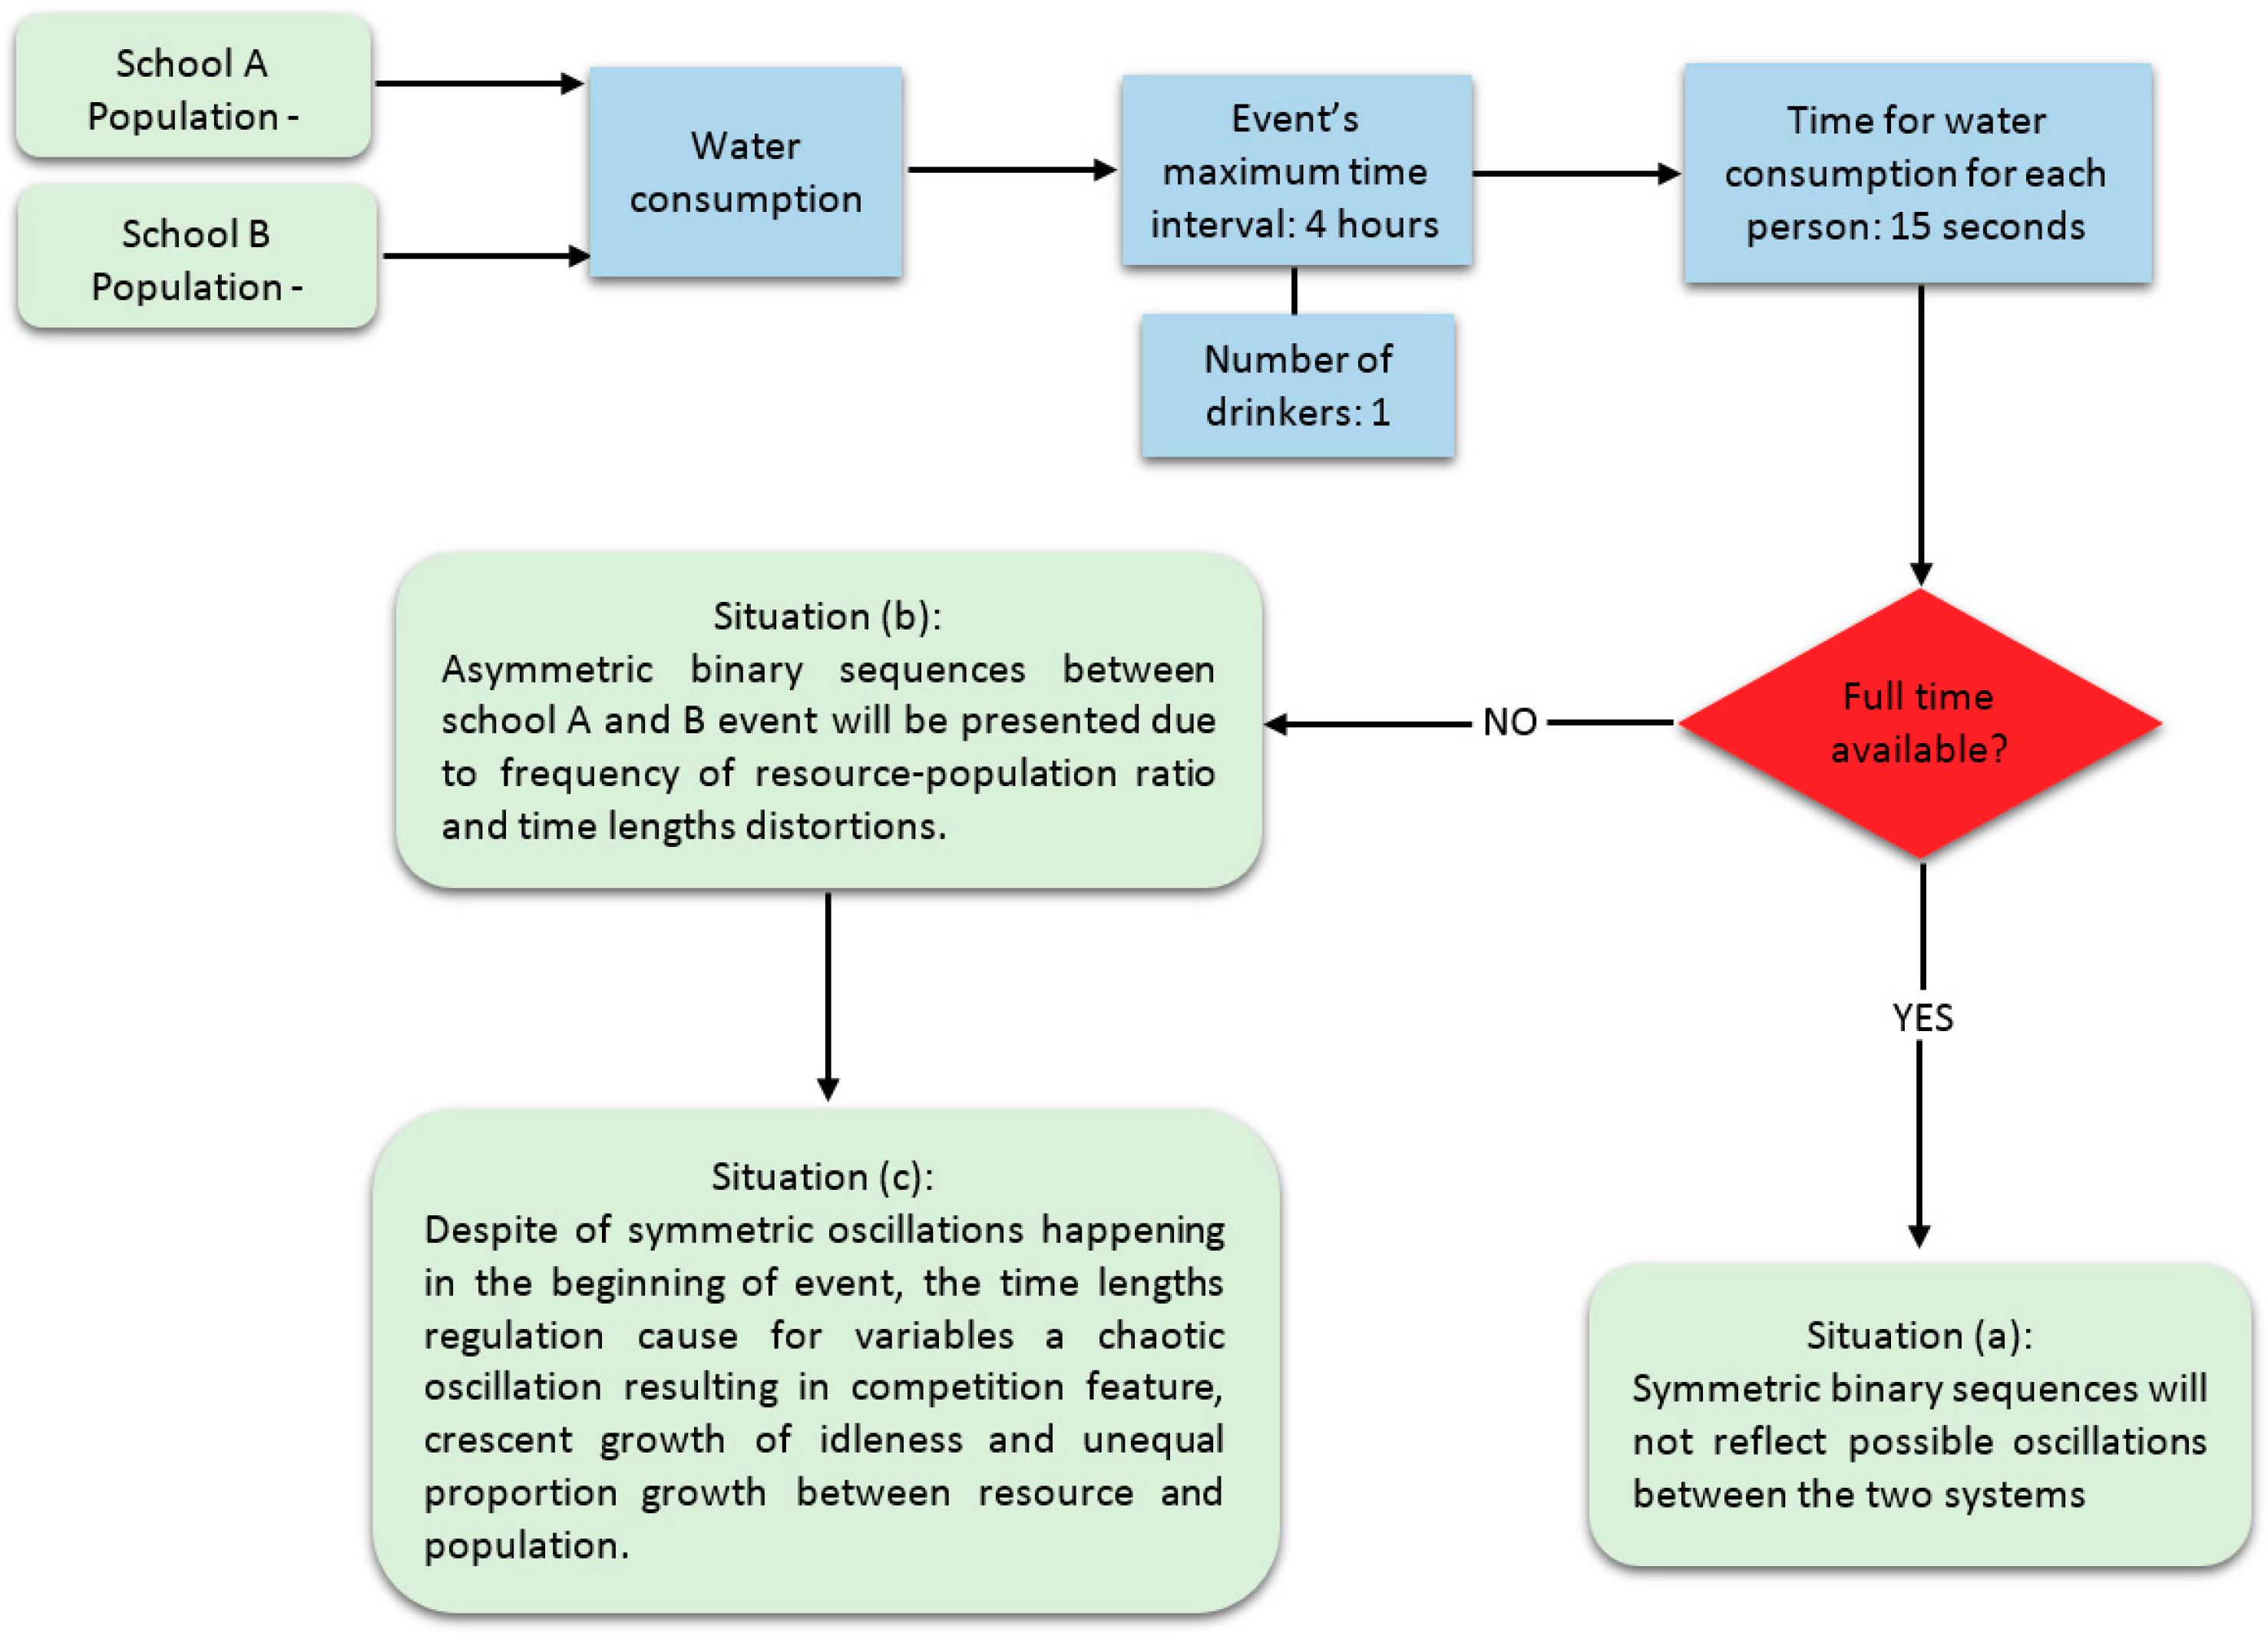
As a model of analysis, the microstructure of events that compose water expenditures will be represented by a single framework, in which concepts can be analyzed regarding how modifications at the microstructure can affect the macrostructure as well. Considering a main concept of the theory of information, in which low probabilities of events contain more information than high probabilities [22], the methodology demonstrates how in an ideal model, variables assume a Bernoulli binary entropy information modifying its possible probabilities and ergodicity due to the time aspect of the event and the flow of information. The theoretical experiment can result in the following situations according to Figure 3.
In order to problematize the effect of maximum entropy of information [23] in two systems with equal starting conditions (Figure 3), when considering the model of analysis in which two schools work in only one shift with time schedule of 4 h. Which difference exists between the two schools relating to the size of their population (number of students) as a function of water consumption, for every 15 s? This theoretical experiment will describe different analyzes, considering interactions between one by one individual and resource availability through time. Time is considered as the main factor in which iterations (frequency of interaction between variables in quantitative aspect) exert more influence on the behavior of the variables than their probabilities from binary sequences [23]. To start the theoretical investigation, it was selected two sample sizes for analysis. They present five times unequal proportions: school A, and school B, , and the number of drinkers in each school: 1.
2.1.1. Information Flow and Ergodic Properties
Theorem 1.
Considering the systems as ideal and not possible of having non-observable variables that directly influence consumption behavior. For both systems (school A and B) for the first 15 s (Y), there is the possibility of a student consuming the resource, and the opposite time and space effect that none will consume it, (without possibility of the same individual consuming again). Indicating the consumption of resources by an individual as “1” and not consumption, “0”, in a given number K of dependent iterations (a function of time), the constant flow of variables is contained in the time, as it is indicated in the following Equation (1):
After the 15 s end, there is the second expression of the system as a potential possibility of another student repeat the starting condition. Resulting as,
Lemma 1.
Given the probabilities, the events (variables) of success p and failure q, are considered asand, where the variables p and q are dependent and not identically distributed (not iid), and we get the following probability of the event:. The odds of the event following the given probability can be set as:
Proof of Lemma 1.
Since, the system has a geometrical property, for all binary vectors , it obtains 100% odd for any time length as Equation (3):
☐
However, the main concern of this article is not to calculate the probability of the event on time (Y), but to verify the behavior of the event from the point of view of the binary sequences and information entropy as a method that makes it possible to visualize the event in its information characteristics, such as oscillation properties. When the probabilities between the two systems are identical and not observable in Bernoulli’s method in terms of probability density function regarding the behavior of the two systems as compared to each other in the function Y, it can be of use considering the frequency in which variables and have their iterated behavior regulated by the time. Therefore, to conceive the analysis as information entropy [22] of the system, the variables considered assume an evolution on time in bits [24].
As time Tk passes, there is a growth of the variable and revealing binary sequences that repeat cumulatively and asymmetrically on time length , according to Table 1.
The sequences originated by bits of information and distributed by variables with geometrical properties can be described by the next Equation (5) and Figure 4:
where, in other way it can be represented as a combination of variables defined as: , and so on.
Proof of Theorem 1.
The probability of the infinite sequences of iterations set to happen in values 0 and 1 is constant as k becomes infinite and remains always in the given proportion of 50% [25]. where,
☐
Figure 4 can be represented by the Figure 5 where both variables assumes in ideal condition an evolution on time presenting constant probability and oscillation. Regarding the odds of 50% for the sequence evolution, for realistic conditions, it is not correct to assume that value neither for the theoretical investigation of this article, in which it was considered a constant flow of variables performing constant sequencing. For that point, the article describes the event for the most ideal behavior of variables (deterministic) when considering it as the parameter, a model, in which for real life situations, analogously, it is possible to exclude the interference of multiple other variable’s effects from event, as seen in Figure 2, whose presence in it have the punctual potential of affecting the final results and it will be shown in a later Section 3. Results, that frequency, iteration, and time can be more deterministic in organizing the event than other external variables of it.
In Figure 5, the x axis represents the resource consumption trajectory while y positive axis represent population interaction () with resource and negative y axis, the variable . is expressed in the same manner as in the time function Y and as a necessary effect caused by resource consumption and individual interaction. The information sequence, from the left to the right, in which the variable and are expressed reveal common periodic oscillations (constant patterns of event starting conditions), in which regardless of the size of the sequence, the results will always be the same. Thus, the maximum information entropy [23] of the system is finite or infinitely constant, but asymmetric on time length regarding the alternated presence of variables and set to happen. The evolution of iterations (Y) perform a periodic oscillation or as a geometric variable L, consisting of a constant odd of events on time, whatever the time length chosen from the sequence.
Theorem 2.
Following this path, the ratio oftois shown as increasing, but asymmetric in the length of Y function as a geometric variable L:
In this sense, it is possible to affirm that both the population of and will have consumption and idle time, defined by Y, in which the variable and will not have different expressions of probability and maximum entropy of information for both populations. Otherwise, a result is obtained where time affects event influencing number of sequences to happen defined by the following Equation of Cauchy [26]:
where,
Produces dynamical properties in the event as:
Resulting in,
The geometric variable L affects infinitely every time , expressing turn shifts between variable and . The geometric variable L expresses no probability functions, except if determined by Y, in which this article aims to associate with resources management within a system as a simulator of resources distribution management. This is represented as:
where L is equal to,
The probability of Lk is equal to the variables and in its probabilistic expressions as follows:
Proof of Theorem 2.
If then bits. ☐
Some patterns are produced as constant features of the system. They are the probability and entropy of , and geometric p. But, other variables influence the event, the number of iterations (Y). This effect, as represented in Figure 6, counts towards amount of resources available and population size. Y can be represented for managerial purposes as a controlling tool in which types of resources management can be achieved.
2.1.2. Information Flow and Time as the Cause of Oscillations
Considering the event in the starting condition as a linear system, and consisting of two dependent random variables, with memory and probabilities in maximum finite or infinite lengths, constant and equal to ½ for both variables (stationary process). The expressions of the possible trajectories remain constant in sequences that are repeated alternating the presence and absence of one of the variables in each iteration (asymmetric). There are constant oscillations in the event (geometrical variable), except if the variables and are regulated as a function of time Y. It is observed that the variables and assume on time specific behaviors (non-ergodicity) that can be used as management tools for random systems (nonlinearity). In this way, a complex model for population sizes and natural resource distribution was obtained, sustained by concepts of iteration, frequency, and time regulations.
Analyzing the non-oscillation properties of any event by the theoretical framework, the management of resources and population can assume distinct effects on time, types I and II of information flow, according to Figure 7. Variable A = resources; Variable B = population.
Coupling effects of variables and towards variables A and B, regulated by time Y and with the geometrical properties of the axiomatic conception of variable and .
It means that the two bits of information, in ideal condition, can be controlled by an external variable (time) without changing the maximum output of oscillations due to the geometrical property of variables (Figure 7). For other types of entropy information, different behaviors will be observed. Two bits are easier to regulate with time than, for example, 15 bits due to low variance and length of variable’s distributions. Entropy information flow in the example given remains constant as time passes. However, it is possible to control the distribution of information (resources flow among interactions) in the given system for arbitrary inputs and outputs [16]. The effects of regulating the event through time can cause specific effects for the phenomena. Therefore, for managerial purposes of this article, the amount of information distribution can be influenced by coupling conditions (time length or other dependent variable) with small or big intensities, making possible to obtain low risks and optimal control concerning the flow of resources in a given set of elements that constitute the event, being this flow understood by how variables increase in interaction’s frequencies as time of phenomena goes infinite (see Figure 3). The effect of it for real systems is observed for the coupling functions regarding bit distribution and real system frequency quantitative aspects [8].
In contrast to the nonlinearity properties, if the time be considered in terms of short or long duration (Y, the number of iterations), it is possible to affirm that the larger the school population, the lower the water consumption on time (Figure 8), in an effect of increasing the frequency with which the variable will be present in the system. Larger population (considering interaction process active, not counting idle population) generate more void spaces (variable ) and soon extend the resource consumption over time when compared to smaller populations. In the problem in question, a variable , defined as the number of drinkers in the place, will affect the dynamics of the event, however, although there were two or 10 drinkers in the place, still the system has its behavior, as already described. The difference in the increase in the number of drinkers is at the rate of frequency with which the water resource is consumed and the increase of frequency with which the variable of the system also expresses itself reducing its effect due to the large number of drinkers. For management purposes, it is possible to reduce the number of drinking troughs to reduce resource consumption or increase as needed. It is to be considered that a large number of drinking fountains are inefficient, as idleness in the system is a constant and not very large quantities of drinking fountains would be required to provide water for an entire population of, say, 1000 students for a better distribution of the resource.
The main objective for the manager is to work with the risks and uncertainty of the system in order to analyze how the system expresses itself and to have the best decision making [14]. The example that is described in this article illustrates situations that are present when large numbers of public management agents regarding the administrative and financial scope for several types of provisioning services are considered to achieve the best optimal solution for distribution, containment, or reduction of resource consumed. However, methods considering the linearity constant among variables that compose the expenditure systems might fall into false results, due to oscillations present in the system and information flow’s frequency and time aspects [28,29]. In this way it is possible to use the results of analysis in maximum entropies of information on identical systems as an indicator of how to operate the system’s variables.
The Figure 6 represents the behavior of variables and as a function of Y and not as a function of probabilities.
The Figure 6 indicates that the larger the population, the longer the time for water consumption and the Y function, in the opposite direction, the larger the population, the lower the use of water on time. This conclusion will be explained in Section 3 of article.
Consider now the use of the resource by individuals, with the possibility of repetition, in other words, it is possible that an individual will ingest water again. Thus, it is concluded that the higher the school population, the lower the water consumption, in an effect of increasing the frequency with which the variable will be present in the system in a certain time of analysis and not proportional to the number of different individuals who will have access to the resource (y negative axis beyond value , see Figure 9). Following this situation, Figure 9 shows how projections of population-resource ratio will be increased, also expressing saturation in the system towards the time available for all the individuals. It is an example of suboptimal ratio among variables if compared with Figure 5 resource trajectory lines, which may cause initial oscillations regarding binary sequences flow.
When it is defined that oscillations can be caused by the frequency with which the variables in a system interact, it means that, in addition to the example of Figure 9, there are other more complex interactions that promote great fluctuation in the continuous expenses of a public institution. One important interpretation of the Theorems 1 and 2 is that the amount of water consumed in buildings, population or else, cannot be interpreted as a final expenditure value, but it reflects more to a budget. In other words, if consume is caused by variables affecting the system, it is not possible to assume an expenditure (continuous and previously planned financial resource) as a direct reflection of water usage, but rather, as a reflection of how iterations, interactions, frequency, and time are leading the system’s network. If manager does not see internal features of the system, water, or other sort of resource distribution will not be appropriately achieved and on the contrary, budgets are annually being generated.
3. Results
For this section, there are items, ordered as (a), (b), and (c), and are represented also by Figure 5 (methodology section).
(a) No matter the size of sample, if time has short length, systems have no influence of order towards elements in a given set.
In real situations, short time intervals that are available for students, of about 15 min at our hypothetical schools A and B, have no influence on water usage if comparing each other, no matter how much population it has. This can be caused by the low amount of information flowing in the system for the entire sample. Since time interval is short and variables require naturally some time to be expressed (individual-resource interaction), low amount of interactions will be obtained due to time maximum interval, reflecting very tenuous oscillations to occur. It means the oscillation’s effects of the two systems are nearly zero if compared against a long time run that would cause enough time to variables and express frequency features. Also, another feature of population sizes is that, since the binary sequences were shown to be constant for both populations of and , in the beginning of event, and, relatively, the binary sequences of each group will not express variations between them caused by order invariance effect, in which, as showed in Figure 10, repeated iterations don’t differ from itself in ordinal response. But, express high oscillations properties if iteration assumes frequencies regulated by time lengths. In consideration of a real approximation of the event, in which there are different values in the time of water consumption and idle time of , and after it, the results will be redirected to a nonlinear system in which properties will be demonstrated in item (b) and (c).
However, it is possible to assume that not all phenomena have any influence of order in the entropy outputs. In this particular case, the article explores this effect, in an ideal simulation. On the other hand, for all possible sequences of expression between variables in a system, there are possible paths in which each variable assumes specific aspects in ordered repeated iterations [16].
Non-Ergodicity
(b) In a given event in which manager needs to make a proper distribution of resources for all elements in a set, the proportion of resources needs to be equal to the number of elements of the set, however, if the time of event is relatively short to provide enough length to the number of element’s correspondences, the resources are not going to be equally distributed among all elements. Incorrect management of resource distribution will probably be reported.
Phase space formation: the provision of a given resource for the population will have lower quality than expected if the objective is to provide a resource for the largest number of participants.
The assertion can be understood by the aspect of the analysis of the binary sequences of the event, in which, as there is s frequency of resource consumption, there is also the frequency of idleness for the consumption [21], which are added together and generate the impossibility that in short time length, large populations can consume a certain amount of resource.
To correct this effect, it is necessary to extend the maximum time of the event or to increase the speed of the variables that participate in the logistics of distribution and supply of the resource to the individuals.
The next Figure 11 represents the limiting situation described before, in which at a given time limit, the population consumes a certain resource and part of the population will not have access to the resource (interaction effect and not per capita aspects) due to lack of time or variables that influence the logistics of the system.
(c) In a given event in which manager needs to make a cut in the resource’s distribution for all elements in a set, the proportion of resources can be lower than the number of elements of the set, however, it needs to adequate time of events in a way all elements and their expressions are not going to be able to supply themselves in the given time. Competition or lack of supplies for system’ elements will probably be reported.
Phase space and time influence: Following the previous analysis, the difference lies in the logical proposition that instead of being necessary for the participants to consume the resources, the aim is non-consumption. Thus, the larger the population in a given location, the less time available for everyone to consume the resource equally, when considering for this the non-modification in the variables that provide the logistics of distribution and supply of the resource in the system. This example can be seen in Figure 12 and Figure 13 where the situation was simulated for observation. Note that, in this system, there are flows of resources and population in continuous growth. Despite harmonic oscillations happening in the beginning of the event, the time regulation cause for variables a chaotic oscillation due to competition feature, crescent growth of variable and unequal proportion between resource and population in general. This scheme can be seen in Figure 8.
Note that every type of phenomenon has its own hidden variables, leading to specific causation effects. In the example given, organisms present life related characteristics to be expressed, such as competition, mutualism, commensalism, predation, parasitism, and other multidimensional features related to physical, chemical and biological properties.
The analysis of information by means of maximum information input and output in binary Bernoulli sequences in this sense exposed reveals that the ratio between variable and increases as time passes, but not necessarily in the same proportion due to external time regulation and other coupling effects (hidden variables). For realistic conditions, time is not determined for the variable Therefore, it is concluded that there is no direct proportion of water consumption, the number of students and the time available for water consumption, since the non-consumption idle time (beyond the own existence of variable void effect) exists and is expressed indefinitely in the system, removing from the final result of the system possibilities of prediction on the previously treated question that the population directly affects the consumption of water in its quantitative aspect only. This count not only for repetition feature, but other characteristics mentioned for Figure 12.
When it is taken during observation the effect of time lengths within the investigated event, much more than the quantitative aspect of the population, it is the frequency (length of event-time regulation) with which the variables interact that generate distortions. That is for management purposes a possibility to modify in nondeterministic flows, the ideal geometrical property, turning the system into a nonlinear event, which is observable to the manager in a theoretical and realistic way, leading him to decide which ways to opt for intervention effects on managing risks regarding optimization for resource distribution or containment in a system [14,18].
For better visualization of phase portraits and theoretical description of the experiment, it will be represented in Figure 14 and Figure 15, for example, a population-resource ratio situated in ideal condition of a restaurant. In Figure 14, the ratio is relatively constant, and in Figure 15, time regulation takes effect, modifying the event organization.
This Figure 15, with the same situation described in Figure 14, at the time of 17, time runs over to access resources, and it is observed an increase of individuals at queue as well variable and resource availability. In this point 27, hidden variables start expressing through the system, such as competition, mutualism, or other sorts of social behaviors. This effect causes the individual queue to be reduced by stress condition or positive association between individuals. As queue line reduces, resources are over consumed at a given short time proportionally by the number of individuals feeding at the same time. Variables remain relatively constant due to the new form of “queue organization”. Starting from 39, time axis, another state occurs in the event. As resources start running out, individuals have to wait for new provision, raising variable in the same proportion as queue organization starts to be formed again.
As variables of the system start oscillating, resources seem to follow this direction of influence. The next Figure 16 and Figure 17 are presenting two distinct situations of population-resources ratio. First, Figure 16, the proportionality of variables is stable, assuming the same values of 1 and 0 for the same y axis as each unit of time passes. There is an increase of proportion between the two variables and at the same rate.
The Figure 17 shows the opposite situation where deterministic to chaotic behavior starts forming. It is possible to see at Figure 17 the oscillations starts similar to Figure 16, and when time intervention starts, population keep increasing with time, but variable ceases to grow. This effect is attributed to the interruption of interaction between and resource. As soon as hidden variables are triggered by time regulation, the flow of population keeps increasing in the same ratio, but is accompanied by an abnormal growth of variable , caused by the saturation of individuals in the locality. This new configuration points out to the expressive reduction of resources due to a large number of individuals consuming as well cease of the state due to resource scarcity. After resource attractor ends activity, the system gets back to the original state (indicated arrows at Figure 17) and it can possibly keep flowing with the same features as far as all elements of the system are present as starting conditions set.
In Figure 18, exploring the view of Figure 16 and Figure 17, binary values are displayed in Cartesian graph. Circles in black represent the raising of binary values at y axis starting from 0 to 1 and −1 and present continuous growth. This view is a little coarse, but it can give a glance of event phases and evolution.
Note that at second arrow in Figure 17, as resources are continuously available, flowing keeps repeating the same configuration. In the case of resources or population goes decreasing this second arrow state keeps reducing as previous state until it finds the zero point plot. Another consideration about variables distribution is about the recurrence of binary distribution when only population decreases. Consider this recurrence effect as instead of population goes increasing, its number after variable start reducing, and it decreases with the same proportion of variable . In this situation, the chaotic event formed before will be dissolving into the population and variable reduction. These descriptions can be observed in Figure 19.
4. Discussion
The scope of the article relies not only on resources consumption, managerial or risk assessment for administrative, or financial aspects of public administration but other issues in which analysis of information is set by the conditions exposed in the methodology section. For this analysis, the main proposal for future research is to deal with the flow of information in a nonlinear model system regulated by time aspect. Also, different views about the issue can be addressed, not only by information theory, but other disciplines with a variety of possible dimensions of analysis. If possible to control the flow of information by creating chaos and deterministic features in the same event, as the number of bits remains static or can have patterns of formation, deformation, defined phase spaces, it is possible to adjust the entropy through time lengths resulting in many possibilities of control and assessment of a sample towards physical, chemical and biological dimensions, considering it as a broader suggestion of analysis for the specific conditions stated for solving article issue problem.
The main proposition of considering time as a tool to regulate entropy flows is addressed to the aspect of how oscillation’s behavior of variables can express in a phenomenon, and it reveals how entropy flows within the system and how the evolution of process can be forwarded or having a reversible state, to the containment or better distribution rules desired to be achieved. What if a duality based phenomena or other chaotic systems can be sustained by binary based events and have regulations caused by time lengths? [3,4,9,11,13,16,22,28,30,31] The intervention at binary based thermodynamics scope is obtained as far as its expressions can be time regulated and dependent on the specific internal logic of variables interacting within the system, and it means by axiomatic reasons, making it possible to dismantle (control) the binary valued orientation output of interactions in terms of flow directionality for multiple variable based events.
Regarding duality based phenomena, the possibility of reversibility of a particle state of energy can be attributed to time effects as well [30], where the amount of energy accumulated through sequences is delivered into partitions due to time limits at sequences formation (event internal logic and elements). Those approximations lead to a conception of starting and ceasing the particle-wave function sustained by energy flows, oscillation maximum output (entropy), and time regulations for pathways optimizations [21].
It is observable, for example, an empirical research about information theory for Risk-based Water System Operation [31], where forecasts for rainfall and water level measurement are time dependent. However, the results points for a perfect prediction for small periods of time, it confirms time as a factor that disrupts predictability regarding behavior of variables rather than potential information entropy [16]. When considering this thesis as a confirmation of the fact that thermodynamics concept given by Shannon [32] assumes, for these results of forecasting, the small effect in which each binary based interaction event tend to give several unpredictable outcomes due to diversity of pathways, but, nonetheless, those features are time regulated [3,4,9,11,13,16,19,22,28,30,31,33,34,35,36,37,38], and phenomena of this kind are promoted by the flow of sequences among one unit to another one, composing the whole system as far as it has enough time to express its potential phase spaces.
One empirical example that is very similar to this article, but does not offer a mathematical and a theoretical model of the problem presented, is the experiment [33] where resources that are consumed by bacteria are regulated and it modifies aspects of bacteria competition, evolution and survival. When experiment makes resources a case of availability and flows, it acts as a time regulation of events, giving results that are expressed in this article as found in “Nonlinearity from deterministic conditions” section. However, variable’s properties (internal logic as mentioned in the last paragraph) differ between considering human water consumption or bacteria resources interaction, but the results and the event as a whole have time regulated dynamics analogously. Results overview can be observed in discussion section [33] and by the theoretical framework obtained through time regulation method, it is possible to anticipate future discoveries that could be derived from the experiment with bacteria [33] or with other investigations. It means iteration (number of organisms and variables expression), frequency (of iteration), and time are capable of disrupting any results obtained regarding survivability, evolution and competition of a life form. This statement is a suggestion for researchers of this field.
Another study very related to the approach that is presented in this article is about nutrition and scarlet fever mortality correlation in the 19th century [34], where it was observed wheat prices oscillations causing consequent mortality oscillations in the same ratio. According to information sequences that are regulated by time lengths, the correlation between variables can be predicted by investigating the maximum oscillation output in which frequency of iterations exhibit caused by time influence in the micro event of the disease-nutrition ratio. Possible other variables of biological origin will count towards the results making oscillation output be wider than expected.
The main objectives for future researches in sequence to this article results should be focused on control of oscillations in a given flow of information. One main aspect of oscillation observations can be attributed by the concept of transfer entropy and asymmetric information flow at different scales [20], where, when comparing different samples of resources distribution and population sizes, the effect of a time interval as described in this article will cease the constant probability distribution of variables and , resulting in the chaotic behavior of variables, as was analyzed in Figure 12 and Figure 13. The transfer of entropy among different samples could be described by appropriate methods in the previous condition adopted in this article example. Also, the proposed model analyzed gives a general view of binary system functioning for realistic events, system main concepts that organizes the events (iteration, frequency, and time regulations), a model for information theory analysis, probabilistic system analysis, empirical experiments analogous to the example given in this article, information entropy flows, and specific researches to be carried out in future time, such as:
- -
- -
- vector based diseases [35];
- -
- -
- -
- -
- logistics aspects of administration and commerce flow [36];
- -
- -
- engineering of materials [37];
- -
- -
- language processing regarding space and time accelerations or other biological aspects [22];
- -
- -
- -
- duality based and quantum based phenomena, such as economics and particles and other fields of knowledge related to the issue [30]; and,
- -
- computing, networking, and communications [38].
The use of the Poisson distribution is not possible due to logical requirements of method and the ideal condition in which the method is presented, that is the opposite conception adopted by Guercio, Magini, and Pallavicini [4]. The consumption of water resources in the given example of this article is orientated by the continuous trial of events that are dependent of the previous trial, resulting in the failure of the method proposed if observed from the view of Poisson’s method. It could be possible to describe the same phenomenon researched in this article considering a realistic system for the event using Poisson distribution and check if the results go to proximity of characteristics described before, since in realistic analysis the trials are not given by the ideal condition used in this article that considers every trial in the sequence of happening without delays or null time-valued sequence. However, the main task of the article is to show how event even if perfectly scaled in proportion (geometrical properties) assumes nonlinearity that is caused by time, originating a higher flow of information, no geometrical properties, diverse information patterns, probabilistic densities function, and as a result, high oscillation of phenomena expressions. These features are very similar to realistic systems involving natural resources consumption and population sizes or others nature events. In this way, it is possible to confirm realistic system’s equilibrium in chaotic randomness from previous conditions that is achieved when the same properties of ideal condition (deterministic) analyzed in this article express specific behaviors regarding variable’s distribution under time effects of length. This way, geometrical or not geometrical variables can be controlled in possible expressions by analyzing trajectories of each variable among themselves along finite or infinite iterations (time regulation).
It is possible to observe, for example, the use of queue theory that is associated with time regulations, in which, the pathways are designed with probabilistic density functions after time regulations oriented the intended information flow process to be achieved. This confirms the hypothetical framework of this article relating the basis potential entropy of systems and remodeling methods through time in order to extract queue theory best approximations [3,38].
For an open event, it means that there are flows of variables that increases with time and for a closed event, where variables in the initial condition are the same in the end for any given time (fixed number of samples), there are two frameworks of analysis considering the issue the article investigates:
- (a)
- proportionality between/among variable’s distribution (for open/closed system)—linearity
- -
- General management of deterministic flows methods; and,
- (b)
- disproportionality between/among variable’s distribution (open system)—nonlinearity
- -
- Time regulated dynamics.
5. Conclusions
The analysis of information flow by binary sequences of Bernoulli regulated by time lengths can be of use to predict the behavior of nonlinear systems in a continuous way, allowing for the manager to visualize the events in their particularities of oscillations behaviors. This way, low amount of information in a non-linear system, as Shannon already stated, gives high probability and high amount of information, gives low probability. This statement can be forwarded accordingly to time regulations to investigate oscillation properties of systems of which in low amount of information, the time effects are unable to produce high oscillation properties. On the contrary, high amount of information that is associated with time regulations, can result in high output of oscillations. The analysis does not take place as an exhaustive methodology for understanding these types of events. However, logical propositions arising from such analyzes can be useful for planning, monitoring, and controlling complex systems in order to reduce the estimated risks for these events. Phase space of event investigated in this article was no performed. Though it was mentioned in results section, further studies are required. It is suggested to study behavior of event in its recurrence plots and establish more specific relations with subject fields of knowledge.
Another conclusion arising from article experiment is to demonstrate how non-ergodicity of variables that compose water consumption (microstructure) at schools is responsible for non-ergodic oscillations in water expenditures (macrostructure). The information flow found in water consumption at schools is very high in terms of interactions, iterations, frequency of iterations, and time expressions. These properties lead to a high level of oscillations in water usage, leading as well to an unstable degree of water consume from each one of the 2000 public schools. As a symmetric result, the instability that is produced in water usage reflects with instability of expenditures observed for all the public provision of service. This relation was discussed as a possibility of using these type of analysis as a tool (indicator) for managers in order to be able to infer in complex systems of expenditures, how to reduce unwanted effects, such as continuous growth of expenditures, chaotic behavior of the system, uncertainty and summarizing it, very suboptimal public administration, and the use of tax money.
Also the article scope of investigation brings a glance of how time is related to phenomena where diverse variables that are located in a chain of events, in which, probabilistic functions can assume an evolution of density and retrocede in its own properties regulated by time lengths. These densities evolutions promote together with other variables, increasing margins of possible outcomes in a complex chain of events, giving the whole view of deterministic to the chaotic control of events in duality transformations for each pathway of the event. In this way, it is possible to regulate through time the frequencies in which iterations assume the main role of possible oscillations in the event, thus reducing the non-ergodicity of the system as a whole. This statement was performed in theoretical view, using water-population ratio of interaction, iteration, frequency of iteration, and time regulations. It is considered as an approach for future researches with the same characteristics of this study. The objective to finish this approach is related to not only use the last paragraph statement as an indicator for a manager, but also have the possibility of measure the dynamics of all variable’s information flow leading to the capability of manipulating events and therefore, increasing the precision and margin of possible outcomes.
The last, but inferred conclusion, at first can be considered as an unobservable factor, the analysis of conditions of which a system is, when the number of iterations through time, affects the expression of possible outcomes (pathways) of the event changing its internal probabilities or entropy flows. But, in this sense, the flow of information is a function of interaction, iteration, frequency of iterations, and time regulations effect rather than potential entropy of information presented in the observed event or variables at their starting conditions. This view can lead to the new possibilities of controlling deterministic to chaotic behavior in nonlinear phenomena. Following this line of phenomena observation, simulation methods can describe how resources demands arise from complex systems, being able to predict by simulation the oscillation levels of each dynamic variables that compose an investigated event. These observations results are priority actions needed for administrative provision of services and other related areas, giving the possibility to the manager to avoid uncertainty and aim at the best optimal outputs in the deep complexity environment.
Funding
This research received no external funding.
Conflicts of Interest
The author declares no conflict of interest.
References
- Eppel, E.A.; Rhodes, M.L. Complexity theory and public management: A ‘becoming’ field. Public Manag. Rev. 2018, 20, 949–959. [Google Scholar] [CrossRef]
- Telles, C.R.; Cunha, A.R.B.D.; Chueiri, A.M.S.; Kuromiya, K. Analysis of oscillations in continuous expenditures and their multiple causalities: A case study. J. Econ. Adm. Sci. 2018, 34. [Google Scholar] [CrossRef]
- Buchberger, S.G.; Wu, L. Model for instantaneous residential water demands. J. Hydraul. Eng. 1995, 121, 232–246. [Google Scholar] [CrossRef]
- Guercio, R.; Magini, R.; Pallavicini, I. Instantaneous residential water demand as stochastic point process. WIT Trans. Ecol. Environ. 2001, 48, 10. [Google Scholar] [CrossRef]
- Telles, C.R. Metodologia para Análise do Consumo de Água em Edificações Escolares. Parana J. Sci. Educ. 2017, 3, 1–10. (In Portuguese) [Google Scholar]
- Blokker, E.J.M.; Vreeburg, J.H.G.; Van Dijk, J.C. Simulating residential water demand with a stochastic end-use model. J. Water Resour. Plan. Manag. 2009, 136, 19–26. [Google Scholar] [CrossRef]
- Balacco, G.; Carbonara, A.; Gioia, A.; Iacobellis, V.; Piccinni, A.F. Investigation of peak water consumption variability at local scale in Puglia (Southern Italy). Proceedings 2018, 2, 674. [Google Scholar] [CrossRef]
- Yarnold, P.R. Minimize usage of binary measurement scales in rigorous classical research. Optim. Data Anal. 2018, 7, 3–9. [Google Scholar]
- Dahl, C. A survey of energy demand elasticities for the developing world. J. Energy Dev. 1994, 18, 1–47. [Google Scholar]
- Bertsimas, D.; Thiele, A. Robust and data-driven optimization: Modern decision-making under uncertainty. Model. Methods Appl. Innov. Decis. Mak. 2006, 3, 95–122. [Google Scholar]
- Bhattacharyya, S.C.; Timilsina, G.R. Energy Demand Models for Policy Formulation: A Comparative Study of Energy Demand Models; The World Bank: Washington, DC, USA, 2009. [Google Scholar]
- Secretaria de Estado da Educação do Paraná (PARANÁ). Excel, Work Sheet about Water Consumption at 149 Public Schools at Paraná State; Continuous Service Sector: Curitiba, Brazil, 2013. [Google Scholar] [CrossRef]
- Arditi, R.; Ginzburg, L.R. Coupling in predator-prey dynamics: Ratio-dependence. J. Theor. Biol. 1989, 139, 311–326. [Google Scholar] [CrossRef]
- Aven, T. Risk assessment and risk management: Review of recent advances on their foundation. Eur. J. Oper. Res. 2016, 253, 1–13. [Google Scholar] [CrossRef]
- Gibbins, P. Particles and Paradoxes: The Limits of Quantum Logic; Cambridge University Press: Cambridge, UK, 1987. [Google Scholar]
- Harush, U.; Barzel, B. Dynamic patterns of information flow in complex networks. Nat. Commun. 2017, 8, 2181. [Google Scholar] [CrossRef] [PubMed] [Green Version]
- Butucea, C.; Delmas, J.F.; Dutfoy, A.; Fischer, R. Maximum entropy distribution of order statistics with given marginals. Bernoulli 2018, 24, 115–155. [Google Scholar] [CrossRef] [Green Version]
- Fried, R.; Didelez, V.; Lanius, V. Partial correlation graphs and dynamic latent variables for physiological time series. In Innovations in Classification, Data Science, and Information Systems; Springer: Berlin/Heidelberg, Germany, 2004; pp. 259–266. [Google Scholar]
- Martin-Löf, P. Complexity oscillations in infinite binary sequences. Zeitschrift für Wahrscheinlichkeitstheorie und Verwandte Gebiete 1971, 19, 225–230. [Google Scholar] [CrossRef]
- Gencaga, D.; Knuth, K.H.; Rossow, W.B. A recipe for the estimation of information flow in a dynamical system. Entropy 2015, 17, 438–470. [Google Scholar] [CrossRef]
- Donner, R.V.; Small, M.; Donges, J.F.; Marwan, N.; Zou, Y.; Xiang, R.; Kurths, J. Recurrence-based time series analysis by means of complex network methods. Int. J. Bifurc. Chaos 2011, 21, 1019–1046. [Google Scholar] [CrossRef]
- Li, M.; Xie, K.; Kuang, H.; Liu, J.; Wang, D.H.; Fox, G.E.; Shi, Z.F.; Chen, L.; Zhao, F.; Mao, Y.; et al. Neural coding of cell assemblies via spike-timing self-information. Cereb. Cortex 2018, 28, 2563–2576. [Google Scholar] [CrossRef] [PubMed]
- Baran, T.; Harmancioglu, N.B.; Cetinkaya, C.P.; Barbaros, F. An extension to the revised approach in the assessment of informational entropy. Entropy 2017, 19, 634. [Google Scholar] [CrossRef]
- Mézard, M.; Montanari, A. Information, Physics and Computation; Oxford University Press: Corby, UK, 2009. [Google Scholar]
- Tsitsiklis, J. Bernoulli Process: Probabilistic Systems Analysis and Applied Probability, Lecture 13. MIT Opencourseware, 2011. Available online: https://ocw.mit.edu/courses/electrical-engineering-and-computer-science/6-041-probabilistic-systems-analysis-and-applied-probability-fall-2010/video-lectures/lecture-13-bernoulli-process/ (accessed on 25 September 2018).
- Cauchy, A.L.B. Cours d’Analyse de l’École Royale Polytechnique; Debure: De L’ Imprimerie Royale, France, 1821. [Google Scholar]
- Cover, T.M.; Thomas, J.A. Elements of Information Theory, 2nd ed.; Willey-Interscience: Hoboken, NJ, USA, 2006. [Google Scholar]
- Ha, J.; Tan, P.P.; Goh, K.L. Linear and nonlinear causal relationship between energy consumption and economic growth in China: New evidence based on wavelet analysis. PLoS ONE 2018, 13, e0197785. [Google Scholar] [CrossRef] [PubMed]
- Telles, C.R.; Chueiri, A.M.S.; Cunha, A.R.B. Pesquisa Operacional do Setor de Serviços Contínuos: Economia, Meio Ambiente e Educação, 2nd ed.; Secretaria de Estado da Educação do Paraná: Curitiba, Brazil, 2018; 146p. [Google Scholar] [CrossRef]
- Licata, I.; Chiatti, L. Timeless approach to quantum jumps. Quanta 2015, 4, 10–26. [Google Scholar] [CrossRef]
- Weijs, S. Information Theory for Risk-based Water System Operation. Ph.D Thesis, Water Resources Management, Faculty of Civil Engineering & Geosciences of Technische Universiteit, Delft, The Netherlands, 2011. [Google Scholar]
- Shannon, C.E. A mathematical theory of communication. ACM SIGMOBILE Mob. Comput. Commun. Rev. 2011, 5, 3–55. [Google Scholar] [CrossRef]
- Pekkonen, M.; Ketola, T.; Laakso, J.T. Resource availability and competition shape the evolution of survival and growth ability in a bacterial community. PLoS ONE 2013, 8, e76471. [Google Scholar] [CrossRef] [PubMed]
- Duncan, C.J.; Duncan, S.R.; Scott, S. The dynamics of scarlet fever epidemics in England and Wales in the 19th century. Epidemiol. Infect. 1996, 117, 493–499. [Google Scholar] [CrossRef] [PubMed] [Green Version]
- Giannoula, A.; Gutierrez-Sacristán, A.; Bravo, Á.; Sanz, F.; Furlong, L.I. Identifying temporal patterns in patient disease trajectories using dynamic time warping: A population-based study. Sci. Rep. 2018, 8, 4216. [Google Scholar] [CrossRef] [PubMed]
- Afy-Shararah, M.; Rich, N. Operations flow effectiveness: A systems approach to measuring flow performance. Int. J. Oper. Prod. Manag. 2018. [Google Scholar] [CrossRef]
- Klug, M.J.; Scheurer, M.S.; Schmalian, J. Hierarchy of information scrambling, thermalization, and hydrodynamic flow in graphene. Phys. Rev. B 2018, 98, 045102. [Google Scholar] [CrossRef]
- Tao, Y.; Yu, S.; Zhou, J. Information Flow Queue Optimization in EC Cloud. In Proceedings of the International Conference on Computing, Networking and Communications (ICNC), Maui, HI, USA, 5–8 March 2018; pp. 888–892. [Google Scholar]
Figure 1.
Variables affecting water consumption at the public schools of Secretary of State for Education of Paraná, Brazil [2].
Figure 1.
Variables affecting water consumption at the public schools of Secretary of State for Education of Paraná, Brazil [2].

Figure 2.
Water usage at public schools. The data consist of 149 schools at different regions of the Paraná State with a population of individuals. Using R2 (determination coefficient) for both data, the linear function presented for the chosen population data can’t be equally found in the water usage behavior.

Figure 3.
Flowchart of Section 2. Methodology, showing theoretical experiment of information regulated by time length’s effects on water consumption and school’s population.
Figure 3.
Flowchart of Section 2. Methodology, showing theoretical experiment of information regulated by time length’s effects on water consumption and school’s population.

Figure 4.
Schematic of bit evolution over time.

Figure 5.
Deterministic evolution of water consumption by population over time.

Figure 6.
Nonlinearity effects caused by time according to Figure 7.
Figure 6.
Nonlinearity effects caused by time according to Figure 7.

Figure 7.
Information flow at geometric variables (I) and not geometric variables (II). A: Resources and B: Population.
Figure 7.
Information flow at geometric variables (I) and not geometric variables (II). A: Resources and B: Population.

Figure 8.
Oscillation’s quantitative aspects due to information distribution regulated by time lengths. (a) Equal amount of variables A and B , where for optimal resources distribution. (b) Time length for event where amount of variable A is not used fully by B caused by finite time , where in this case, AND , being A not consumed in time given. Resources wrongly distributed. (c) Time length for event where amount of variable A is limited for use caused by B variable presence where . Resources containment and population-resource chaotic regulation.

Figure 9.
Water consumption and individual repetition. Observation: the lines are colored for the benefit of graph visualization.
Figure 9.
Water consumption and individual repetition. Observation: the lines are colored for the benefit of graph visualization.

Figure 10.
Representation of population-resource ratio analyzed by continuous time length. Iterations order can’t affect the system if time is continuous. Another effect would be expected if a time interval interrupts the flow of variables, leading the system to an insufficient distribution of resources as described in item (b) and (c). Observation: the lines are colored for the benefit of graph visualization.

Figure 11.
Flow of water consumption and population size regulated by finite time interval. Consider in the graph a maximum time of permanence in the place (lower resource trajectories) in which the population size demands more time to obtain full correspondence between population and resource ratio. The flow of resources is not reached to full system size due to the time given. Observation: the lines are colored for the benefit of graph visualization.

Figure 12.
Deterministic to chaotic behavior of variables regulated by time lengths. Observation: the lines are colored for the benefit of graph visualization.
Figure 12.
Deterministic to chaotic behavior of variables regulated by time lengths. Observation: the lines are colored for the benefit of graph visualization.

Figure 13.
Scheme for resources and population dynamics regulated by time lengths. Possible results obtained through iteration, frequency and time over variables and . It is theoretically postulated that time lengths have specific effects over the event, causing specific phase space’s trajectories.
Figure 13.
Scheme for resources and population dynamics regulated by time lengths. Possible results obtained through iteration, frequency and time over variables and . It is theoretically postulated that time lengths have specific effects over the event, causing specific phase space’s trajectories.

Figure 14.
Constant binary distribution of population-resource ratios. Imagine a restaurant where the brown line represents the queue of individuals. Blue line, the variable and orange line, resources. As time passes, individuals at queue start getting access to resources, as waiting time stay relatively constant and resources are consumed in the same proportion of individuals in the queue.

Figure 15.
Time regulated dynamics of population-resource ratio. It is possible to observe the oscillations of variables in the system as time passes. Blue line, the variable , orange line, resources and light brown line, population.
Figure 15.
Time regulated dynamics of population-resource ratio. It is possible to observe the oscillations of variables in the system as time passes. Blue line, the variable , orange line, resources and light brown line, population.

Figure 16.
Time series of population variables and expressing proportionality for population-resource ratio.
Figure 16.
Time series of population variables and expressing proportionality for population-resource ratio.

Figure 17.
Time series of population variables and expressing disproportionality for population-resource ratio. The asymmetrical pattern shows recurrence at original state (indicated arrows) and time regulation equilibrium.
Figure 17.
Time series of population variables and expressing disproportionality for population-resource ratio. The asymmetrical pattern shows recurrence at original state (indicated arrows) and time regulation equilibrium.

Figure 18.
To the left, the representation of Figure 16 and to the right, Figure 17. In this view, it is possible to see specific phases of event of Figure 17 that are marked with color circles. Red circle, event start. Light green, time regulation. Blue circle, saturation. Yellow, chaotic phase. Purple, population growth and variable variable reduction. Dark green, recurrence of variable .

Figure 19.
Evolution of system dynamics. Population and resource ratio are represented in two possible pathways. (1) Variables and resources recurrence to the original state. The amount of resource available at pathway 1 is proportional to the population previous aspects. In this case, resource amount is higher than the original state amount. (2) Pathway 2 leads to the end of the event. It is expected for the resource time series at bottom of Figure 19, a constant reduction of information flow until it reaches 0 (zero for both variables interaction).


Table 1.
Bits distribution over time.
| Time. | T1 | T2 | T3 | T4 | T5 | T6 | T7 | T8 | |
|---|---|---|---|---|---|---|---|---|---|
| Variables | X1 | X2 | X1 | X2 | X1 | X2 | X1 | X2 | |
| Bits | 1 | 0 | 1 | 0 | 1 | 0 | 1 | 0 | |
| 0 | 1 | 0 | 1 | 0 | 1 | 0 | 1 |
© 2018 by the author. Licensee MDPI, Basel, Switzerland. This article is an open access article distributed under the terms and conditions of the Creative Commons Attribution (CC BY) license (http://creativecommons.org/licenses/by/4.0/).
Share and Cite
MDPI and ACS Style
Roberto Telles, C. Geometrical Information Flow Regulated by Time Lengths: An Initial Approach. Symmetry 2018, 10, 645. https://0-doi-org.brum.beds.ac.uk/10.3390/sym10110645
AMA Style
Roberto Telles C. Geometrical Information Flow Regulated by Time Lengths: An Initial Approach. Symmetry. 2018; 10(11):645. https://0-doi-org.brum.beds.ac.uk/10.3390/sym10110645
Chicago/Turabian StyleRoberto Telles, Charles. 2018. "Geometrical Information Flow Regulated by Time Lengths: An Initial Approach" Symmetry 10, no. 11: 645. https://0-doi-org.brum.beds.ac.uk/10.3390/sym10110645
Note that from the first issue of 2016, this journal uses article numbers instead of page numbers. See further details here.