Mathematical Modeling of Tissue Folding and Asymmetric Tissue Flow during Epithelial Morphogenesis


1
Department of Physics, Graduate School of Science, University of Tokyo, Tokyo 113-0033, Japan
2
Laboratory for Physical Biology, RIKEN Center for Biosystems Dynamics Research, Kobe 650-0047, Japan
3
Laboratory of Histogenetic Dynamics, Graduate School of Life Sciences, Tohoku University, Sendai 980-8578, Japan
*
Authors to whom correspondence should be addressed.
Symmetry 2019, 11(1), 113; https://0-doi-org.brum.beds.ac.uk/10.3390/sym11010113
Submission received: 13 December 2018
/
Revised: 7 January 2019
/
Accepted: 14 January 2019
/
Published: 19 January 2019
(This article belongs to the Special Issue Chiral Asymmetry in Cells)
Abstract
:Recent studies have revealed that intrinsic, individual cell behavior can provide the driving force for deforming a two-dimensional cell sheet to a three-dimensional tissue without the need for external regulatory elements. However, whether intrinsic, individual cell behavior could actually generate the force to induce tissue deformation was unclear, because there was no experimental method with which to verify it in vivo. In such cases, mathematical modeling can be effective for verifying whether a locally generated force can propagate through an entire tissue and induce deformation. Moreover, the mathematical model sometimes provides potential mechanistic insight beyond the information obtained from biological experimental results. Here, we present two examples of modeling tissue morphogenesis driven by cell deformation or cell interaction. In the first example, a mathematical study on tissue-autonomous folding based on a two-dimensional vertex model revealed that active modulations of cell mechanics along the basal–lateral surface, in addition to the apical side, can induce tissue-fold formation. In the second example, by applying a two-dimensional vertex model in an apical plane, a novel mechanism of tissue flow caused by asymmetric cell interactions was discovered, which explained the mechanics behind the collective cellular movement observed during epithelial morphogenesis.
1. Introduction
During embryogenesis, morphogenetic epithelial movement drives the formation of complex tissues. To deform an epithelial cell sheet, the cells must relocate themselves collectively or synchronously. One major mechanism in development is the determination of cell fates through molecular patterning mechanisms, which involve axis formation and long-distance cellular communication mediated by various biochemical signaling molecules. Force generation is another key factor involved in tissue morphogenesis and organogenesis [1]; however, few studies have evaluated the regulation of force by cells during development due to a lack of appropriate methodologies. Recent advances in technologies such as live imaging [2,3], laser manipulation [4,5] image processing [3,6], and mathematical modeling [7] have opened the door to investigating in depth the physical mechanisms involved in animal development. In general, by generating local forces, intrinsic cell deformations can drive the morphogenesis of various tissues, including tissue elongation [8], folding [9], closing [5], rotation [10], and torsion [11]. The combination of these intrinsic cellular behaviors, occurring at the right time and place, leads to the construction of complex animal body structures.
One of the intrinsic cellular behaviors is “apical constriction,” which is involved in tissue folding during gastrulation [12] and tissue closing during vertebrate neural tube closure [13]. The epithelial cells that make up a cell sheet are connected to each other by adherence junctions (AJs) located at the apical sides of the cells. The AJ is involved not only in the basic recognition and binding between cells but also in the generation and sensing of local mechanical forces during morphogenesis [14,15]. In the AJ, the extracellular region of cadherin, which is an adhesion molecule located on the cell membrane, binds with the cadherin of a neighboring cell, and actomyosin, which is linked to the cytoplasmic domain of cadherin, generates mechanical force [16,17]. In the cell junction, activated actomyosin connects to the AJ, and pulls the adjacent cell, causing the junction to contract. As a result, the junctions contract in the manner of a drawstring purse, resulting in a “wedge-shaped” cell morphology with a smaller apical surface and larger basal surface [18,19]. Although this wedge-shaped deformation was proposed to be the driving force of tissue bending by causing the cell sheet to fold [20], it was difficult to prove in vivo whether an entire epithelial tissue could be folded just by deforming the cells located along a line.
Another intrinsic cellular behavior is “cell intercalation.” An example of this process occurs in the germ band elongation in Drosophila, in which epithelial cells undergo spontaneous cell intercalation along the dorso–ventral (DV) axis, resulting in tissue shortening along the DV axis and lengthening along the anterior–posterior (AP) axis [8]. Tissue elongation induced by cell intercalation is also observed in frog notochord formation [21,22], neural tube closure in the chick [9], and other developmental processes.
The directed cell intercalation that drives tissue morphogenesis can result from cell polarity. For example, our groups recently found that the simple directed cell intercalation is capable of inducing the collective epithelial cell movement observed in Drosophila genitalia rotation, a developmental event in which epithelial tissue rotates clockwise around the genitalia [10,23]. We found that individual epithelial cells surrounding the genitalia adopt a left–right (LR) asymmetric polarity within their apical plane [10], termed planar cell-shape chirality (PCC), which was found to be an intrinsic cellular process [11,24,25]. The MyosinID (MyoID) mutant shows counterclockwise genitalia rotation [26] and exhibits reversed PCC in the surrounding epithelial cells, indicating that the PCC is responsible for the clockwise genitalia rotation [10]. In addition, using live imaging, we found that the epithelial cells move collectively to elicit the epithelial tissue rotation [10]. These moving cells exhibit cell intercalation while remaining attached to their neighbors through AJs [10]. During this rotation process, most of the remodeled cell boundaries form a right oblique angle with the anterior-posterior axis, and are associated with Myosin-II accumulation at the right oblique cell boundaries [10]. Furthermore, the LR asymmetric distribution of Myosin-II is reversed in flies expressing MyoID dsRNA [10]. Despite these detailed observations, it was still unclear whether the diagonal cell intercalation of these individual cells could actually generate the force to induce the collective cellular movement, because there is no experimental method with which to verify this point in vivo. In such cases, mathematical modeling can be useful for verifying whether a locally generated force can propagate through an entire tissue and induce deformation [10,27,28,29]. Moreover, the mathematical modeling sometimes provides potential mechanistic insight beyond the information obtained from biological experimental results.
In this review, we introduce two mathematical models that not only explain how the intrinsic cellular behaviors of apical constriction and cell intercalation play roles in complex morphogenetic cellular processes, but also provide an additional potential mechanism. In the first half of this review, we consider cases of tissue folding in which apical constriction is thought to be the major driving force, and we present a mathematical model showing that not only apical constriction but also basal–lateral modulation can induce tissue folding. In the second half, we present a mathematical model showing that the direction of the collective movement of epithelial cells is regulated by PCC, further demonstrating that PCC-associated LR asymmetric cell intercalation is sufficient to drive unidirectional tissue flow.
2. Cell-Autonomous Mechanisms that Induce Tissue Folding: Apical Constriction and Basal–Lateral Modulation
During embryonic development and organ formation, simple epithelial sheets fold into complex structures. These folding events require coordination of the mechanical processes that induce cell-shape changes in a tissue. Two types of mechanical processes promote epithelial-fold formation: active deformation and passive buckling. Active deformation is caused by intrinsic forces within a tissue, whereas passive buckling is due to stresses exerted from the surrounding cellular and acellular environments. The mechanism presented here is a tissue-autonomous mechanism for epithelial folding that is not caused by buckling instability [30,31,32].
Thus, in this case, the cell-shape changes necessary for fold formation are primarily driven by intrinsic forces within the tissue. The resulting cell deformation propagates via interconnected cell–cell adhesions to generate tissue-scale deformation. A mathematical modeling approach can be useful to examine what mechanical properties of individual cells can be modulated to induce the folding of an epithelial sheet, and to comprehensively explore other possible tissue-autonomous mechanisms for epithelial folding. Here, we consider the two-dimensional cross section of an epithelial cell-sheet monolayer along the apical–basal axis. The individual cells can be viewed as polygons with four edges and vertices that correspond to the apical, basal, and two lateral sides, as shown in Figure 1. Using the framework of a vertex model, we build a theoretical model of the two-dimensional cross section of the cell sheet that recapitulates tissue-autonomous epithelial folding [7,29,33,34,35,36]. The forces exerted on the vertices are determined from the derivatives of a potential function, which describes the mechanical properties of the entire sheet. Reflecting the general features of epithelial cells, including the apical–basal polarity and the elasticity of the cytoskeleton, the potential function may include the area elasticity, the elasticity of the apical surface, and the tension at the basal and lateral surfaces, as given by [29]:
Here, the first term is the area elasticity with the cross-sectional cell area , the elastic modulus of cell i and preferred area . The second term is the apical elasticity with the apical length , the elastic modulus and the preferred length . The third and fourth terms are the basal and lateral line tensions, respectively, with the basal length of cell i, the lateral length shared by two cells , the basal line tension , and the lateral line tension . We note that the elasticity is considered at the apical surface in the second term, whereas the lowest order contribution from the tension at the basal side is included in the third term. This qualitative difference between apical and basal surfaces breaks the symmetry between the two sides, reflecting the contribution from the actin cytoskeleton that is enriched in the apical area. The potential function can be written in terms of the positions of vertices. Then, the force balance state or mechanically stable state can be obtained by minimizing the potential function with respect to the vertex positions. During the fold formation starting from a flat sheet, the epithelial tissue is considered to be in a mechanically stable state. Thus, the change in epithelial morphology over time can be described by a series of changes in the mechanical parameters.
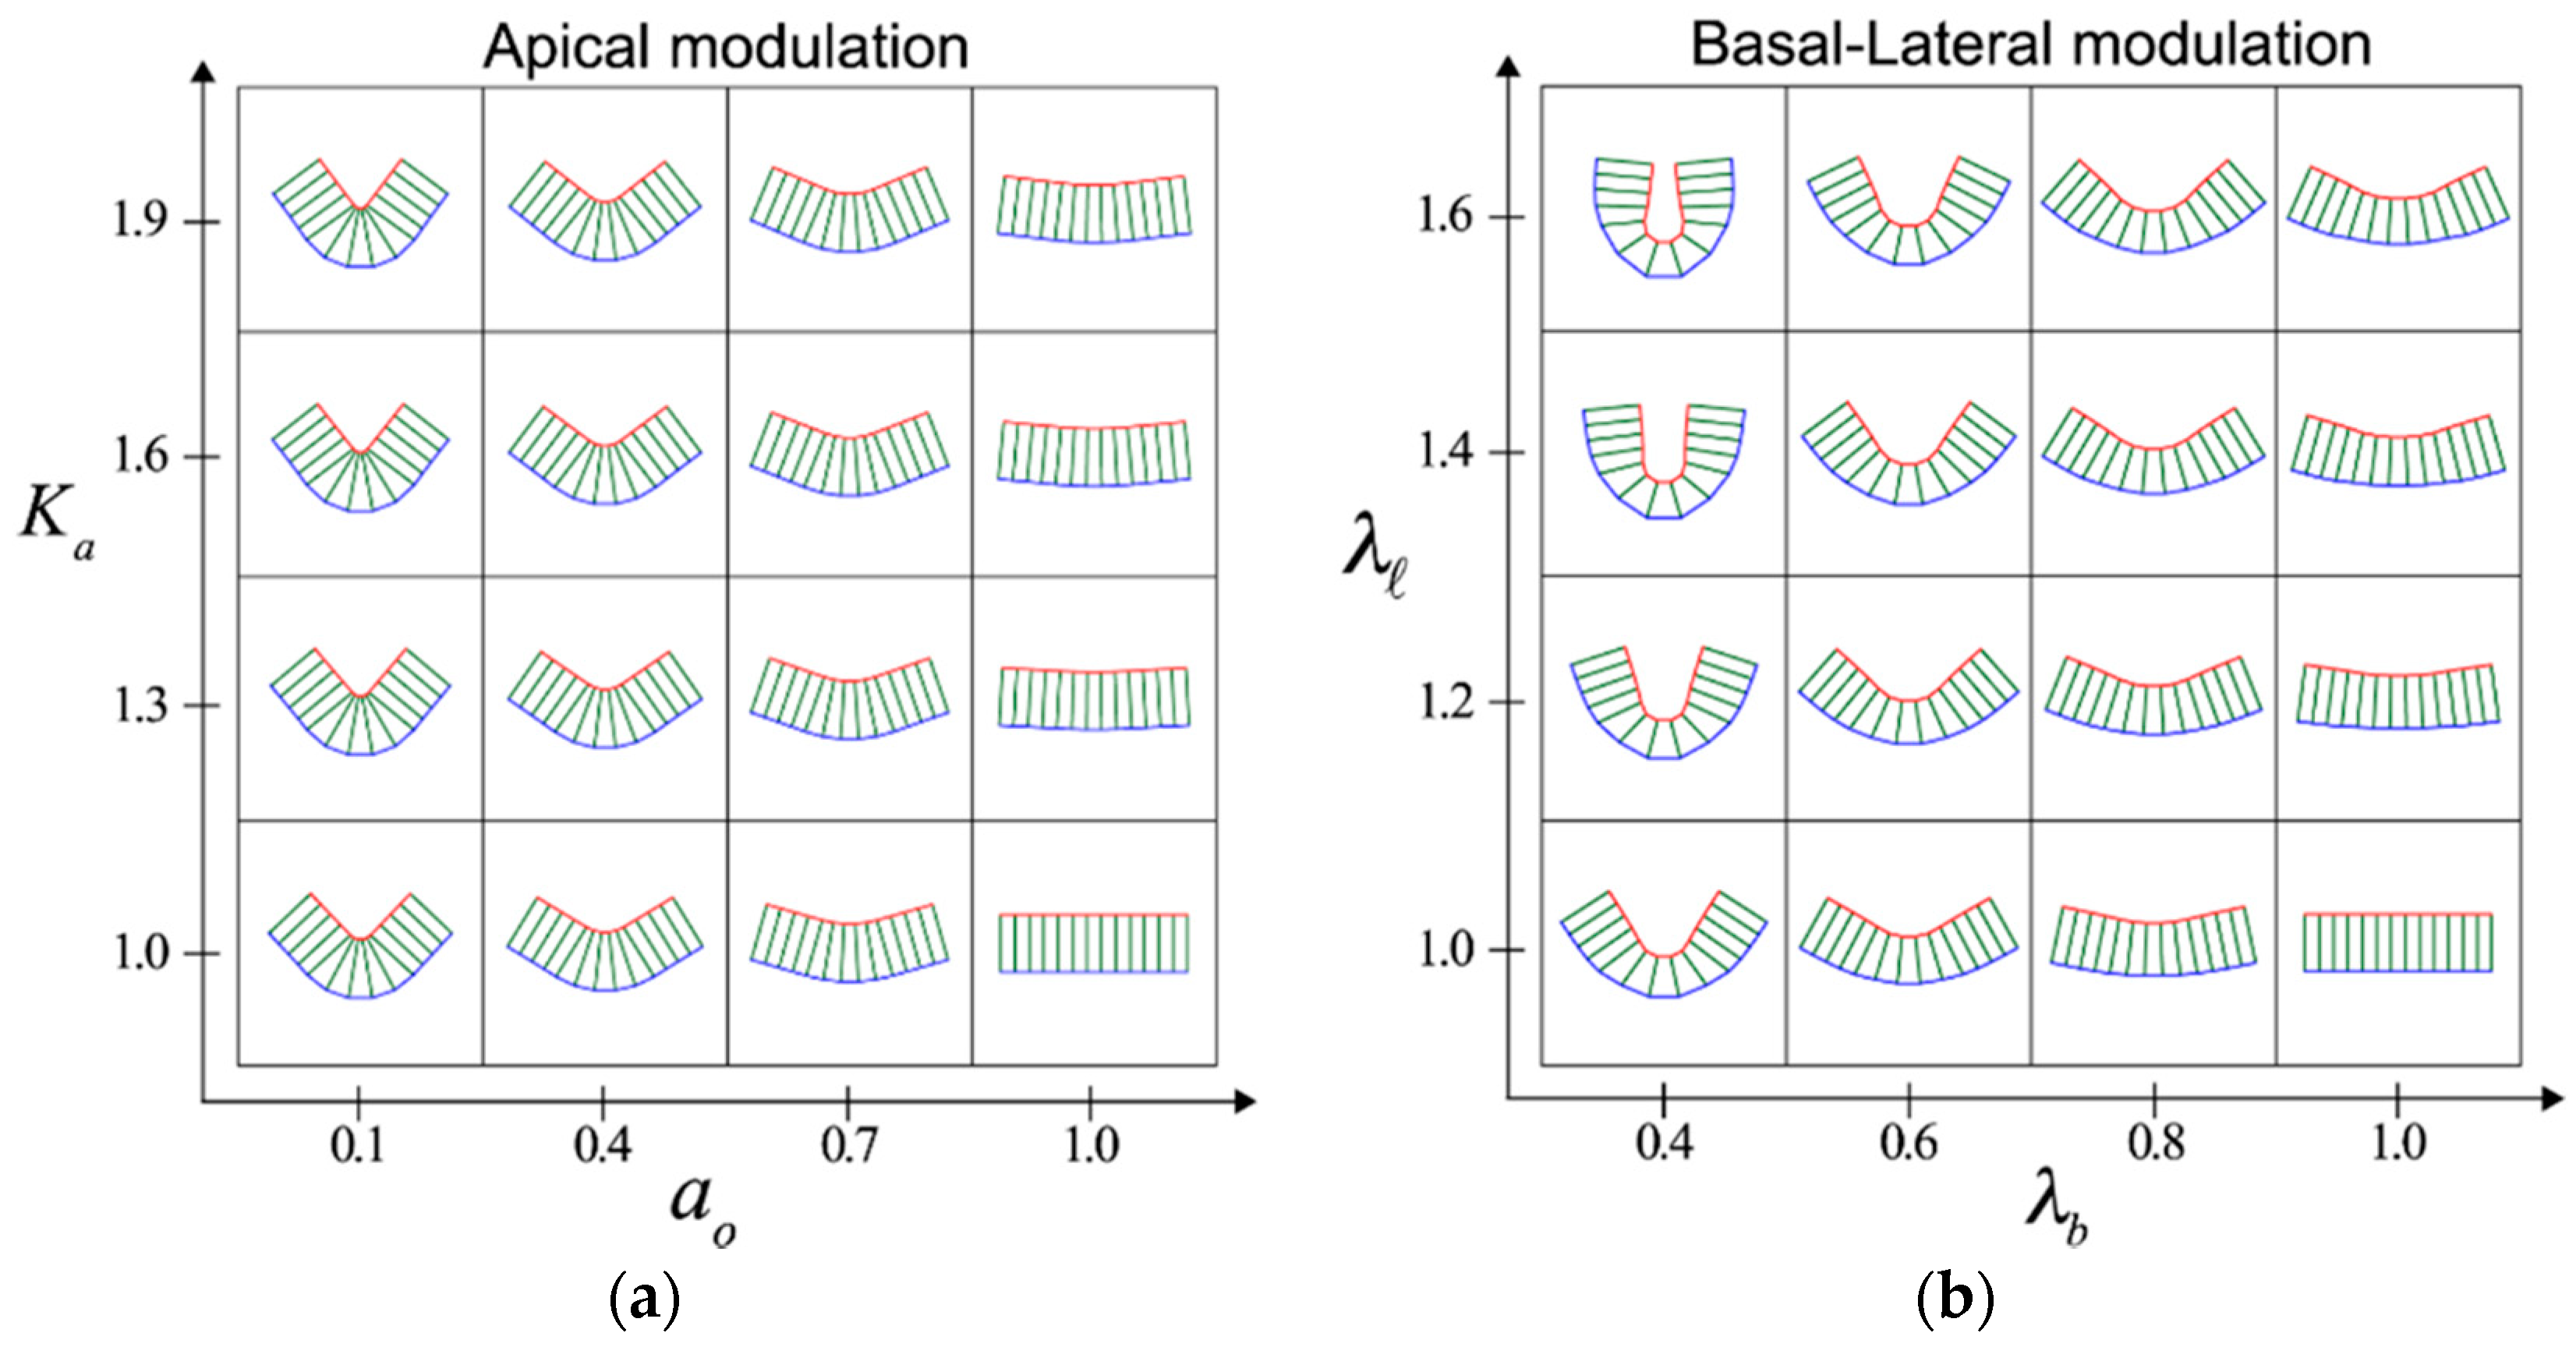
A canonical process that promotes epithelial folding is apical constriction [13], which requires actomyosin contraction at the apical side of cells and cell–cell adhesions. In the vertex model, apical constriction can be achieved by increasing the apical elasticity () or decreasing the preferred area () of cells within a restricted area of tissue. Consequently, shrinkage of the apical surface of cells can be induced, which causes each cell to adopt a wedge-like or bottle-like shape. As a result, an epithelial fold is formed with a concave shape (Figure 1a). Notably, the model reveals that apical constriction is not the only way to induce a cell-shape change for tissue-fold formations. Further analysis of the theoretical model reveals that epithelial folding can also be induced by increasing the lateral tension () or by decreasing the basal tension () (Figure 1b). These changes in the mechanical parameters induce shrinkage of the lateral surface and expansion of the basal surface, giving rise to cells with a trapezoidal shape. Thus, lateral shrinkage and basal expansion are additional cell-shape changes that can promote epithelial fold formation.
Interestingly, modulation of the apical and basal–lateral surfaces appears to produce distinct fold morphologies (Figure 1). Apical modulation sculpts the epithelia into shallow and V-shaped folds, whereas basal–lateral modulation generates deep and U-shaped folds [29]. This difference in the shape of the folded tissue can be used to infer the mechanical mechanism of a fold formation observed in biology. For example, in the case of ventral furrow formation in Drosophila, apical constriction promotes epithelial bending with a shallow-shaped fold [7]. Subsequently, the basal surface expands, which causes the furrow to form a deep U-shaped fold. These observations support the idea that the above theoretical analysis can describe the relationship between the process of cell-shape changes and the overall tissue morphology.
While the molecular mechanisms of apical constriction are relatively well established [8], biochemical and signaling processes of basal expansion and lateral shrinkage are not well understood. A recent study indicates that downregulation of myosin-II at the basal side induces the basal expansion as well as cell shortening, which are required for the completion of the tissue invagination during the ventral furrow formation [37]. Another recent study indicates that an epithelial bending occurs during the optic-cup morphogenesis, in which lateral shrinkage is involved [38]. This lateral shrinkage is driven by actomyosin contraction, which is triggered by a transient increase in calcium activity on the basal surface [38]. We speculate that modulations in interactions between cell and extracellular matrix (ECM) may also induce an expansion of the basal surface. The present mechanical model in Equation (1) does not include these biochemical and signaling processes that determine the mechanical parameter values. How coupling between the biochemical processes and the mechanical process leads to self-organization of the morphogenesis process is an intriguing future topic.
3. Unidirectional Tissue Flow Induced by a Combination of Chirality and Junctional Remodeling
In the Drosophila embryonic hindgut twist, the left–right asymmetric tissue deformation does not require cell rearrangements [25]. However, combining a chirality-originated tissue morphogenetic mechanism with cell rearrangements can lead to dramatic tissue dynamics, namely, unidirectional tissue flow. In this case, the cell chirality does not disappear but can be perpetually maintained. In this section, we describe such a mechanism of tissue flow, which we discovered through our investigation of the Drosophila genitalia rotation mechanism using mathematical modeling and computer simulation [10,27].
3.1. Vertex Model in an Apical Plane
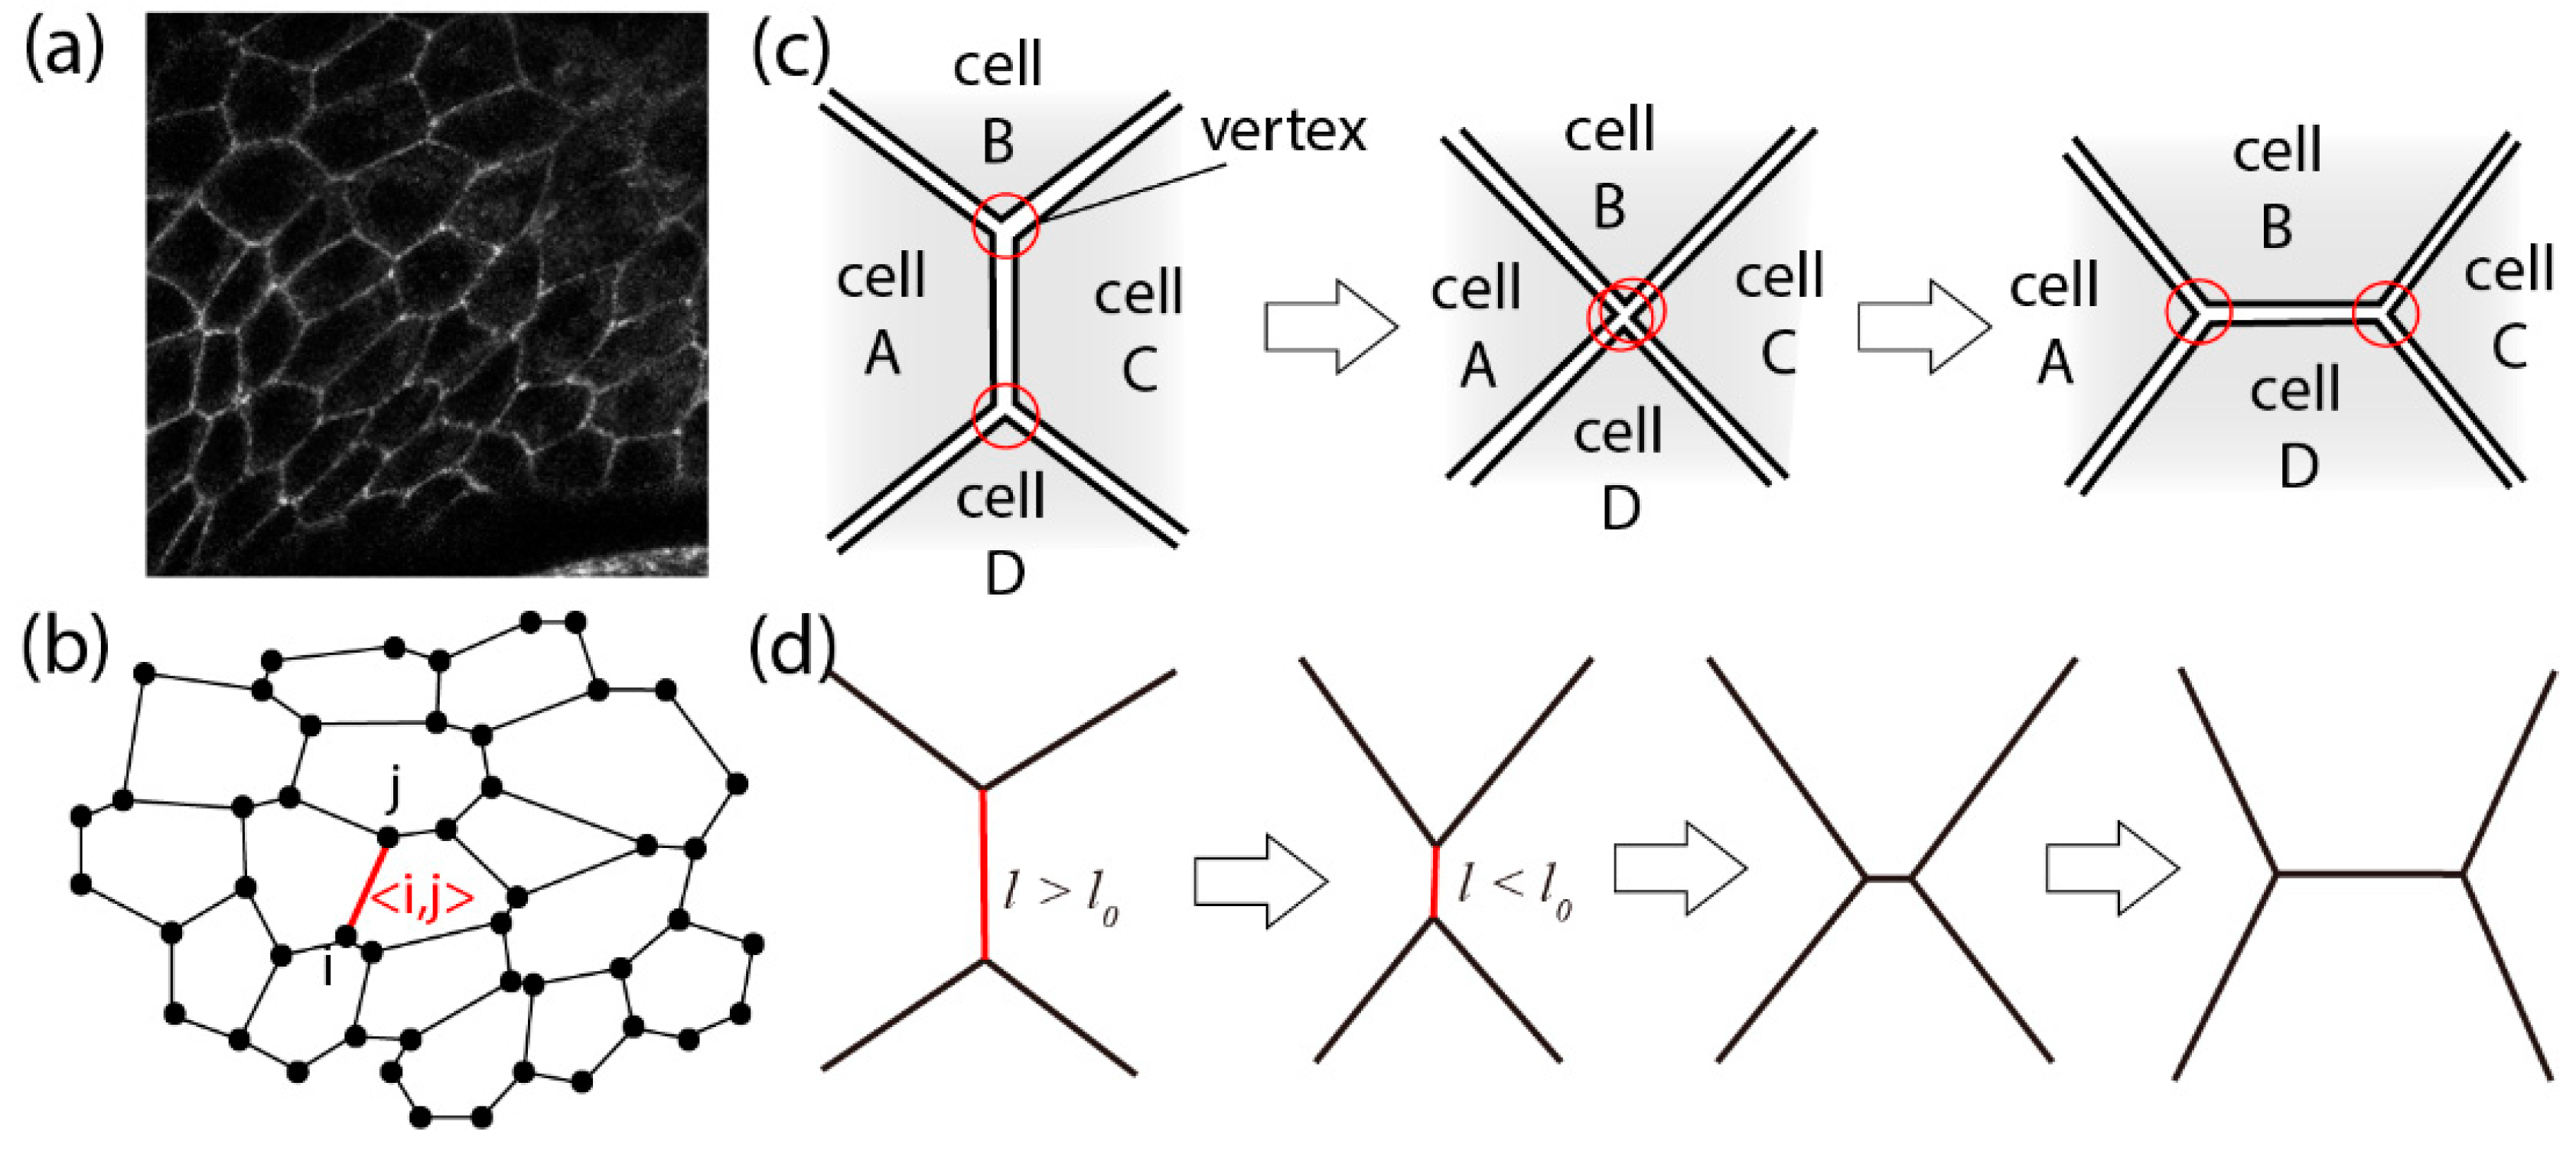
We begin this section by explaining the vertex model in an apical plane [39]. Whereas a two-dimensional vertex model for a cross-sectional tissue plane along the apical–basal axis was introduced in Section 2, we here focus on a different view—the apical plane. Each epithelial cell in a sheet is surrounded by AJs at its apical plane. Therefore, the cell boundaries become linear due to the contractile tension of actomyosin bundles. Due to this effect, in many epithelial tissues, including male Drosophila genitalia, viewed from the top at the apical plane, the cells look like polygons in two dimensions (Figure 2a). Thus, the vertex model used here regards epithelial tissue as having a polygon structure (Figure 2b).
The location of the i-th vertex at the time is indicated by ri (t), and the segment labeled by <ij> indicates the bond connecting the i-th and j-th vertices. The dynamics of the vertices is given by
with the potential function . Here, ηi is the coefficient of linear frictional resistance on the vertex i. In this Section, instead of Equation (1), we apply
In the right side of Equation (3), the first term is the contribution from the hydrostatic pressure within single cells with bulk modulus , the actual planer area of cell α, and the preferred area . The second term controls the perimeter, with the modulus , the actual perimeter length of cell α, and the optimum perimeter length . The third term of Equation (3) enables the case where the junctional tension and cell–cell adhesion can be varied over the bonds. is the length of the junction , and is the junctional tension or negative adhesion force specifically applied on the junction . The last term is the elastic spring forces needed to fix the vertices at the tissue boundary on the boundary edges. In the simulation described below, we assume that the tissue is sandwiched between a circle with a smaller radius (inner boundary) and a circle with a larger radius (outer boundary). See the reference for details [27].
Note that Equation (2) implicitly assumes that cellular motion is driven by the mechanical interactions of cells at only the apical plane, and their basal sides contribute to only the frictional resistance. When one wants to incorporate motile activities at the cellular basal side such as lamellipodium-driven migration in the model, Equation (2) itself should be modified, e.g., like those previously attempted [40,41,42].
3.2. Junctional Remodeling and Tissue Morphogenesis
Another essential factor that enables large-scale tissue morphogenesis is the rule that gives rise to junctional remodeling [43]: when two cells come close to each other and collide, the junction between them reconnects in a manner called the “T1 transition,” as shown in Figure 2c. The dynamics of F-actin, myosin II, E-cadherin and other molecules such as Rho1 associated with such junctional remodeling has been extensively investigated [34,44]. A well-investigated example of tissue morphogenesis involving junctional remodeling is convergent extension. One of the driving factors of convergent extension is the polarized manner of cell intercalation accompanied by junctional remodelings [8]. Convergent extension plays a key role in, for example, the germ-band extension in Drosophila mentioned in Section 1 [8].
To implement junctional remodeling in the vertex model in two dimensions, we assume that when the length of a junction becomes shorter than a certain threshold length l0, the bond is rotated by 90 degrees, and at the same time, the bonds are rearranged as shown in Figure 2d. Various morphogenetic processes have been reproduced using a cell vertex model with junctional remodeling [45]. For example, combining anisotropy of line tension strength with junctional remodeling, the vertex model in two dimensions can recapitulate the convergent-extension process [46].
3.3. Theory and Numerical Simulation of Genitalia Rotation
We finally address how unidirectional tissue flow can be realized by the pulling force in cell–cell junctions [10,27,47]. To create this model, the first important assumption is that a particularly strong line tension is applied to the side tilted clockwise around the anterior–posterior axis of the pupa (AP in Figure 3b) as
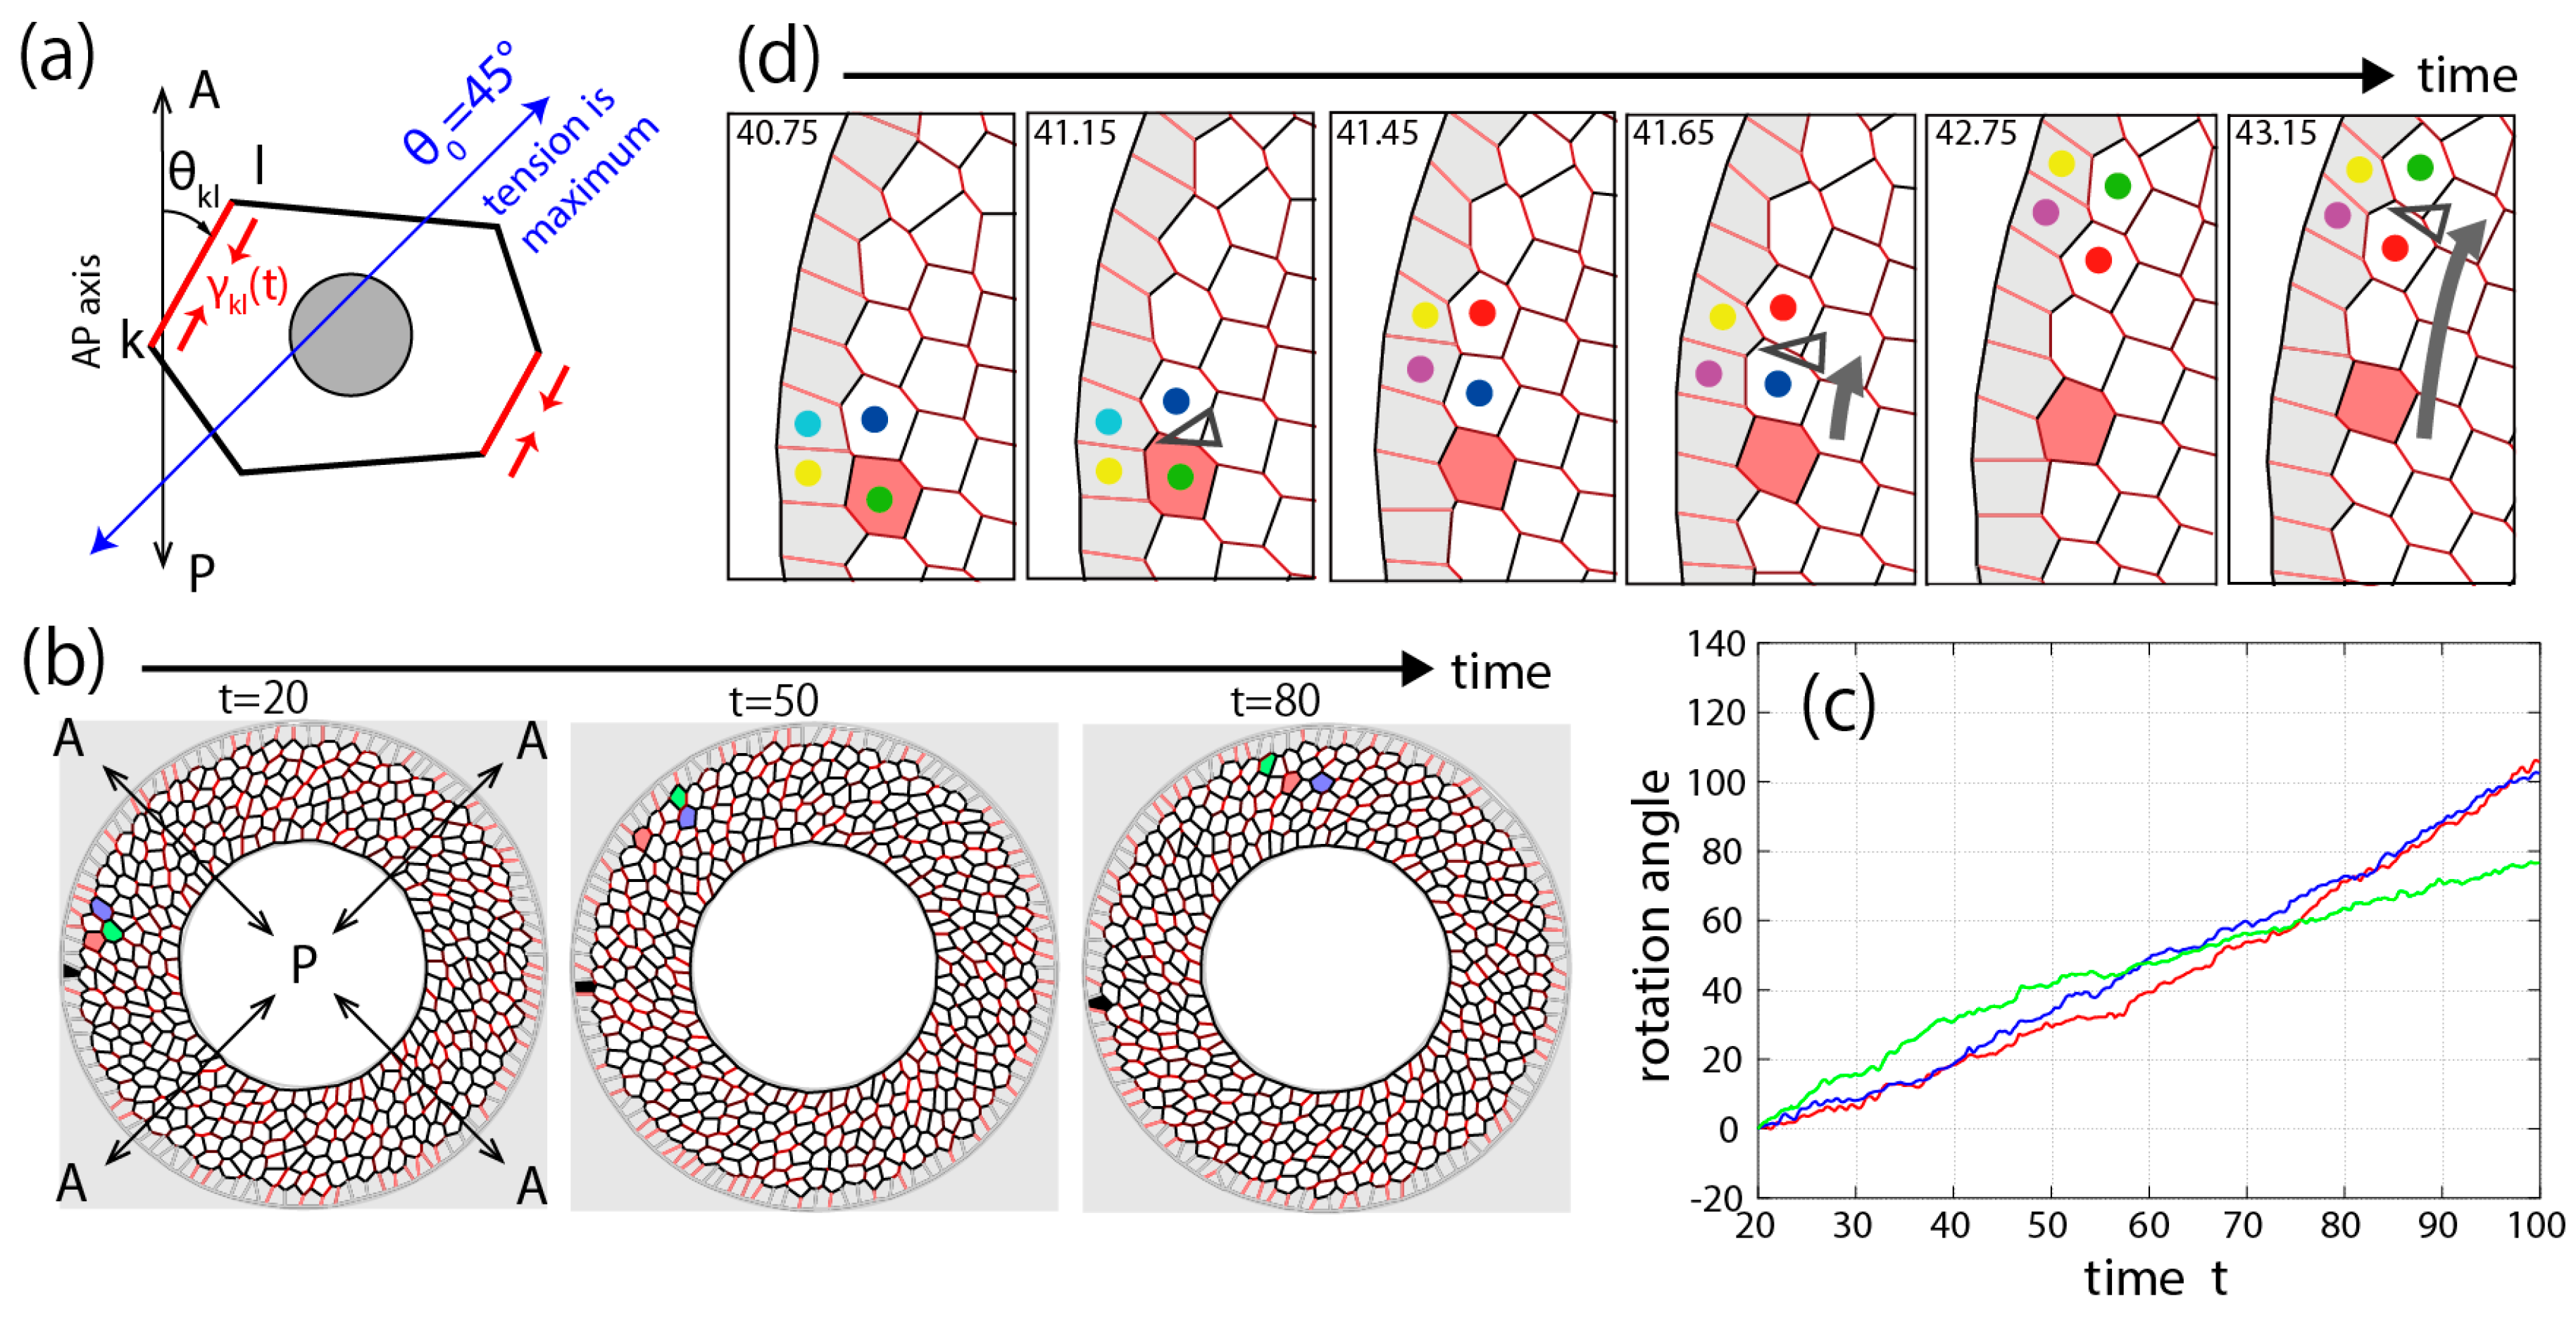
where the direction along which the tension is maximum is set e.g., degrees clockwise (see Figure 3a for the schematic of this). Note that while we also incorporate the oscillation of line tension to mimic the in vivo situation, this temporal oscillation is not essential for a unidirectional movement. The constants fkl and δkl are the frequency given by random variables and the initial phase, respectively, and is a positive constant. Here, there is a second important assumption that this strengthening of line tension in the tilted junctions is a cell-autonomous activity. Mathematically, this assumption can be realized by the following manipulation on the junctional tension: we first take the derivative of the potential function with respect to for a given , and then incorporate the direction dependence of tension given by Equation (4). While such chiral line tension is still speculative, recently increasing evidence has been found for possible chirality in force generation of the actin cytoskeleton, e.g., based on actin’s chirality combined with formin [48] and myosin 1D [49].
We then perform a numerical simulation based on this mathematical model. In the simulation, to fix the outside tissue, the frictional resistance coefficient of the vertices on the outer boundary is made to be much stronger ) than the resistance coefficient = 1 of the other vertices. Furthermore, although it is not essential for unidirectional motion, we assume that the resistance coefficient of the vertices on the inner boundary is also strengthened to , reflecting the in vivo situation that the inner vertices are accompanied by a large inner organ. An example result of this numerical simulation with N = 450 cells is shown in Figure 3b,c. The polygons colored red, blue and green in Figure 3b represent the same cells over time. The cells move in a clockwise direction while changing their relative locations little by little. The cell migration distance from the initial time point is represented by the angle around the disk center in Figure 3c. Thus, the vertex model simulation confirmed that a unidirectional tissue flow such as that observed in Drosophila genitalia rotation can be achieved by combining chirality with junctional remodeling [10,27].
As a result of the numerical simulation, we also discovered a new phenomenon associated with this mechanism of tissue flow [27]. Our simulation predicted a mechanical wave propagation, that is, a wave of junctional remodeling as shown in Figure 3d. Since each cell can be regarded as an elastic body, when junctional remodeling occurs at a certain edge of a cell, its mechanical influence can be transmitted through the cell body to affect the other edges of the cell. It was also found that this mechanical propagation was faster than the movement of the cells themselves.
4. Conclusions
Mathematical modeling is now an essential tool in biology to explore ideas and to develop hypotheses in an objective way. Mathematical modeling often shows its potential when it integrates properties of different scales such as cellular activities and tissue behaviors. In this review, we showed mathematical models of tissue folding and tissue flow, which are driven by cell-autonomous mechanisms, such as cell deformation and cell intercalation. Both models are based on the two-dimensional vertex model with different potential functions. By the vertex model, we can implement cellular-scale properties to see the behavior at tissue scale. We showed that tissue folding is simply driven by cell shape changes along the apical–basal axis. In addition to the cell deformation, cell intercalation within the apical plane, which involves neighbor exchanges, induces tissue flow. The unidirectionality of tissue flow depends on the cell chiral property.
Author Contributions
Conceptualization, T.H.; T.S. and E.K.; investigation, T.H. and F.-L.W.; data curation, T.H. and T.S.; writing—original draft preparation, T.H.; T.S. and E.K.; writing—review and editing, T.H.; F.-L.W.; T.S. and E.K.; supervision, T.H.; T.S. and E.K.; project administration, E.K.
Funding
This research was supported by JST CREST Japan (E.K. and T.S.), the research grant for Astellas Foundation for Research on Metabolic Disorders (E.K.), the Inamori Foundation (T.H.), MEXT KAKENHI grant number JP26114003 (E.K.) and JSPS KAKENHI grant numbers JP24687027 (E.K.), and JP16H04800 (E.K.).
Acknowledgments
We apologize to colleagues whose work could not be cited because of space limitations.
Conflicts of Interest
The authors declare no conflict of interest.
References
- Umetsu, D.; Kuranaga, E. Planar polarized contractile actomyosin networks in dynamic tissue morphogenesis. Curr. Opin. Genet. Dev. 2017, 45, 90–96. [Google Scholar] [CrossRef] [PubMed]
- Khan, Z.; Wang, Y.-C.; Wieschaus, E.F.; Kaschube, M. Quantitative 4D analyses of epithelial folding during Drosophila gastrulation. Development 2014, 141, 2895–2900. [Google Scholar] [CrossRef] [PubMed] [Green Version]
- Sun, Z.; Amourda, C.; Shagirov, M.; Hara, Y.; Saunders, T.E.; Toyama, Y. Basolateral protrusion and apical contraction cooperatively drive Drosophila germ-band extension. Nat. Cell Biol. 2017, 19, 375–383. [Google Scholar] [CrossRef] [PubMed]
- Hutson, M.S. Forces for Morphogenesis Investigated with Laser Microsurgery and Quantitative Modeling. Science 2003, 300, 145–149. [Google Scholar] [CrossRef] [PubMed]
- Toyama, Y.; Peralta, X.G.; Wells, A.R.; Kiehart, D.P.; Edwards, G.S. Apoptotic Force and Tissue Dynamics During Drosophila Embryogenesis. Science 2008, 321, 1683–1686. [Google Scholar] [CrossRef] [PubMed] [Green Version]
- Hara, Y.; Shagirov, M.; Toyama, Y. Cell Boundary Elongation by Non-autonomous Contractility in Cell Oscillation. Curr. Biol. 2016, 26, 2388–2396. [Google Scholar] [CrossRef] [PubMed]
- Polyakov, O.; He, B.; Swan, M.; Shaevitz, J.W.; Kaschube, M.; Wieschaus, E. Passive Mechanical Forces Control Cell-Shape Change during Drosophila Ventral Furrow Formation. Biophys. J. 2014, 107, 998–1010. [Google Scholar] [CrossRef] [Green Version]
- Bertet, C.; Sulak, L.; Lecuit, T. Myosin-dependent junction remodelling controls planar cell intercalation and axis elongation. Nature 2004, 429, 667–671. [Google Scholar] [CrossRef]
- Nishimura, T.; Honda, H.; Takeichi, M. Planar Cell Polarity Links Axes of Spatial Dynamics in Neural-Tube Closure. Cell 2012, 149, 1084–1097. [Google Scholar] [CrossRef] [Green Version]
- Sato, K.; Hiraiwa, T.; Maekawa, E.; Isomura, A.; Shibata, T.; Kuranaga, E. Left–right asymmetric cell intercalation drives directional collective cell movement in epithelial morphogenesis. Nat. Commun. 2015, 6, 10074. [Google Scholar] [CrossRef] [Green Version]
- Taniguchi, K.; Maeda, R.; Ando, T.; Okumura, T.; Nakazawa, N.; Hatori, R.; Nakamura, M.; Hozumi, S.; Fujiwara, H.; Matsuno, K. Chirality in Planar Cell Shape Contributes to Left-Right Asymmetric Epithelial Morphogenesis. Science 2011, 333, 339–341. [Google Scholar] [CrossRef] [PubMed]
- Perez-Mockus, G.; Mazouni, K.; Roca, V.; Corradi, G.; Conte, V.; Schweisguth, F. Spatial regulation of contractility by Neuralized and Bearded during furrow invagination in Drosophila. Nat. Commun. 2017, 8, 1594. [Google Scholar] [CrossRef] [PubMed] [Green Version]
- Martin, A.C.; Goldstein, B. Apical constriction: Themes and variations on a cellular mechanism driving morphogenesis. Development 2014, 141, 1987–1998. [Google Scholar] [CrossRef] [PubMed]
- Heisenberg, C.-P.; Bellaïche, Y. Forces in Tissue Morphogenesis and Patterning. Cell 2013, 153, 948–962. [Google Scholar] [CrossRef] [PubMed] [Green Version]
- Heller, E.; Fuchs, E. Tissue patterning and cellular mechanics. J. Cell Biol. 2015, 211, 219–231. [Google Scholar] [CrossRef] [Green Version]
- Sánchez-Corrales, Y.E.; Röper, K. Alignment of cytoskeletal structures across cell boundaries generates tissue cohesion during organ formation. Curr. Opin. Cell Biol. 2018, 55, 104–110. [Google Scholar] [CrossRef]
- Hara, Y. Contraction and elongation: Mechanics underlying cell boundary deformations in epithelial tissue. Dev. Growth Differ. 2017, 59, 340–350. [Google Scholar] [CrossRef]
- Lee, J.-Y. Uncorking gastrulation: The morphogenetic movement of bottle cells. Wiley Interdiscip. Rev. Dev. Biol. 2012, 1, 286–293. [Google Scholar] [CrossRef]
- Popov, I.K.; Ray, H.J.; Skoglund, P.; Keller, R.; Chang, C. The RhoGEF protein Plekhg5 regulates apical constriction of bottle cells during gastrulation. Development 2018, 145, dev.168922. [Google Scholar] [CrossRef]
- Fletcher, A.G.; Cooper, F.; Baker, R.E. Mechanocellular models of epithelial morphogenesis. Philos. Trans. R. Soc. Lond. B. Biol. Sci. 2017, 372, 20150519. [Google Scholar] [CrossRef] [Green Version]
- Ninomiya, H.; Elinson, R.P.; Winklbauer, R. Antero-posterior tissue polarity links mesoderm convergent extension to axial patterning. Nature 2004, 430, 364–367. [Google Scholar] [CrossRef] [PubMed]
- Williams, M.L.; Solnica-Krezel, L. Regulation of gastrulation movements by emergent cell and tissue interactions. Curr. Opin. Cell Biol. 2017, 48, 33–39. [Google Scholar] [CrossRef] [PubMed]
- Kuranaga, E.; Matsunuma, T.; Kanuka, H.; Takemoto, K.; Koto, A.; Kimura, K.-I.; Miura, M. Apoptosis controls the speed of looping morphogenesis in Drosophila male terminalia. Development 2011, 138, 1493–1499. [Google Scholar] [CrossRef] [PubMed] [Green Version]
- Hatori, R.; Ando, T.; Sasamura, T.; Nakazawa, N.; Nakamura, M.; Taniguchi, K.; Hozumi, S.; Kikuta, J.; Ishii, M.; Matsuno, K. Left–right asymmetry is formed in individual cells by intrinsic cell chirality. Mech. Dev. 2014, 133, 146–162. [Google Scholar] [CrossRef] [PubMed]
- Inaki, M.; Hatori, R.; Nakazawa, N.; Okumura, T.; Ishibashi, T.; Kikuta, J.; Ishii, M.; Matsuno, K.; Honda, H. Chiral cell sliding drives left-right asymmetric organ twisting. Elife 2018, 7, e32506. [Google Scholar] [CrossRef] [PubMed]
- Spéder, P.; Ádám, G.; Noselli, S. Type ID unconventional myosin controls left–right asymmetry in Drosophila. Nature 2006, 440, 803–807. [Google Scholar] [CrossRef]
- Hiraiwa, T.; Kuranaga, E.; Shibata, T. Wave Propagation of Junctional Remodeling in Collective Cell Movement of Epithelial Tissue: Numerical Simulation Study. Front. Cell Dev. Biol. 2017, 5, 66. [Google Scholar] [CrossRef]
- Sato, K. Direction-dependent contraction forces on cell boundaries induce collective migration of epithelial cells within their sheet. Dev. Growth Differ. 2017, 59, 317–328. [Google Scholar] [CrossRef]
- Wen, F.-L.; Wang, Y.-C.; Shibata, T. Epithelial Folding Driven by Apical or Basal-Lateral Modulation: Geometric Features, Mechanical Inference, and Boundary Effects. Biophys. J. 2017, 112, 2683–2695. [Google Scholar] [CrossRef]
- Osterfield, M.; Du, X.; Schüpbach, T.; Wieschaus, E.; Shvartsman, S.Y. Three-Dimensional Epithelial Morphogenesis in the Developing Drosophila Egg. Dev. Cell 2013, 24, 400–410. [Google Scholar] [CrossRef] [Green Version]
- Murisic, N.; Hakim, V.; Kevrekidis, I.G.; Shvartsman, S.Y.; Audoly, B. From discrete to continuum models of three-dimensional deformations in epithelial sheets. Biophys. J. 2015, 109, 154–163. [Google Scholar] [CrossRef] [PubMed]
- Ogura, Y.; Wen, F.-L.; Sami, M.M.; Shibata, T.; Hayashi, S. A Switch-like Activation Relay of EGFR-ERK Signaling Regulates a Wave of Cellular Contractility for Epithelial Invagination. Dev. Cell 2018, 46, 162–172.e5. [Google Scholar] [CrossRef] [PubMed]
- Hočevar Brezavšček, A.; Rauzi, M.; Leptin, M.; Ziherl, P. A Model of Epithelial Invagination Driven by Collective Mechanics of Identical Cells. Biophys. J. 2012, 103, 1069–1077. [Google Scholar] [CrossRef] [PubMed] [Green Version]
- Štorgel, N.; Krajnc, M.; Mrak, P.; Štrus, J.; Ziherl, P. Quantitative Morphology of Epithelial Folds. Biophys. J. 2016, 110, 269–277. [Google Scholar] [CrossRef] [PubMed]
- Misra, M.; Audoly, B.; Kevrekidis, I.G.; Shvartsman, S.Y. Shape Transformations of Epithelial Shells. Biophys. J. 2016, 110, 1670–1678. [Google Scholar] [CrossRef] [PubMed]
- Hannezo, E.; Prost, J.; Joanny, J.-F. Theory of epithelial sheet morphology in three dimensions. Proc. Natl. Acad. Sci. USA 2014, 111, 27–32. [Google Scholar] [CrossRef]
- Krueger, D.; Tardivo, P.; Nguyen, C.; De Renzis, S. Downregulation of basal myosin-II is required for cell shape changes and tissue invagination. EMBO J. 2018, 37, e100170. [Google Scholar] [CrossRef] [PubMed]
- Okuda, S.; Takata, N.; Hasegawa, Y.; Kawada, M.; Inoue, Y.; Adachi, T.; Sasai, Y.; Eiraku, M. Strain-triggered mechanical feedback in self-organizing optic-cup morphogenesis. Sci. Adv. 2018, 4, eaau1354. [Google Scholar] [CrossRef] [PubMed]
- Nagai, T.; Honda, H. A dynamic cell model for the formation of epithelial tissues. Philos. Mag. B 2001, 81, 699–719. [Google Scholar] [CrossRef]
- Li, B.; Sun, S.X. Coherent Motions in Confluent Cell Monolayer Sheets. Biophys. J. 2014, 107, 1532–1541. [Google Scholar] [CrossRef] [Green Version]
- Bi, D.; Yang, X.; Marchetti, M.C.; Manning, M.L. Motility-driven glass and jamming transitions in biological tissues. Phys. Rev. X 2016, 6, 021011. [Google Scholar] [CrossRef] [PubMed]
- Coburn, L.; Lopez, H.; Caldwell, B.J.; Moussa, E.; Yap, C.; Priya, R.; Noppe, A.; Roberts, A.P.; Lobaskin, V.; Yap, A.S.; et al. Contact inhibition of locomotion and mechanical cross-talk between cell–cell and cell–substrate adhesion determine the pattern of junctional tension in epithelial cell aggregates. Mol. Biol. Cell 2016, 27, 3436–3448. [Google Scholar] [CrossRef] [PubMed] [Green Version]
- Lecuit, T.; Lenne, P.-F.; Munro, E. Force Generation, Transmission, and Integration during Cell and Tissue Morphogenesis. Annu. Rev. Cell Dev. Biol. 2011, 27, 157–184. [Google Scholar] [CrossRef]
- Jha, A.; van Zanten, T.S.; Philippe, J.-M.; Mayor, S.; Lecuit, T. Quantitative Control of GPCR Organization and Signaling by Endocytosis in Epithelial Morphogenesis. Curr. Biol. 2018, 28, 1570–1584.e6. [Google Scholar] [CrossRef]
- Fletcher, A.G.; Osterfield, M.; Baker, R.E.; Shvartsman, S.Y. Vertex Models of Epithelial Morphogenesis. Biophys. J. 2014, 106, 2291–2304. [Google Scholar] [CrossRef] [PubMed] [Green Version]
- Collinet, C.; Rauzi, M.; Lenne, P.-F.; Lecuit, T. Local and tissue-scale forces drive oriented junction growth during tissue extension. Nat. Cell Biol. 2015, 17, 1247–1258. [Google Scholar] [CrossRef]
- Sato, K.; Hiraiwa, T.; Shibata, T. Cell Chirality Induces Collective Cell Migration in Epithelial Sheets. Phys. Rev. Lett. 2015, 115, 188102. [Google Scholar] [CrossRef] [PubMed]
- Tee, Y.H.; Shemesh, T.; Thiagarajan, V.; Hariadi, R.F.; Anderson, K.L.; Page, C.; Volkmann, N.; Hanein, D.; Sivaramakrishnan, S.; Kozlov, M.M.; et al. Cellular chirality arising from the self-organization of the actin cytoskeleton. Nat. Cell Biol. 2015, 17, 445–457. [Google Scholar] [CrossRef]
- Lebreton, G.; Géminard, C.; Lapraz, F.; Pyrpassopoulos, S.; Cerezo, D.; Spéder, P.; Ostap, E.M.; Noselli, S. Molecular to organismal chirality is induced by the conserved myosin 1D. Science 2018, 362, 949–952. [Google Scholar] [CrossRef]
Figure 1.
Modulation at different cell surfaces induces tissue-scale fold formation. The five cells at the center of a cell sheet (13 cells) are modulated at the apical (a) or basal–lateral (b) surface. Depending on the apical or basal–lateral modulations, characteristic folds with a shallow V-shape or deep U-shape are formed. Modified from [29].

Figure 2.
Cellular vertex model in an apical plane. (a) Top view of an epithelial tissue at the apical plane. Cell–cell junctions are white (E-cad). (b) In the vertex model in two dimensions, each cell is regarded as a polygon [33]. (c) The process in which two cells (B and D) collide with each other. (d) In the cell vertex model, this process is represented by the T1 transition, a type of junctional remodeling. Reprinted and modified from [27].

Figure 3.
Numerical simulation of Drosophila genitalia rotation. (a) Schematic diagram of the mathematical model. Particularly strong tension is applied only at the junctions tilted clockwise, as indicated by the red lines. (b) Tissue rotation in our simulation. Each polygon indicates each cell [33]. (c) Rotation angle around the tissue center of each cell measured from the AP axis going through the cell at the initial time, t = 20. Red, blue, and green lines correspond to the color of individual cells in b. (d) Mechanical wave propagation. Junctional remodeling (colored dots) propagates clockwise, at a much faster speed than the migration speed of each cell. In (d), the simulation is carried out in the absence of tension oscillation (fkl = 0) for the sake of visibility. Arrow heads indicate the junctions undergoing remodeling. Reprinted and modified from [27].

© 2019 by the authors. Licensee MDPI, Basel, Switzerland. This article is an open access article distributed under the terms and conditions of the Creative Commons Attribution (CC BY) license (http://creativecommons.org/licenses/by/4.0/).
Share and Cite
MDPI and ACS Style
Hiraiwa, T.; Wen, F.-L.; Shibata, T.; Kuranaga, E. Mathematical Modeling of Tissue Folding and Asymmetric Tissue Flow during Epithelial Morphogenesis. Symmetry 2019, 11, 113. https://0-doi-org.brum.beds.ac.uk/10.3390/sym11010113
AMA Style
Hiraiwa T, Wen F-L, Shibata T, Kuranaga E. Mathematical Modeling of Tissue Folding and Asymmetric Tissue Flow during Epithelial Morphogenesis. Symmetry. 2019; 11(1):113. https://0-doi-org.brum.beds.ac.uk/10.3390/sym11010113
Chicago/Turabian StyleHiraiwa, Tetsuya, Fu-Lai Wen, Tatsuo Shibata, and Erina Kuranaga. 2019. "Mathematical Modeling of Tissue Folding and Asymmetric Tissue Flow during Epithelial Morphogenesis" Symmetry 11, no. 1: 113. https://0-doi-org.brum.beds.ac.uk/10.3390/sym11010113
Note that from the first issue of 2016, this journal uses article numbers instead of page numbers. See further details here.