Identification and Classification of Maize Drought Stress Using Deep Convolutional Neural Network


1
Key Laboratory of Agricultural Remote Sensing, Ministry of Agriculture/Institute of Agricultural Resources and Regional Planning, Chinese Academy of Agricultural Sciences, Beijing 100081, China
2
Institute of Automation, Chinese Academy of Sciences, Beijing 100190, China
*
Author to whom correspondence should be addressed.
Symmetry 2019, 11(2), 256; https://doi.org/10.3390/sym11020256
Submission received: 11 January 2019
/
Revised: 13 February 2019
/
Accepted: 14 February 2019
/
Published: 18 February 2019
Abstract
:Drought stress seriously affects crop growth, development, and grain production. Existing machine learning methods have achieved great progress in drought stress detection and diagnosis. However, such methods are based on a hand-crafted feature extraction process, and the accuracy has much room to improve. In this paper, we propose the use of a deep convolutional neural network (DCNN) to identify and classify maize drought stress. Field drought stress experiments were conducted in 2014. The experiment was divided into three treatments: optimum moisture, light drought, and moderate drought stress. Maize images were obtained every two hours throughout the whole day by digital cameras. In order to compare the accuracy of DCNN, a comparative experiment was conducted using traditional machine learning on the same dataset. The experimental results demonstrated an impressive performance of the proposed method. For the total dataset, the accuracy of the identification and classification of drought stress was 98.14% and 95.95%, respectively. High accuracy was also achieved on the sub-datasets of the seedling and jointing stages. The identification and classification accuracy levels of the color images were higher than those of the gray images. Furthermore, the comparison experiments on the same dataset demonstrated that DCNN achieved a better performance than the traditional machine learning method (Gradient Boosting Decision Tree GBDT). Overall, our proposed deep learning-based approach is a very promising method for field maize drought identification and classification based on digital images.
1. Introduction
Maize is one of the main food crops, and drought stress significantly affects its growth and decreases its yield at all developmental stages [1,2]. Different drought stress levels have different effects on maize growth and yield [3]. Meanwhile, different drought stress levels of maize require different amounts of irrigation [4]. Therefore, early detection and accurate drought stress monitoring is of great significance for maize precision irrigation, water consumption reduction, and to ensure a high and stable yield of maize [5].
Traditional drought stress severity monitoring is based on soil moisture sensors [6], which have low efficiency and limited indirect and spatial area [7,8]. Maize plants develop different physiological mechanisms to mitigate the impact of drought stress, causing a series of phenotypic changes, such as changes in leaf color and texture [9], leaf rolling, a decreased leaf extension rate, and plant dwarfing [10,11]. Thus, maize phenotypic variation is a direct manifestation of maize drought stress. It is a rapid and non-destructive method to identify and classify maize drought stress based on phenotypic characteristics.
With the development of computer vision, machine learning and image processing techniques are widely being used in crop biotic and abiotic stress phenotype research, and traditional machine learning has proved to be one of the most flexible and powerful crop phenotype analysis techniques [12,13,14]. An artificial neural network (ANN) and image processing techniques were applied to identify and classify phalaenopsis seedling diseases. Specifically, the color and texture features of images were extracted and then used as inputs to the neural network to detect disease [15]. Zakaluk and Sri Ranjan used digital camera-acquired tomato images under four soil water stress levels and built an artificial neural network model with RGB images to determine the leaf water potential [16]. Support vector machine (SVM) and the Gaussian processes classifier (GPC) were applied to automatically detect regions in spinach canopies with different soil moisture levels based on thermal and digital images [17]. Stress detection based on traditional machine learning mainly includes image segmentation and feature extraction. Then, the features are input into the machine learning algorithm for stress identification, classification, quantification, and prediction [12]. Although traditional machine learning has achieved good results in biotic and abiotic stress recognition, it often requires segmentation of the target image and manual extraction of image features, and is therefore time-consuming and labor-intensive [18]. Furthermore, manually extracted features are easily affected by aspects of the background and environment, such as soil, lighting, and wind; therefore, the accuracy of classification is limited [19].
In recent years, deep convolutional neural network integrating image feature extraction with classification in a single pipeline made great breakthroughs in the image identification field [20,21], so much so that CNNs have started to become mainstream in biotic and abiotic stress diagnosis and classification [22]. In contrast to traditional machine learning approaches, CNNs have been shown to substantially outperform approaches for complex and abstract plant phenotyping tasks [19]. A deep convolutional network was applied to sort haploid seeds, and it outperformed the traditional machine learning method based on color and texture [23]. Uzal et al. reported that when the deep learning model and SVM were used to estimate the number of seeds in soybean pods, the estimation accuracy of deep learning was significantly higher than that of SVM [24]. In the monitoring and diagnosis of crop stress, the deep learning method was shown to be more accurate and objective than expert diagnosis [25]. Deep learning models were developed to detect and diagnose plant diseases based on leaf images. The detection accuracy of 58 plant diseases was 99.53% [26]. In general, there are two means to apply the deep learning model. One is “Train from scratch” and the other is “Transfer learning”. “Train from scratch” refers to changing all the weights and parameters of the model during training. “Transfer learning” keeps the weight of the model convolution layer fixed, only changing the weight and parameters of the classification layer. “Transfer learning” only requires a small dataset and low hardware facilities and achieves better results in smaller datasets. Therefore, it is a good choice to use a pre-trained model to transfer learning with small datasets [27].
In this study, we used the DCNN method to identify and classify different drought stress levels (optimum moisture, light drought stress, and moderate drought stress) of maize. Datasets were collected from the field environment. Two DCNN models were applied to detect maize drought stress. We also compared the identification accuracy of DCNN and traditional machine learning (GBDT) [9]. The main contributions of this paper are summarized as follows:
- In order to rapidly, accurately, and nondestructively identify different drought stress levels in maize, we proposed the use of the DCNN method to identify and classify different drought stress levels of maize. We compared the methods of transfer learning and train from scratch using the Resnet50 and Resnet152 model to identify maize drought stress. The results show that the identification accuracy of transfer learning is higher than that of train from scratch, and it saves a lot of time.
- We set up an image dataset for maize drought stress identification and classification. Digital cameras were applied to obtain maize drought stress images in the field. Drought stress was divided into three levels: optimum moisture, light, and moderate drought stress. Maize plant images were captured every two hours. The size of the images was 640 × 480 pixels, and a total of 3461 images were captured in two stages (seedling and jointing stage) and were transformed into gray images.
- We compared the accuracy of maize drought identification between the DCNN and traditional machine learning approach based on manual feature extraction on the same dataset. The results showed that the accuracy of DCNN was significantly higher than that of the traditional machine learning method based on color and texture.
2. Materials and Methods
2.1. Field Experiment
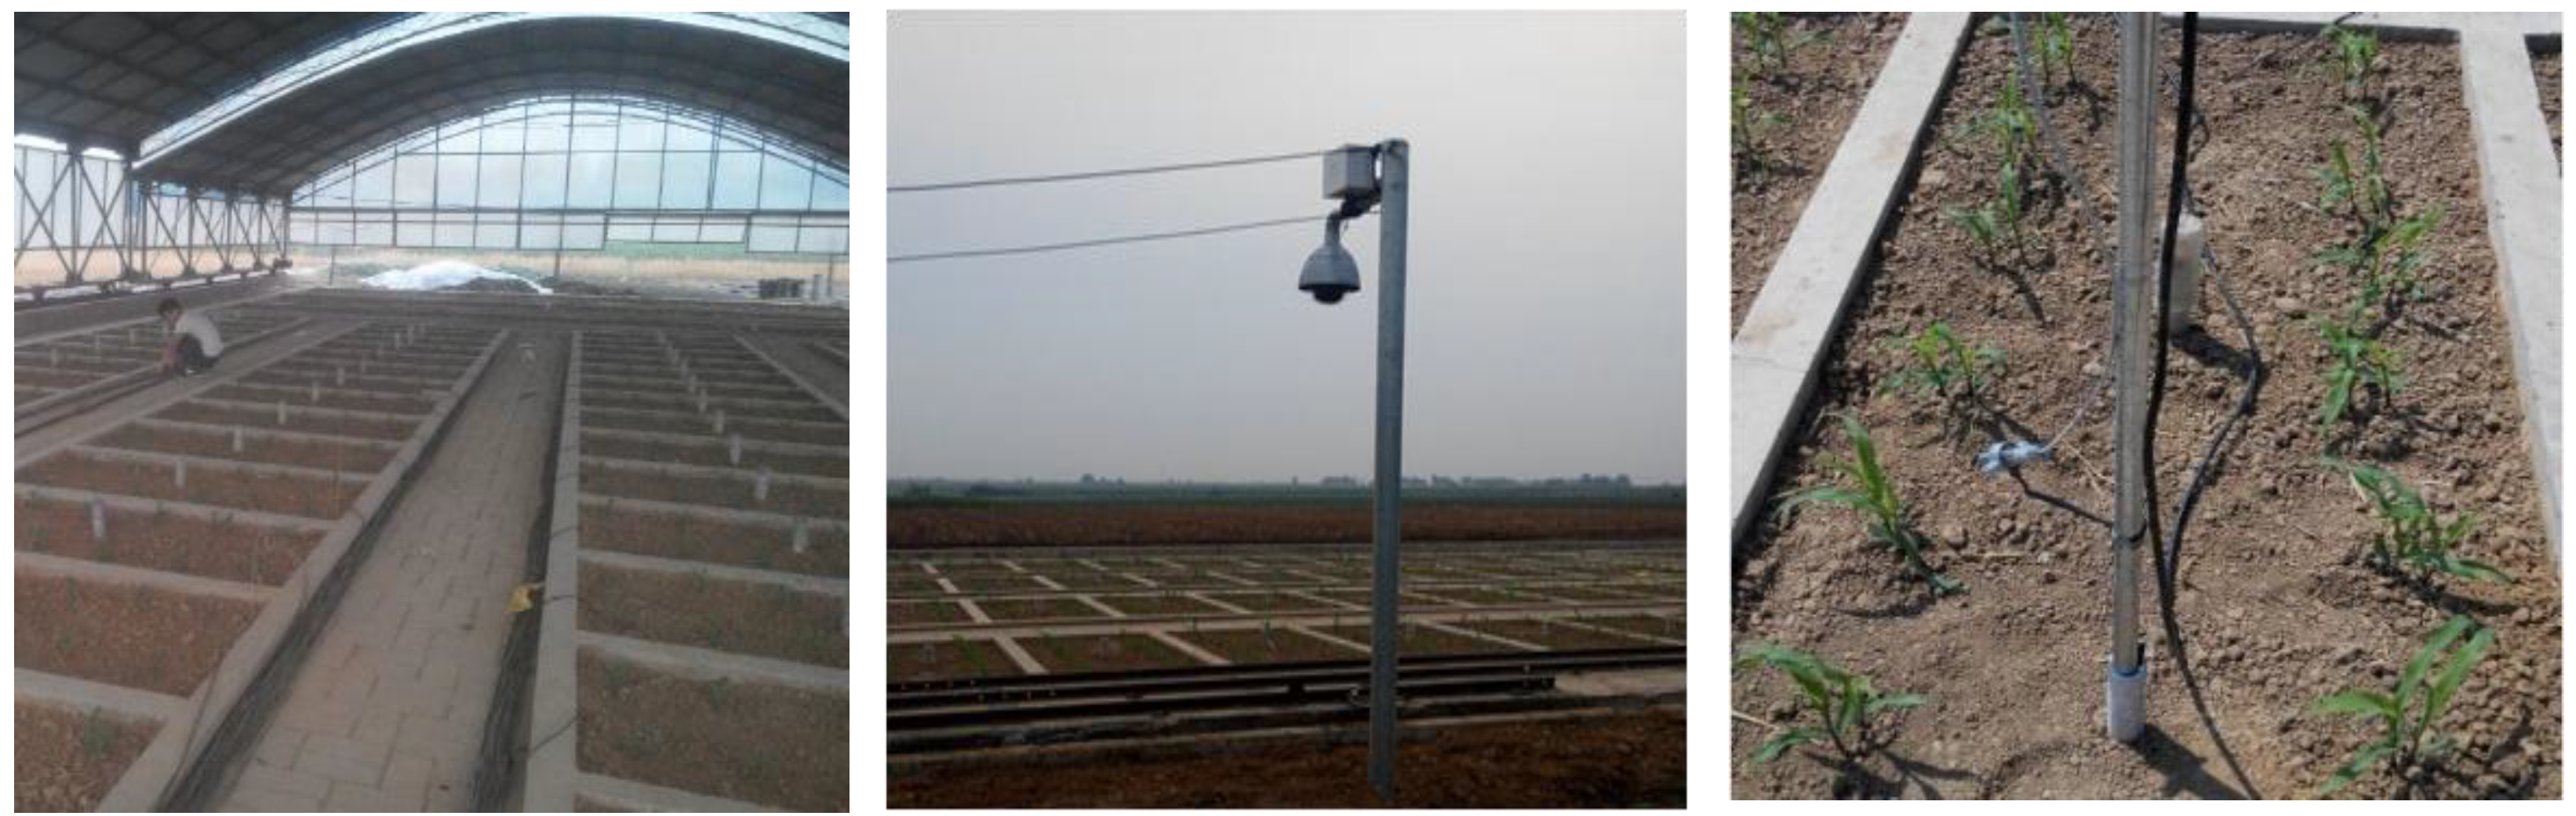
The experiment was carried out at the experimental base of the Cotton Research Institute of Shanxi Academy of Agricultural Sciences in 2014 (35.03°N, 110.58°E). The annual average temperature of the site is 14.5°C, and the annual illumination is 2139 h. The experiment used a combination of a large electric movable rain-out shelter and a control pond to control the soil moisture content (Figure 1). The area of each plot was 2 m2 (1 m × 2 m), and each plot was surrounded by cement. The soil type was loam soil, the soil depth was 1.5 m, the average bulk density of the soil was 1.39 g/cm3, and the field water capacity was 25.09%. In order to achieve accurate water control, each plot bottom was covered with polyethylene thick film to partition water exchange with the deep soil layer. The maize variety used was Zhengdan 958, which is the most popular cultivated variety in China and has excellent agronomic traits. The growth stage was about 96 days, the plant height was 240 cm, and the spike height was about 100 cm. Maize was sown in June 18, 2014, with 2 rows and 6 plants per row. Except for the different irrigation treatments, all other farming activities were the same as those used in local high yield fields. Figure 1 depicts the test area situation.
The experiment was divided into two growth stages (seedling and jointing) and three different water treatments, that is, optimum moisture (OM), light drought stress (LD), and moderate drought stress (MD). Based on the water requirements at different growth stages of maize, the water contents for the optimum moisture, light drought, and moderate drought conditions were 65–80% Field capacity (FC), 50–65% FC, and 30–40% FC, respectively, at the seedling stage and 65–80% FC, 50–60% FC, and 40–50% FC, respectively, at the jointing stage. Normal soil moisture supply during the early growth stage ensured that the maize sprouted normally. By July 3, the maize grew to the three-leaf stage. On July 30, the maize was in the huge bellbottom stage. Drought control at the seedling stage was conducted from July 3 to July 30, and at the jointing stage from July 31 to August 26. The soil moisture sensor TDC210I was used to monitor the soil moisture. It was laid before planting, and a 50 cm wide straight ditch was excavated. The sensor was inserted laterally into the channel side and pushed tightly, then backfilled with soil. During the backfilling process, the soil was backfilled according to the original level, without changing the original structure of the soil and leaving no gaps. During drought control, according to the volumetric water content, data measured every five minutes by the soil moisture sensor was used to judge whether or not irrigation was needed. When the measured soil water content was lower than the lower control limit, irrigation was performed to the upper limit of the control. When watering, a water meter was attached to the head of the water pipe, and the water was filled according to the calculated amount of irrigation. When watering, the water head was moved at a uniform speed according to the flow rate of the water, so that the whole area was filled evenly with water.
2.2. Image Data Acquisition
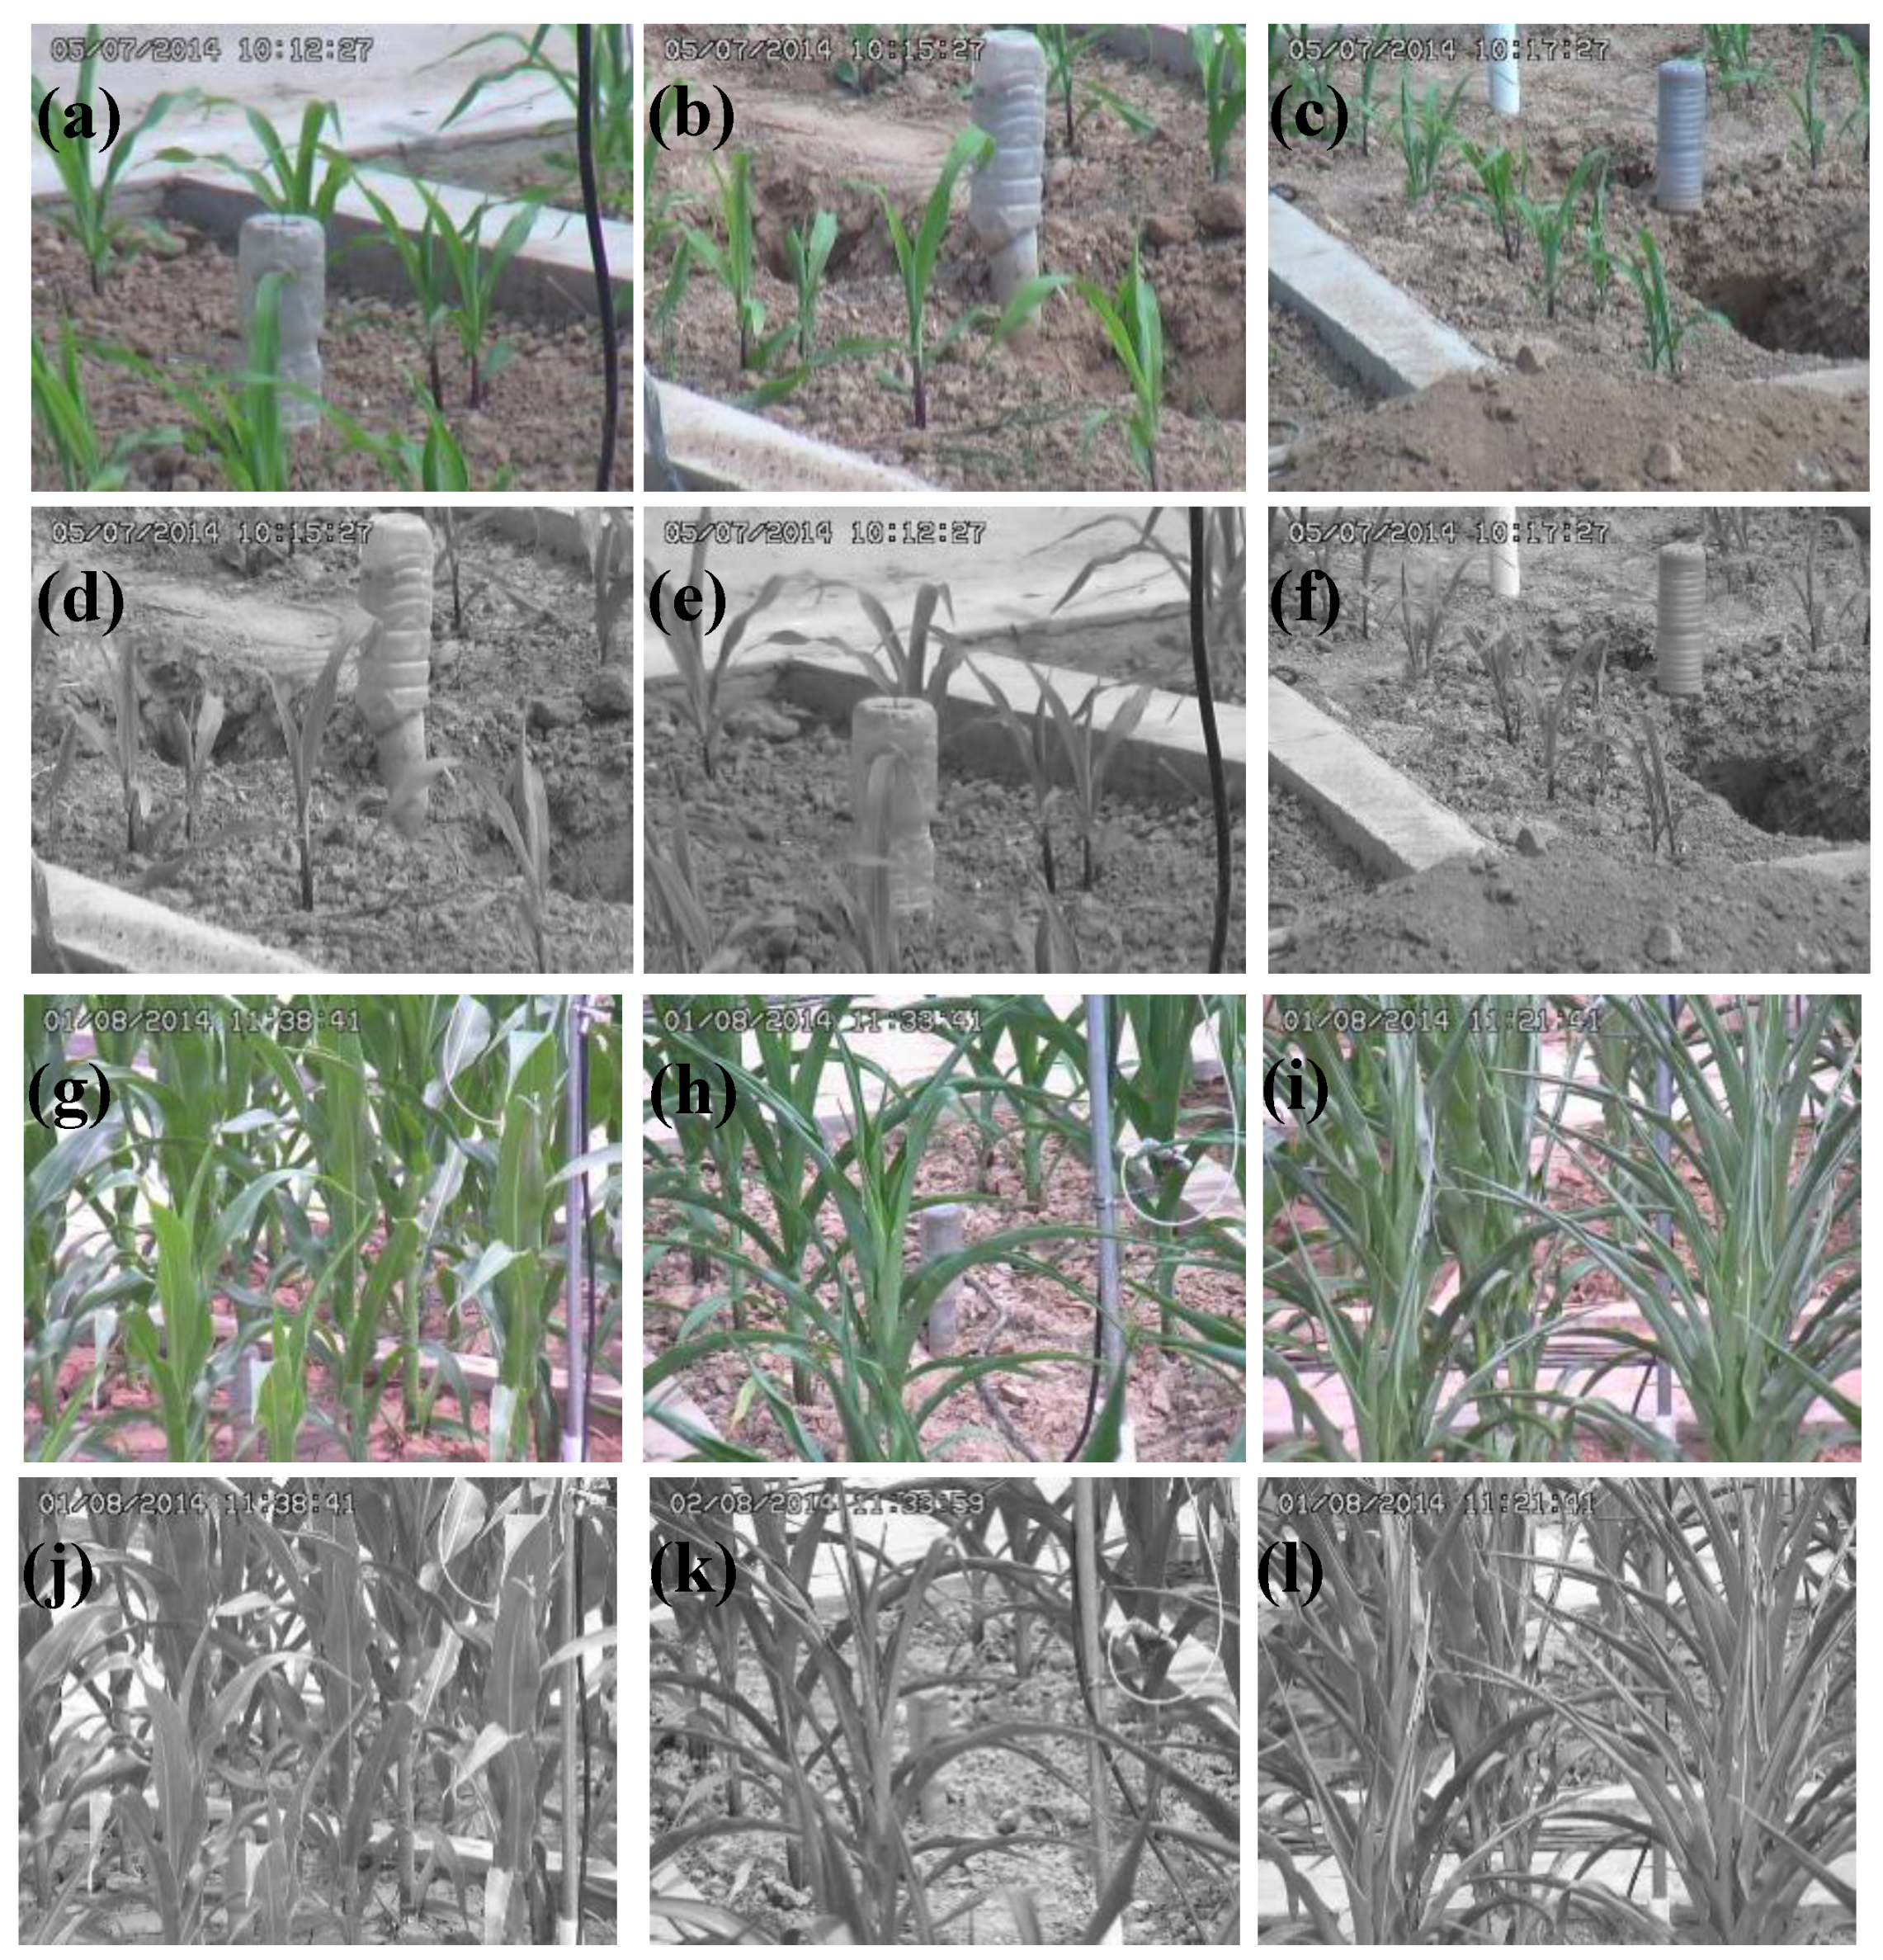
Image acquisition was undertaken using a 720 p outdoor network dome camera WV-SW396AH, produced by Panasonic. The camera was equipped with a 1.3 million pixel dual speed MOS sensor, and the tilt table was able to rotate 360 degrees. The camera was fixed at 4.5 m above the ground. Each treatment had three repetitions, namely A, B and C; each repetition had a different camera shooting angle to increase the diversity of image data. During the maize growth process, the shooting parameters needed to be adjusted to maintain the quality of the collected images. Shooting time was from 6:00 a.m. to 18:00 p.m. at the seedling stage, and from 6:00 a.m. to 19:00 p.m. at the jointing stage. Maize plant images were captured every two hours and the image resolution was 640 × 480 in JPG storage format. Due to the uneven distribution of soil moisture and the influence of external environmental factors, a small number of image samples had different drought stress maize plants and different phenotypic characteristics in a single image. The label of this kind of image is determined by the drought stress level of most maize plants in the image sample. Label criteria refer to the Agricultural Industry Standard of the People’s Republic of China “Technical Specification for Field Investigation and Classification of Maize Disasters” [28] (Optimum moisture: plants grow normally. Light drought stress: some leaves are rolled during the day and return to normal at night. Moderate drought stress: most of the leaves are rolled during the day, a few of them are withered, and some of them return to normal at night.). As a result of field management and irrigation treatment, images for some of the time stages were not acquired. The numbers of maize images from the different fields are shown in Table 1. After data acquisition, the RGB images were transformed into gray images (Figure 2).
2.3. DCNN Model
In this study, two different DCNN models were applied to identify and classify drought stress in maize, namely ResNet50 and ResNet152. The numbers 50 and 152 represent the layers of the model. The ResNet network mainly consists of 3 × 3 convolution layers [29]. The key problem solved by ResNet is the “degradation problem” of the model. After the model layer is deepened, ResNet adds a residual structure between layers to solve the problem of vanishing/exploding gradients when the model is deeper. This type of DCNN can be very deep and achieve a high identification accuracy [30].
2.4. Training Process
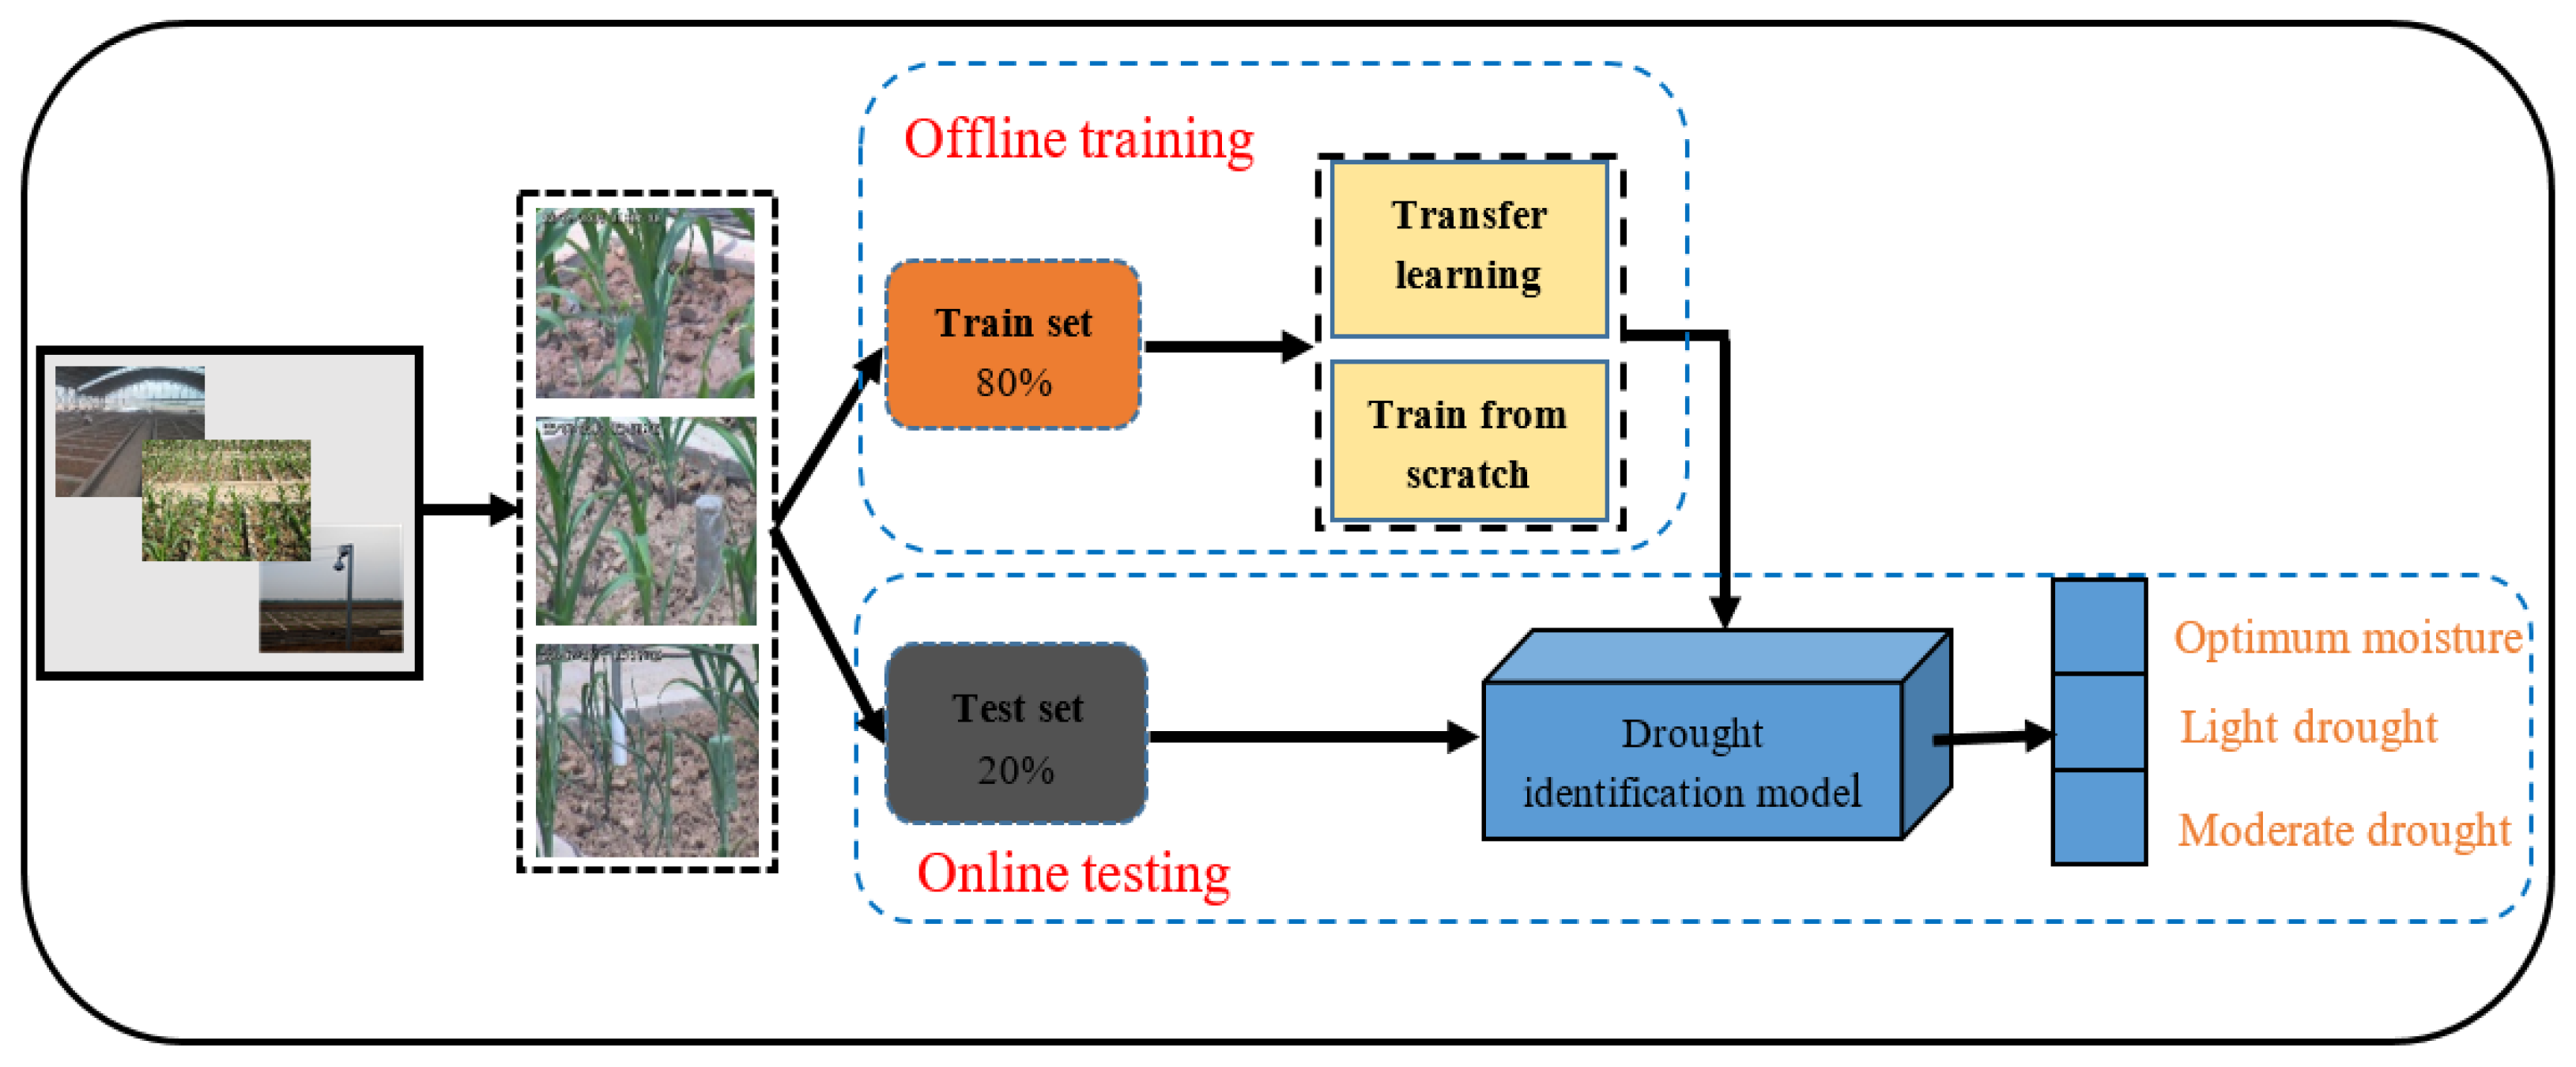
In the experiment, we used the transfer learning and train from scratch methods to train the model. Model training consisted of three parts: the total dataset, the seedling sub-dataset, and the jointing sub-dataset. The training and test set were randomly divided, of which 80% was the training set and 20% was the test set. All images were converted to the tf.record format (data format in tensorflow). During training, all model hyperparameters were consistent and we set these empirically: the learning rate was 0.01, the type of learning decay was exponential, the batch size was 32, and the optimizer was SGD. The convergence of the model was judged by the value of the loss function. After model training, we tested the drought recognition accuracy of the model. Figure 3 shows the flowchart of the experiment.
In comparison experiments with traditional machine learning, we used the same dataset as in a previous study [9]. The dataset is a sub-dataset of the seedling stage and contained 656 images including 219 optimum moisture images, 218 light drought stress images, and 219 moderate drought stress images. The difference was that manual feature extraction was used, including color and texture features and then training with the traditional machine learning method (GBDT) and 6-fold cross validation were applied. In our method, we used the DCNN model ResNet50 to extract the image features directly and then identified and classified the maize drought stress. Due to the small amount of data, we only trained 100 epochs and 100 images for testing.
The digital image processing and training model were done with the Python 3.6 software and all of the above experiments were conducted on the Tensorflow platform, which is a fast, open source framework for deep learning. The software was run on a PC with Xeon W-2145, 3.7 GHz CPU (Central processing unit), and 64 GB RAM with a GPU (Graphic Processor Unit): NVIDIA GeForce GTX 1080Ti 11G.
Referring to previous work by our team [9], two accuracy measures were proposed to evaluate the effectiveness of the detection model: the accuracy of drought stress identification (DI) and the accuracy of drought stress classification (DC). These were defined as
where NO, NL, and NM are the number of optimum moisture, light drought, and moderate drought test samples, respectively; DLM is the number of light drought and moderate drought stressed samples detected correctly to be under water stress; and Dtrue is the correct identification number of all of the samples.
3. Results
3.1. Comparison of Accuracy and Training Time of Different Models
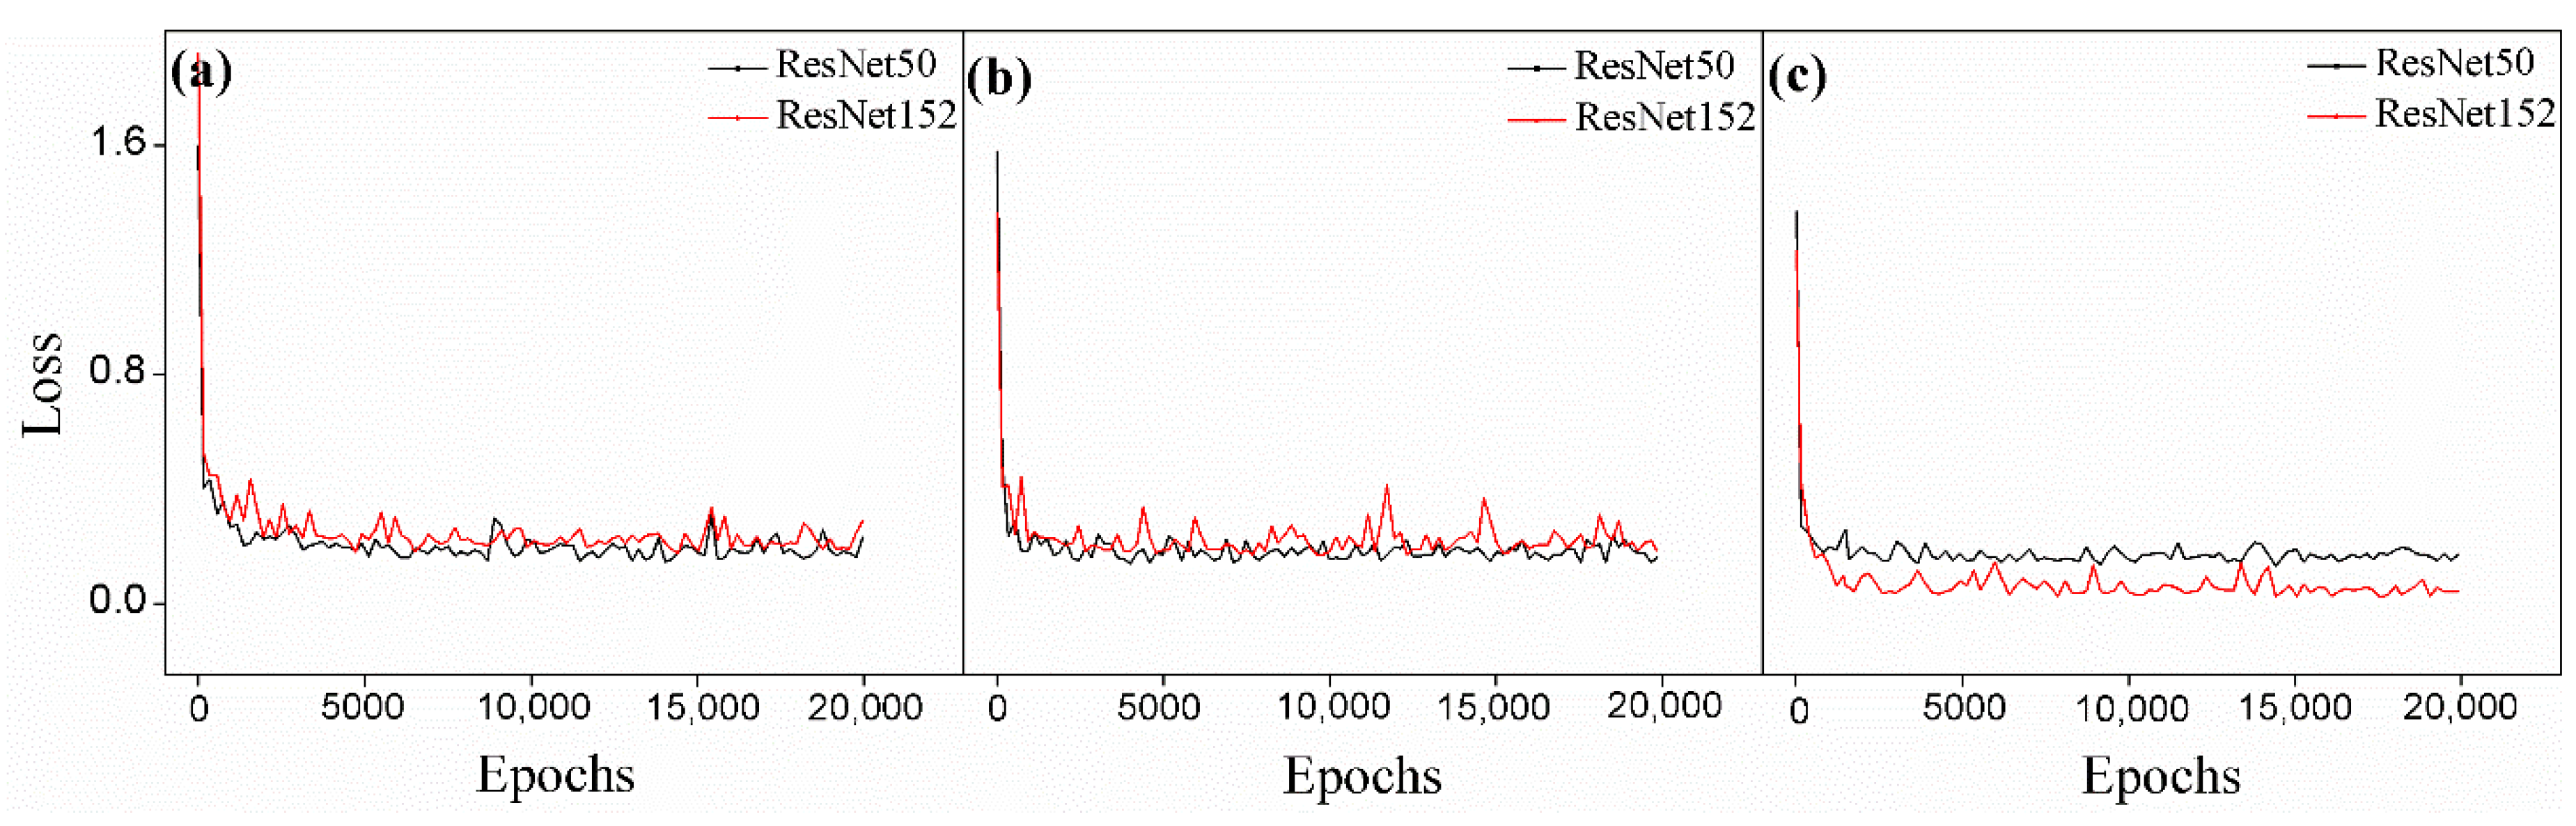
The training loss functions of different image types during the two stages are shown in Figure 4. With an increase in training epochs, the model gradually converged. However, in the total dataset, the number of convergence epochs of the model was relatively large. In this experiment, the training epochs are set to 7000 on the total dataset and 5000 epochs at the seedling and jointing stages. The accuracy and training time of the model’s transfer learning and train from scratch were compared by the specific epochs (Table 2). The time consumption of transfer learning was significantly less (by about 2–3 times) than that of train from scratch. ResNet50 required less training time than ResNet152. In the seedling and jointing sub-datasets, ResNet50 took the least time for transfer learning—only about eight minutes—whereas it took about sixteen minutes to train from scratch. ResNet152 transfer learning took about nineteen minutes, while train from scratch took about forty-one minutes. The accuracy of transfer learning in the two models was higher than that of train from scratch in all datasets. At the same time, both models achieved high accuracy, and the difference in accuracy between ResNet50 and ResNet152 is not significant. Considering the time consumption, we chose ResNet50 as our model for the next analysis, and we trained the model with the transfer learning method.
3.2. Identification and Classification of Drought Stress in Maize by DCNN
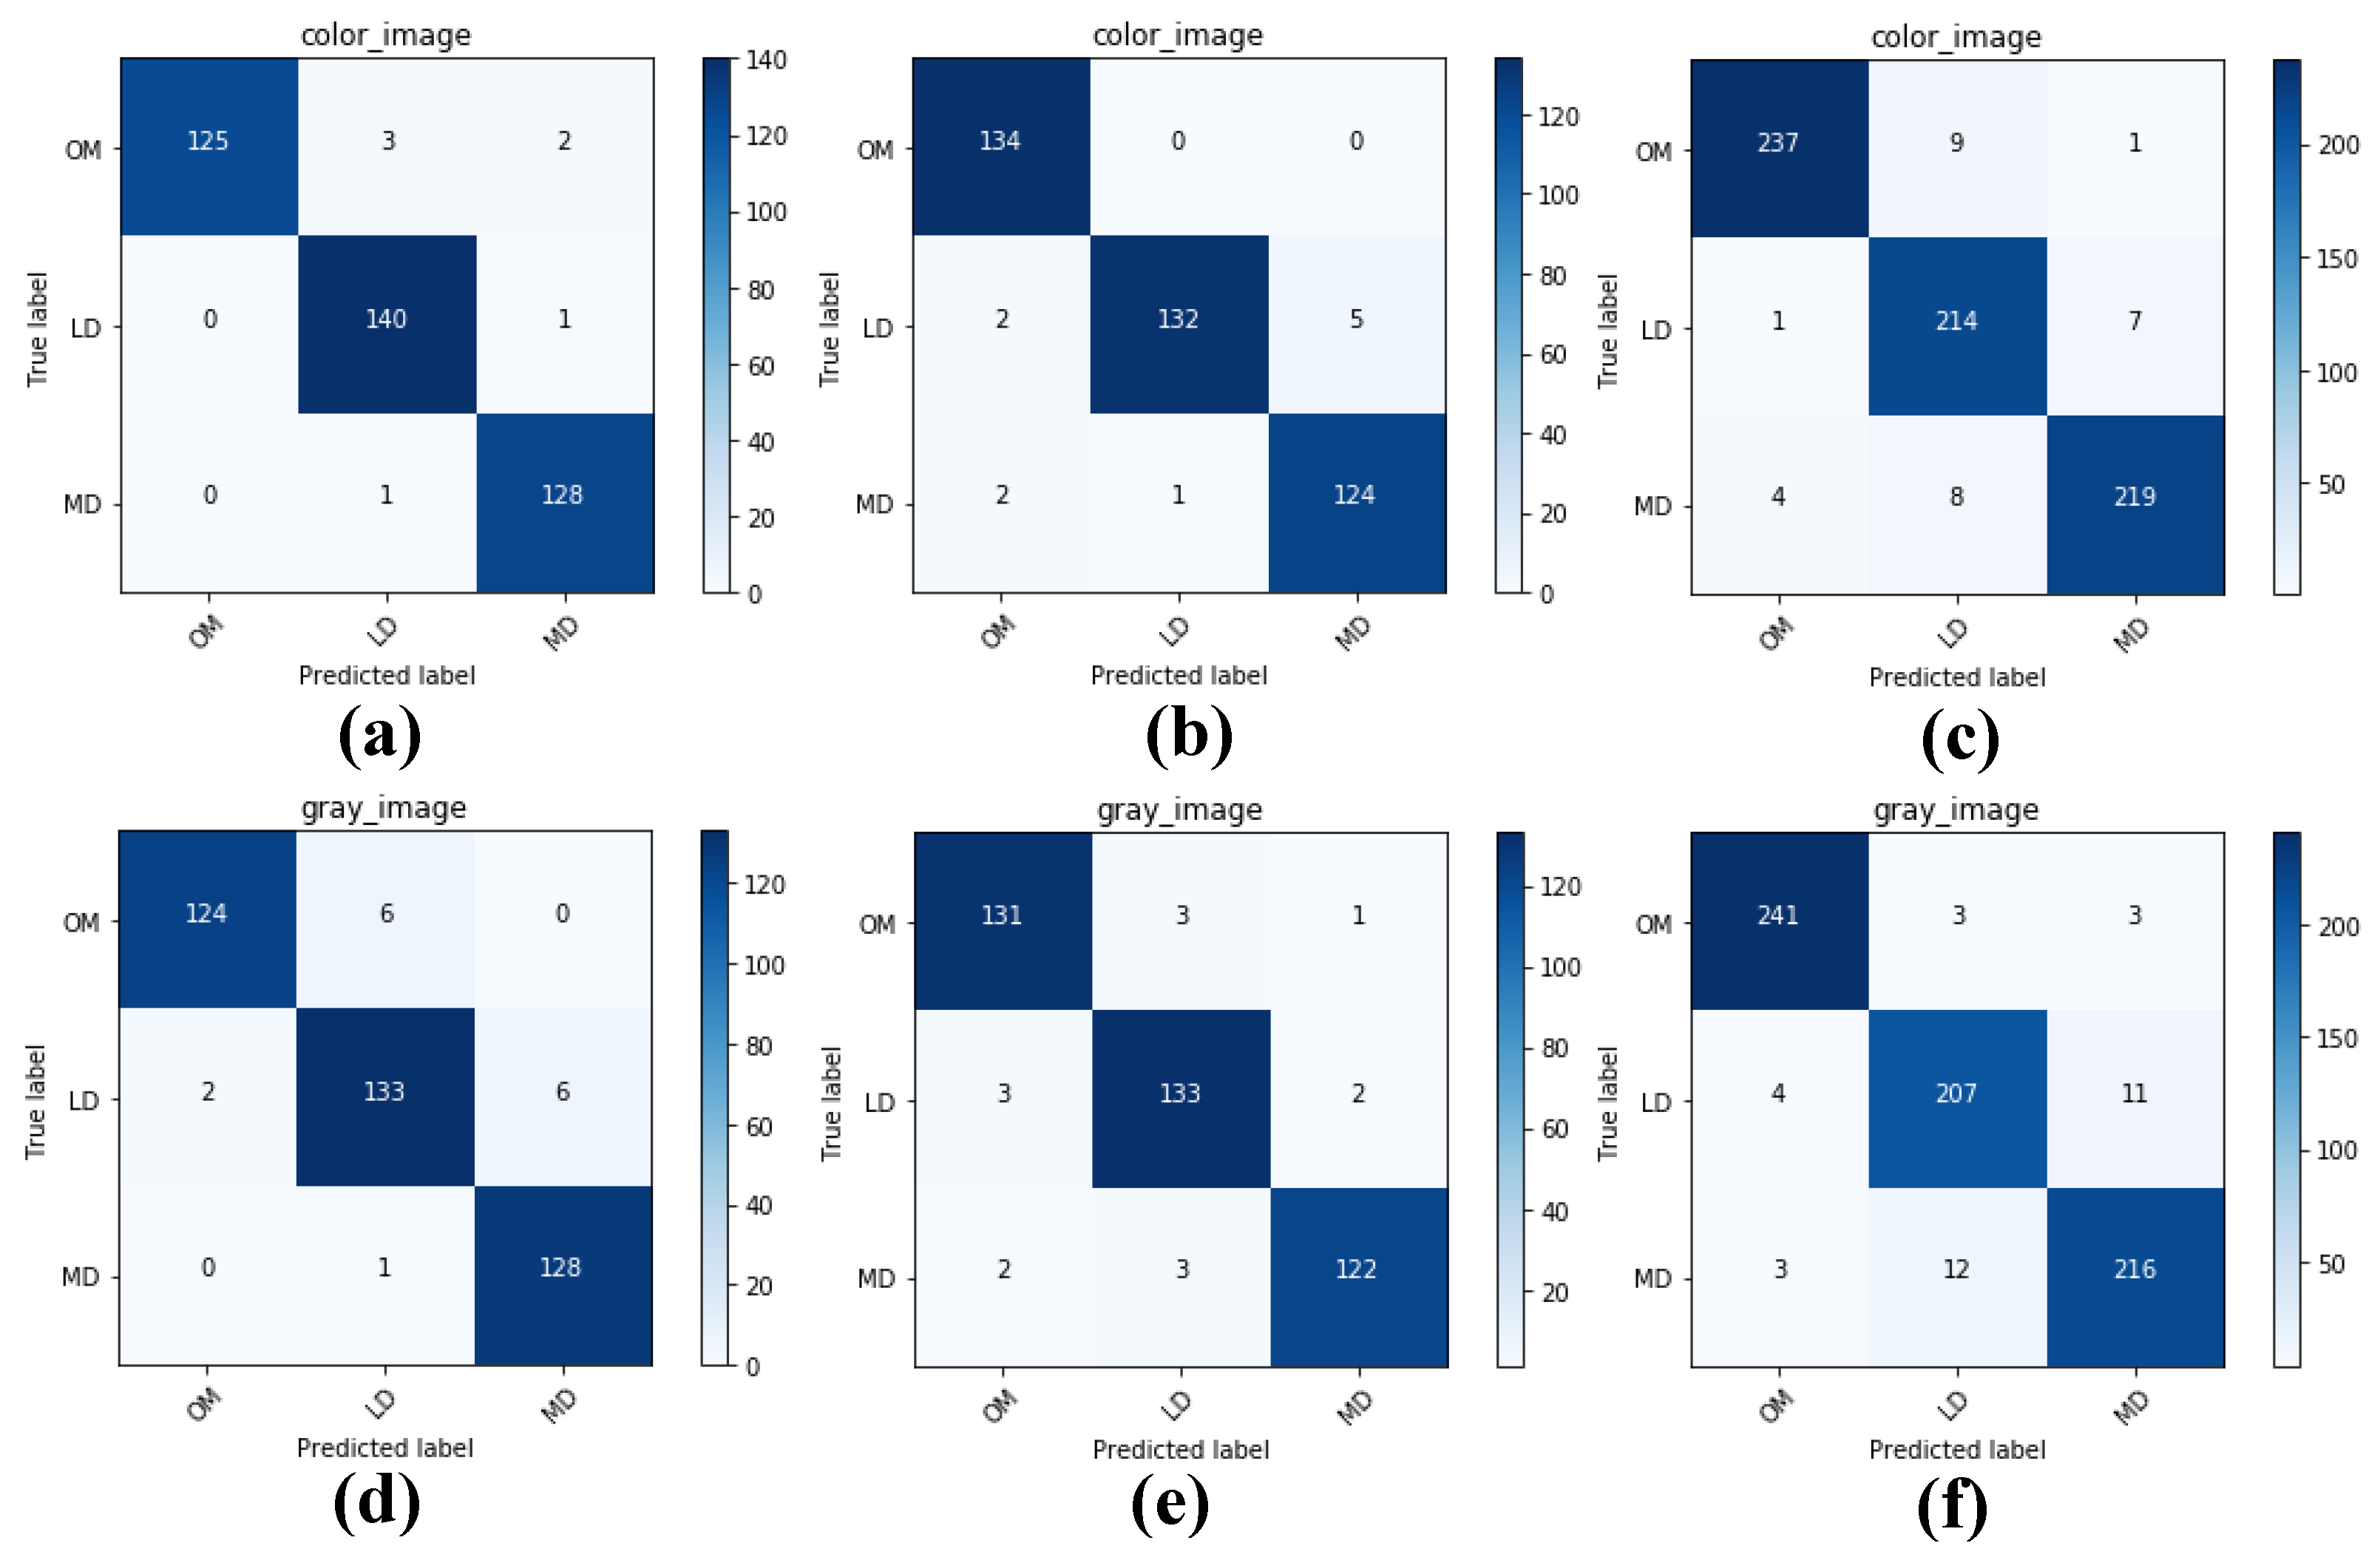
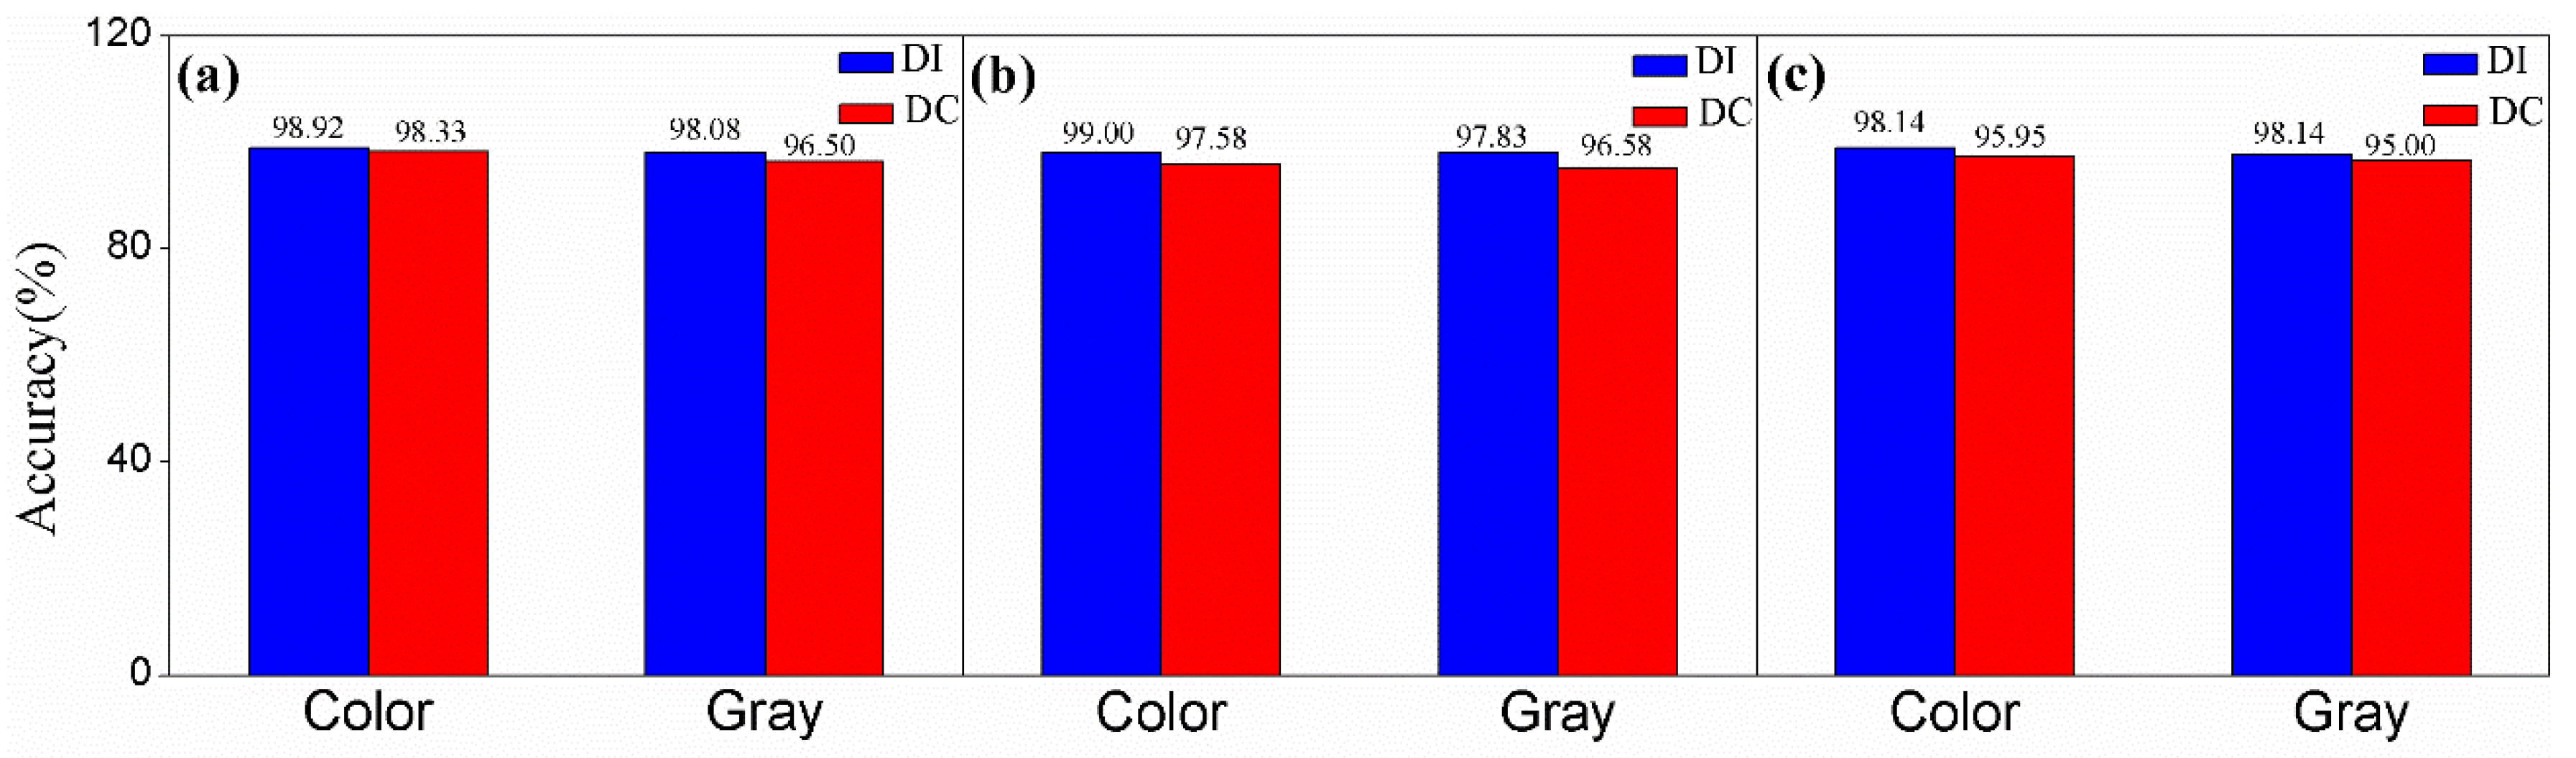
The classification confusion matrix is shown in Figure 5. The classification confusion matrix revealed that most maize images were classified correctly. Despite erroneous classification taking place among the three drought stress treatments, two linked moisture treatments were more prone to misclassification. Optimum moisture was easily misclassified as light drought; light drought was easily misclassified as optimum moisture and moderate drought; and moderate drought was easily misclassified as light drought. Based on the confusion matrix, the accuracy levels of maize drought identification and classification were calculated to be over 95% (Figure 6). Across the total dataset, no significant differences were observed between the color and gray image accuracy in maize drought stress identification, and the identification accuracy was 98.14%. However, regarding the classification accuracy of maize drought stress, the color images were more accurate than the gray images. These accuracy levels were slightly lower than those of the seedling and jointing sub-datasets. At the seedling stage, the identification and classification accuracy levels of the model were 98.92% and 98.33%, respectively, for the wheat color images and 98.08% and 96.50%, respectively, for the gray images. At the jointing stage, the identification and classification accuracy levels of the color images were higher than those of the gray images—99.00% and 97.58%, respectively, for the color images and 97.83% and 96.58%, respectively, for the gray images.
3.3. A Comparison between DCNN and Traditional Machine Learning
We compared DCNN with the traditional machine learning method (GBDT) previously published by our team using the same dataset as them [9]. The test confusion matrix is shown in Table 3. Most of the data were correctly classified, with only a small part misclassified. The accuracy comparison between ResNet50 and GBDT, as seen in Table 4, demonstrated that ResNet50 can achieve a high accuracy level that is significantly greater than that of GBDT. The color image accuracy levels of drought stress identification (DI) and drought stress classification (DC) reached up to 98% and 91%, higher than those of GBDT—7.61% and 10.05%, respectively. Gray images also achieved better accuracy. The accuracy levels of drought stress identification (DI) and drought stress classification (DC) reached up to 93% and 88%, respectively, which was obviously higher than those of the GBDT model. Meanwhile, from the point of view of time, it was also time-saving to use ResNet50 transfer learning to identify and classify maize drought. When training 100 epochs, the color images and gray images only took about six seconds to complete this process.
4. Discussion
4.1. Extraction of the Phenotypic Characteristics of Maize by DCNN
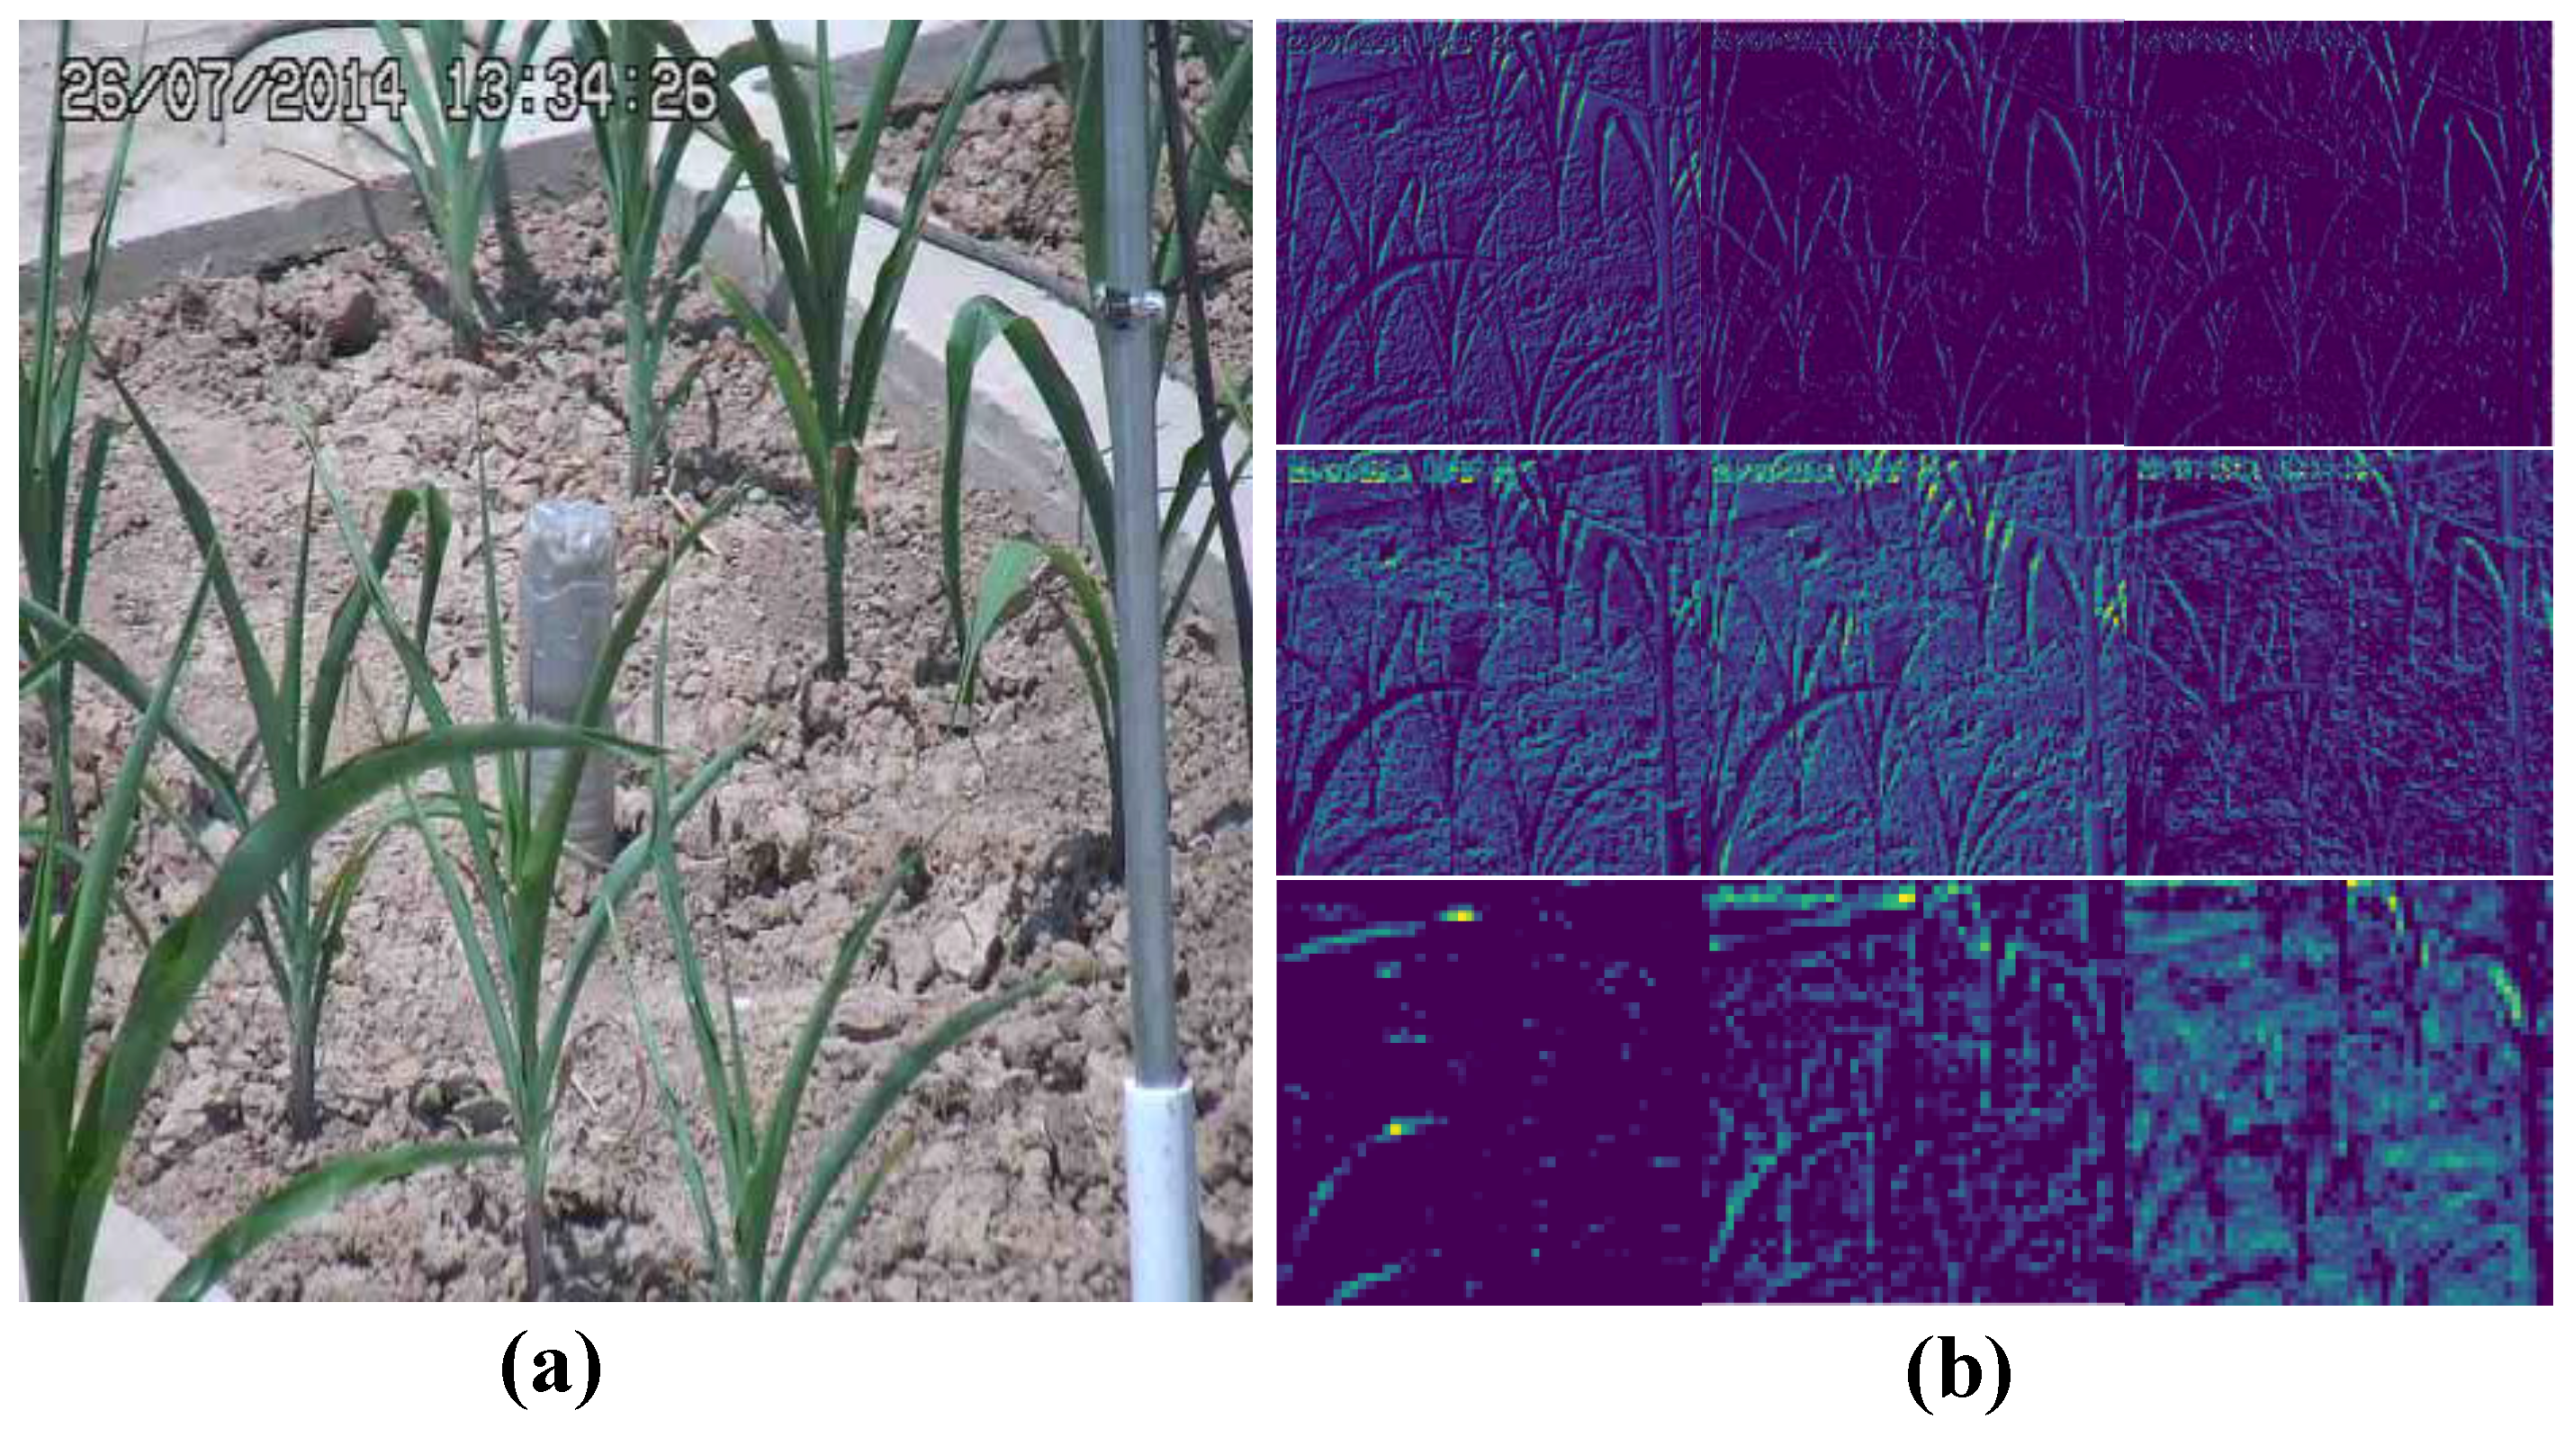
Maize crops are sensitive to drought stress. Plants have developed several physiological mechanisms to mitigate the impact of drought stress and display a series of drought phenotypes [11,31]. The identification of maize drought by phenotypic characteristics occurs in real-time and is accurate, and rapid. Generally, traditional machine learning and deep learning are common methods for crop stress identification [12,22,32]. The difference between them is the use of the feature extraction method. Traditional machine learning needs to segment the target image and extract features manually, while DCNN automatically extracts image features by convolution layers [19]. In this study, we used the transfer learning method of DCNN to identify and classify maize drought stress. The results showed that DCNN had a good effect on the identification and classification of maize drought stress. In the dataset as a whole, the identification and classification accuracy levels of the model for wheat color images were 98.14% and 95.95%, respectively. High accuracy was also achieved on the sub-datasets of the seedling and jointing stages and the accuracy levels of identification and classification were significantly higher than those of the traditional machine learning method (GBDT) on the same dataset [9]. These results are in agreement with those previously reported by other stress studies based on deep learning [26,33,34], likely because traditional machine learning extracts maize phenotypic features manually, and only extracts color and texture features, leading to incomplete extraction of phenotypic features. The phenotypic characteristics of maize under drought stress are complex. In addition to color and texture, morphological characteristics, such as leaf rolling and plant height, play an important role in drought stress identification [10]. DCNN can extract more effective information through the use of many convolution layers. Thus, DCNN obtained a high level of accuracy in identifying and classifying maize drought stress—significantly higher than that of traditional machine learning. In recent years, there has been an increasing number of studies on biotic and abiotic stress recognition by deep learning [22]. Juncheng et al. reported four cucumber leaf diseases that were identified by DCNN and indicated that DCNN achieves high recognition accuracy that was significantly higher than that obtained by the random forest and support vector machine methods [35]. Balaji et al. also revealed that the recognition accuracy of the deep learning method was higher than that of traditional machine learning based on color, texture, and morphology [23]. In our study, maize images were captured from fields. The background of the maize images was complex and included features such as soil, weeds, and other sundries, which were also influenced by the wind, light, and shadows [36]. Thus, accurate segmentation of the field maize images was difficult. Under drought stress, there were some abstract phenotypic characteristics such as leaf rolling and leaf inclination [10], which are important phenotypic characteristics of drought stress in maize; however, the effective and complete segmentation and extraction of this information manually remains a challenge [19,37]. DCNN extracts image features through continuous convolution layers and therefore can extract the phenotypic characteristics of the images comprehensively [38]. In general, the color, texture, and edge characteristic information of images is mainly extracted from the convolution layer in the shallow layers, and the more abstract phenotypic information is extracted from the deeper convolution layer, which is more intelligent [39]. In our maize drought recognition model, the shallow convolution layer extracts color, edge and morphology information of maize, while the deep convolution layer extracts texture features and more abstract phenotypic features. Although deep abstract phenotypic features are difficult to understand by human beings, they play an important role in the maize drought stress identification (Figure 7b). Meanwhile, it is time-saving to use deep learning. On the total dataset, transfer learning of resnet50 and Resnet152 only took about ten and thirty minutes, respectively. Thus, when the amount of data is sufficient, the identification and classification accuracy of the DCNN method is generally better than that of traditional machine learning. It can not only achieve better results, but also saves time during the image segmentation and data screen steps and reduces the running time of the model.
4.2. Comparison of the Accuracy of Color and Gray Images of Maize at Different Stages
In this study, we compared the accuracy levels of drought stress identification and classification of maize color and gray images. In the whole datasets, the drought stress identification and classification accuracy levels were higher in the color images than in the gray images. This is most likely because color information is one of the important characteristics of drought stress [40,41]. After graying, the color information of the image is lost, which makes the model more likely to be confused. Mohanty et al. also found that the accuracy of the color image was higher than that of the gray image in all of the experiments during biotic stress identification [42]. For drought stress, color information is an important indicator. Under optimum moisture conditions, the phenotypic characteristics of maize leaves did not change, so the leaf color was always green. However, under drought stress, the color and morphology of maize leaves changed. Under light drought stress, the growth of maize was relatively slow, the color of maize leaves lost luster at noon, and the leaves were slightly rolled; under moderate drought stress, the plants grew slowly and dwarfed, and the maize lost its luster and leaves rolled; however, it was basically restored to normal in the evening. For different levels of drought stress, the recovery time of the leaves differed during the day [10]. When the color image of maize was transformed into a gray image, the color information was lost; thus, the accuracy of gray image identification and classification was lower than that of color images.
4.3. Misclassified Image Analysis
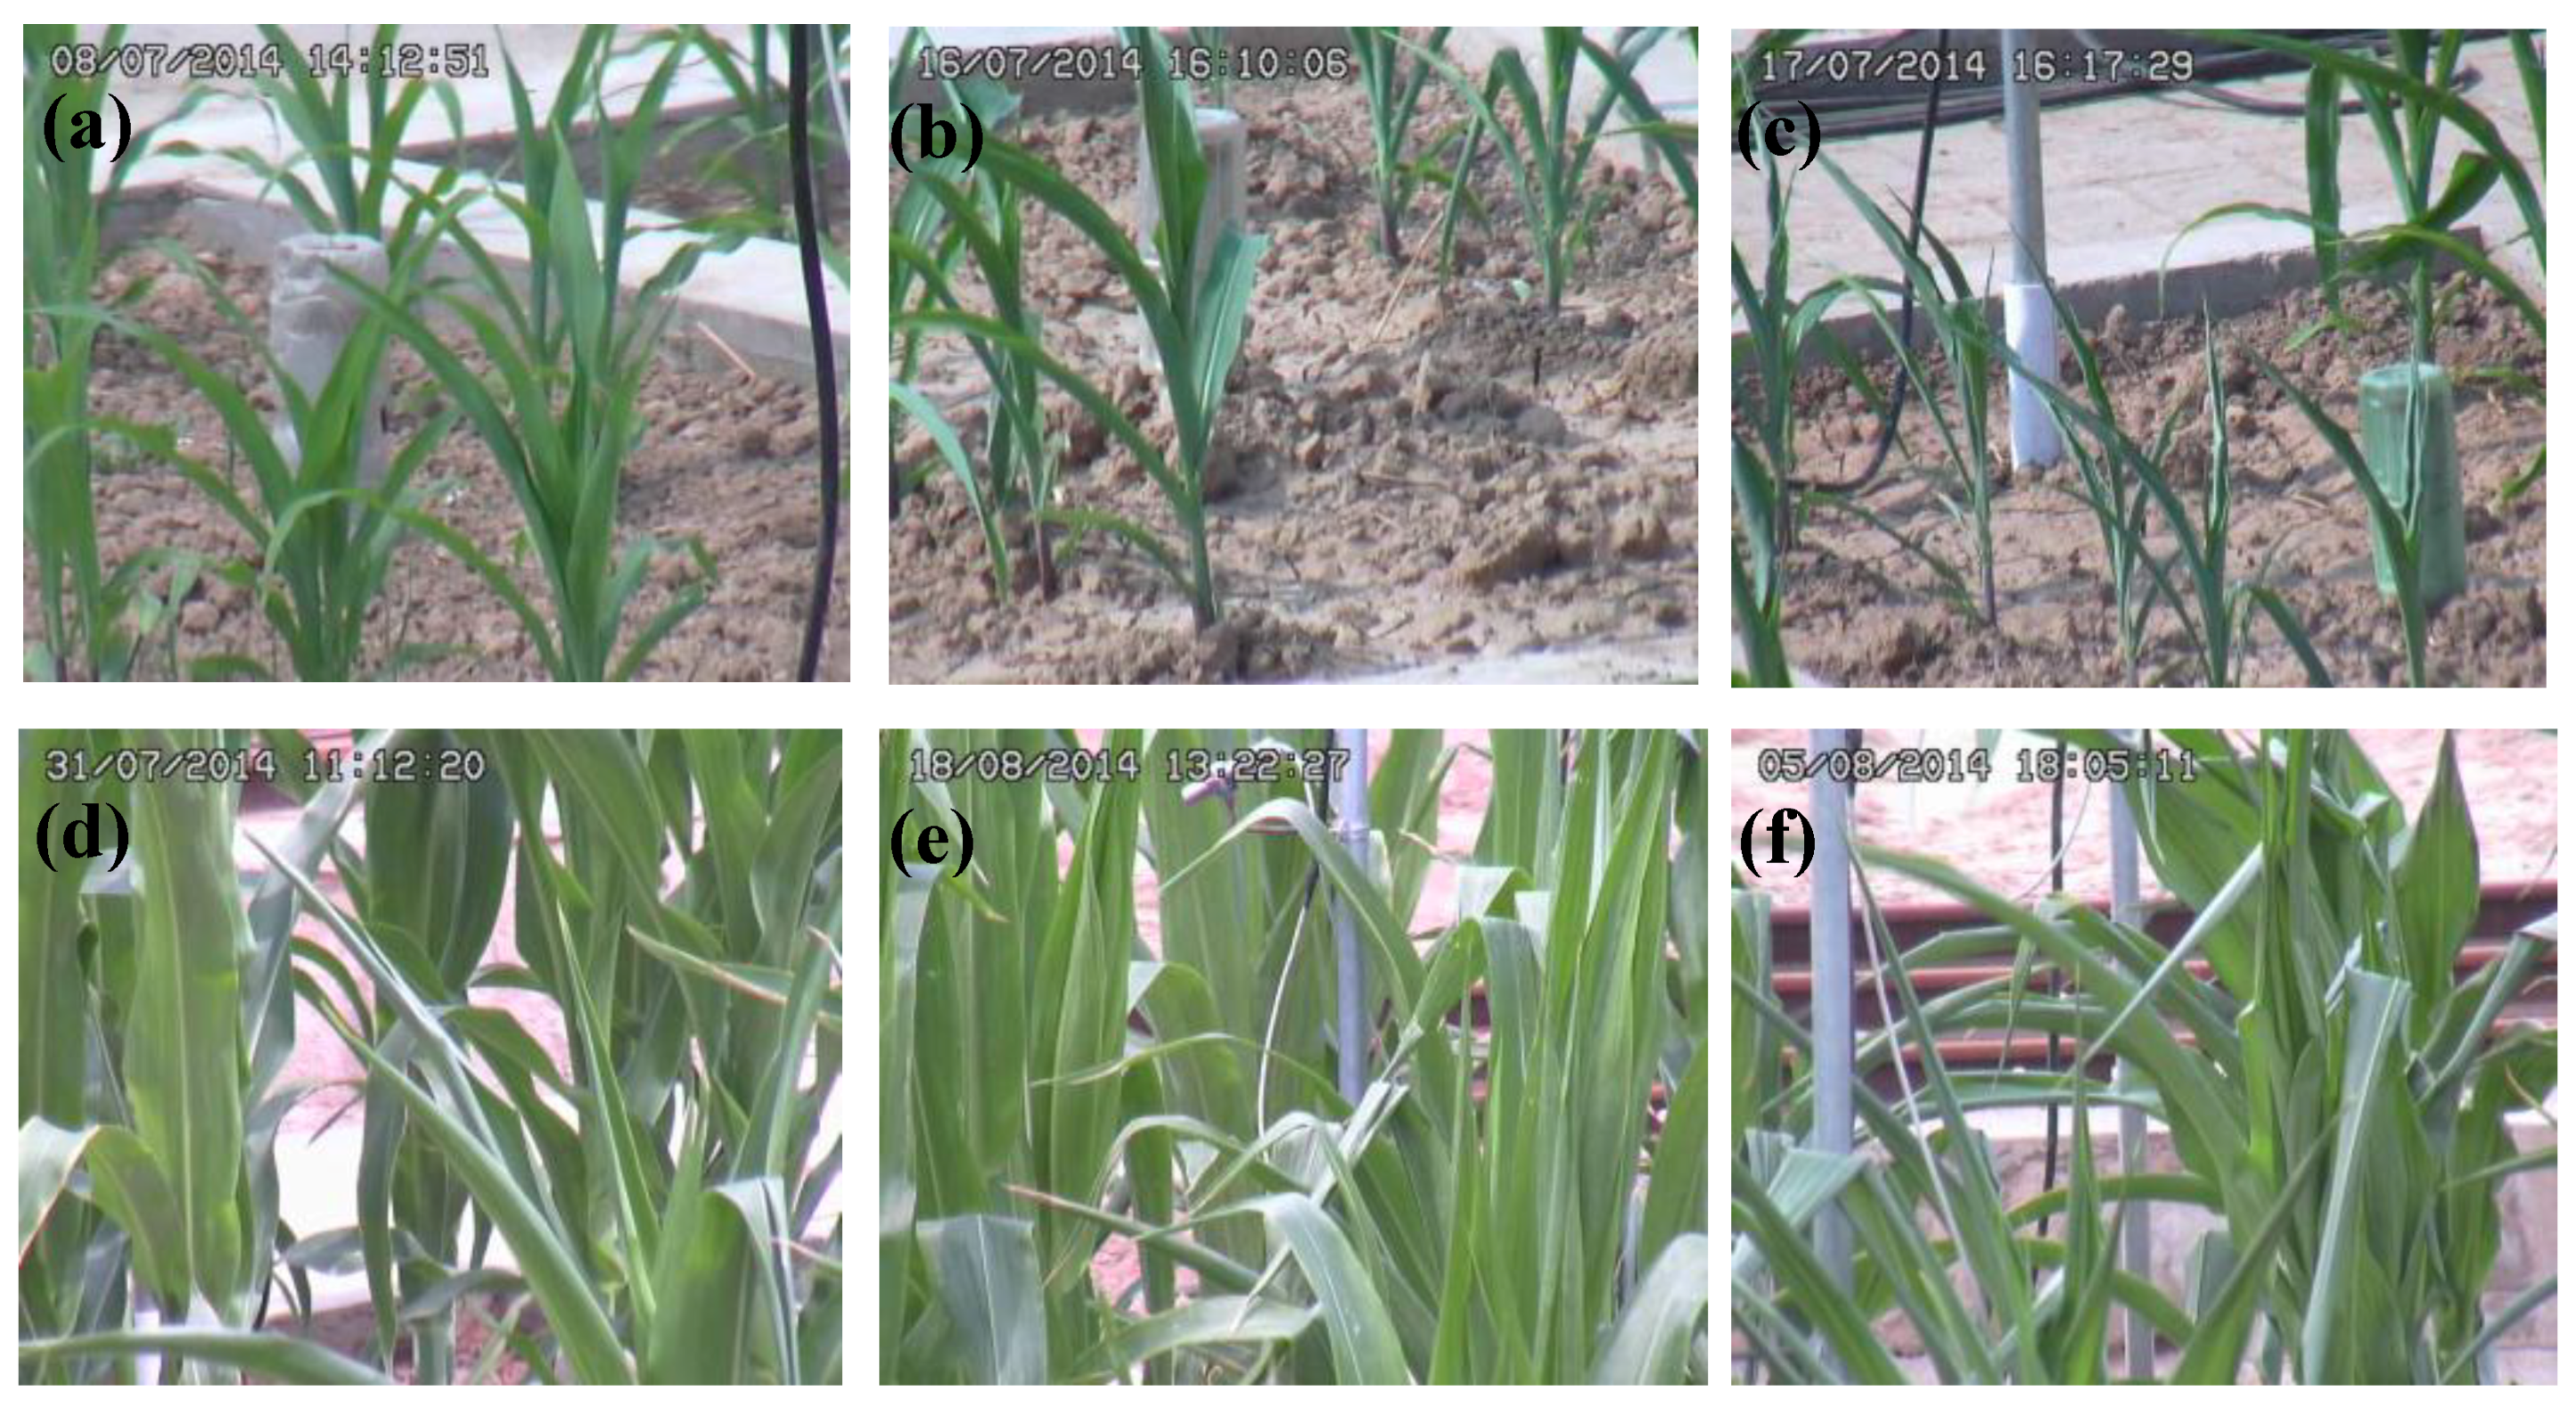
In this study, we analyzed the misclassification images and a portion of the misclassified samples is shown in Figure 8. Figure 8a–c are seedling maize samples, where Figure 8a shows the optimum moisture misclassified as light drought stress samples, Figure 8b shows light drought stress misclassified as optimum moisture samples, and Figure 8c shows the moderate drought stress misclassified as light drought stress samples. Figure 8d–f show the jointing stage maize samples, where Figure 8d is the optimum moisture misclassified as light drought stress samples, and Figure 8e,f show the moderate drought stress misclassified as light drought stress. Analysis of the misclassified images showed that although each maize image sample had a defined drought stress level label, there were different drought stress maize plants and different phenotypic characteristics in a single image. For example, in the same image, some leaves were rolled and others were not. This led to incorrect classification of the samples, likely due to the uneven distribution of soil moisture, although the drought level of each plot was the same for each 2 m2 plot with a total of 12 maize plants. Soil moisture distribution in the same plot was uneven due to the inaccuracy of water supply and the different evaporation capacity at different locations. Maize plants are sensitive to drought stress, and the drought degree of maize plants in different locations in the same plot may be different, leading to different phenotypic characteristics in terms of leaf color, texture, and morphology, which can result in incorrect model classification. In addition, as a maize plant has many leaves, under light drought stress, the new leaves of maize are prone to rolling, while the old leaves remain stretched. Therefore, obtaining only part of the corn image may also lead to model identification and classification errors.
We acknowledge that the amount of data we acquired was relatively small for the deep learning model, and we did not design and train our own models. However, this did not affect the identification and classification accuracy of drought stress in maize by DCNN. In general, when datasets were small, the transfer learning method not only achieved good results, but also saved time and was effective in the field of image classification. Transfer learning is not very strict in terms of data volume and hardware requirements and has good applicability. In addition, although a few maize images were misclassified due to the uneven distribution of soil moisture, this had little effect on maize drought identification and classification.
5. Conclusions
We proposed a novel end-to-end automated pipeline for drought stress classification in maize based on digital images. DCNN had a good effect on the identification and classification of maize drought stress, and it is feasible to identify drought stress by transfer learning in the case of small datasets and a field environment. Our method does not require segmentation, regardless of the background, so it saves a lot of time. In the dataset as a whole, the accuracy levels of identification and classification of drought stress were 98.14% and 95.95%, respectively. High accuracy was also achieved on the sub-datasets of the seedling and jointing stages. When the datasets are limited in the research of maize drought identification, transfer learning is a good choice. Through a comparison of the tests between DCNN and traditional machine learning on the same dataset, we concluded that the DCNN method is significantly better than the traditional machine learning method. Through the comparison of different types of images, the accuracy levels of the identification and classification of maize color images were higher than those of the gray images, as color information is one of the important phenotypic characteristics of drought stress.
It is suggested that the DCNN method not only saves time, but also obtains high accuracy in maize drought identification and classification. Based on digital images, the detection of crop water stress using the DCNN method could be applied to a complex field environment. Future research will focus on more degrees of drought classification assessment, which is an intensified process on the soil water content and is more accurate when identifying and classifying maize drought stress according to the degree of rolling and the time of leaf rolling and stretching. Furthermore, a trained model based on digital image, developed into an app, installed on mobile devices (unmanned aerial vehicles, smart phones, etc.), is proposed to provide real-time, accurate and wide-ranging monitoring and warning of maize drought stress.
Author Contributions
Conceptualization, M.L. and J.A.; Methodology, M.L.; Software, W.L. and J.A.; Formal Analysis, J.A. and S.C.; Writing—Original Draft Preparation, J.A.; Writing—Review and Editing, J.A. and W.L.; Supervision, M.L.; Project Administration, M.L.; Funding Acquisition, M.L.
Funding
This work was funded by Projects in National Science Technology Pillar Program during the Twelfth Five-year Plan Period (2012BAD20B01) and National Natural Science Foundation of China (No. 61771471).
Conflicts of Interest
No conflicts of interest exist in the submission of this manuscript and the manuscript has been approved by all authors for publication.
References
- Sun, Q.; Liang, X.L.; Zhang, D.G.; Li, X.H.; Hao, Z.F.; Weng, J.F.; Li, M.S.; Zhang, S.H. Trends in drought tolerance in Chinese maize cultivars from the 1950s to the 2000s. Field Crops Res. 2017, 201, 175–183. [Google Scholar] [CrossRef]
- Anwar, S.; Iqbal, M.; Akram, H.M.; Niaz, M.; Rasheed, R. Influence of Drought Applied at Different Growth Stages on Kernel Yield and Quality in Maize (Zea Mays L.). Commun. Soil Sci. Plant Anal. 2016, 47, 2225–2232. [Google Scholar] [CrossRef]
- Jiang, P.; Cai, F.; Zhao, Z.-Q.; Meng, Y.; Gao, L.-Y.; Zhao, T.-H. Physiological and Dry Matter Characteristics of Spring Maize in Northeast China under Drought Stress. Water 2018, 10, 1561. [Google Scholar] [CrossRef]
- Comas, L.H.; Trout, T.J.; DeJonge, K.C.; Zhang, H.; Gleason, S.M. Water productivity under strategic growth stage-based deficit irrigation in maize. Agric. Water Manag. 2019, 212, 433–440. [Google Scholar] [CrossRef]
- Zhao, H.; Xu, Z.; Zhao, J.; Huang, W. A drought rarity and evapotranspiration-based index as a suitable agricultural drought indicator. Ecol. Indic. 2017, 82, 530–538. [Google Scholar] [CrossRef]
- Jones, H.G. Irrigation scheduling: Advantages and pitfalls of plant-based methods. J. Exp. Bot. 2004, 55, 2427–2436. [Google Scholar] [CrossRef] [PubMed]
- Mangus, D.L.; Sharda, A.; Zhang, N. Development and evaluation of thermal infrared imaging system for high spatial and temporal resolution crop water stress monitoring of corn within a greenhouse. Comput. Electron. Agric. 2016, 121, 149–159. [Google Scholar] [CrossRef]
- Prive, J.P.; Janes, D. Evaluation of plant and soil moisture sensors for the detection of drought stress in raspberry. In Environmental Stress and Horticulture Crops; Tanino, K., Arora, R., Graves, B., Griffith, M., Gusta, L.V., Junttila, O., Palta, J., Wisniewski, M., Eds.; International Society Horticultural Science: Leuven, Belgium, 2003; pp. 391–396. [Google Scholar]
- Zhuang, S.; Wang, P.; Jiang, B.; Li, M.S.; Gong, Z.H. Early detection of water stress in maize based on digital images. Comput. Electron. Agric. 2017, 140, 461–468. [Google Scholar] [CrossRef]
- Baret, F.; Madec, S.; Irfan, K.; Lopez, J.; Comar, A.; Hemmerle, M.; Dutartre, D.; Praud, S.; Tixier, M.H. Leaf-rolling in maize crops: From leaf scoring to canopy-level measurements for phenotyping. J. Exp. Bot. 2018, 69, 2705–2716. [Google Scholar] [CrossRef]
- Avramova, V.; Nagel, K.A.; AbdElgawad, H.; Bustos, D.; DuPlessis, M.; Fiorani, F.; Beemster, G.T. Screening for drought tolerance of maize hybrids by multi-scale analysis of root and shoot traits at the seedling stage. J. Exp. Bot. 2016, 67, 2453–2466. [Google Scholar] [CrossRef] [Green Version]
- Singh, A.; Ganapathysubramanian, B.; Singh, A.K.; Sarkar, S. Machine Learning for High-Throughput Stress Phenotyping in Plants. Trends Plant Sci. 2016, 21, 110–124. [Google Scholar] [CrossRef] [Green Version]
- Naik, H.S.; Zhang, J.; Lofquist, A.; Assefa, T.; Sarkar, S.; Ackerman, D.; Singh, A.; Singh, A.K.; Ganapathysubramanian, B. A real-time phenotyping framework using machine learning for plant stress severity rating in soybean. Plant Methods 2017, 13, 23. [Google Scholar] [CrossRef] [PubMed]
- Chemura, A.; Mutanga, O.; Sibanda, M.; Chidoko, P. Machine learning prediction of coffee rust severity on leaves using spectroradiometer data. Trop. Plant Pathol. 2017, 43, 117–127. [Google Scholar] [CrossRef]
- Huang, K.-Y. Application of artificial neural network for detecting Phalaenopsis seedling diseases using color and texture features. Comput. Electron. Agric. 2007, 57, 3–11. [Google Scholar] [CrossRef]
- Zakaluk, R.; Sri Ranjan, R. Artificial Neural Network Modelling of Leaf Water Potential for Potatoes Using RGB Digital Images: A Greenhouse Study. Potato Res. 2007, 49, 255–272. [Google Scholar] [CrossRef]
- Raza, S.E.; Smith, H.K.; Clarkson, G.J.; Taylor, G.; Thompson, A.J.; Clarkson, J.; Rajpoot, N.M. Automatic detection of regions in spinach canopies responding to soil moisture deficit using combined visible and thermal imagery. PLoS ONE 2014, 9, e97612. [Google Scholar] [CrossRef] [PubMed]
- Liu, B.; Zhang, Y.; He, D.; Li, Y. Identification of Apple Leaf Diseases Based on Deep Convolutional Neural Networks. Symmetry 2017, 10, 11. [Google Scholar] [CrossRef]
- Ubbens, J.R.; Stavness, I. Deep Plant Phenomics: A Deep Learning Platform for Complex Plant Phenotyping Tasks. Front. Plant Sci. 2017, 8, 1190. [Google Scholar] [CrossRef]
- LeCun, Y.; Bengio, Y.; Hinton, G. Deep learning. Nature 2015, 521, 436–444. [Google Scholar] [CrossRef]
- Le Cun, Y.; Boser, B.; Denker, J.; Henderson, D.; Howard, R.E.; Hubbard, W.; Jackel, L. Handwritten Digit Recognition with a Back-Propagation Network. In Advances in Neural Information Processing Systems 2; Morgan Kaufmann Publishers Inc.: San Francisco, CA, USA, 1990; pp. 396–404. [Google Scholar]
- Singh, A.K.; Ganapathysubramanian, B.; Sarkar, S.; Singh, A. Deep Learning for Plant Stress Phenotyping: Trends and Future Perspectives. Trends Plant Sci. 2018, 23, 883–898. [Google Scholar] [CrossRef]
- Veeramani, B.; Raymond, J.W.; Chanda, P. DeepSort: Deep convolutional networks for sorting haploid maize seeds. BMC Bioinform. 2018, 19, 85–93. [Google Scholar] [CrossRef] [PubMed]
- Uzal, L.C.; Grinblat, G.L.; Namías, R.; Larese, M.G.; Bianchi, J.S.; Morandi, E.N.; Granitto, P.M. Seed-per-pod estimation for plant breeding using deep learning. Comput. Electron. Agric. 2018, 150, 196–204. [Google Scholar] [CrossRef]
- Ghosal, S.; Blystone, D.; Singh, A.K.; Ganapathysubramanian, B.; Singh, A.; Sarkar, S. An explainable deep machine vision framework for plant stress phenotyping. Proc. Natl. Acad. Sci. USA 2018, 15, 4613–4618. [Google Scholar] [CrossRef]
- Ferentinos, K.P. Deep learning models for plant disease detection and diagnosis. Comput. Electron. Agric. 2018, 145, 311–318. [Google Scholar] [CrossRef]
- Donahue, J.; Jia, Y.; Vinyals, O.; Hoffman, J.; Zhang, N.; Tzeng, E.; Darrell, T. DeCAF: A Deep Convolutional Activation Feature for Generic Visual Recognition. In Proceedings of the International Conference on International Conference on Machine Learning, Beijing, China, 21–26 June 2014; p. I-647. [Google Scholar]
- Li, E.; Chen, Y.; Li, X.; Li, M. Technical Specification for Field Investigation and Classification of Maize Disaster. Industry Standard Agriculture. 2012. Available online: https://www.docin.com/p-1635041785.html (accessed on 16 February 2019).
- Nivin, T.W.; Scott, G.J.; Davis, C.H.; Marcum, R.A. Rapid broad area search and detection of Chinese surface-to-air missile sites using deep convolutional neural networks. J. Appl. Remote Sens. 2017, 11, 042614. [Google Scholar]
- He, K.M.; Zhang, X.Y.; Ren, S.Q.; Sun, J. Deep Residual Learning for Image Recognition. In Proceedings of the 2016 IEEE Conference on Computer Vision and Pattern Recognition (CPVR), Las Vegas, NV, USA, 26 June–1 July 2016; pp. 770–778. [Google Scholar]
- Masuka, B.; Araus, J.L.; Das, B.; Sonder, K.; Cairns, J.E. Phenotyping for abiotic stress tolerance in maize. J. Integr. Plant Biol. 2012, 54, 238–249. [Google Scholar] [CrossRef] [PubMed]
- Behmann, J.; Mahlein, A.-K.; Rumpf, T.; Römer, C.; Plümer, L. A review of advanced machine learning methods for the detection of biotic stress in precision crop protection. Precis. Agric. 2014, 16, 239–260. [Google Scholar] [CrossRef]
- Hasan, M.M.; Chopin, J.P.; Laga, H.; Miklavcic, S.J. Detection and analysis of wheat spikes using Convolutional Neural Networks. Plant Methods 2018, 14, 100. [Google Scholar] [CrossRef]
- Yalcin, H. Phenology Recognition using Deep Learning. In Proceedings of the International Conference on Agro-Geoinformatics, Fairfax, VA, USA, 7–10 August 2017; pp. 1–5. [Google Scholar]
- Ma, J.; Du, K.; Zheng, F.; Zhang, L.; Gong, Z.; Sun, Z. A recognition method for cucumber diseases using leaf symptom images based on deep convolutional neural network. Comput. Electron. Agric. 2018, 154, 18–24. [Google Scholar] [CrossRef]
- Li, L.; Zhang, Q.; Huang, D. A review of imaging techniques for plant phenotyping. Sensors 2014, 14, 20078–20111. [Google Scholar] [CrossRef]
- Xiong, X.; Duan, L.; Liu, L.; Tu, H.; Yang, P.; Wu, D.; Chen, G.; Xiong, L.; Yang, W.; Liu, Q. Panicle-SEG: A robust image segmentation method for rice panicles in the field based on deep learning and superpixel optimization. Plant Methods 2017, 13, 104. [Google Scholar] [CrossRef] [PubMed]
- Koushik, J. Understanding Convolutional Neural Networks. 2016. Available online: https://arxiv.org/pdf/1605.09081.pdf (accessed on 16 February 2019).
- Fergus, M.D.Z.R. Visualizing and Understanding Convolutional Networks. arXiv, 2013; arXiv:1311.2901. [Google Scholar]
- Jiang, B.; Wang, P.; Zhuang, S.; Li, M.; Li, Z.; Gong, Z. Detection of maize drought based on texture and morphological features. Comput. Electron. Agric. 2018, 151, 50–60. [Google Scholar] [CrossRef]
- Han, W.; Sun, Y.; Xu, T.; Chen, X.; Su Ki, O. Detecting maize leaf water status by using digital RGB images. Int. J. Agric. Biol. Eng. 2014, 7, 45–53. [Google Scholar]
- Mohanty, S.P.; Hughes, D.P.; Salathe, M. Using Deep Learning for Image-Based Plant Disease Detection. Front. Plant Sci. 2016, 7, 1419. [Google Scholar] [CrossRef] [PubMed]
Figure 1.
The general situation of the test area.

Figure 2.
Examples of the two stages (seedling and jointing) of maize drought under the three treatments. (a–c) are the optimum moisture, light drought, and moderate drought maize color samples in the seedling stage, respectively; (d–f) are the corresponding gray images; (g–i) are the optimum moisture, light drought, and moderate drought maize color samples at the jointing stage, respectively; (j–l) are the corresponding gray images.

Figure 3.
Schematic of the proposed method.

Figure 4.
Changes in cross entropy of color images: (a) total dataset; (b) seedling stage dataset; (c) jointing stage dataset.
Figure 4.
Changes in cross entropy of color images: (a) total dataset; (b) seedling stage dataset; (c) jointing stage dataset.

Figure 5.
Confusion matrix ResNet50. (a–c) are the color images of the total, seedling, and jointing stage datasets; (d–f) are the gray images of the total, seedling stage, and jointing datasets.
Figure 5.
Confusion matrix ResNet50. (a–c) are the color images of the total, seedling, and jointing stage datasets; (d–f) are the gray images of the total, seedling stage, and jointing datasets.

Figure 6.
The accuracy of drought identification (DI) and drought classification (DC): (a) total dataset; (b) seedling stage dataset; (c) jointing stage dataset.
Figure 6.
The accuracy of drought identification (DI) and drought classification (DC): (a) total dataset; (b) seedling stage dataset; (c) jointing stage dataset.

Figure 7.
Visualization of the feature map in the initial layers of the deep learning model. (a) is the original image; (b) is the visualization image, where the first row is part of feature maps of the first convolutional layer, the second row is part of feature maps of the second convolutional layer, and the third row is part of feature maps of the third convolutional layer.

Figure 8.
Misclassified samples: (a) optimum moisture misclassified as light drought stress samples, (b) light drought stress misclassified as optimum moisture samples, (c) moderate drought stress misclassified as light drought stress samples. (d–f) jointing stage maize samples. (d) optimum moisture misclassified as a light drought stress sample, (e,f) moderate drought stress misclassified as a light drought stress sample.


Table 1.
The number of maize images.
| Stage | Treatment | Repeat | Total | ||
|---|---|---|---|---|---|
| A | B | C | |||
| Seedling (n 1 = 1710) | Optimum moisture | 197 | 187 | 188 | 572 |
| Light drought | 196 | 187 | 186 | 569 | |
| Moderate drought | 195 | 188 | 186 | 569 | |
| Jointing (n 1 = 1751) | Optimum moisture | 195 | 194 | 194 | 583 |
| Light drought | 198 | 195 | 196 | 589 | |
| Moderate drought | 195 | 190 | 194 | 579 | |
1 n represent the total number of maize images.
Table 2.
Comparison of the accuracy and training times of the different models.
| Stage | Image Type | Training Mode | ResNet50 | ResNet152 | ||
|---|---|---|---|---|---|---|
| Time (m) | Accuracy (%) | Time (m) | Accuracy (%) | |||
| Seedling | Color | TL 1 | 7.59 | 98.23 ± 0.03 | 19.48 | 98.17 ± 0.14 |
| TFS 2 | 16.35 | 95.67 ± 0.52 | 41.47 | 96.00 ± 0.25 | ||
| Gray | TL | 7.58 | 96.58 ± 0.38 | 20.32 | 96.50 ± 0.43 | |
| TFS | 16.54 | 91.33 ± 1.38 | 42.15 | 93.67 ± 0.14 | ||
| Jointing | Color | TL | 7.58 | 97.58 ± 0.14 | 19.09 | 97.75 ± 0.25 |
| TFS | 16.16 | 95.67 ± 1.01 | 43.48 | 95.08 ± 0.63 | ||
| Gray | TL | 7.40 | 96.58 ± 0.14 | 19.50 | 96.58 ± 0.29 | |
| TFS | 16.16 | 93.25 ± 1.39 | 41.20 | 94.00 ± 0.66 | ||
| Total | Color | TL | 11.28 | 96.00 ± 0.50 | 27.10 | 95.09 ± 0.30 |
| TFS | 23.55 | 95.99 ± 1.00 | 48.48 | 94.85 ± 1.31 | ||
| Gray | TL | 10.42 | 94.95 ± 0.17 | 30.10 | 93.42 ± 0.25 | |
| TFS | 23.35 | 91.33 ± 0.50 | 57.18 | 92.04 ± 1.46 | ||
1 TL means transfer learning; 2 TFS means train from scratch; m stands for minutes.
Table 3.
Confusion matrix of the two types of image. OM: optimum moisture, LD: light drought stress, and MD: moderate drought stress.
Table 3.
Confusion matrix of the two types of image. OM: optimum moisture, LD: light drought stress, and MD: moderate drought stress.
| Treatment | Color Image | Gray Image | ||||
|---|---|---|---|---|---|---|
| OM | LD | MD | OM | LD | MD | |
| OM | 30 | 1 | 2 | 30 | 1 | 0 |
| LD | 1 | 29 | 0 | 5 | 25 | 0 |
| MD | 0 | 7 | 32 | 1 | 5 | 33 |
Table 4.
Comparison between the DCNN model ResNet50 and the traditional machine learning model (Gradient Boosting Decision Tree GBDT).
Table 4.
Comparison between the DCNN model ResNet50 and the traditional machine learning model (Gradient Boosting Decision Tree GBDT).
| Model | GBDT | ResNet50 | |
|---|---|---|---|
| Color Image | Gray Image | ||
| DI (%) | 90.39 | 98.00 | 93.00 |
| DC (%) | 80.95 | 91.00 | 88.00 |
| Time (s) | - | 6 | 6 |
© 2019 by the authors. Licensee MDPI, Basel, Switzerland. This article is an open access article distributed under the terms and conditions of the Creative Commons Attribution (CC BY) license (http://creativecommons.org/licenses/by/4.0/).
Share and Cite
MDPI and ACS Style
An, J.; Li, W.; Li, M.; Cui, S.; Yue, H. Identification and Classification of Maize Drought Stress Using Deep Convolutional Neural Network. Symmetry 2019, 11, 256. https://0-doi-org.brum.beds.ac.uk/10.3390/sym11020256
AMA Style
An J, Li W, Li M, Cui S, Yue H. Identification and Classification of Maize Drought Stress Using Deep Convolutional Neural Network. Symmetry. 2019; 11(2):256. https://0-doi-org.brum.beds.ac.uk/10.3390/sym11020256
Chicago/Turabian StyleAn, Jiangyong, Wanyi Li, Maosong Li, Sanrong Cui, and Huanran Yue. 2019. "Identification and Classification of Maize Drought Stress Using Deep Convolutional Neural Network" Symmetry 11, no. 2: 256. https://0-doi-org.brum.beds.ac.uk/10.3390/sym11020256
Note that from the first issue of 2016, this journal uses article numbers instead of page numbers. See further details here.