A Three-Stage method for Data Text Mining: Using UGC in Business Intelligence Analysis


1
Department of Business Economics, Faculty of Social Sciences and Law, Rey Juan Carlos University, Paseo Artilleros s/n, 28032 Madrid, Spain
2
Ehrenberg Centre for Research in Marketing, London South Bank University, 103 Borough Rd., London SE1 0AA, UK
*
Author to whom correspondence should be addressed.
Symmetry 2019, 11(4), 519; https://0-doi-org.brum.beds.ac.uk/10.3390/sym11040519
Submission received: 6 March 2019
/
Revised: 4 April 2019
/
Accepted: 8 April 2019
/
Published: 10 April 2019
Abstract
:The global development of the Internet, which has enabled the analysis of large amounts of data and the services linked to their use, has led companies to modify their business strategies in search of new ways to increase marketing productivity and profitability. Many strategies are based on business intelligence (BI) and marketing intelligence (MI) that make it possible to extract profitable knowledge and insights from large amounts of data generated by company customers in digital environments. In this context, the present study proposes a three-step research methodology based on data text mining (DTM). In further research, this methodology can be used for business intelligence analysis (BIA) strategies to analyze user generated content (UGC) in social networks and on digital platforms. The proposed methodology unfolds in the following three stages. First, a Latent Dirichlet Allocation (LDA) model that determines the database topic is used. Second, a sentiment analysis (SA) is proposed. This SA is applied to the LDA results to divide the topics identified in the sample into three sentiments. Thirdly, textual analysis (TA) with data text mining techniques is applied on the topics in each sentiment. The proposed methodology offers important advances in data text mining in terms of accuracy, reliability and insight generation for both researchers and practitioners seeking to improve the BIA processes in business and other sectors.
1. Introduction
In recent years, the development of new technologies has consolidated different business models based on the Internet. Accordingly, companies have adapted their strategies to this new digital ecosystem by developing and enhancing their capabilities in information and knowledge extraction. In a world where quintillions of bytes of data are produced every day, business intelligence analysis (BIA) and marketing intelligence (MI) have become key tools to extract knowledge from the vast sea of data [1], to understand the business environment and formulate effective strategy.
In parallel to the development of different business models, the use of social networks and the Internet have become habits for consumers to the point that there are millions of devices connected to the Internet that are constantly generating new data. According to a recent estimate, 80% of the world’s data are unstructured and not organized [1]. Most of these data are textual, such as emails, support tickets, forums, social media, reviews, online comments, blogs, articles, online files, and documents. Normally, accessing and analyzing these databases is imprecise, expensive and time-consuming. [1,2]
Furthermore, as the use of these technologies has become habitual for users, it has also become commonplace for users to share information about individual experiences and opinions, as well as content related to the interests of users and companies via social networks. In looking at these types of data sources, several studies have analyzed the influence of the application of strategies of business intelligence (BI) on business models [1,2,3]. Likewise, there has been research on the strategies to extract data of user generated content (UGC) in social networks and digital platforms [2,4].
UGC is defined as the content generated by users in social networks and digital platforms. Such content includes comments, opinions, expressions and interactions between users and brands, or any other type of content shared publicly on the Internet that seeks to generate engagement between different profiles. According to Saura et al. [2], UGC can be defined as an online review or comment on an Internet-enabled public profile that describes a user’s experience. The study of this type of content is important in the context of new business models, as it can enable managers to generate meaningful insights into user opinion that may in turn help refine strategic responses or become the basis for further research.
The proliferation of UGC along with the development of analytical technologies such as big data, and data mining or machine learning, have led in turn to numerous data optimization strategies for UGC analysis. The main goal of these analysis strategies is to find or generate key indicators (KIs) that can help companies to make better strategic decisions in the digital environment. Furthermore, since KIs and insights can help determine the importance of variables that affect the development of the business, over the long term, they may help companies to improve their profitability.
In their ongoing quest for better information companies frequently collect data from their customers and users. These data may include demographic, psychographic, behavioral user characteristics, as well as to user habits and lifestyles. Until now, however, no generally accepted and verified research methodology has emerged to tackle the challenges of unstructured UGC. The central proposition of the present study is to demonstrate that unstructured information can be readily transformed into structured UGC data.
Over the past decade several methodologies based on approximations to perform data analysis and obtain variables related to BI have been proposed [2,5,6], but in the present study a new three-stage methodological approach that covers a gap in previous research is laid out. In this new approach our first objective is to identify KIs and insights from large amounts of UGC data using three well defined discrete approaches (Latent Dirichlet Allocation (LDA), sentiment analysis (SA) and textual analysis (TA)). Our second objective is to describe the process in a comprehensible way so that the proposed approach can be meaningfully used in further research.
The remainder of this paper is structured as follows. In Section 2, we provide a review of literature. This is followed by a detailed discussion of the three methods that underlie our approach (Section 3). In Section 4, we discuss the weaknesses and advantages presented by this new methodological approach for both academics and practitioners. Finally, conclusions are drawn in Section 5.
2. Literature Review
2.1. Latent Dirichlet Allocation (LDA)
Latent Dirichlet allocation (LDA) is a model that is used to examine large datasets to determine whether particular data or datasets are similar. LDA is an example of a topic model with which a sample extracted from UGC can be divided into different topics. LDA was initially proposed by Pritchard and Stephens [7] as a machine learning technique and was later expanded in use and improved by Blei et al. [4].
In LDA a document is generally seen as a mix of discrete elements or topics, so each document is considered as a set of topics. This approach is similar to latent semantic analysis (pLSA), with the difference being that, in LDA the distribution is assumed to be sparse Dirichlet that is the uncertain quantity in a probability distribution that can be expressed as beliefs prior to gathering evidence [4].
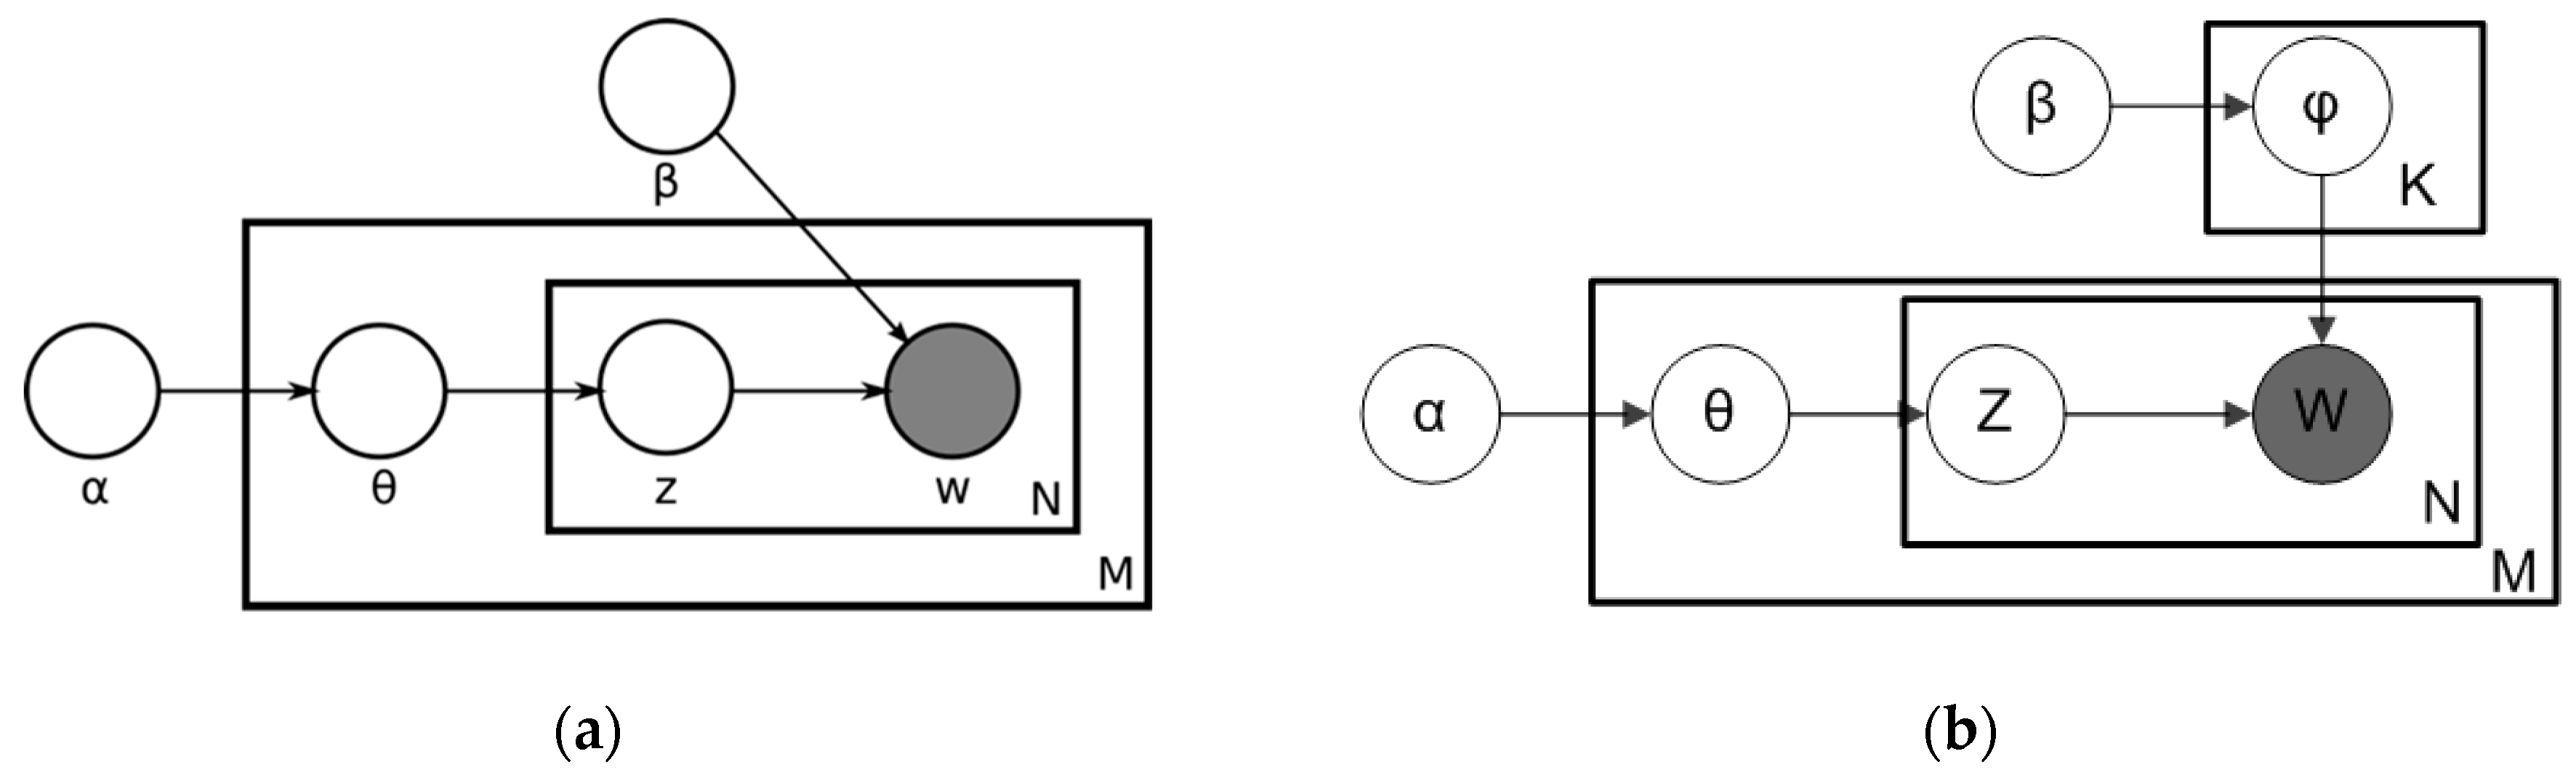
In Figure 1a, α is the parameter of the Dirichlet prior, β is the parameter that is representing the Dirichlet prior on the per-topic word distribution, is the topic distribution for document m, is the word distribution for topic k, represents the topic for each word in the document, and finally m represents the specific word. In Figure 1b, the notation for this model is shown, where k denotes the number of topics, and are V dimensional vectors storing the parameters of the Dirichlet-distributed topic-word distributions [4,7].
The entities represented by and as matrices created to decompose the original documents of the represented matrix that is going to be modeled [4]. In Figure 1b, refers to the number of lines defined by the documents that make up the sample in columns, while φ defines different topics. In this way, , refer to a set of rows or vectors, which are composed of the words that contain the different topics, and refer to the set of rows that define each topic [4,7,8].
2.2. Sentiment Analysis (SA)
Sentiment analysis (SA), or opinion mining (OM) is a field in which systems are designed that try to detect opinions expressed within a piece of text [9]. That is, SA is a process that analyzes the sentiments expressed in a text-based dataset that usually comes from the Internet [10]. SA aims to discover differentiated feedback using varied methodological approaches that focus on polarity, subject, and opinion holder [11]. In previous research, SA has been reported to be able to identify the sentiments about products [2,5,6]. Within SA techniques, text information can be tagged as pertaining to either of two categories: fact or opinion. This classification of information works with sub-classifications that should be solved by machine learning or data text-mining processes. In these processes, on the one hand, phrases or sentences can be classified as expressing certain sentiments; on the other hand, the information can be classified according to the level of polarity [12].
In SA, there are different training approaches used for various application purposes. Specific interfaces can be used to train the algorithms with machine learning processes. In addition, there are techniques based exclusively on artificial intelligence, as well as the design of hybrid models that require both the machine learning technology and the data mining training [2,13].
Concerning polarity, there are different types of SA, as feelings can be categorized into positive, negative or neutral feelings, on the one hand, and into distinct emotions, such as joy, anger or sadness, on the other [2,14]. In addition, several SA approaches have been proposed that are based on the classification of a possible intention (interested or disinterested in something) [3,7].
In general, there are three types of classifications with respect to the way in which a SA can be applied: (1) rule-based approaches, where the analysis of feelings is based on a set of manually created rules; (2) automatic approaches, which rely on the machine learning technology to learn from the data; and (3) hybrid approaches, which combine (1) and (2) above [12,14].
Rule-based approaches are defined by some type of scripting language that identifies subjectivity, polarity, or the subject of an opinion. In such models, there are classifiers within natural language processing (NLP) techniques such as stemming, tokenization, part of speech tagging, parsing, and lexicons. Unlike rule-based approaches, automatic approaches are not based on the manual classification skills of a researcher but are based on machine learning techniques. In this case, the SA is based on the classification algorithm which receives a text as input and returns, as output, the corresponding category that can be further defined according to its characteristics (e.g., positive, negative, happiness, interest, and so forth).
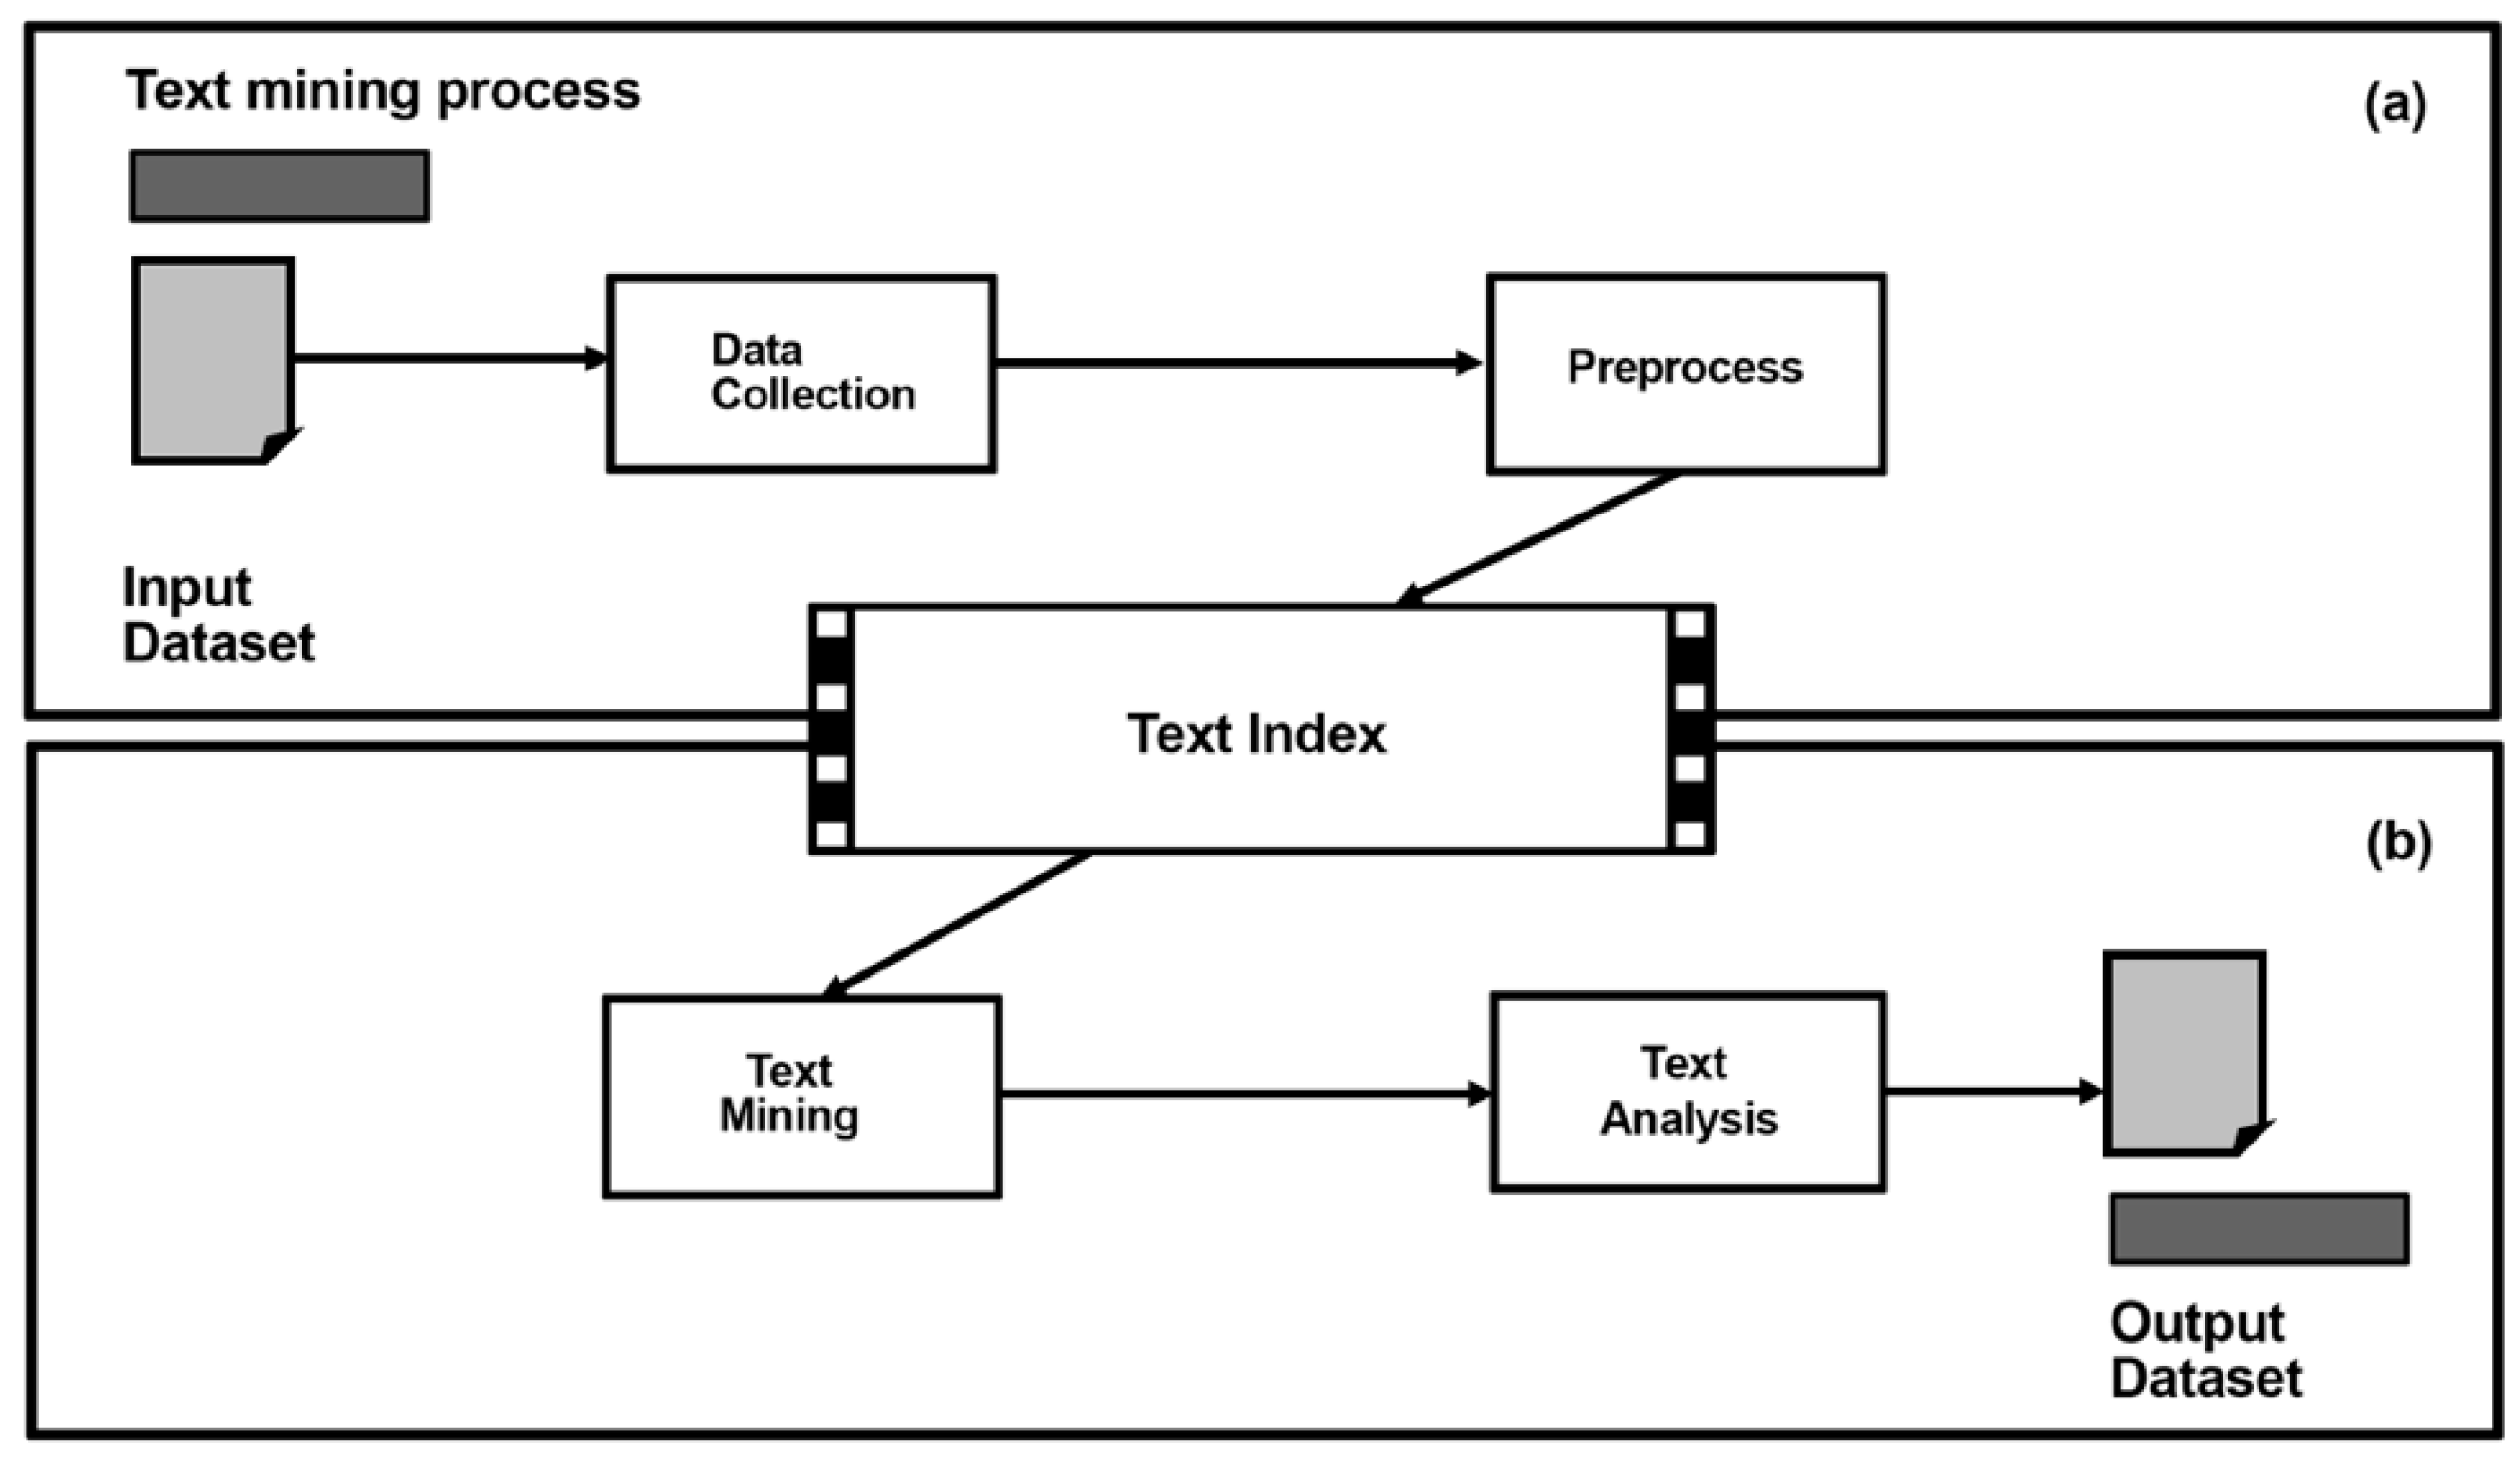
Figure 2 shows the process of development of SA based on machine learning.
Likewise, with regard to the training and prediction processes in SA, the model learns from a specific input trained with data mining to tell the algorithm what the type of output (tag) would be [15]. The feature extractor transfers the text input into a feature vector. The more the algorithm with samples is trained, the greater will be its ability to learn and the higher will be its probability of success [16]. Such models can be based on algorithms that are called support vector machine (SVM) [2].
Feature extraction from text is another approach here. In this case, SA would transform a text into numerical expressions that are usually expressed as vectors using the machine learning processes [17]. This process is called feature extraction or text vectorization and identifies the frequency of each word that is subsequently classified [18].
Finally, there are different types of algorithms to apply SA according to the classification approach of the algorithm. Relevant algorithms include the Naïve Bayes algorithm, where Bayes’ Theorem is used to predict the category of sample text; linear regression, which is an algorithm based on statistics used to predict the value of (Y) in a set of features (X), and support vector machines (SVM), which are non-probabilistic models in which text representations are used as examples classified into different categories. These texts are mapped in different regions of the algorithm that classifies them after the training of the sample [18].
2.3. Textual Analysis (TA)
Textual analysis (TA) is a data text mining (DTM) analysis approach used to identify variables and key indicators in a very large dataset. These variables and indicators are also known in the MI environment as KIs or insights. Therefore, TA is a qualitative process based on such indicators, such as weight and accuracy of words, and is used to identify or discover attitudes and expressions used on a study sample [9].
In this sense, as a DTM technique, TA aims to extract high-quality information from large amounts of data. This information is the result of the analysis and identification of patterns and trends that have a common statistical component in the dataset. Using these techniques, we can structure input text that will be derived in patterns based on structured data that will then become the output. Some approaches widely used text mining include text categorization, entity and clustering extraction, document indexing and summarization, and learning relations between named entities [10].
Therefore, TA can be used to identify the insights with the greatest weight in a given sample and to measure the influence of these KIs on the dataset under study [2]. The techniques of DTM can be used in BI for data analysis, and the results of this analysis can be used by businesses to identify interests and patterns based on text that cannot be identified by human coders. Using TA results, analysts can obtain exploratory results to formulate hypotheses, ask research questions, or make strong statements based on the data. Figure 3 shows the text mining process.
As can be seen in Figure 3, the first step of the text mining process is data collection in which different data are collected or amalgamated to create a dataset. Once the database has been collected, the preprocess step begins in which the data are prepared by applying filters and by purging the repeated or duplicate data so that they can be transformed into structured databases that allow subsequent conclusions to be drawn [19].
Next, in the phase called text index, the collected data are accessed to look for patterns and analyze the KIs that can be easily identified. Sometimes, KIs are categorized and structured according to their characteristics and grouped into nodes or subgroups of categories. In the next step, called text mining, the researcher should be able to make inferences from the data [19]. At this step of the analysis, different techniques are used, such as the application of algorithms and specific software for data analysis. Therefore, while TA is a qualitative approach, it is based on statistical data from the sample, such as the total weight of the patterns that group the nodes or categories of the text, or the times that each group of words are repeated [20].
Finally, in the text analysis phase, based on qualitative or quantitative approaches, the results are interpreted, and exploratory decisions are made. This is an important step because the steps that follow and complete the process should be identified and clearly defined in order to obtain well-structured and reliable KIs and insights [2,19].
3. Methods: The Three-Stage Methodological Process
3.1. Data Sampling
In the proposed methodological approach, the data collection process is particularly important, since the objective is to analyze the UGC data, as well as the engagement that it can generate between companies and users on the Internet to identify reliable KIs and insights. Therefore, we should emphasize that the data can be collected from the application programming interfaces (APIs) of digital platforms such as Twitter, TripAdvisor, Facebook or Google Maps, among others [1,2,6].
In addition, it is important that the data filtering is correctly processed. In this respect it is important to properly implement the proposed process and correctly filter the user-generated content. Appropriate practices include the following: (i) removing the duplicate content; (ii) accessing only public UGC; (iii) collecting the data that can be grouped or classified around a tag or topic, such as companies indexed in a ranking, companies that have won a prize, #hashtags, and so forth [2,5,7,19]. In this way, the dataset will be classified around a defined grouping [14,18]. Depending on the sample size and the study objective, the time horizon of data collection can vary from 1 week to 6 months or more [11,13].
3.2. Topic Identification Using LDA
As indicated above, an LDA model is divided into two well-differentiated steps [2]. In the first, words and their connectors are identified and classified across different documents. In the second step, the distribution of words and phrases across different topics is identified. Subsequently, the main topics discovered in the dataset are classified. [8]. Equation (1) describes how this is done and shows the importance of the hidden and observed variables in the joint distribution [8].
In Equation (2), βi is defined as the distribution of a word in topic i, with total K topics; θd is the percentage of topics in document d, with total D documents; zd is the topic assignment in document d; zdn is the topic assignment for the nth word in document d, with total N words; wd is the identified words for document d; and wd,n is the nth word for each document d. As a result, the topics can be identified using Equation (2) for Gibbs sampling [6]. In the present study, Python LDA 1.0.5 was used [8].
3.3. The Sentiment Analysis Process
After identifying the topics with the LDA model, a Python algorithm can be used (Monkey Learn or other similar online platforms can be used). As mentioned above, this type of SVM algorithm is easy to use and customise. This can be done after the training of machine learning with the data-mining processes subdividing the sample into three sentiments. In order to improve and/or train the sentiment analysis algorithm, a minimum of 400 samples should be processed using data-mining techniques [2,18] to achieve a minimum training that offers possibilities of success in terms of reliability in this type of machine learning algorithms [19,21].
Note that in order to increase the quality of the research, the database of any kind should be properly processed and filtered. For instance, if the database is composed of tweets or reviews, re-tweets or repeated reviews should be eliminated since they constitute duplicate content [2].
In the proposed methodology, the preferred method is to use a sentiment analysis algorithm based on the SVM technology. SVM was chosen because it can be used without special technical and development knowledge—in fact, these algorithms have in most cases, visual interfaces that help to develop data mining processes to improve the probability of success of the algorithm that is known as accuracy.
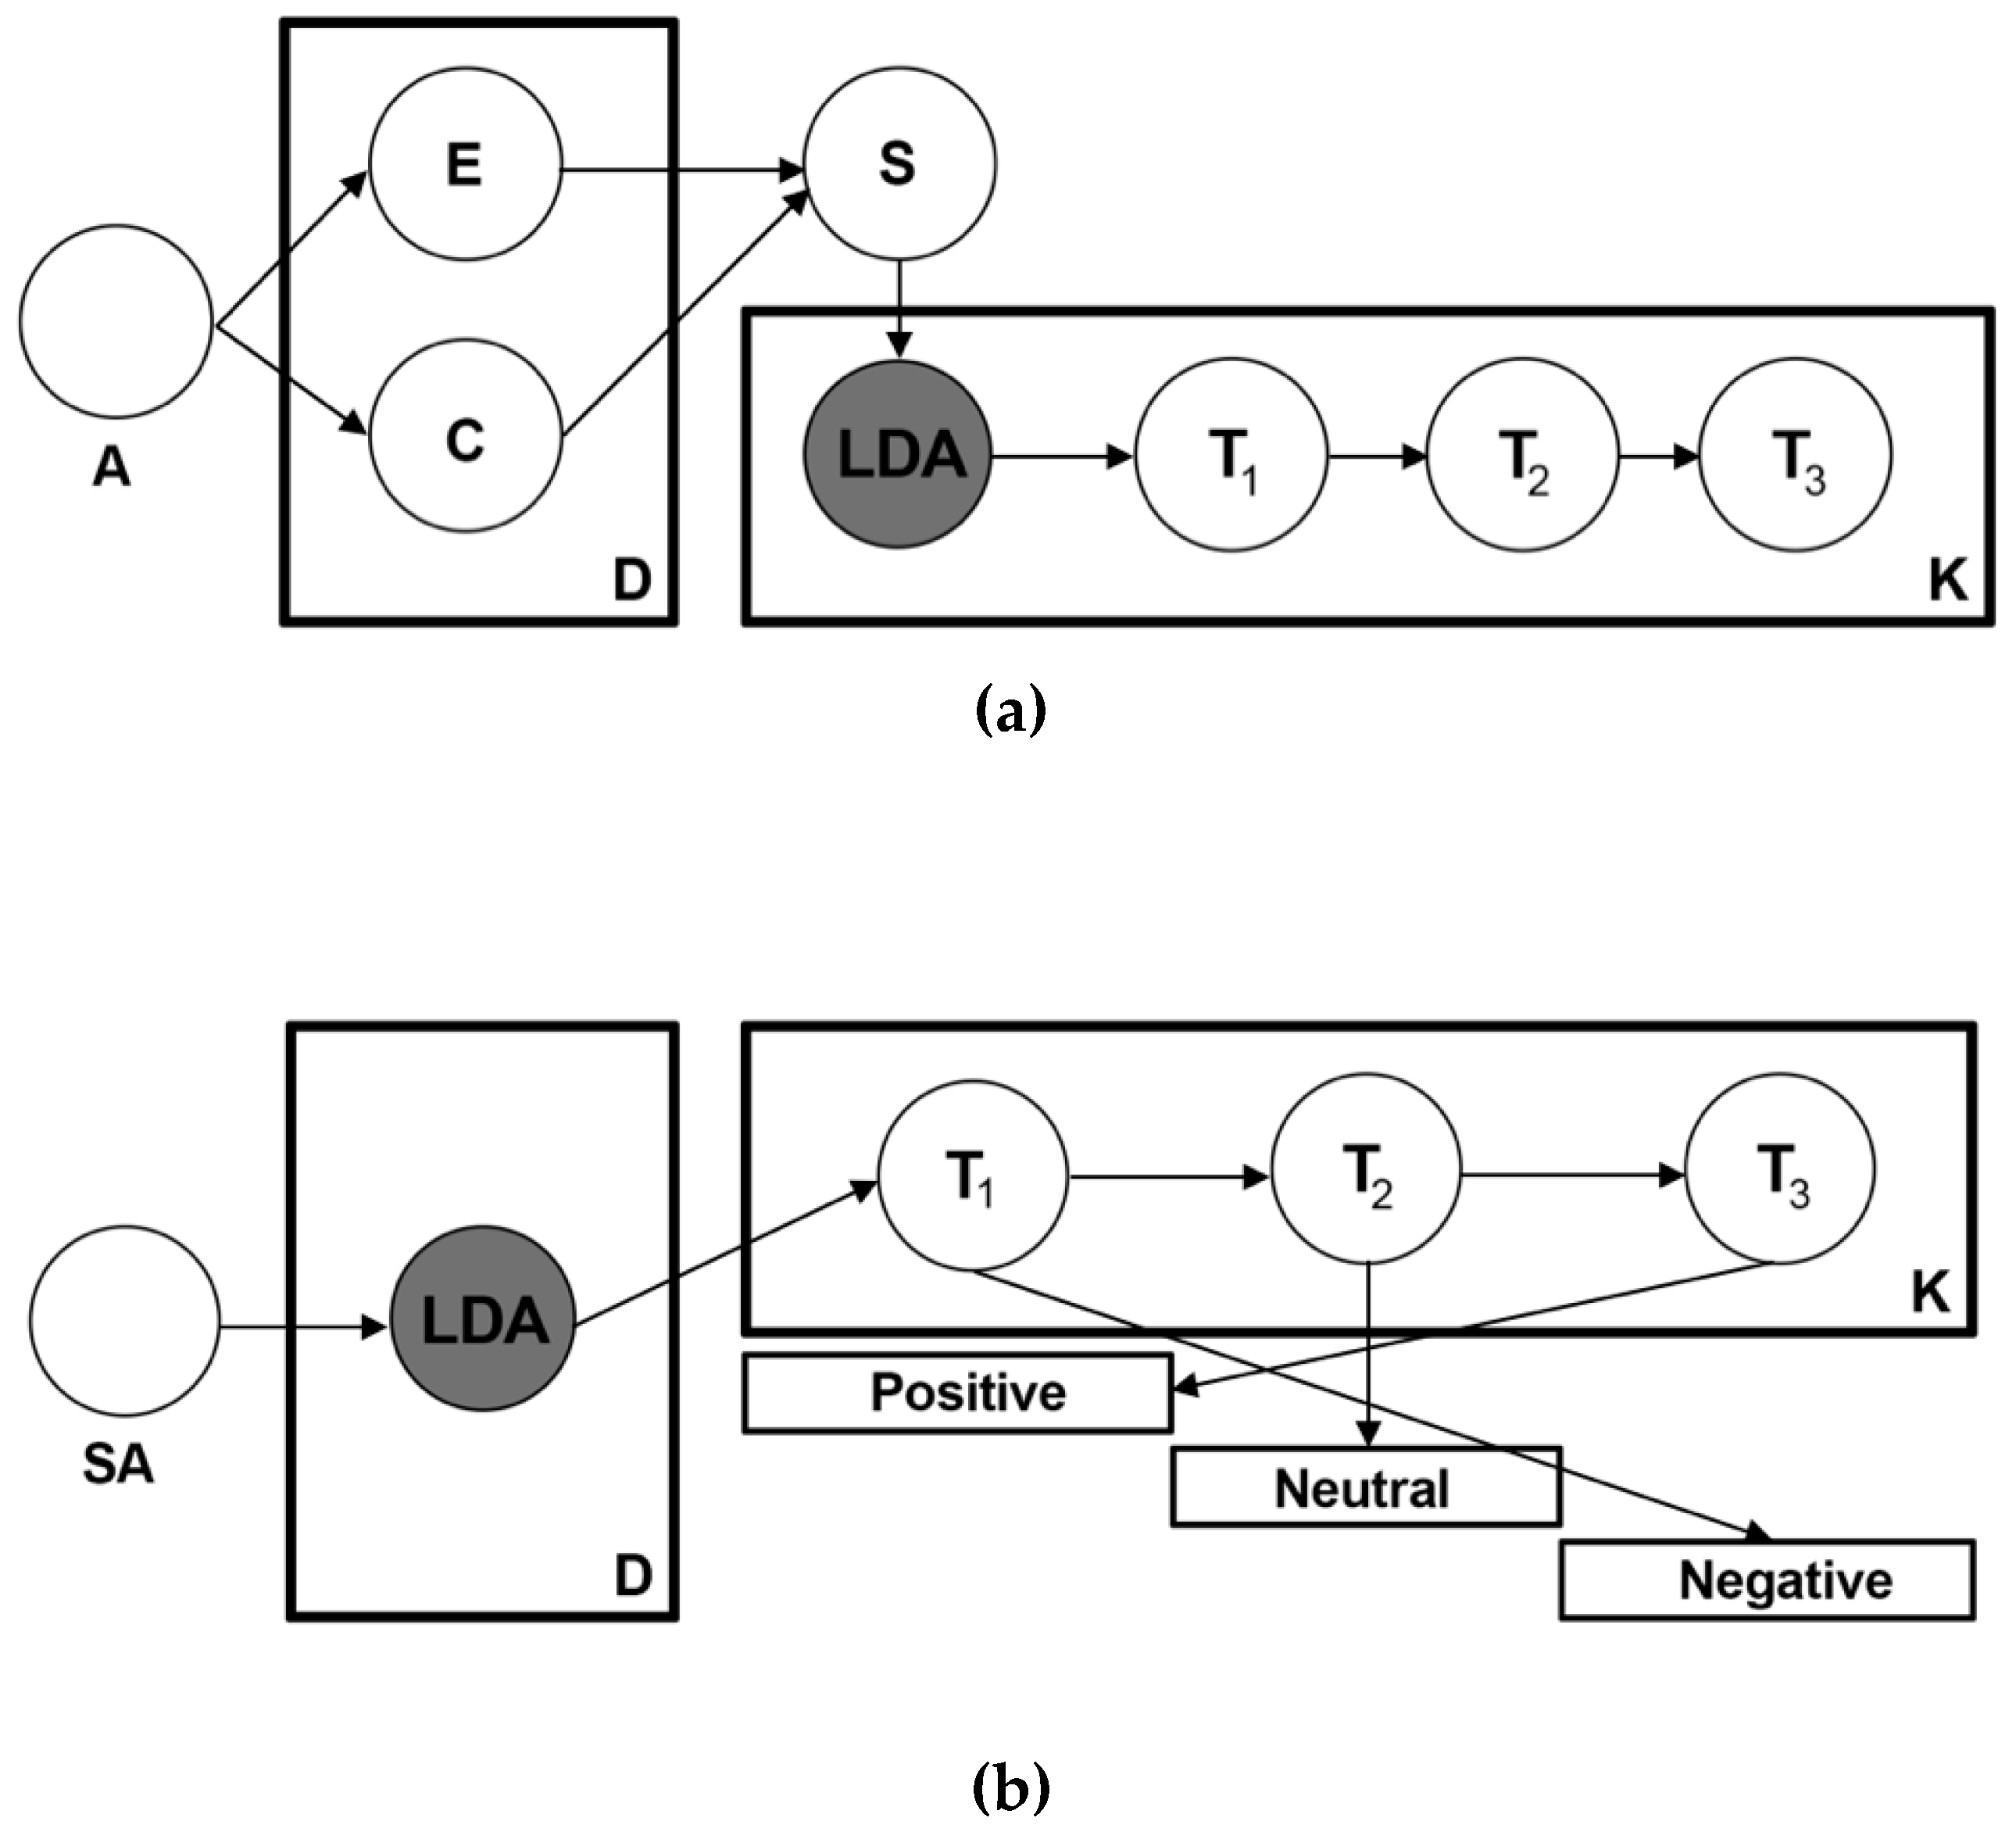
The SA process unfolds as shown in Figure 4. First, in Figure 4a, neuron A refers to the API to which the researchers must connect to download the data. Depending on the platform, one can access more or less data (Twitter API, TripAdvisor API, and so forth).
E and C refer to data extraction (E) and data collection (C), i.e. processes by which the data are obtained from the API. (D) refers to the process of data processing to build the dataset. Neuron S refers to data set (S) that must be correctly filtered to eliminate duplicate, erroneous, or unnecessary information. The neuron called LDA refers to the LDA model that divides the sample analyzed in T1, T2, T3 ..., up to the maximum number of topics that can be identified according to the size of dataset (k).
In Figure 4b, SA refers to the SA that is applied to the neuron called LDA to show how SA is applied to each dataset divided into topics (T1-T3). Subsequently, each topic, from the total number of topics (k), is classified as positive, negative, or neutral. Accordingly, each topic obtains a specific feeling label, from which specific KIs can be obtained when applying TA. To measure the effectiveness of algorithms based on sentiment analysis, the following three measures are used: precision, recall, and accuracy [12,13,18]. First, precision measures how many texts were automatically predicted correctly (both correct and incorrect) and were categorized according to their feeling and category. Recall is a measure that accounts for how many texts were correctly predicted within the same category taking into account their number among all texts in the same category. Finally, accuracy measures how many texts were predicted correctly, both for those that belong to a category and those that do not. Precision and recall should be used to assess the performance quality of the algorithm and accuracy to measure its predictability.
According to Saif et al. [7] Krippendorff’s alpha value is the most commonly used measure to assess the accuracy of a sentiment analysis. Saif et al. [7] indicated that in order to obtain a correct percentage of predictability, Krippendorff’s alpha should be equal or above 0. 667 [16]. Values above this threshold indicate that the algorithm has been trained a sufficient number of times and its predictive capacity is sufficiently high. However, according to Krippendorff [3], the minimum acceptable Krippendorff’s alpha value should be chosen according to the importance of the conclusions [8,15,16].
3.4. The Textual Analysis Process
In this step, the data that make up the databases are analyzed (see Figure 5). In this particular system, the process is based on the NVivo software, a qualitative analysis tool, though other algorithms developed in Python and other languages for the development of textual analysis can be used [13,16]. The proposed system opted for NVivo because it does not require specialized knowledge and has a simple interface that allows the researcher to correctly classify and structure the database in nodes. The data entry processes can also be manually performed in NVivo, although the databases may already be divided into sentiments [16].
In this case, a structure of nodes should be created in which the words identified as connectors, prepositions, articles, and plural forms are eliminated. To eliminate repeated words, Equation (3) should be used.
where K is an empirical approximation constant. The purpose of K is to eliminate all words that are mechanically repeated in different imported text resources. The process for determining K involves a query that allows the program to search the databases. K can then be established for each sample or topic according to its expressed feeling, which is later compared with the rest of the sample. In this way, the average value of K for all the topics is computed to obtain the global weight of X, that is, the number of topics.
Subsequently, the nodes are defined as data containers grouped according to their characteristics. The structure and design of new nodes is used to group raw data as accurately as possible. An important indicator to perform a TA process is the Weighted Percentage (WP) that shows the number of times a node repeats its content in the database, as shown in Equation (4).
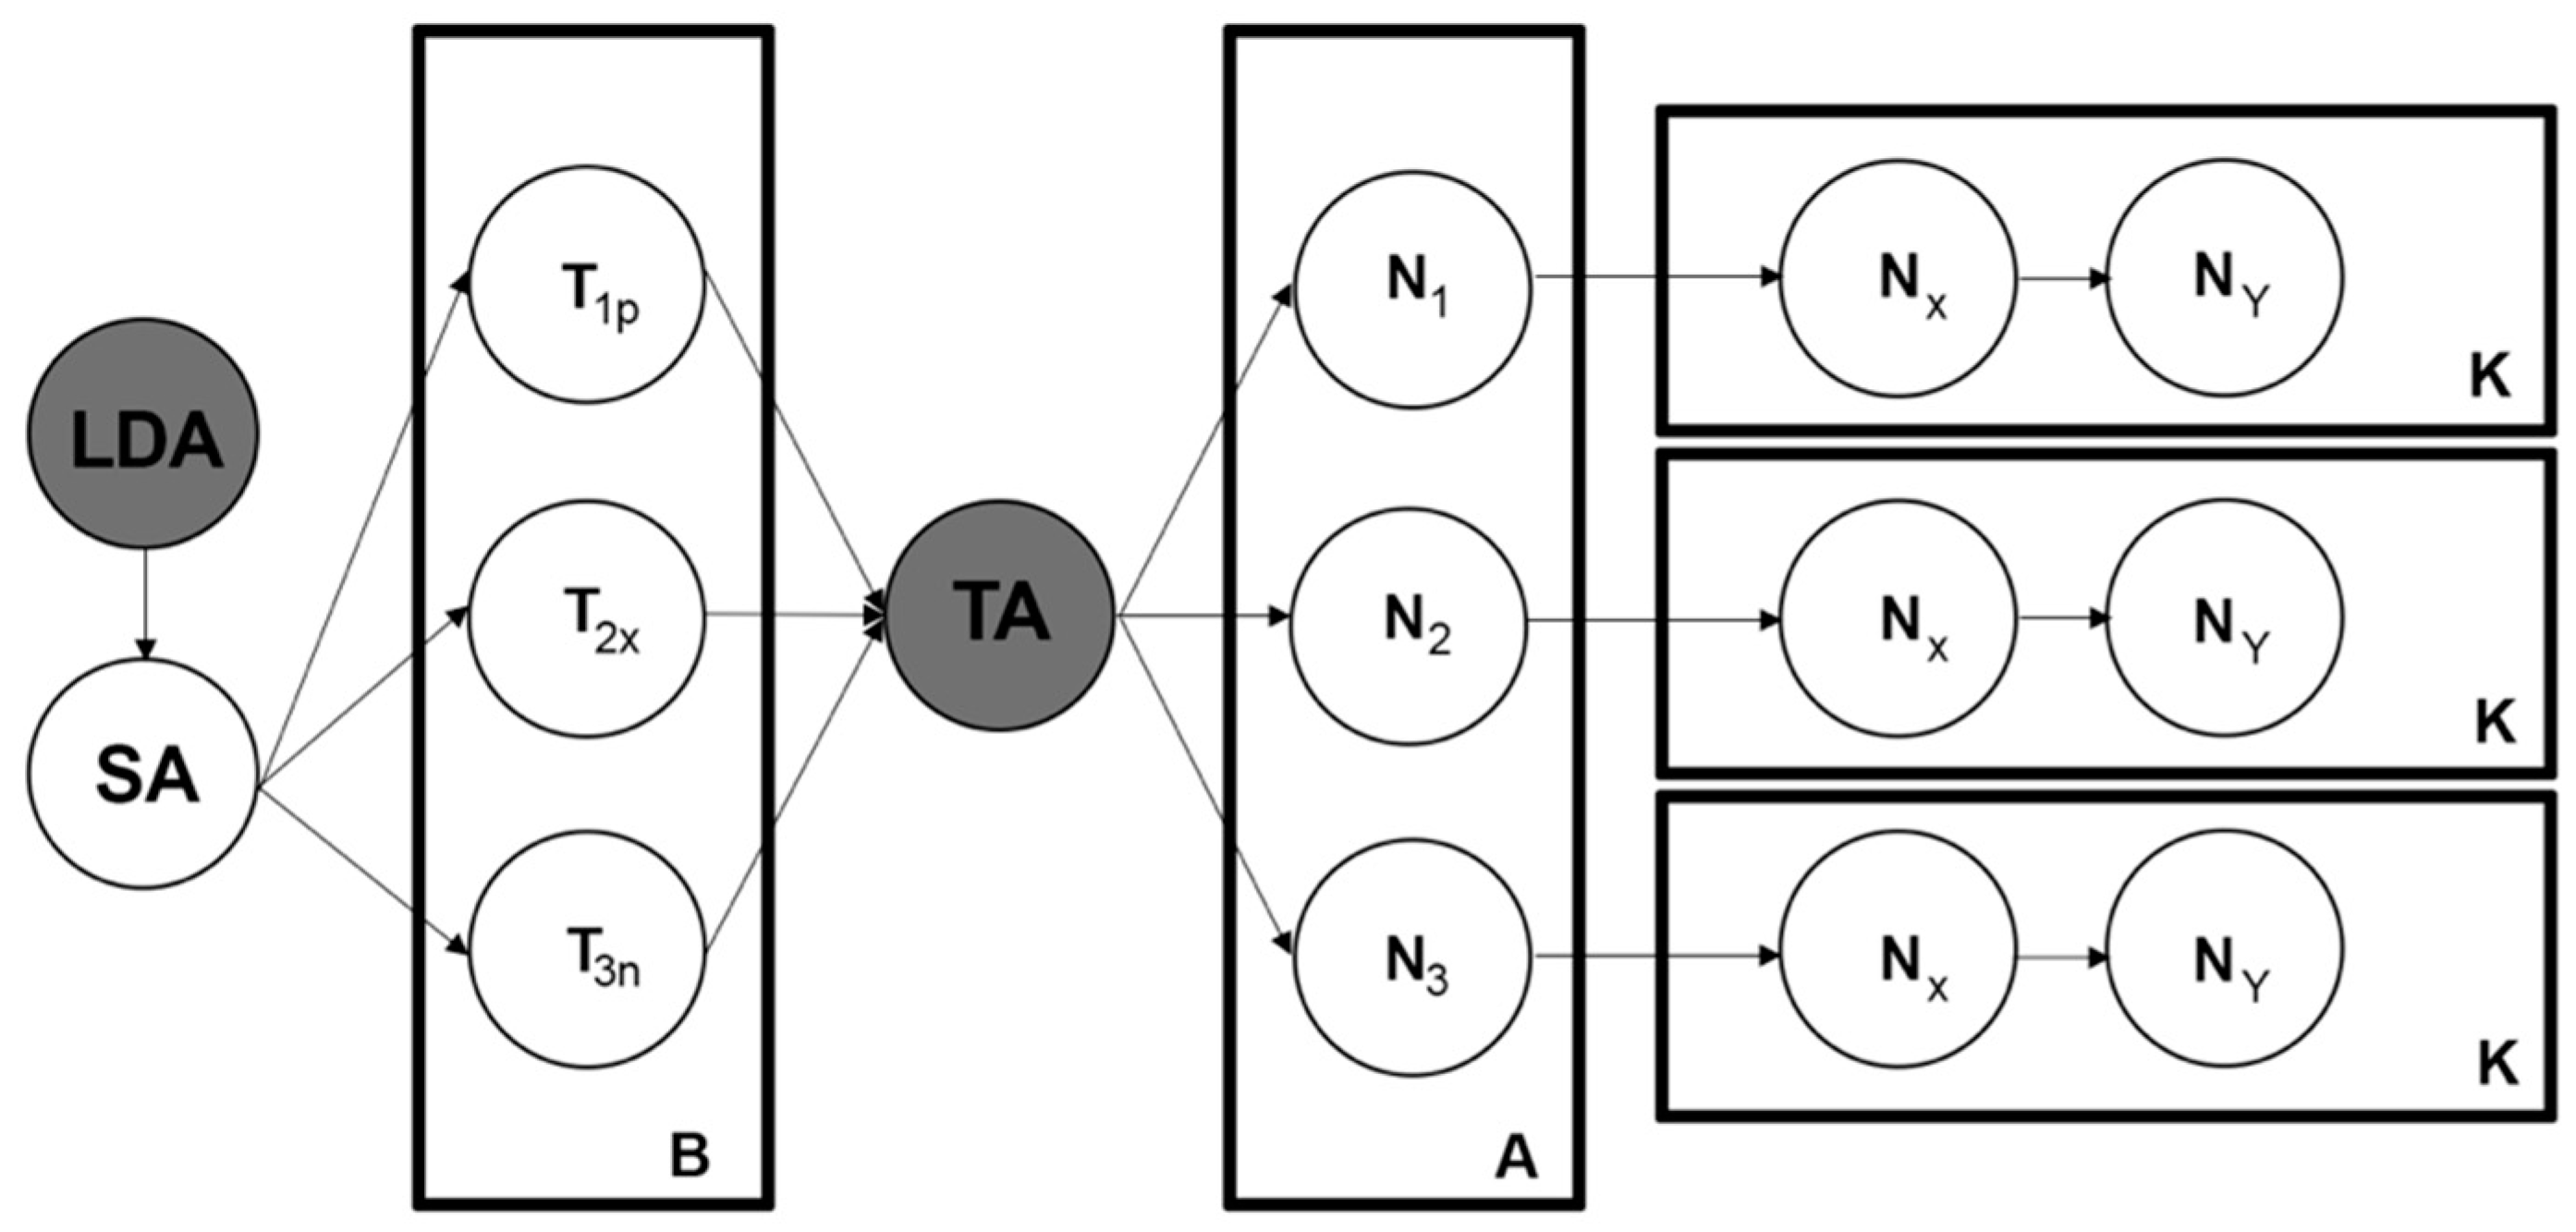
Figure 5 shows the stages of the proposed methodology. LDA and SA represent the step explained in Figure 5B in which we obtain T1p that corresponds to a topic with positive sentiment (p), T2x that corresponds to a topic with neutral feeling (x), and T3n that corresponds to negative sentiment (n). Once the text samples that subdivide the topics by feelings are identified and correctly classified, the TA process is applied. As explained above, this process consists of classifying these samples into categories known as nodes represented in Figure 5A. Therefore, N1 corresponds to T1p, N2 corresponds to T2x, and, finally, T3n corresponds to N3.
Once each of the themes with its expressed feeling is classified into the corresponding nodes, the text mining process begins by subdividing the main category into nodes and creating sub-nodes Nx and Ny that belong to N1. These sub-nodes contain sub-topics or characteristics deemed to be important, similar to, and of interest for the topic under investigation [2].
This categorization approach is based on the weight of repeated words and phrases and on accuracy, which in this case, measures how many times each word is repeated [6,16]. Once all the samples are divided into nodes and sub-nodes, each of the KIs should be analyzed and defined.
To finalize the methodological process, these KIs can be summarized in tables showing the average weight and accuracy and can be presented as strong judgments justified by the data.
4. Exploratory Analysis of Results
As discussed above, the main aim of the present paper is to provide an in-depth explanation of each step of the methodological process, rather than to verify that the process works. This is because each step in the process has been previously verified through a series of previous studies [2,5,6,12,21]. Accordingly, the analysis section is based on previous results previously published elsewhere (see, e.g., Saura et al. [2,5,6,12] and Reyes-Menendez et al. [21]). We also provide a detailed explanation of how the process should be developed.
4.1. LDA Model Results
As a result of the LDA model, researchers should highlight the results of their application. To this end, the results can be presented in a table where each topic is identified and a description that clearly explains how the topics are titled is provided (see Saura et al. [2] and Jia [8]).
The identified topics should be numbered, and the descriptions should be clear and concise [2]. Likewise, note that the definition of the name of each subject should be chosen by the researcher which is a standard procedure in the application of LDA models [8]. In this case, the researcher should try to use the last 10 words classified in a topic to make a sentence; if the sentence makes sense and defines a category of content, the researcher should set the name corresponding to that subject [2,8]. This process is conventionally used in the development and application of LDA models [4].
Sometimes, it is also possible to use the number of words that make up each subject or use the type of words that compose it (e.g., adjectives or nouns) in a table [2,8]. Likewise, categorizations of attitudes, abilities, or any other classifier decided upon by the researcher should also be presented.
Using the latter approach, in a previous study on the development of business plans for startups, Saura et al. [2] identified topic names as business plans from a sample composed of tweets. Similarly, based on a sample from a Chinese social network, Jia et al. [8] identified a topic name called Membership Price, which refers to the rates of activities related to yoga. It is important to highlight that, after the databases to which the LDA model is applied have been processed with a sentiment analysis algorithm, the topics can be subdivided into sentiments [4].
4.2. Sentiment Analysis Results
To determine the probability of success of the algorithm after the training process [2], the results of the sentiment analysis are then presented with due attention to Krippendorff’s alpha values [12,16,21]. The results may be presented as a table or a graph that shows the results of the training (see Figure 5 for the results previously reported in Saura et al. [12]).
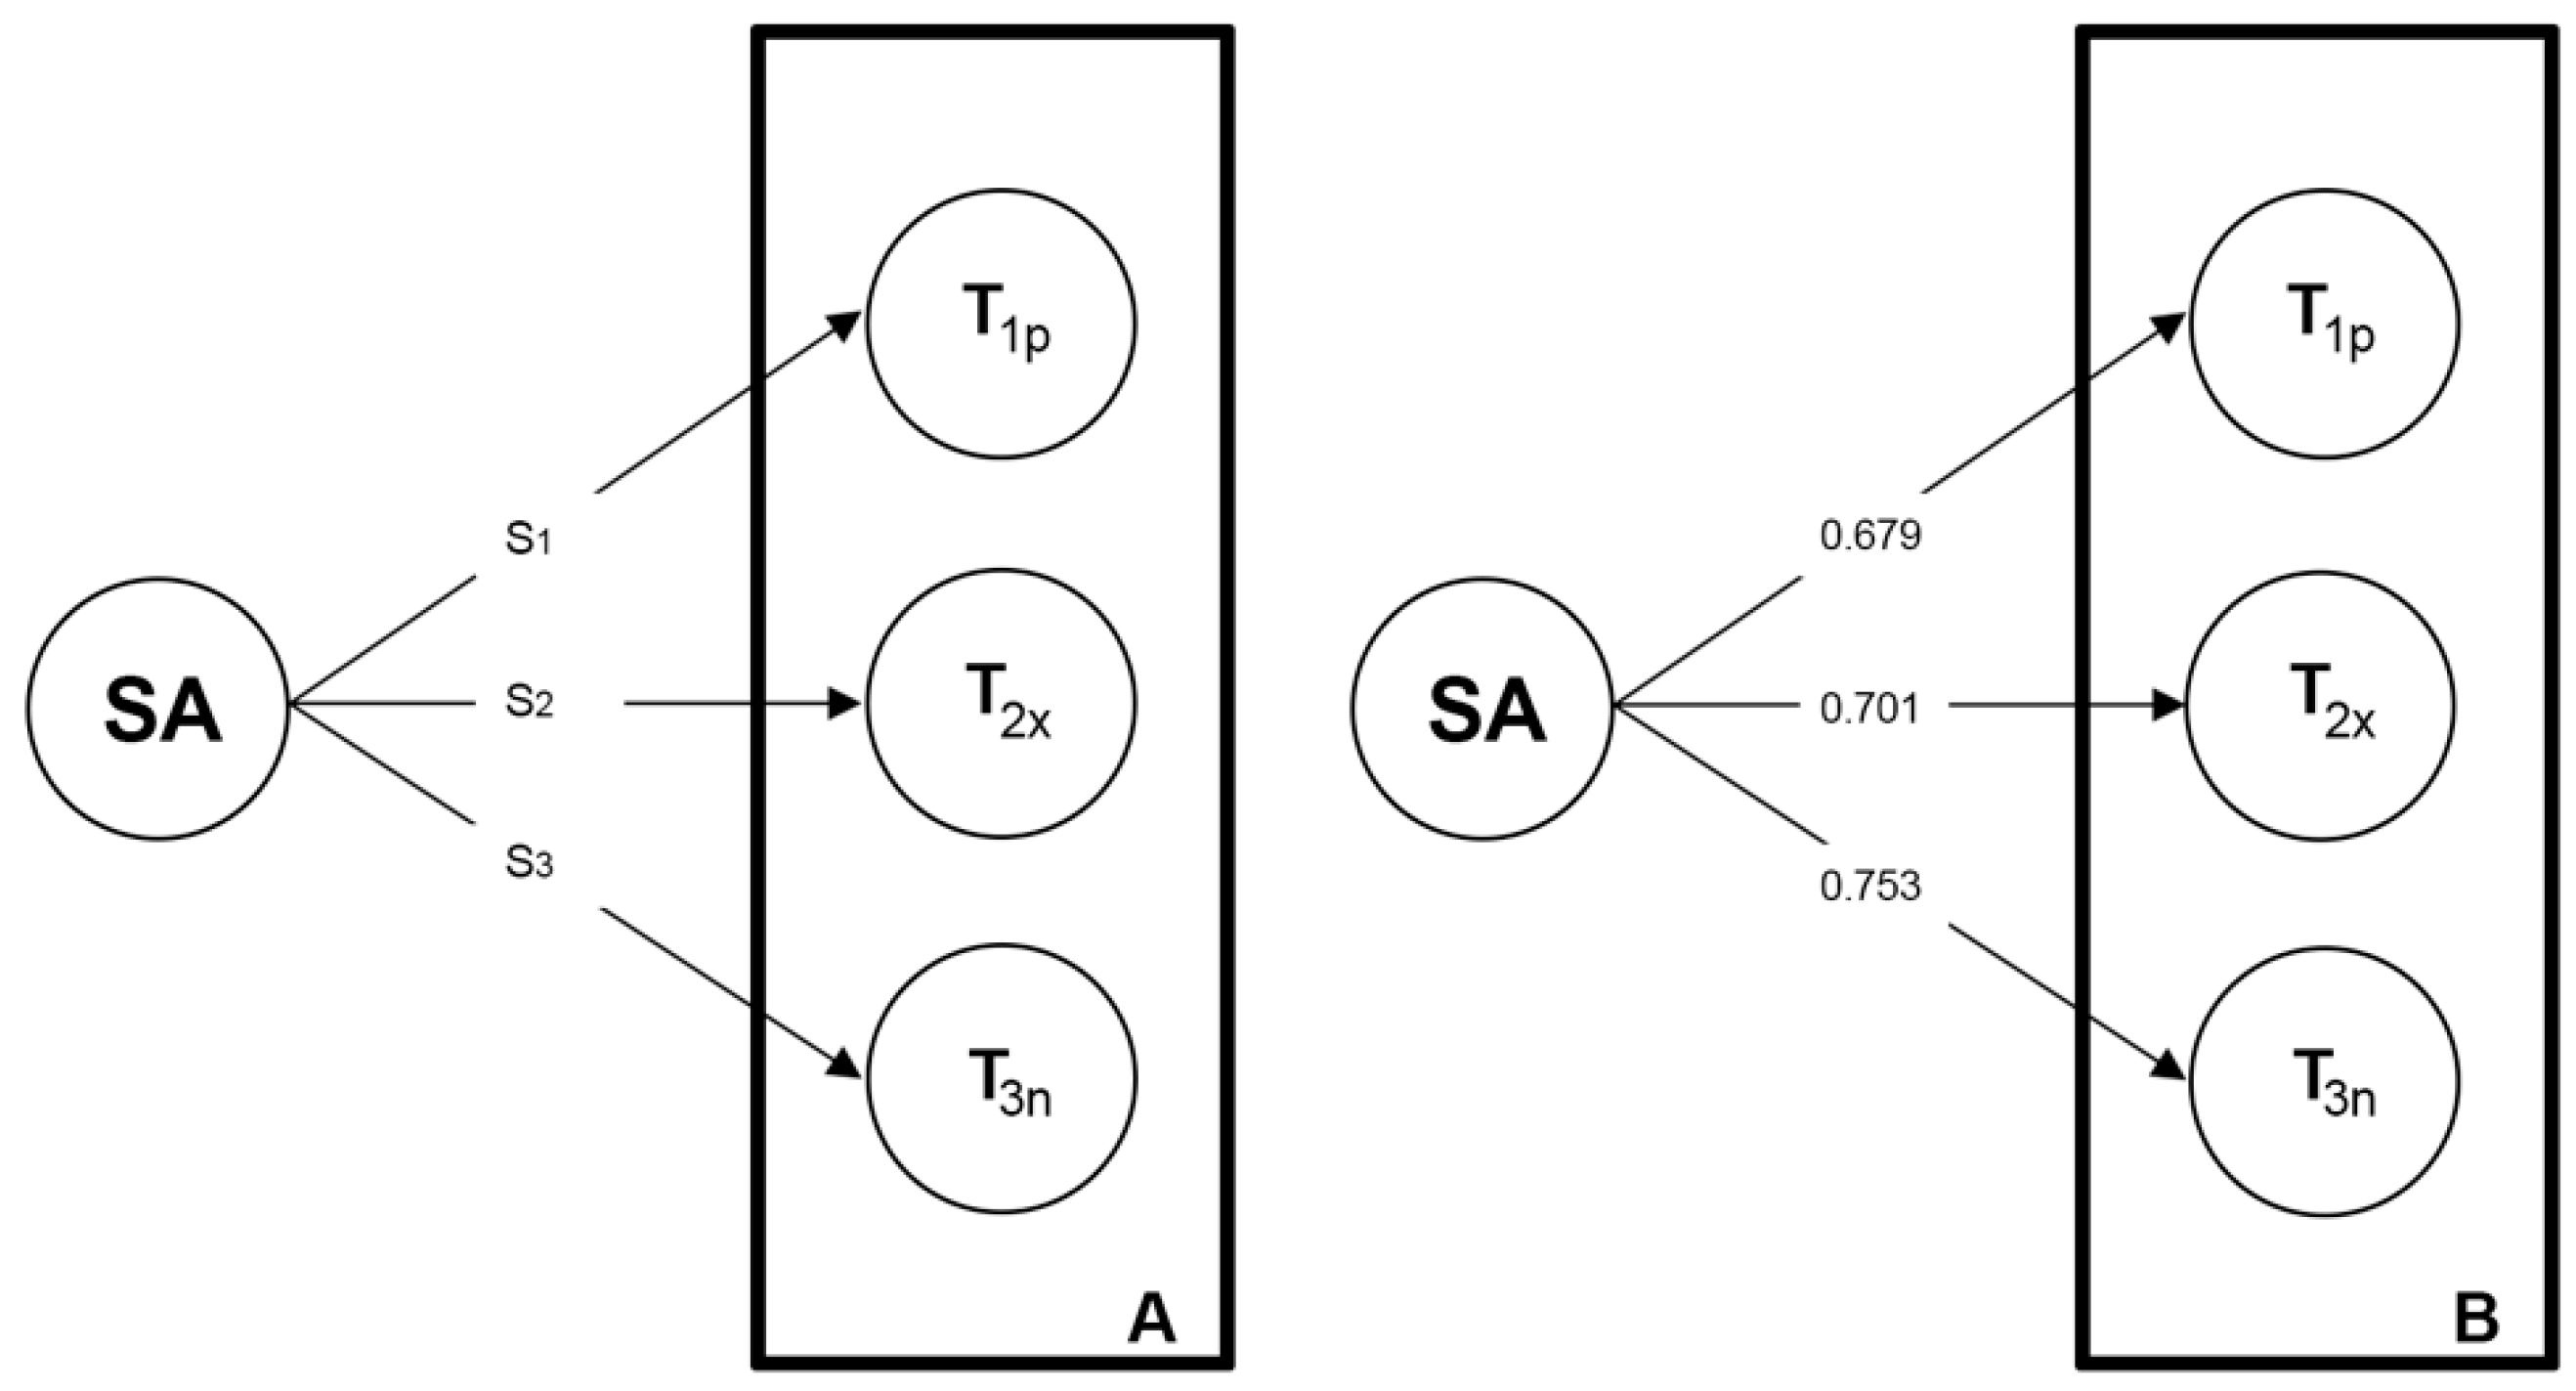
As an example of the process in action, Figure 6 below shows a typical analytical result. In A, S1 represents the total number of texts in the sample (e.g., if the study is about Twitter, the total number of tweets) that have been classified as those that express positive sentiment S2, the total number of samples classified as neutral and S3, the total number of samples classified as negative. In Figure 6, S1 corresponds to 1793 tweets, S2 corresponds to 3207 tweets, and S3 corresponds to 1446 tweets. It is not necessary that the results should include the number of samples classified and also the sentiment of each topic [2] but, as noted above, the Krippendorff’s alpha value should be indicated. Normally, an average value is presented for each identified feeling. For instance, Saura et al. [12] obtained the Krippendorff’s alpha value of 0.679 for positive sentiment, 0.701 for neutral sentiment, and 0.753 for negative sentiment. In contrast, Saura et al. [2] Krippendorff’s alpha value was 0.794 for positive sentiment, 0.802 for neutral, and 0.693 for negative. In Reyes-Menendez et al. [23], the authors obtained the value of 0.719 for positive sentiment, 0.651 for neutral sentiment, and 0.802 for negative sentiment.
The average value should be indicated for topics or classified samples of text according to the specific research objective of each study.
4.3. Results of Textual Analysis
The results of the TA process should be based on the measurement of two indicators [2,4,13,14]. The first term is the number of times a word is repeated in the total sample analyzed [14]. This value measures the accuracy of a text in a sample and should be represented with the variable “Count/Accuracy”. The second indicator is “Weighted Percentage” which represents the relevance of the words in a sample [3,6,22]. For further analysis, the sample should be organized in different sentiments, and these sentiments should be classified into different databases that will be represented as nodes. A node is a division of a database that groups homogeneous text samples that have been classified. These nodes can be further analyzed in software specialized in textual analysis, such as NVivo or Atlas. In addition, the nodes must be classified according to the type of feeling. A generalized way of giving a value to each node is illustrated in Table 2.
Another factor that should be reported in the TA conclusions is “Similar Factors” or “Similar words”. In this way, different words and ways of expressing the same fact can be linked, thereby helping to obtain the KIs.
The identified KIs should be strong statements supported by the results of the analysis of identified sentiments, topics, values of count (C), WP, and similar words, which are classified in nodes (N1 - N3). If SA is applied to very emotional textual data, such as texts containing very negative or very positive sentiments, the nodes classification should be between N1 to N5.
As with the nomenclature procedure of the topics, this final procedure of data analysis has also been carried out in previous studies [4,5] (see Table 3 for a summary). This step is much simpler if the sample has already been analyzed using the approach proposed in the present study, rather than when the dataset is not debugged yet or when data mining processes have not been applied to it yet.
Applying an exploratory approach to these data, researchers should be able to structure the analysis through the identified KIs and insights. For example, Reyes-Menendez et al. [23] found that innovative ideas based on sustainability protocols should help to improve the environment defined after N3 analysis in which a C value of 209 and a WP of 1.89.
Furthermore, after the analysis of the N1 obtaining a C of 32 and a WP of 0.12, Saura et al. (2018) established a KIs for air quality that has positive effects on the satisfaction of the travelers during their trips. Finally, after obtaining a C of 254 and a WP of 1.2, Saura et al. [2] found that the business angels are perceived with negative sentiment due to the high commissions that they request from startups for their investments.
5. Discussion
In the present study a three-stage research methodology based on DTM techniques is proposed. The proposed methodology can be used both by companies for the development of their BI strategies and by the academic community.
However, there are several issues that should be discussed with regard to the scientific ecosystem. For example, in terms of SA, this approach still faces a number of challenges related to the understanding of concepts such as irony, sarcasm, or subjectivity. However, despite the importance of the identification of subjectivity and objectivity in texts that make up databases, it remains very difficult to train the SVM machines so they can understand these subtle linguistic connotations.
In many cases, these challenges for machine learning depend on the context and polarity in which it is transmitted with respect to different classifiers, such as a tweet with a hashtag on Twitter, a review on the cleanliness of the hotels on TripAdvisor, or any other digital data source or social network such as YouTube, Booking, Facebook, or Instagram. In any case, the researcher must take care to establish appropriate categorization and structure in these processes since the machines cannot understand contexts and tones in order to segment the analyzed sentiments.
Therefore, methodologies such as the one proposed in the present study, which focuses on processing the data within an analytical context, contribute to improving the analysis and classification technologies. However, in any discussion of automation, variables such as irony and sarcasm remain challenges, as does the classification of neutral sentiments, which basically arises because it was not possible to detect a positive or negative sentiment of a text sample.
As concerns TA, it is important to understand that it is the researcher who breaks samples down into nodes to obtain reliable indicators. Therefore, in essence, TA is a qualitative and empirical approximation process where the data are structured in nodes and classified by the researcher so that they make sense after having applied the steps of LDA and SA.
Therefore, it may be possible to refine or improve the process in terms of quality so that the results of each process are as reliable as possible. Doing so would make it possible to obtain clear and interesting conclusions on different topics based on three categories (topics, sentiments and KIs) and enable effective use of the proposed methodology in different professional sectors, and in further academic research.
6. Conclusions
In the present study a three-stage methodology for the analysis of UGC with BI strategies and approaches based on DTM was proposed. In the present-day digital ecosystem, where more data are generated daily, researchers should consider new methodological contributions for automatic or semi-automatic analysis of data.
The results of the present study offer several theoretical implications, as the proposed methodology can be meaningfully used in further research. In addition, the innovation and originality of the proposed process can help researchers give more relevance to the processes based on DTM and BI in order to improve their effectiveness within a shorter period of time.
The present study also has applied value, as the presented methodological proposal can be used by companies to obtain KI from big data databases or to draw conclusions based on marketing intelligence. The limitations of the present study relate to the number of times the AS algorithm is trained and to the empirical approach of TA. Overall, the size of the sample and the area of its application will be key factors that will determine the success of using the proposed methodology.
Author Contributions
All the authors contributed equally to the conception of the idea, implementing and analyzing the experimental results, and writing the manuscript.
Funding
This research received no external funding.
Conflicts of Interest
The authors declare no conflict of interest.
References
- Gantz, J.; Reinsel, D. The digital universe in 2020: Big data, bigger digital shadows, and biggest growth in the far east. IDC iView: IDC Anal. Future 2007, 2012, 1–16. [Google Scholar]
- Saura, J.R.; Palos-Sanchez, P.R.; Grilo, A. Detecting Indicators for Startup Business Success: Sentiment Analysis using Text Data Mining. Sustainability 2019, 15, 553. [Google Scholar] [CrossRef]
- Krippendorff, K. Content Analysis: An Introduction to Its Methodology, 3rd ed.; Sage: Thousand Oaks, CA, USA, 2013; pp. 221–250. [Google Scholar]
- Blei, D.M.; Ng, A.Y.; Jordan, M.I.; Lafferty, J. Latent Dirichlet Allocation. J. Mach. Learn. Res. 2003, 3, 993–1022. [Google Scholar] [CrossRef]
- Saura, J.R.; Palos-Sanchez, P.R.; Rios Martin, M.A. Attitudes to environmental factors in the tourism sector expressed in online comments: An exploratory study. Int. J. Environ. Res. Public Health 2018, 15, 553. [Google Scholar] [CrossRef] [PubMed]
- Saura, J.R.; Reyes-Menendez, A.; Alvarez-Alonso, C. Do online comments affect environmental management? Identifying factors related to environmental management and sustainability of hotels. Sustainability 2018, 10, 3016. [Google Scholar] [CrossRef]
- Pritchard, J.K.; Stephens, M.; Donnelly, P. Inference of population structure using multilocus genotype data. Genetics 2000, 155, 945–959. [Google Scholar] [PubMed]
- Jia, S. Leisure Motivation and Satisfaction: A Text Mining of Yoga Centres, Yoga Consumers, and Their Interactions. Sustainability 2018, 10, 4458. [Google Scholar] [CrossRef]
- Saif, H.; Fernandez, M.; He, Y.; Alani, H. Evaluation Datasets for Twitter Sentiment Analysis: A Survey and a New Dataset. 2013. Available online: http://ceur-ws.org/Vol-1096/paper1.pdf (accessed on 28 October 2018).
- Guibon, G.; Ochs, M.; Bellot, P. From Emojis to Sentiment Analysis. 2016. Available online: http://www.enib.fr/wacai/hal-01529708 (accessed on 3 July 2018).
- Burnham, K.P.; Anderson, D.R. Model Selection and Multimodel Inference, 2nd ed.; Springer: New York, NY, USA, 2002. [Google Scholar]
- Saura, J.R.; Rodriguez Herráez, B.; Reyes-Menendez, A. Comparing a traditional approach for financial Brand Communication Analysis with a Big Data Analytics technique. IEEE Access 2013, 99, 1. [Google Scholar] [CrossRef]
- Pang, B.; Lee, L. Opinion mining and sentiment analysis. Found. Trends Inform. Retr. 2008, 2, 1–135. [Google Scholar] [CrossRef]
- Wilson, T.; Wiebe, J.; Hoffmann, P. Recognizing contextual polarity in phrase-level sentiment analysis. In Proceedings of the Human Language Technology Conference and Conference on Empirical Methods in Natural Language Processing, Vancouver, BC, Canada, 6–8 October 2005. [Google Scholar]
- Krippendorff, K. Bivariate Agreement Coefficients for Reliability Data. In Sociological Methodology; Borgatta, E.R., Bohrnstedt, G.W., Eds.; Jossey Bass, Inc.: San Francisco, CA, USA, 1970; Volume 2, pp. 139–150. [Google Scholar]
- Krippendorff, K. Measuring the reliability of qualitative text analysis data. Qual. Quant. 2004, 38, 787–800. [Google Scholar] [CrossRef]
- Liu, B. Sentiment Analysis and Subjectivity. Handb. Nat. Lang. Process. 2010, 2, 627–666. [Google Scholar]
- Liu, B.; Zhang, L. A survey of opinion mining and sentiment analysis. In Mining Text Data; Springer: Boston, MA, USA, 2012; pp. 415–463. [Google Scholar]
- Fayyad, U.; Piatetsky-Shapiro, G.; Smyth, P. From data mining to knowledge discovery in databases. AI Mag. 1996, 17, 37. [Google Scholar]
- Wu, X.; Kumar, V.; Quinlan, J.R.; Ghosh, J.; Yang, Q.; Motoda, H.; Zhou, Z.H. Top 10 algorithms in data mining. Knowl. Inf. Syst. 2008, 14, 1–37. [Google Scholar] [CrossRef]
- Krippendorff, K. Reliability. In Content Analysis; An Introduction to its Methodology, 2nd ed.; Krippedorff, K., Ed.; Sage Publications: Thousand Oaks, CA, USA, 2004; pp. 211–256. [Google Scholar]
- Scott, W.A. Reliability of Content Analysis: The Case of Nominal Scale Coding. Public Opin. Q. 1955, 19, 321–325. [Google Scholar] [CrossRef]
- Reyes-Menendez, A.; Saura, J.; Alvarez-Alonso, C. Understanding #WorldEnvironmentDay user opinions in Twitter: A topic-based sentiment analysis approach. Int. J. Environ. Res. Public Health 2018, 15, 2537. [Google Scholar] [CrossRef]
Figure 1.
Latent Dirichlet Allocation (LDA) process: (a) LDA model represented by plate notation; (b) LDA with Dirichlet-distributed topic-word distributions.
Figure 1.
Latent Dirichlet Allocation (LDA) process: (a) LDA model represented by plate notation; (b) LDA with Dirichlet-distributed topic-word distributions.

Figure 2.
Process of sentiment analysis (SA). (a) Training process of a sentiment analysis algorithm with a feature extractor and a machine learning algorithm; (b) Prediction process of sentiment analysis algorithm with a feature extractor and a classifier model. Source: The authors.
Figure 2.
Process of sentiment analysis (SA). (a) Training process of a sentiment analysis algorithm with a feature extractor and a machine learning algorithm; (b) Prediction process of sentiment analysis algorithm with a feature extractor and a classifier model. Source: The authors.

Figure 3.
Text mining process. (a) Input data text mining process composed by data collection and preprocess; (b) Output data text mining process composed by text mining and text analysis. Source: The authors.
Figure 3.
Text mining process. (a) Input data text mining process composed by data collection and preprocess; (b) Output data text mining process composed by text mining and text analysis. Source: The authors.

Figure 4.
Sentiment Analysis Process from LDA to SA: (a) Topics classification process; (b) Sentiment Analysis process applied to topics.
Figure 4.
Sentiment Analysis Process from LDA to SA: (a) Topics classification process; (b) Sentiment Analysis process applied to topics.

Figure 5.
Textual analysis process. Source: The authors.

Figure 6.
SA reliability results.


Table 1.
SA conclusions’ reliability (Krippendorff’s alpha).
| Conclusions Reliability | Krippendorff’s Alpha Value |
|---|---|
| High | α ≥ 0.800 |
| Tentative | α ≥ 0.667 |
| Low | α < 0.667 |
Table 2.
Identification of nodes by sentiment.
| Sentiment Identification | Nodes Identification |
|---|---|
| Positive | Node 1 (N1) |
| Negative | Node 2 (N2) |
| Neutral | Node 3 (N3) |
© 2019 by the authors. Licensee MDPI, Basel, Switzerland. This article is an open access article distributed under the terms and conditions of the Creative Commons Attribution (CC BY) license (http://creativecommons.org/licenses/by/4.0/).
Share and Cite
MDPI and ACS Style
Saura, J.R.; Bennett, D.R. A Three-Stage method for Data Text Mining: Using UGC in Business Intelligence Analysis. Symmetry 2019, 11, 519. https://0-doi-org.brum.beds.ac.uk/10.3390/sym11040519
AMA Style
Saura JR, Bennett DR. A Three-Stage method for Data Text Mining: Using UGC in Business Intelligence Analysis. Symmetry. 2019; 11(4):519. https://0-doi-org.brum.beds.ac.uk/10.3390/sym11040519
Chicago/Turabian StyleSaura, Jose Ramon, and Dag R Bennett. 2019. "A Three-Stage method for Data Text Mining: Using UGC in Business Intelligence Analysis" Symmetry 11, no. 4: 519. https://0-doi-org.brum.beds.ac.uk/10.3390/sym11040519
Note that from the first issue of 2016, this journal uses article numbers instead of page numbers. See further details here.