Weighted h-index for Identifying Influential Spreaders


1
Key Laboratory of Transport Industry of Big Data Application Technologies for Comprehensive Transport, Beijing Jiaotong University, Beijing 100044, China
2
Beijing Institute of Science and Technology Information, Beijing 100048, China
3
National Science Library, Chinese Academy of Sciences, Beijing 100190, China
*
Author to whom correspondence should be addressed.
Symmetry 2019, 11(10), 1263; https://doi.org/10.3390/sym11101263
Submission received: 12 September 2019
/
Revised: 6 October 2019
/
Accepted: 8 October 2019
/
Published: 10 October 2019
Abstract
:In this paper, we propose weighted h-index and h-index strength to measure spreading capability and identify the most influential spreaders. Experimental results on twelve real networks reveal that was more accurate and more monotonic than and four previous measures in ranking the spreading influence of a node evaluated by the single seed SIR spreading model. We point out that the questions of how to improve monotonicity and how to determine a proper neighborhood range are two interesting future directions.
1. Introduction
Many spreading phenomena, such as the cascading failure [1], rumor diffusion [2], viral advertising [3], etc., in the real world, can be described as the spreading process on complex networks [4,5]. Understanding the significant role that a single node plays provides insights into network structure [6,7,8,9] and function [10,11]. Identifying influential spreaders, whose fundamental problem is how to identify and rank the efficient spreaders in complex networks, has attracted much attention [12].
Degree, the most straightforward indicator, focuses on the number of links per node, and is an often-used measure of the influence of a node in the spreading process. In the early days, people guessed that the node with the maximal degree was the most influential in a network [13,14]. There are also many traditional metrics, such as betweenness [15], closeness [16], Katz [17], etc., which show good performance in distinguishing different influential nodes. However, their computational complexity is unacceptable when we apply them to large-scale networks. Recently, Kitsak et al. [18] found that the most influential spreaders are likely to reside in the core part of a network. However, coreness is a metric based on k-shell decomposition, which assigns many nodes to the same shell. The nodes in the same shell actually have different spreading abilities [19]. The method in Ref. [18] was extended to identify the difference in spreading ability among nodes in the same shell [19,20,21,22,23,24,25,26,27,28,29,30,31]. For example, Zeng et al. proposed a mixed degree decomposition (MDD) method by considering both the residual degree and the exhausted degree [20], but the optimal parameter is uncertain. Liu et al. took into account the shortest distance from a target node to the node with the highest coreness and presented a more distinguishable identification of influential spreaders [21]. Bae and Kim proposed the neighborhood coreness centrality, which summed the neighbors’ coreness together [22]. Wang et al. utilized the iteration information in the k-shell decomposition process to differentiate the spreading influence of nodes in the same shell [23]. Xu et al. designed an iterative neighbor information gathering (ING) process to rank the node influence [24]. Other measures [25,26,27,28,29,30,31,32,33], such as information index [32] and subgraph centrality [33], also have good performance in finding important nodes. These above-mentioned measures are structural centralities which measure the importance of a node based mainly on the topological structure of a network [10].
In this paper, we argue that edges can be quite different [34] and have different significances when defining the spreading influence of a node. For example, degree and betweenness have good performance for unweighted networks, and they have been extended to weighted networks [29,35,36]. Evidence theory has been employed to identify influential nodes in weighted networks [37]. The different importance of the direction of a link in spreading was taken into account by considering weighted neighborhood centrality [38] and asymmetric link weights [39].
Recently, Lü et al. discussed that h-index as a good tradeoff between degree and coreness when measuring a node’s influence. However, h-index is not the overall best performer when compared with coreness [40]. Investigated by recent work [41], these three fundamental methods (i.e., degree, h-index, and coreness) have the advantage of assessing the performance of identifying the influential node. Inspired by these factors, we propose a weighted h-index () by constructing an operator on weighted edges. Furthermore, the sum of weighted h-index () in the node’s neighborhood defines the spreading influence. To evaluate the effectiveness of the proposed measures, we apply the susceptible-infected-recovered (SIR) model for investigating an epidemic spreading process on twelve real-world networks.
The remainder of this paper is organized as follows. Section 2 reviews several centralities and a detailed description of our methods is presented. Then, the SIR model and the evaluation methods are introduced and twelve real networks are employed to test the accuracy and monotonicity of our methods in Section 3. Finally, in Section 4 a simple conclusion is summarized.
2. Methods
Given a network with nodes and edges, represents the edge linking node and node , the weight of is , and denotes the set of the neighbors of node .
2.1. Measures
The degree of node is defined as , where indicates the number of the elements in a set.
The betweenness of node is defined as
where is the number of shortest paths connecting node and node , while is the number of shortest paths connecting node and node and passing through node .
The k-shell index () is obtained by k-shell decomposition. During k-shell decomposition, each node will be assigned to a shell with a specific index.
The h-index of node is defined as [40]
where is an operator, which finds out the maximum integer such that there are at least neighbors whose degree is no less than .
To reflect the spreading influence of a node in a network, we design a new measure called weighted h-index (). The weight of virtual edges incident with node is selected to replace the degree of node in Ref. [40]. Each neighbor of node is cloned times. Each cloned neighbor has a virtual edge whose weight . The edge weights of all the virtual edges incident with node are grouped in the descending edge weight sequence of node . This means that , which is the weight of the original edge , will show up times in the descending edge weight sequence. Then, weighted h-index is
2.2. Single Seed SIR Model
We employed the single seed SIR model to investigate the spreading process on complex networks. Initially, all nodes in a network are in the susceptible state (S) except for the seed node, which is in the infectious state (I). At each time step, the nodes in the I state infect their neighbors in the S state with probability , then their state changes from the infectious state (I) to the recovered state (R), which means that they cannot be infected again. The spreading process will stop when any node in the network is in state I. The number of nodes in the recovered state reflects the final infected scope, and this is adopted to measure the infection strength of the seed node.
The higher infection probability , the larger the population that will be infected, wherever it locates in a network. According to the previous study [43], we know the critical infection probability in a network approximately equals to . In this study, the infection probability is set to larger than .
When node is the seed for the single seed SIR model, its spreading scope () is quantified by the average number of recovered nodes over 200 independent simulations.
2.3. Evaluation Methods
The Kendall correlation coefficient is adopted to measure the consistency between two rankings. Given , the rank vector of a measure , and , that of the single seed SIR model, the Kendall correlation coefficient is defined as
where is the number of concordant pairs, is the number of discordant pairs, and , , , where is the size of rank vectors and and are the number of tied values in the th and th group of ties, respectively. Since all measures are evaluated by , will be denoted by for short.
To quantify the accuracy of a measure, the imprecision function [10] is employed. Given a selection fraction , is the top fraction of the most influential spreaders, and is the nodes with the highest value of measure . Their average spreading scope is denoted by and , respectively. Then the imprecision function is defined as
A smaller means that the corresponding measure performs more accurately in identifying the most influential spreaders. The measure , as discussed in this work, could be , , , , , and .
The monotonicity of ranking vector is defined as [14]
where is the size of ranking vector , which is equal to the number of nodes in a network in this paper. Furthermore, is the number of nodes with the same rank in . If every node is given a distinctive rank, then . This means that is a complete monotonic ranking, and each node can therefore be differentiated from others. When , all nodes have the same rank, and ranking nodes by the measure cannot distinguish nodes at all. A measure with perfect monotonicity in ranking the nodes of a network will rank each node via an exclusive rank, which means that each node has a different rank from any other nodes.
3. Results
Setting the ranking of nodes by their spreading scope, with the single seed SIR model as the benchmark, we evaluated the accuracy and the monotonicity of ranking nodes by degree (), node betweenness (), k-shell index (), h-index of node (), weighted h-index of node () and h-index strength of node () on twelve real networks. The twelve real networks were one power grid network (Power Grid [44]), one computer network in the autonomous systems level (AS), two file-sharing networks (Gnutella06, Gnutella08), one metabolic network (C. elegans [45]), one email communication network (Email [46]), three social networks (PGP [47], Facebook [48] and Hamster [49]), two collaboration networks (CondMat [50] and NetSci [51]) and one protein–protein interaction network (Protein [52]). Their primary features are summarized in Table 1.
3.1. Accuracy
Table 2 shows that obtained eleven highest scores, and obtained one highest score in the consistency between ranking by measures and the averaged spreading scope. Compared to the four previous measures, and were better in twelve and ten real networks, respectively. Table 2 suggests that was a better measure than in most networks (except for Hamster). It is noteworthy that similar results can be found in Table 3 when .
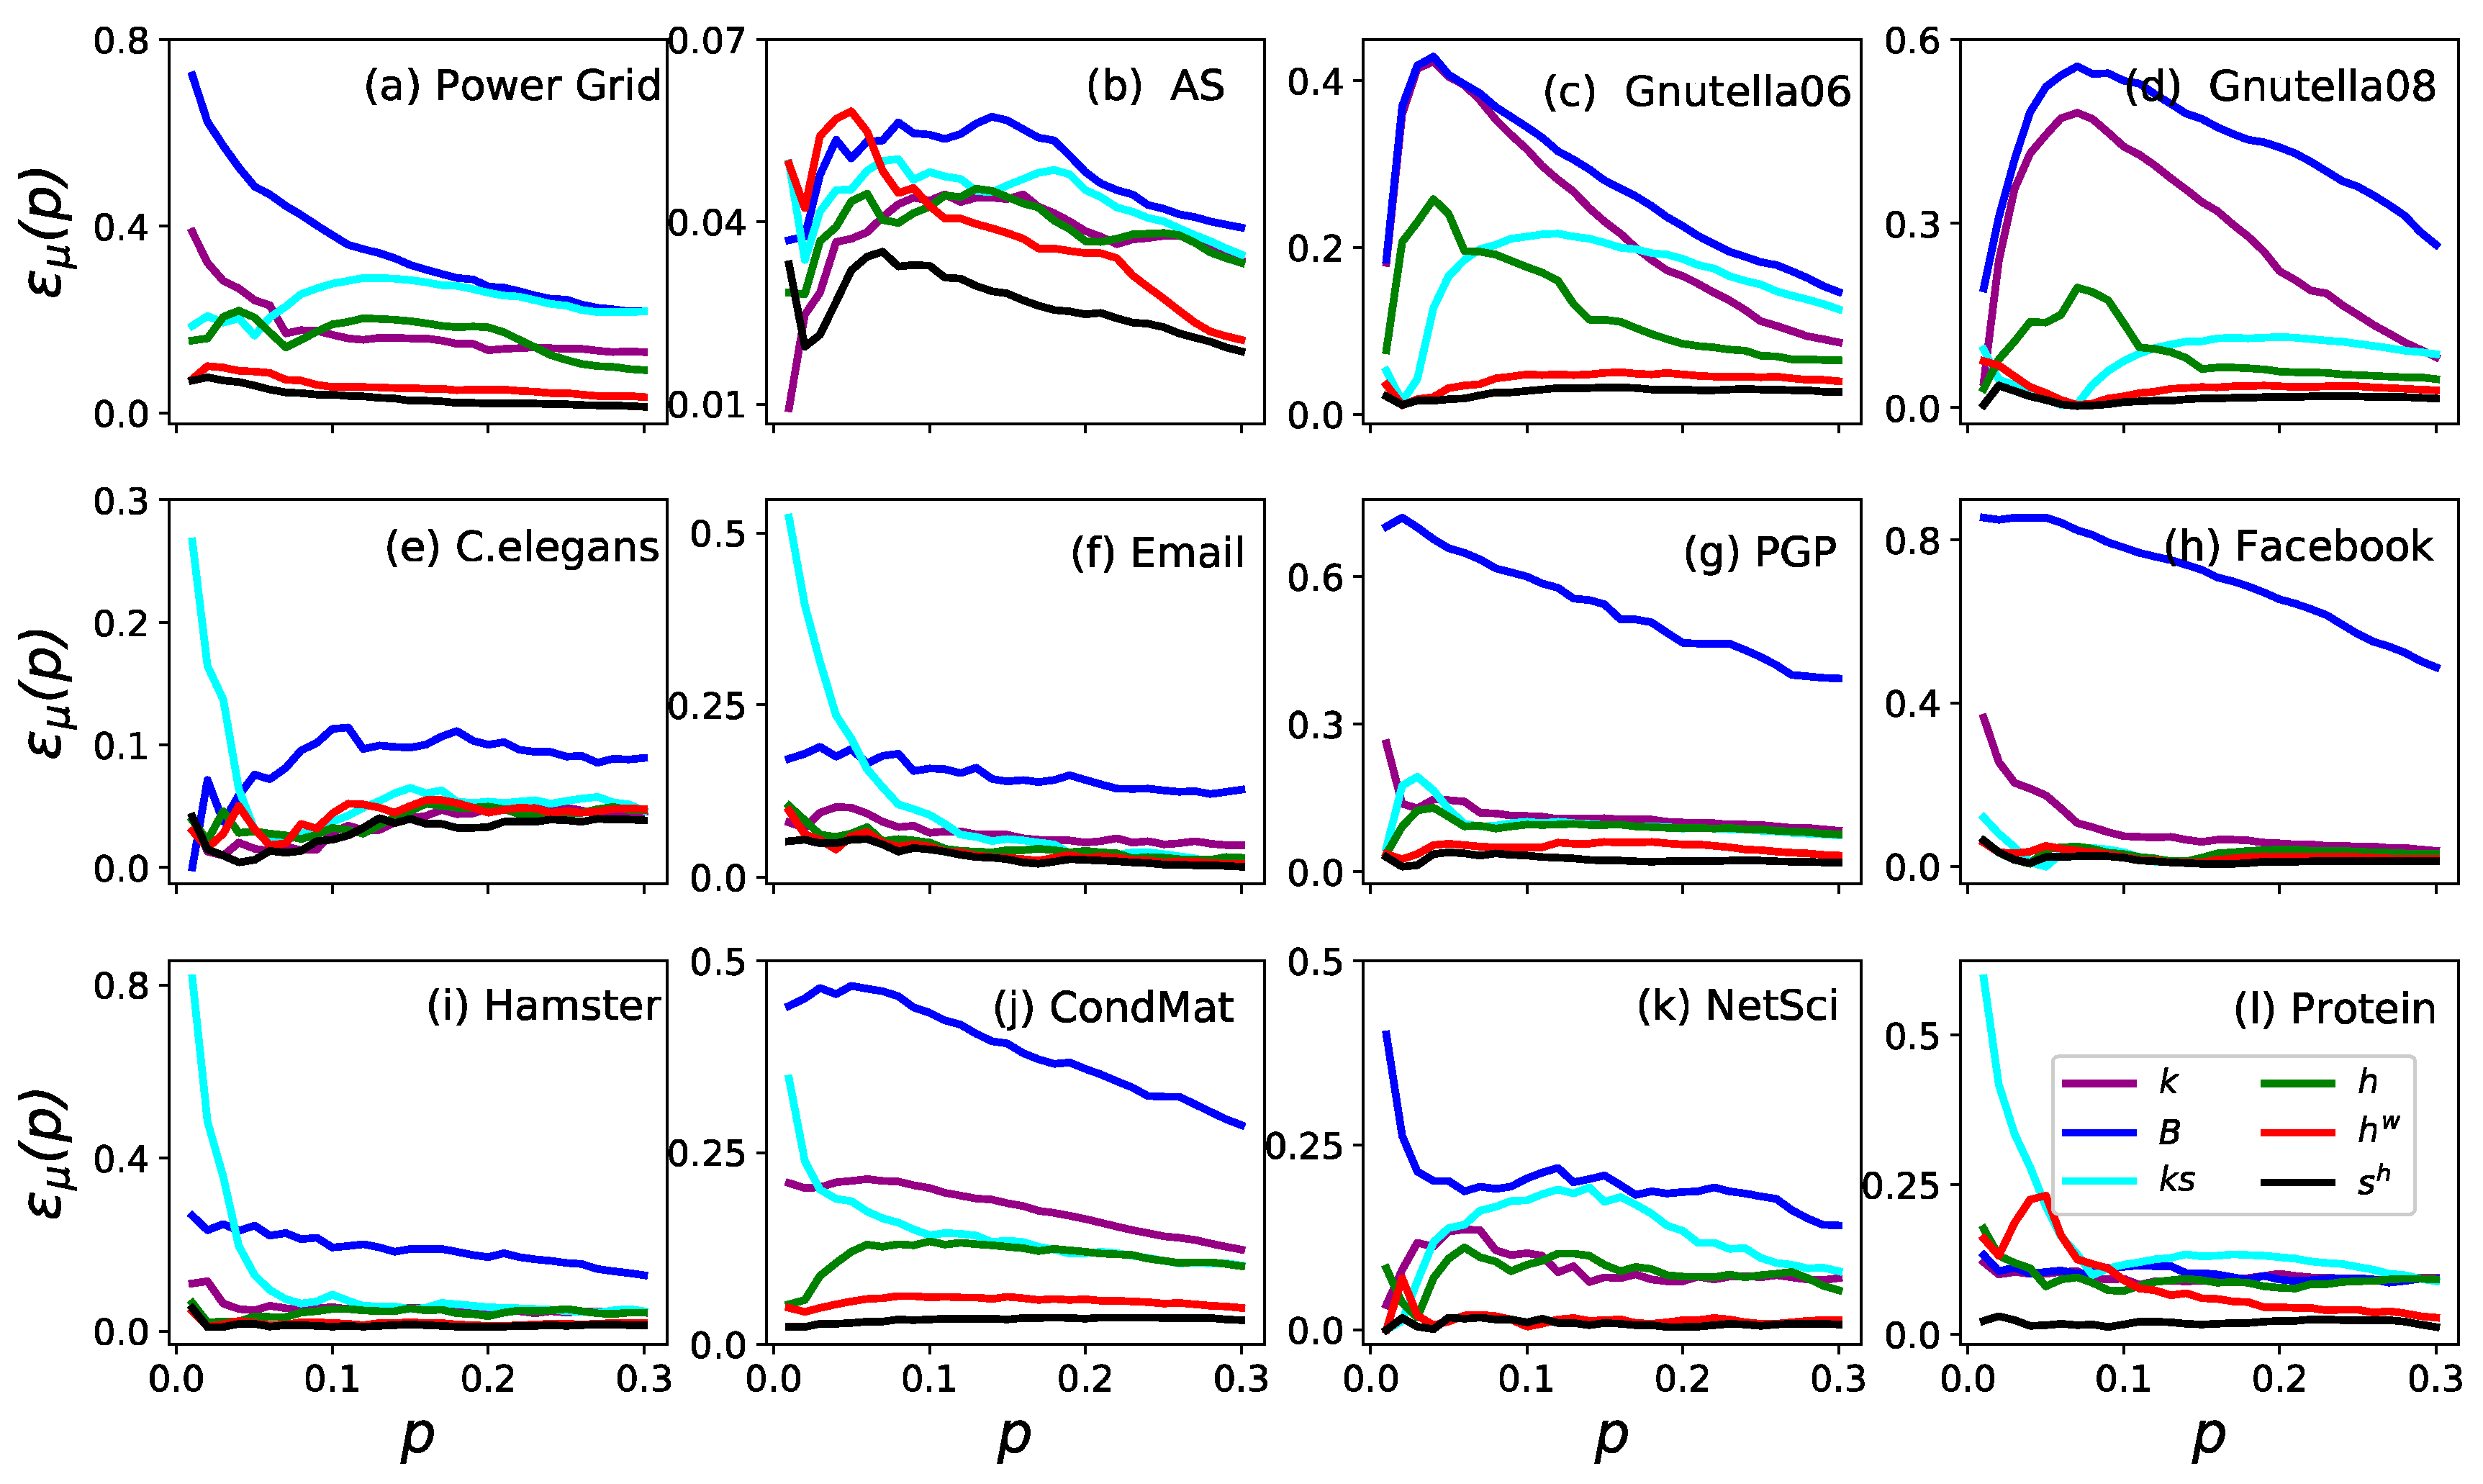
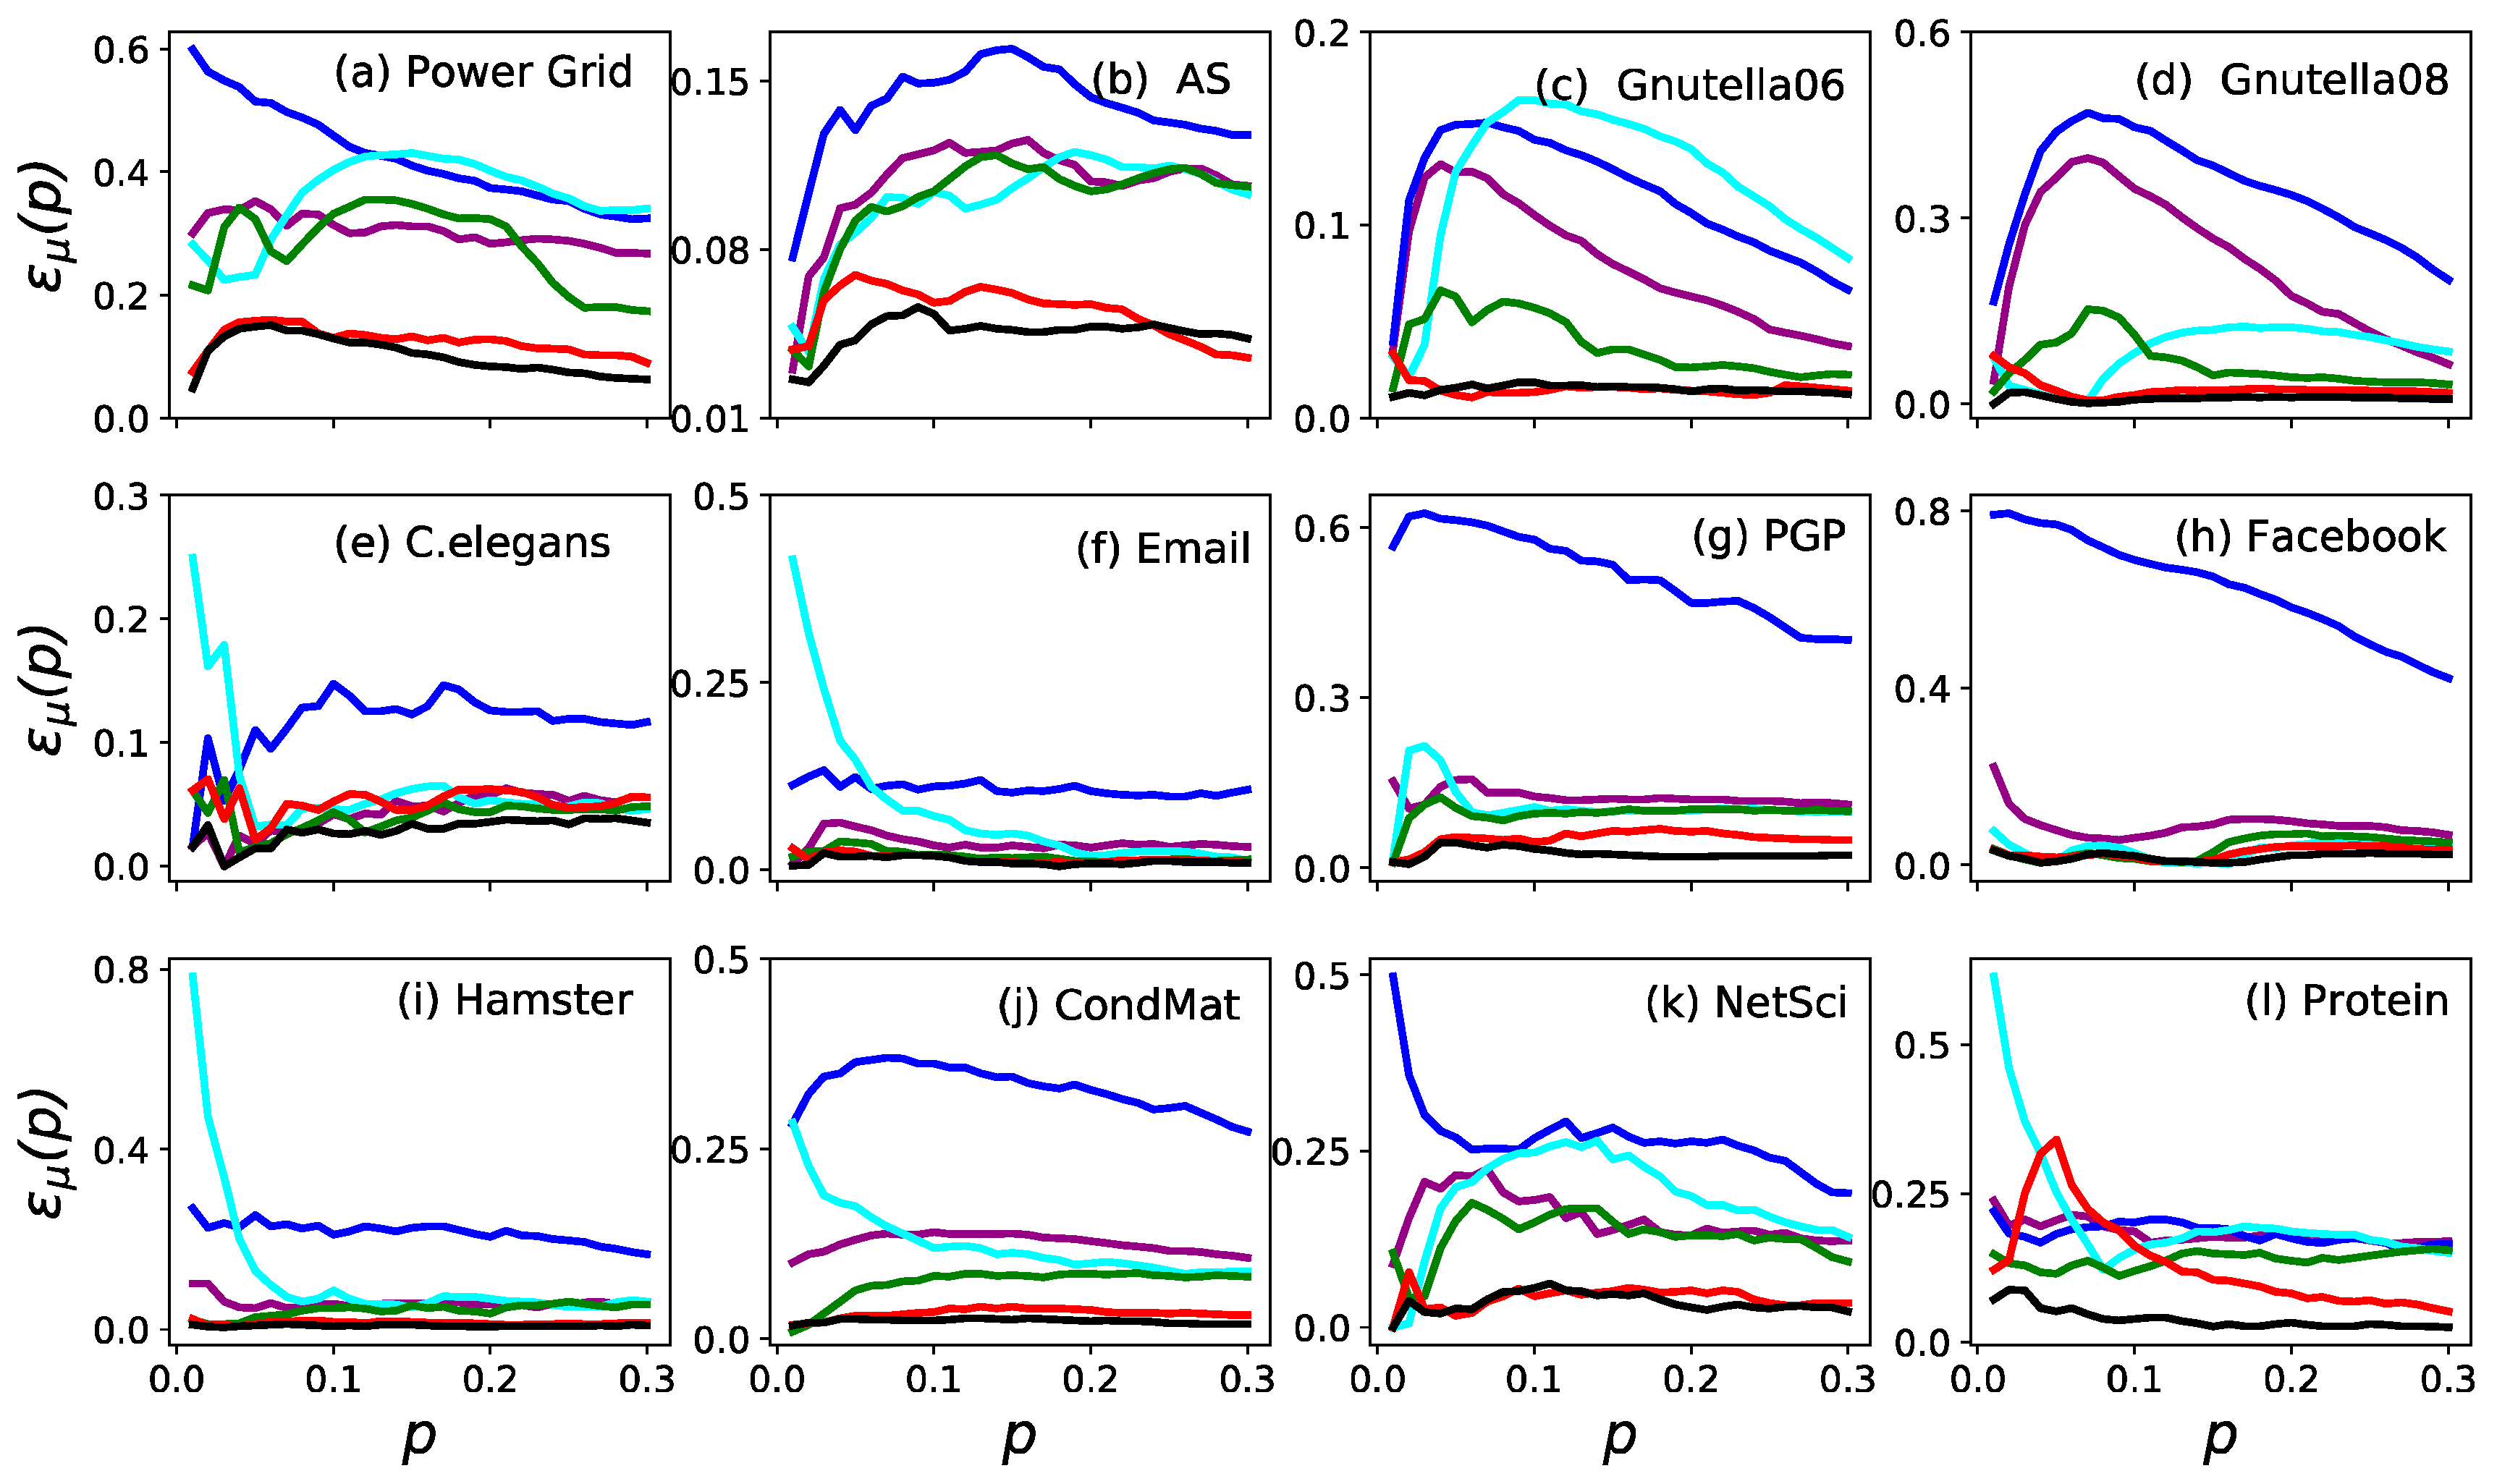
The imprecision functions of the ranking by six measures are shown in Figure 1. The imprecision of (black) and (red) was less than 0.1 for all in all cases. To date, the imprecision of is even less than 0.05 in eleven networks except for Power Grid. Furthermore, is always the most accurate measure in identifying the influential nodes in a network when compared to the other five measures. Similar results are shown in Figure 2 (where ), which proves that is the most accurate measure in identifying the influential spreaders.
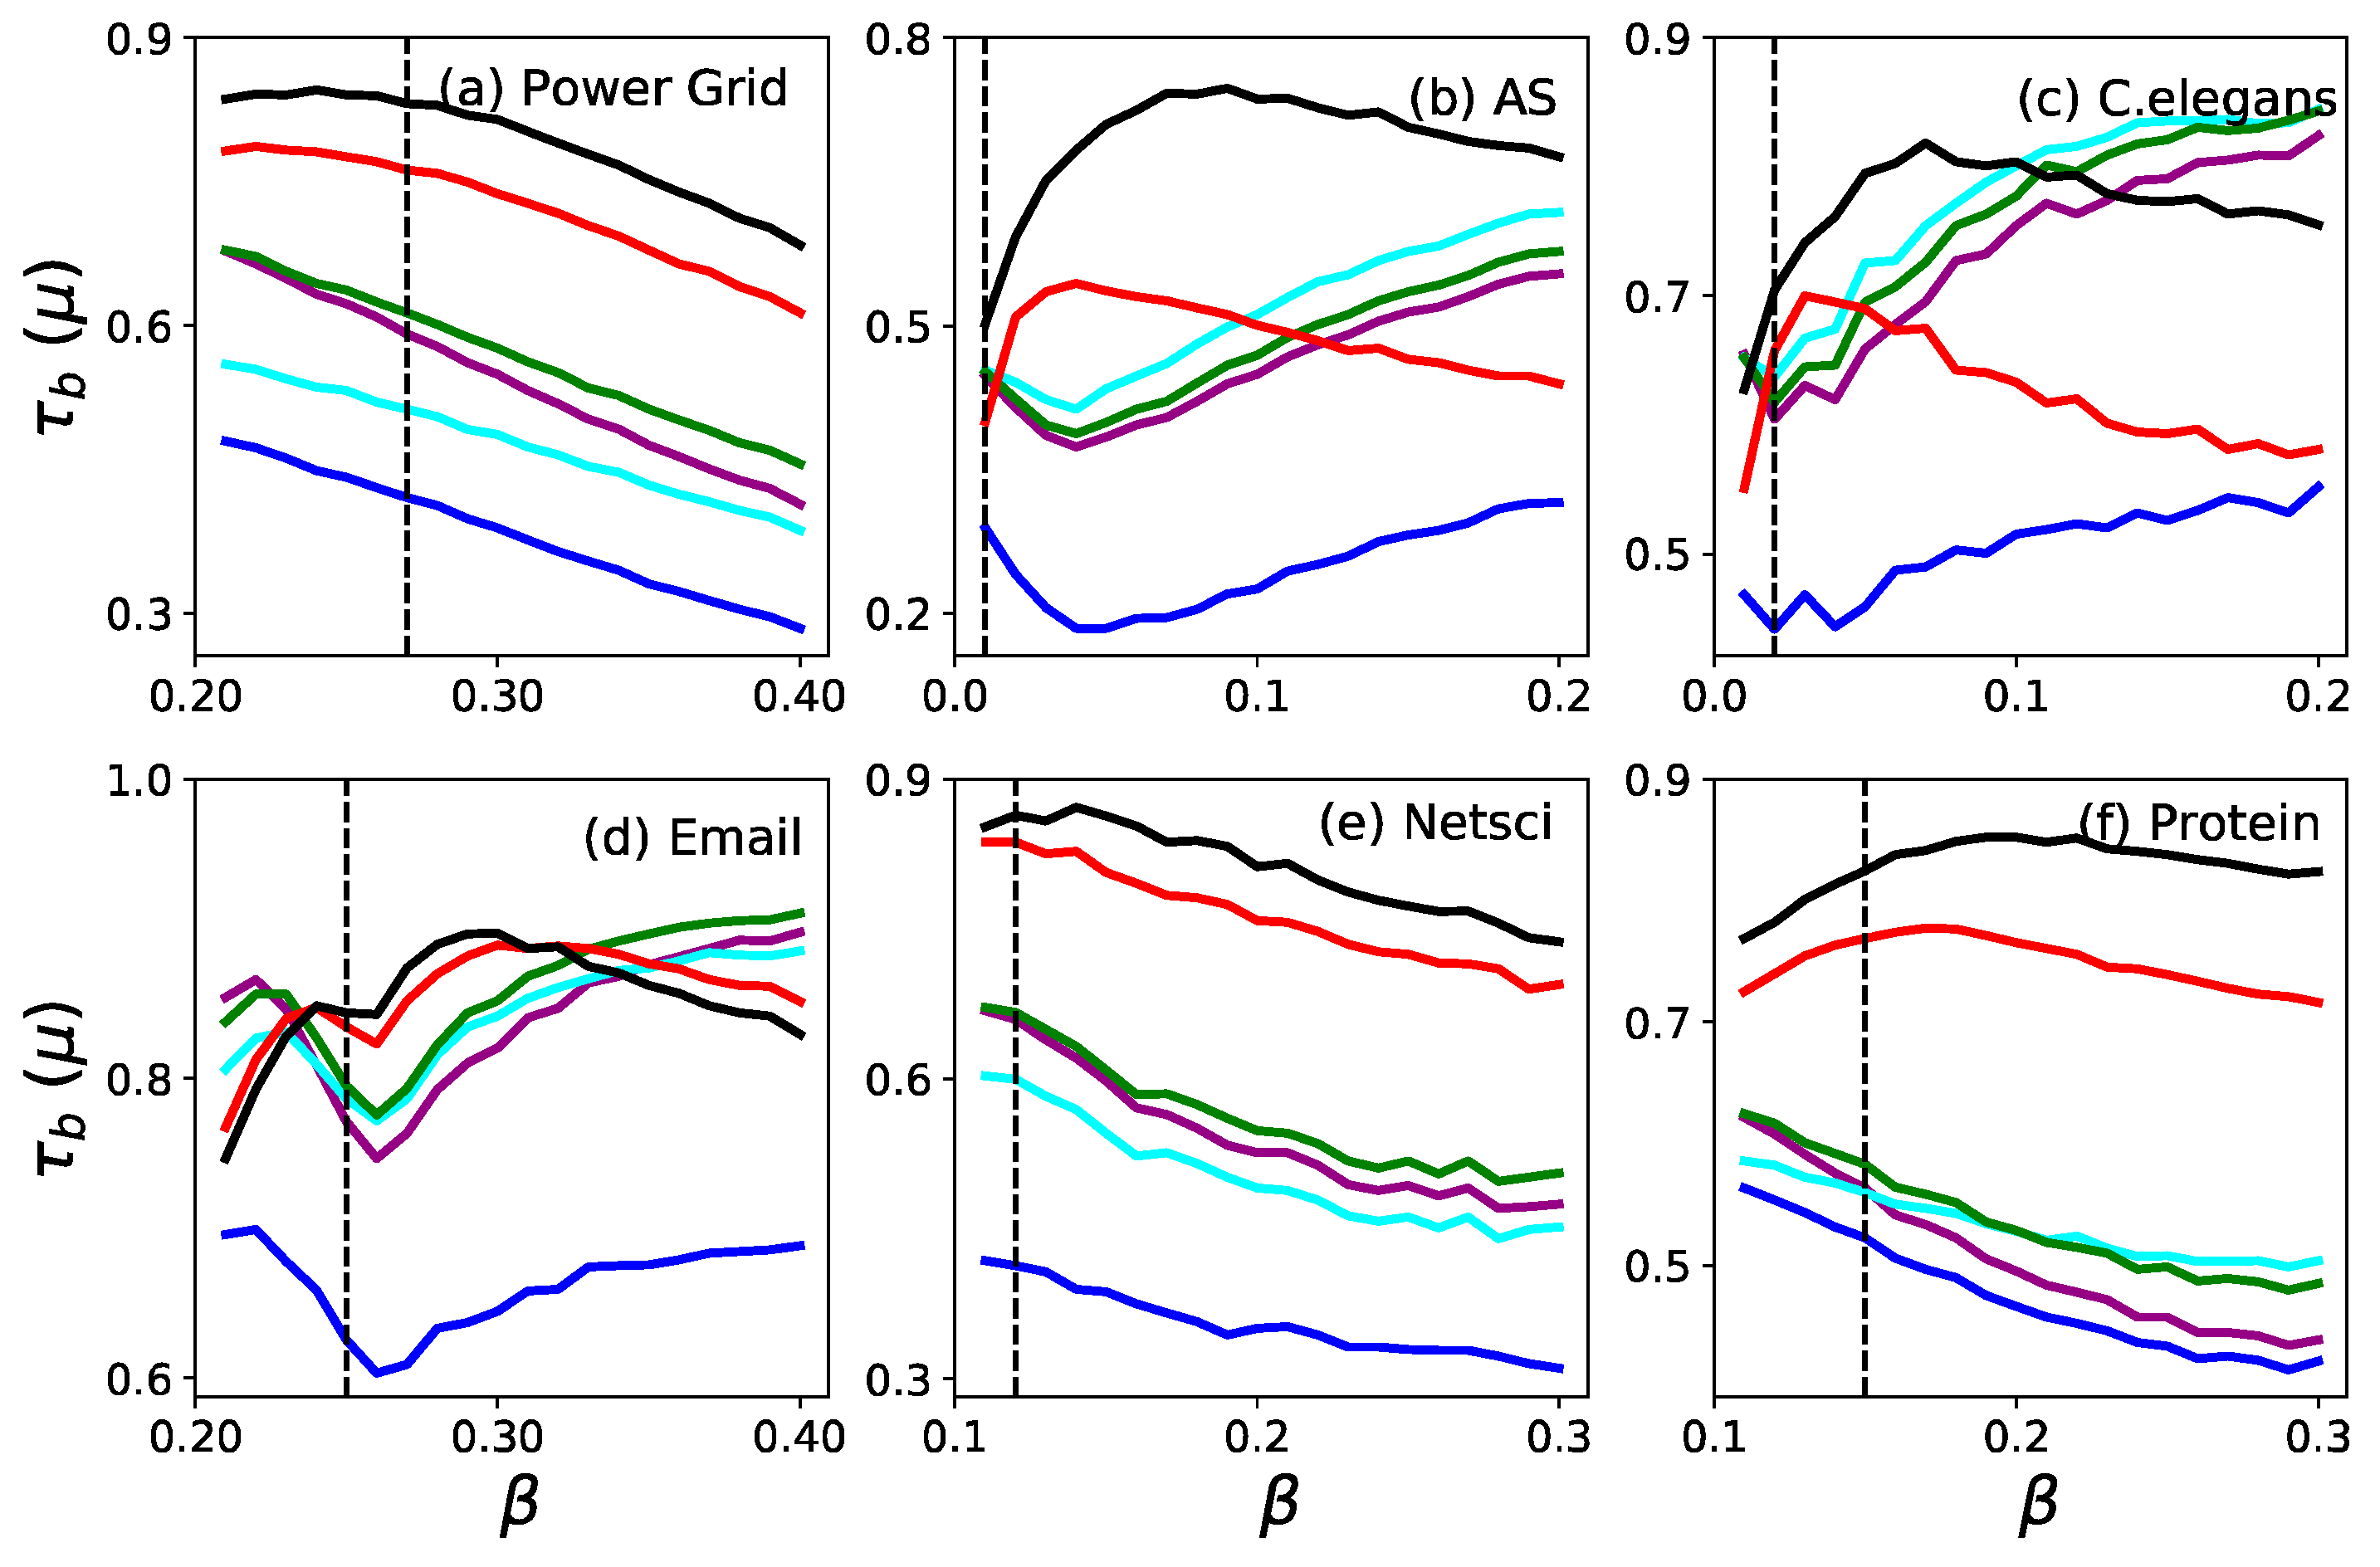
To investigate the robustness of the accuracy of the ranking based on the proposed measures, we show the Kendall correlation coefficient as a function of the infection probability on six selected real networks in Figure 3. When the infection probability is set around , and show a significantly higher robustness of accuracy. For Power Grid, NetSci and Protein networks in the whole range of , is more accurate than , and they are both more accurate than the other four measures. When , the spreading is typically confined to the neighborhood of the initially infected seed node. Since the seed node with a larger degree has a relatively larger neighborhood, it will infect more nodes than other seed nodes with a smaller degree. This is why degree () always achieves the most significant values when for C. elegans and Email. When is increasing, and perform better gradually. The results in Figure 3 demonstrate that is a better measure of the ranking’s robustness for identifying the influential spreaders in a network.
3.2. Monotonicity
Table 4 shows the monotonicity of the ranking based on six measures. For all the networks, ranking nodes based on achieve the best performance, and gets the second best performance. Both and are more competitive measures than , , , and from monotonicity’s perspective in the global scale of a network.
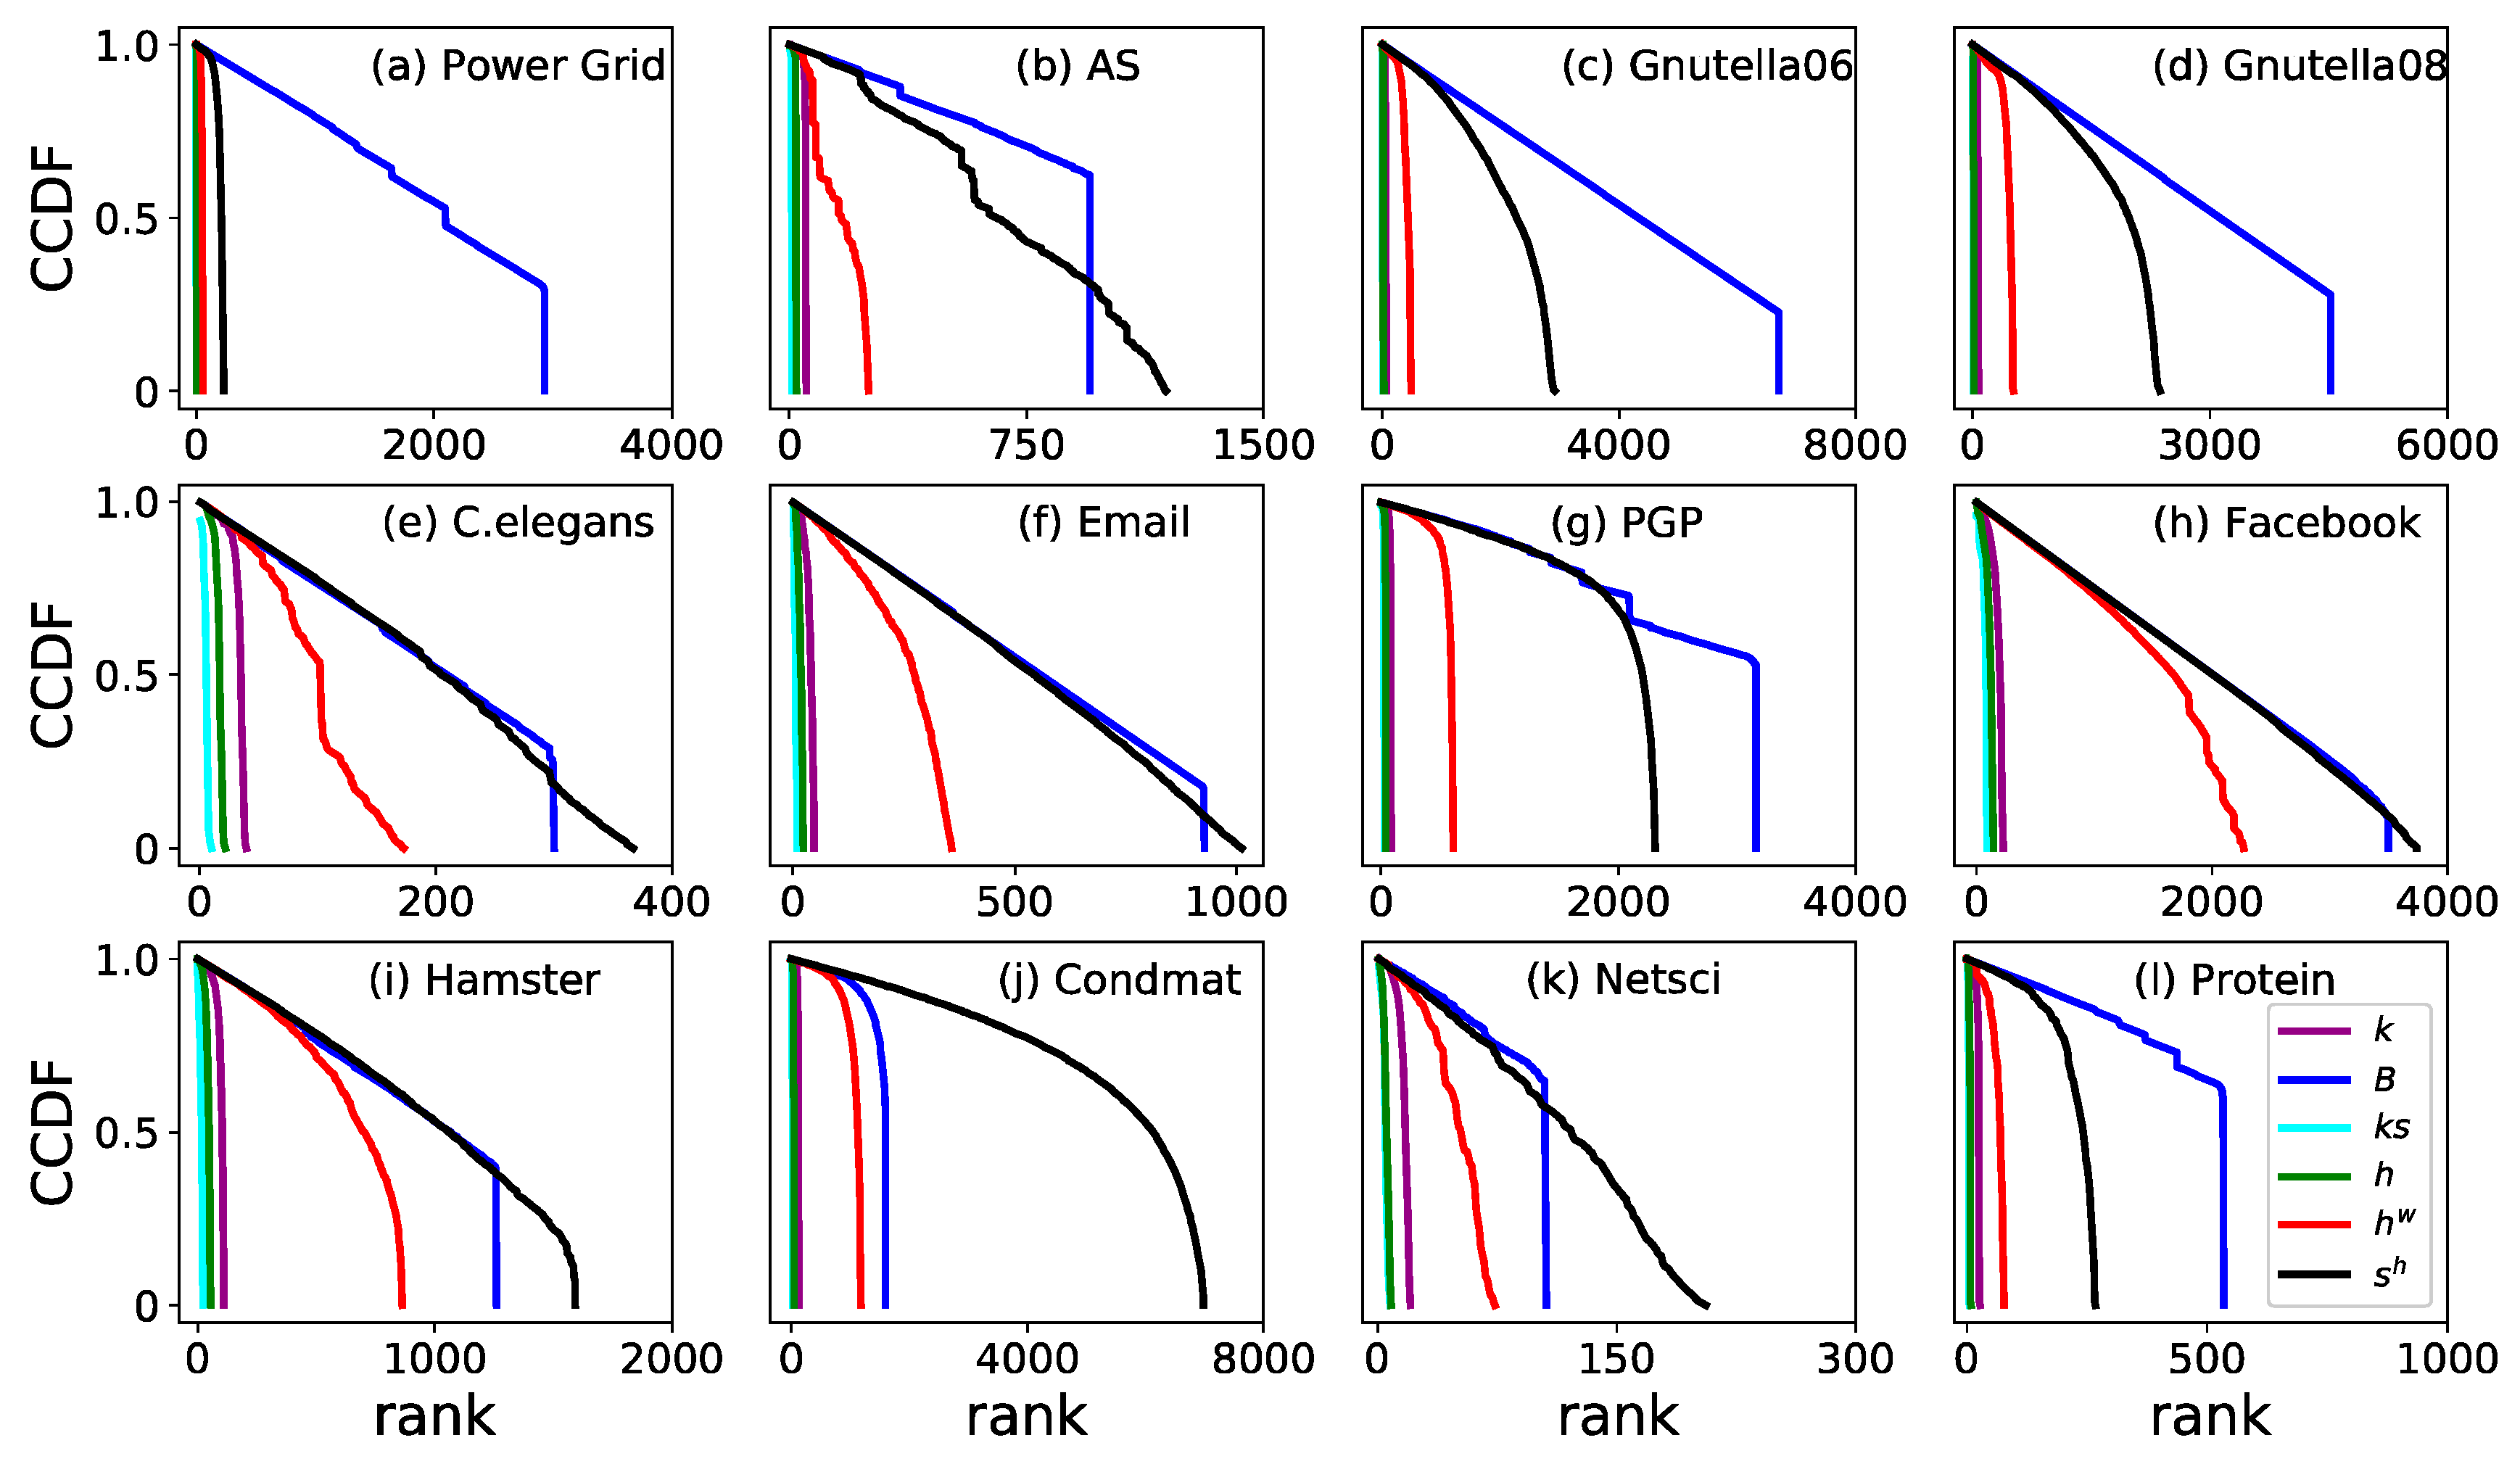
To depict the monotonicity in the local scale of a network, the node distribution between ranks is plotted by the complementary cumulative distribution function (CCDF) in Figure 4. The more monotonic a measure is, the slower the distribution in CCDF decreases, and the more significant in distinguishing influential spreaders (nodes). In all twelve real networks, , , and drop quickly at the left beginning, which means that they are poor at distinguishing nodes from each other based on the spreading influence. decreases slower than , and both and are slower than , , and in all twelve real networks.
Undoubtedly, has a competitive performance compared with and . For the five real networks including Power Grid, PGP, Gnutella06, Gnutella08, and Protein, decreases slower than and , which means that shows better monotonicity than and . For the other seven networks, always has the best monotonicity. AS is a typical example (Figure 4b), where decreases slower than at the beginning. However, the black line () goes across the blue line (), which means that ranking nodes by will distinguish nodes into more different ranks, and proves that has a better monotonicity than .
4. Discussion
Spreading like an epidemic, information is a ubiquitous process in social, biological, and technological networks. Identifying influential nodes in the spreading process, as one of the primary problems in network science, remains an open issue. In this study, we propose the weighted h-index and the h-index strength to identify the influential nodes in the spreading process on complex networks. To evaluate the accuracy and monotonicity of the proposed measures, the single seed SIR model was employed and simulated on twelve real networks. The results show that compared to the four previous measures, h-index strength, , was the best measure and weighted h-index, , was the second best measure to identify the influential nodes in single seed SIR spreading process.
Although the weighted h-index and the h-index strength perform better in most of the conditions, the insufficient monotonicity of the local scale of a network cannot be neglected. The issue of how to improve monotonicity in the local scale of a network requires further studies. Since we only extended a weighted edge to virtual edges according to the degree of the incident neighbor node, how to determine a proper neighborhood range is another noteworthy topic for the future.
Note that the criteria for essential nodes are diverse. For example, the node acts as an articulation point, damage to which will destroy a network into two or more components, and it may therefore be totally unimportant in the spreading process. Although the proposed measures are outstanding in identifying the vital node for the single seed SIR spreading process, it is necessary to conduct further experiments, if one wishes to apply our methods to other situations.
Author Contributions
Conceptualization, Z.G.; methodology, L.G., S.Y., M.L., Z.S. and Z.G.; investigation, L.G. and S.Y.; writing—original draft preparation, L.G. and S.Y.; writing—review and editing, M.L. and Z.S.; supervision, L.G.; funding acquisition, L.G., M.L. and Z.G.
Funding
The authors thank for support from the Fundamental Research Funds for the Central Universities (2015JBM058).
Acknowledgments
L.G. and S.Y. are partially supported by the National Natural Science Foundation of China (No.71571017, No.91646124, No.71621001, and No. 91746201). M.L. is partially supported by the National Natural Science Foundation of China (No. 71974017). Z.G. is partially supported by the National Natural Science Foundation of China (No. 71621001).
Conflicts of Interest
The authors declare no conflict of interest.
References
- Motter, A.E. Cascade control and defense in complex networks. Phys. Rev. Lett. 2004, 93, 098701. [Google Scholar] [CrossRef] [PubMed]
- Moreno, Y.; Nekovee, M.; Pacheco, A.F. Dynamics of rumor spreading in complex networks. Phys. Rev. E 2004, 69, 066130. [Google Scholar] [CrossRef] [PubMed] [Green Version]
- Leskovec, J.; Adamic, L.A.; Huberman, B.A. The dynamics of viral marketing. ACM Trans. Web 2007, 1, 5. [Google Scholar] [CrossRef]
- Shen, Z.; Wang, W.; Fan, Y.; Di, Z.; Lai, Y.C. Reconstructing propagation networks with natural diversity and identifying hidden sources. Nat. Commun. 2014, 5, 4323. [Google Scholar] [CrossRef] [PubMed] [Green Version]
- Shen, Z.; Cao, S.; Wang, W.; Di, Z.; Stanley, H.E. Locating the source of diffusion in complex networks by time-reversal backward spreading. Phys. Rev. E 2016, 93, 032301. [Google Scholar] [CrossRef] [Green Version]
- Gao, L.; Gao, G.; Ma, D.; Xu, L. Coreness variation rule and fast updating algorithm for dynamic networks. Symmetry 2019, 11, 477. [Google Scholar] [CrossRef]
- Gao, L.; Shan, X.; Qin, Y.; Yu, S.; Xu, L.; Gao, Z.Y. Scaling tunable network model to reproduce the density-driven superlinear relation. Chaos 2018, 28, 033122. [Google Scholar] [CrossRef]
- Qin, Y.; Zhao, Z.; Cai, S.; Gao, L.; Stanley, H.E. Dual-induced multifractality in online viewing activity. Chaos 2018, 28, 013114. [Google Scholar] [CrossRef] [Green Version]
- Song, J.; Gao, L.; Shan, X. Historical street network GIS datasets of Beijing within 5th ring-road. China Sci. Data 2017, 2, 114. [Google Scholar] [CrossRef]
- Lv, L.Y.; Chen, D.B.; Ren, X.L.; Zhang, Q.M.; Zhang, Y.C.; Zhou, T. Vital nodes identification in complex networks. Phys. Rep. 2016, 650, 1–63. [Google Scholar] [CrossRef] [Green Version]
- Zeng, G.; Li, D.; Guo, S.; Gao, L.; Gao, Z.Y.; Stanley, H.E.; Havlin, S. Switch between critical percolation modes in city traffic dynamics. Proc. Natl. Acad. Sci. USA 2019, 116, 23–28. [Google Scholar] [CrossRef] [PubMed]
- Yu, S.; Gao, L.; Wang, Y.; Xu, L.; Gao, Z.Y. Identifying influential spreaders based on indirect spreading in neighborhood. Physica A 2019, 523, 418–425. [Google Scholar] [CrossRef]
- Albert, R.; Jeong, H.; Barabási, A.-L. Error and attack tolerance of complex networks. Nature 2000, 406, 378–382. [Google Scholar] [CrossRef] [PubMed] [Green Version]
- Pastor-satorras, R.; Vespignani, A. Epidemic spreading in scale-free networks. Phys. Rev. Lett. 2001, 86, 3200–3203. [Google Scholar] [CrossRef] [PubMed]
- Freeman, L.C. A set of measures of centrality based on betweenness. Sociometry 1977, 40, 35–411. [Google Scholar] [CrossRef]
- Katz, L. A new status index derived from sociometric analysis. Psychometrika 1953, 18, 39–43. [Google Scholar] [CrossRef]
- Sabidussi, G. The centrality index of a graph. Psychometrika 1966, 31, 581–603. [Google Scholar] [CrossRef]
- Kitsak, M.; Gallos, L.K.; Havlin, S.; Liljeros, F.; Muchnik, L.; Stanley, H.E.; Makse, H.A. Identification of influential spreaders in complex networks. Nat. Phys. 2010, 6, 888–893. [Google Scholar] [CrossRef] [Green Version]
- Chen, D.B.; Lu, L.Y.; Shang, M.S.; Zhang, Y.-C.; Zhou, T. Identifying influential nodes in complex networks. Physica A 2019, 391, 1777–1787. [Google Scholar] [CrossRef]
- Zeng, A.; Zhang, C.J. Ranking spreaders by decomposing complex networks. Phys. Lett. A 2013, 377, 1031–1035. [Google Scholar] [CrossRef] [Green Version]
- Liu, J.-G.; Ren, Z.-M.; Guo, Q. Ranking the spreading influence in complex networks. Physica A 2013, 392, 4154–4159. [Google Scholar] [CrossRef] [Green Version]
- Bae, J.; Kim, S. Identifying and ranking influential spreaders in complex networks by neighborhood coreness. Physica A 2014, 395, 549–559. [Google Scholar] [CrossRef]
- Wang, Y.; Zhao, J.K.; Xi, C.J.; Du, Z.X. Fast ranking influential nodes in complex networks using a k-shell iteration factor. Physica A 2016, 461, 171–181. [Google Scholar] [CrossRef]
- Xu, S.; Wang, P.; Lü, J.H. Iterative neighbour-information gathering for ranking nodes in complex networks. Sci. Rep. 2017, 7, 41321. [Google Scholar] [CrossRef] [PubMed]
- Liu, Y.; Tang, M.; Zhou, T.; Do, Y.H. Improving the accuracy of the k-shell method by removing redundant links: From a perspective of spreading dynamics. Sci. Rep. 2015, 5, 13172. [Google Scholar] [CrossRef] [PubMed] [Green Version]
- Liu, Y.; Tang, M.; Zhou, T.; Do, Y. Core-like groups result in invalidation of identifying super-spreader by k-shell decomposition. Sci. Rep. 2015, 5, 9602. [Google Scholar] [CrossRef] [Green Version]
- Wang, Z.X.; Du, C.J.; Fan, J.P.; Xing, Y. Ranking influential nodes in social networks based on node position and neighborhood. Neurocomputing 2017, 260, 466–477. [Google Scholar] [CrossRef]
- Yang, F.; Zhang, R.S.; Yang, Z.; Hu, R.J.; Li, M.T.; Yuan, Y.N.; Li, K.Q. Identifying the most influential spreaders in complex networks by an Extended Local K-Shell Sum. Int. J. Mod. Phys. C 2017, 28, 1750014. [Google Scholar] [CrossRef]
- Al-garadi, M.A.; Varathan, K.D.; Ravana, S.D. Identification of influential spreaders in online social networks using interaction weighted K-core decomposition method. Physica A 2017, 468, 278–288. [Google Scholar] [CrossRef]
- Hou, B.N.; Yao, Y.P.; Liao, D.S. Identifying all-around nodes for spreading dynamics in complex networks. Physica A 2012, 391, 4012–4017. [Google Scholar] [CrossRef]
- Ren, Z.M.; Liu, J.-G.; Shao, F.; Hu, Z.-L.; Guo, Q. Analysis of the spreading influence of the nodes with minimum K-shell value in complex networks. Acta. Phys. Sin. 2013, 62, 108902. [Google Scholar] [CrossRef]
- Poulin, R.; Boily, M.-C.; Mâsse, B.R. Dynamical systems to define centrality in social networks. Soc. Netw. 2000, 22, 187–220. [Google Scholar] [CrossRef]
- Estrada, E.; Rodríguez-Velázquez, J.A. Subgraph centrality in complex networks. Phys. Rev. E 2005, 71, 056103. [Google Scholar] [CrossRef] [PubMed] [Green Version]
- Grady, D.; Thiemann, C.; Brockmann, D. Robust classification of salient links in complex networks. Nat. Commun. 2012, 3, 864. [Google Scholar] [CrossRef] [PubMed] [Green Version]
- Opsahl, T.; Agneessens, F.; Skvoretz, J. Node centrality in weighted networks: Generalizing degree and shortest paths. Soc. Netw. 2010, 32, 245–251. [Google Scholar] [CrossRef]
- Chu, X.W.; Zhang, Z.Z.; Guan, J.H.; Zhou, S.G. Epidemic spreading with nonlinear infectivity in weighted scale-free networks. Physica A 2011, 390, 471–481. [Google Scholar] [CrossRef] [Green Version]
- Wei, D.J.; Deng, X.Y.; Zhang, X.G.; Deng, Y.; Mahadevan, S. Identifying influential nodes in weighted networks based on evidence theory. Physica A 2013, 392, 2564–2575. [Google Scholar] [CrossRef]
- Wang, J.Y.; Hou, X.N.; Li, K.Z.; Ding, Y. A novel weight neighborhood centrality algorithm for identifying influential spreaders in complex networks. Physica A 2017, 475, 88–105. [Google Scholar] [CrossRef]
- Liu, Y.; Tang, M.; Do, Y.; Hui, P.M. Accurate ranking of influential spreaders in networks based on dynamically asymmetric link weights. Phys. Rev. E 2017, 96, 022323. [Google Scholar] [CrossRef]
- Lu, L.Y.; Zhou, T.; Zhang, Q.-M.; Stanley, H.E. The H-index of a network node and its relation to degree and coreness. Nat. Commun. 2016, 7, 10168. [Google Scholar] [CrossRef]
- Yu, S.B.; Gao, L.; Wang, Y.-F. Finding the proper node ranking method for complex networks. arXiv 2018, arXiv:1812.10616. [Google Scholar]
- Ma, L.-L.; Ma, C.; Zhang, H.-F.; Wang, B.-H. Identifying influential spreaders in complex networks based on gravity formula. Physica A 2016, 451, 205–212. [Google Scholar] [CrossRef] [Green Version]
- Castellano, C.; Pastor-Satorras, R. Thresholds for epidemic spreading in Networks. Phys. Rev. Lett. 2010, 105, 218701. [Google Scholar] [CrossRef] [PubMed]
- Watts, D.J.; Strogatz, S.H. Collective dynamics of ‘small-world’ networks. Nature 1998, 393, 440–442. [Google Scholar] [CrossRef] [PubMed]
- Duch, J.; Arenas, A. Community identification using extremal optimization. Phys. Rev. E 2005, 72, 027104. [Google Scholar] [CrossRef] [PubMed]
- Guimerà, R.; Danon, L.; Díaz-Guilera, A.; Giralt, F.; Arenas, A. Self-similar community structure in a network of human interactions. Phys. Rev. E 2003, 68, 065103. [Google Scholar] [CrossRef] [PubMed] [Green Version]
- Boguñá, M.; Pastor-Satorras, R.; Díaz-Guilera, A.; Arenas, A. Models of social networks based on social distance attachment. Phys. Rev. E 2004, 70, 056122. [Google Scholar] [CrossRef] [Green Version]
- Leskovec, J.; McAuley, J.J. Learning to discover social circles in ego networks. In Proceedings of the 25th International Conference on Neural Information Processing Systems—Volume 1, Lake Tahoe, NV, USA, 3–6 December 2012; pp. 539–547. [Google Scholar]
- Kunegis, J. Hamsterster Full Network Dataset. KONECT. 2015. Available online: http://konect.uni-koblenz.de/networks/petster-hamster (accessed on 1 October 2018).
- Leskovec, J.; Kleinberg, J.; Faloutsos, C. Graph evolution: Densification and shrinking diameters. ACM Trans. Knowl. Discov. Data 2007, 1, 1556–4681. [Google Scholar] [CrossRef]
- Newman, M.E.J. Finding community structure in networks using the eigenvectors of matrices. Phys. Rev. E 2006, 74, 036104. [Google Scholar] [CrossRef] [Green Version]
- Jeong, H.; Mason, S.P.; Barabási, A.-L.; Oltvai, Z.N. Lethality and centrality in protein networks. Nature 2001, 411, 41–42. [Google Scholar] [CrossRef] [Green Version]
Figure 1.
The imprecision functions as a function of node fraction when in the twelve real networks. The six measures are (purple), (blue), (cyan), (green), (red) and (black).
Figure 1.
The imprecision functions as a function of node fraction when in the twelve real networks. The six measures are (purple), (blue), (cyan), (green), (red) and (black).

Figure 2.
The imprecision functions as a function of node fraction when in the twelve real networks. The six measures are (purple), (blue), (cyan), (green), (red) and (black).
Figure 2.
The imprecision functions as a function of node fraction when in the twelve real networks. The six measures are (purple), (blue), (cyan), (green), (red) and (black).

Figure 3.
Kendall correlation coefficient as a function of the infection probability for six real networks. The vertical dash line shows the critical infection rate . The six measures are (purple), (blue), (cyan), (green), (red) and (black).
Figure 3.
Kendall correlation coefficient as a function of the infection probability for six real networks. The vertical dash line shows the critical infection rate . The six measures are (purple), (blue), (cyan), (green), (red) and (black).

Figure 4.
Complementary cumulative distribution function (CCDF) of ranking by six different measures. Six measures are (purple), (blue), (cyan), (green), (red) and (black).
Figure 4.
Complementary cumulative distribution function (CCDF) of ranking by six different measures. Six measures are (purple), (blue), (cyan), (green), (red) and (black).


Table 1.
Properties of twelve real networks. : the number of nodes, : the number of edges, : the critical infection rate for single seed SIR model, : the average degree, : the maximum degree, and : the maximum k-shell index.
Table 1.
Properties of twelve real networks. : the number of nodes, : the number of edges, : the critical infection rate for single seed SIR model, : the average degree, : the maximum degree, and : the maximum k-shell index.
| Network | ||||||
|---|---|---|---|---|---|---|
| Power Grid | 4941 | 6594 | 0.26 | 2.6691 | 19 | 5 |
| AS | 3015 | 5156 | 0.01 | 3.4202 | 590 | 9 |
| Gnutella06 | 8717 | 31,525 | 0.07 | 7.2330 | 115 | 9 |
| Gnutella08 | 6301 | 20,777 | 0.06 | 6.5948 | 97 | 10 |
| C. elegans | 453 | 2025 | 0.02 | 8.9404 | 237 | 10 |
| 1133 | 5451 | 0.05 | 9.6222 | 71 | 11 | |
| PGP | 10,680 | 24,316 | 0.05 | 4.5536 | 205 | 31 |
| 4039 | 88,234 | 0.01 | 43.6910 | 1045 | 115 | |
| Hamster | 2426 | 16,630 | 0.02 | 13.7098 | 273 | 24 |
| CondMat | 23,133 | 93,497 | 0.05 | 8.0830 | 279 | 25 |
| NetSci | 379 | 914 | 0.12 | 4.8232 | 34 | 9 |
| Protein | 1870 | 2203 | 0.15 | 2.3562 | 56 | 5 |
Table 2.
Kendall correlation coefficient for six measures in twelve real networks. In the single seed SIR model, the infection probability is set to slightly larger than , i.e., . The largest in each row is marked in boldface.
Table 2.
Kendall correlation coefficient for six measures in twelve real networks. In the single seed SIR model, the infection probability is set to slightly larger than , i.e., . The largest in each row is marked in boldface.
| Network | ||||||
|---|---|---|---|---|---|---|
| Power Grid | 0.6020 | 0.4238 | 0.5142 | 0.6177 | 0.7466 | 0.8060 |
| AS | 0.4478 | 0.2896 | 0.4540 | 0.4522 | 0.3999 | 0.5023 |
| Gnutella06 | 0.6715 | 0.6393 | 0.6811 | 0.6940 | 0.7206 | 0.7578 |
| Gnutella08 | 0.6549 | 0.5987 | 0.6887 | 0.6913 | 0.7139 | 0.7527 |
| C. elegans | 0.5729 | 0.4361 | 0.5969 | 0.5820 | 0.5868 | 0.6289 |
| 0.7222 | 0.5862 | 0.7486 | 0.7483 | 0.7694 | 0.7868 | |
| PGP | 0.6027 | 0.4160 | 0.5707 | 0.6051 | 0.6481 | 0.6566 |
| 0.6818 | 0.4491 | 0.7135 | 0.7074 | 0.7320 | 0.7575 | |
| Hamster | 0.7477 | 0.5773 | 0.7378 | 0.7523 | 0.8390 | 0.8383 |
| CondMat | 0.6158 | 0.3884 | 0.6337 | 0.6432 | 0.7312 | 0.7564 |
| NetSci | 0.6391 | 0.4071 | 0.5830 | 0.6499 | 0.8256 | 0.8592 |
| Protein | 0.5642 | 0.5227 | 0.5598 | 0.5835 | 0.7690 | 0.8246 |
Table 3.
Kendall correlation coefficient for six measures in twelve real networks. In the single seed SIR model, the infection probability is . The largest in each row is marked in boldface.
Table 3.
Kendall correlation coefficient for six measures in twelve real networks. In the single seed SIR model, the infection probability is . The largest in each row is marked in boldface.
| Network | ||||||
|---|---|---|---|---|---|---|
| Power Grid | 0.4241 | 0.2921 | 0.3987 | 0.4646 | 0.6206 | 0.6893 |
| AS | 0.4148 | 0.2409 | 0.4412 | 0.4237 | 0.5091 | 0.5927 |
| Gnutella06 | 0.8135 | 0.7626 | 0.8073 | 0.8438 | 0.8599 | 0.8645 |
| Gnutella08 | 0.7214 | 0.6597 | 0.7525 | 0.7627 | 0.7844 | 0.8254 |
| C. elegans | 0.5759 | 0.4137 | 0.6140 | 0.5867 | 0.6355 | 0.6842 |
| 0.7738 | 0.6171 | 0.7964 | 0.8050 | 0.8438 | 0.8601 | |
| PGP | 0.5153 | 0.3500 | 0.5118 | 0.5287 | 0.6575 | 0.7099 |
| 0.6220 | 0.4251 | 0.6660 | 0.6526 | 0.7353 | 0.7875 | |
| Hamster | 0.7151 | 0.5727 | 0.7110 | 0.7232 | 0.8484 | 0.8745 |
| CondMat | 0.6051 | 0.3942 | 0.6316 | 0.6422 | 0.7714 | 0.8152 |
| NetSci | 0.5335 | 0.3443 | 0.5019 | 0.5609 | 0.7747 | 0.8330 |
| Protein | 0.4718 | 0.4466 | 0.5147 | 0.5103 | 0.7452 | 0.8429 |
Table 4.
The monotonicity of node ranking based on six measures was applied to twelve real networks.
Table 4.
The monotonicity of node ranking based on six measures was applied to twelve real networks.
| Network | ||||||
|---|---|---|---|---|---|---|
| Power Grid | 0.5927 | 0.8322 | 0.2460 | 0.4776 | 0.8523 | 0.9606 |
| AS | 0.4506 | 0.3728 | 0.3734 | 0.4336 | 0.9557 | 0.9803 |
| Gnutella06 | 0.8110 | 0.8990 | 0.5625 | 0.7945 | 0.9738 | 0.9986 |
| Gnutella08 | 0.7636 | 0.8511 | 0.5990 | 0.7575 | 0.9644 | 0.9979 |
| C. elegans | 0.7922 | 0.8743 | 0.6962 | 0.7599 | 0.9301 | 0.9961 |
| 0.8874 | 0.9400 | 0.8088 | 0.8661 | 0.9914 | 0.9996 | |
| PGP | 0.6193 | 0.5099 | 0.4806 | 0.5836 | 0.9495 | 0.9920 |
| 0.9740 | 0.9855 | 0.9419 | 0.9674 | 0.9838 | 0.9998 | |
| Hamster | 0.8980 | 0.7128 | 0.8714 | 0.8892 | 0.9796 | 0.9854 |
| CondMat | 0.8524 | 0.4506 | 0.7980 | 0.8268 | 0.9863 | 0.9974 |
| NetSci | 0.7642 | 0.3387 | 0.6421 | 0.6976 | 0.9472 | 0.9907 |
| Protein | 0.4264 | 0.4053 | 0.2534 | 0.3825 | 0.9084 | 0.9563 |
© 2019 by the authors. Licensee MDPI, Basel, Switzerland. This article is an open access article distributed under the terms and conditions of the Creative Commons Attribution (CC BY) license (http://creativecommons.org/licenses/by/4.0/).
Share and Cite
MDPI and ACS Style
Gao, L.; Yu, S.; Li, M.; Shen, Z.; Gao, Z. Weighted h-index for Identifying Influential Spreaders. Symmetry 2019, 11, 1263. https://0-doi-org.brum.beds.ac.uk/10.3390/sym11101263
AMA Style
Gao L, Yu S, Li M, Shen Z, Gao Z. Weighted h-index for Identifying Influential Spreaders. Symmetry. 2019; 11(10):1263. https://0-doi-org.brum.beds.ac.uk/10.3390/sym11101263
Chicago/Turabian StyleGao, Liang, Senbin Yu, Menghui Li, Zhesi Shen, and Ziyou Gao. 2019. "Weighted h-index for Identifying Influential Spreaders" Symmetry 11, no. 10: 1263. https://0-doi-org.brum.beds.ac.uk/10.3390/sym11101263
Note that from the first issue of 2016, this journal uses article numbers instead of page numbers. See further details here.