Article

Agglomeration Economies: An Analysis of the Determinants of Employment in the Cities of Ecuador

by
Tania Paola Torres-Gutiérrez
1,
Ronny Correa-Quezada
1,
José Álvarez-García
2,* and
María de la Cruz del Río-Rama
3
1
Department of Economics, Universidad Técnica Particular de Loja (UTPL), 11-01-608 Loja, Ecuador
2
Financial Economy and Accounting Department, Faculty of Business, Finance and Tourism, University of Extremadura, 10071 Cáceres, Spain
3
Business Management and Marketing Department, Faculty of Business Sciences and Tourism, University of Vigo, 32004 Ourense, Spain
*
Author to whom correspondence should be addressed.
Submission received: 18 September 2019 / Revised: 6 November 2019 / Accepted: 11 November 2019 / Published: 16 November 2019

Abstract

:
The objective of this investigation is to study the role of agglomeration economies (manufacturing) in urban employment growth, as a proxy for economic growth, between 1980 and 2010 in Ecuador. The three measures of agglomeration-specialization, diversity, and density-are tested to determine their effect on employment growth in industries. The empirical analysis is based on firm- and city-level data from manufacturing activities. A model is proposed to estimate the effect of agglomeration economies on the growth of employment and a regression is conducted using instrumental variables. In particular, the two-stage least squares (2SLS) estimator is used. We conclude that localization economies measured by a specialization index have a positive impact on the growth of employment in the period analyzed. The results are similar to those obtained by other work carried out both in developed and developing countries.

1. Introduction

The growing concentrations of people and production in space has been one of the characteristics of economic growth in recent decades, hence, the renewed academic interest in urban phenomena. Populations and companies tend to prefer being located in places where physical proximity with other people and firms presents significant benefits, which are known as economies of agglomeration [1,2,3,4,5,6,7]. This concept goes back to Marshall [8], who observed that the location of firms in areas with a high concentration of firms in the same sector brought advantages, such as the availability of skilled labor, the availability of intermediate goods, and the ease of exchanging knowledge about products, processes, and innovations.
There is a broad consensus in the literature about the importance of agglomeration economies for productivity and economic growth [9,10,11,12,13,14,15,16,17,18,19]. In fact, the heterogeneity of urban growth is interpreted as the result of different levels of productivity, which, in turn, are influenced by the size of cities. These cities, according to the World Bank [20], are home to 54% of the world’s population and generate more than 80% of the world’s gross domestic product, which poses enormous challenges for cities, given that when the agglomeration economies emerge, spatial inequalities also emerge.
Traditionally, two types of agglomeration economies are distinguished: localization economies, which operate mainly within a specific sector; and urbanization economies, which operate through the whole of economic activity [21]. The benefits (and costs) of localization and urbanization are collectively referred to as external economies (diseconomies), because they arise outside the company. This work only focuses on the benefits of external economies of scale or economies of agglomeration in manufacturing (localization economies and urbanization economies).
Based on the aforementioned typology, the most recent empirical analyzes estimate the impact of external economies on the local results of productivity and wages [11,22,23,24,25]; however, studies related to employment and location decisions are also present. A large body of literature seeks to quantify such effects in different countries and geographic scales. The results support the presence of positive effects in urban growth of diversity (economic concentration of a market) and competition [26,27,28,29], while the results with respect to specialization are more ambiguous [13,30,31,32,33].
In terms of employment as a measure of urban growth, the expected incidence of localization and urbanization externalities is strongly dependent on the context and sector of analysis. Regarding density, a positive impact is expected given that geographic proximity facilitates the presence of micro-fundamentals: sharing, matching, and learning [34], that lead the economies of agglomeration. Regarding the average size of firms, this is also expected to explain employment positively given that these factors are inherent to internal economies of scale [26]. However, regarding the developing countries, and Latin American countries in particular, the existing evidence is very limited, so this study is a significant contribution in this regard.
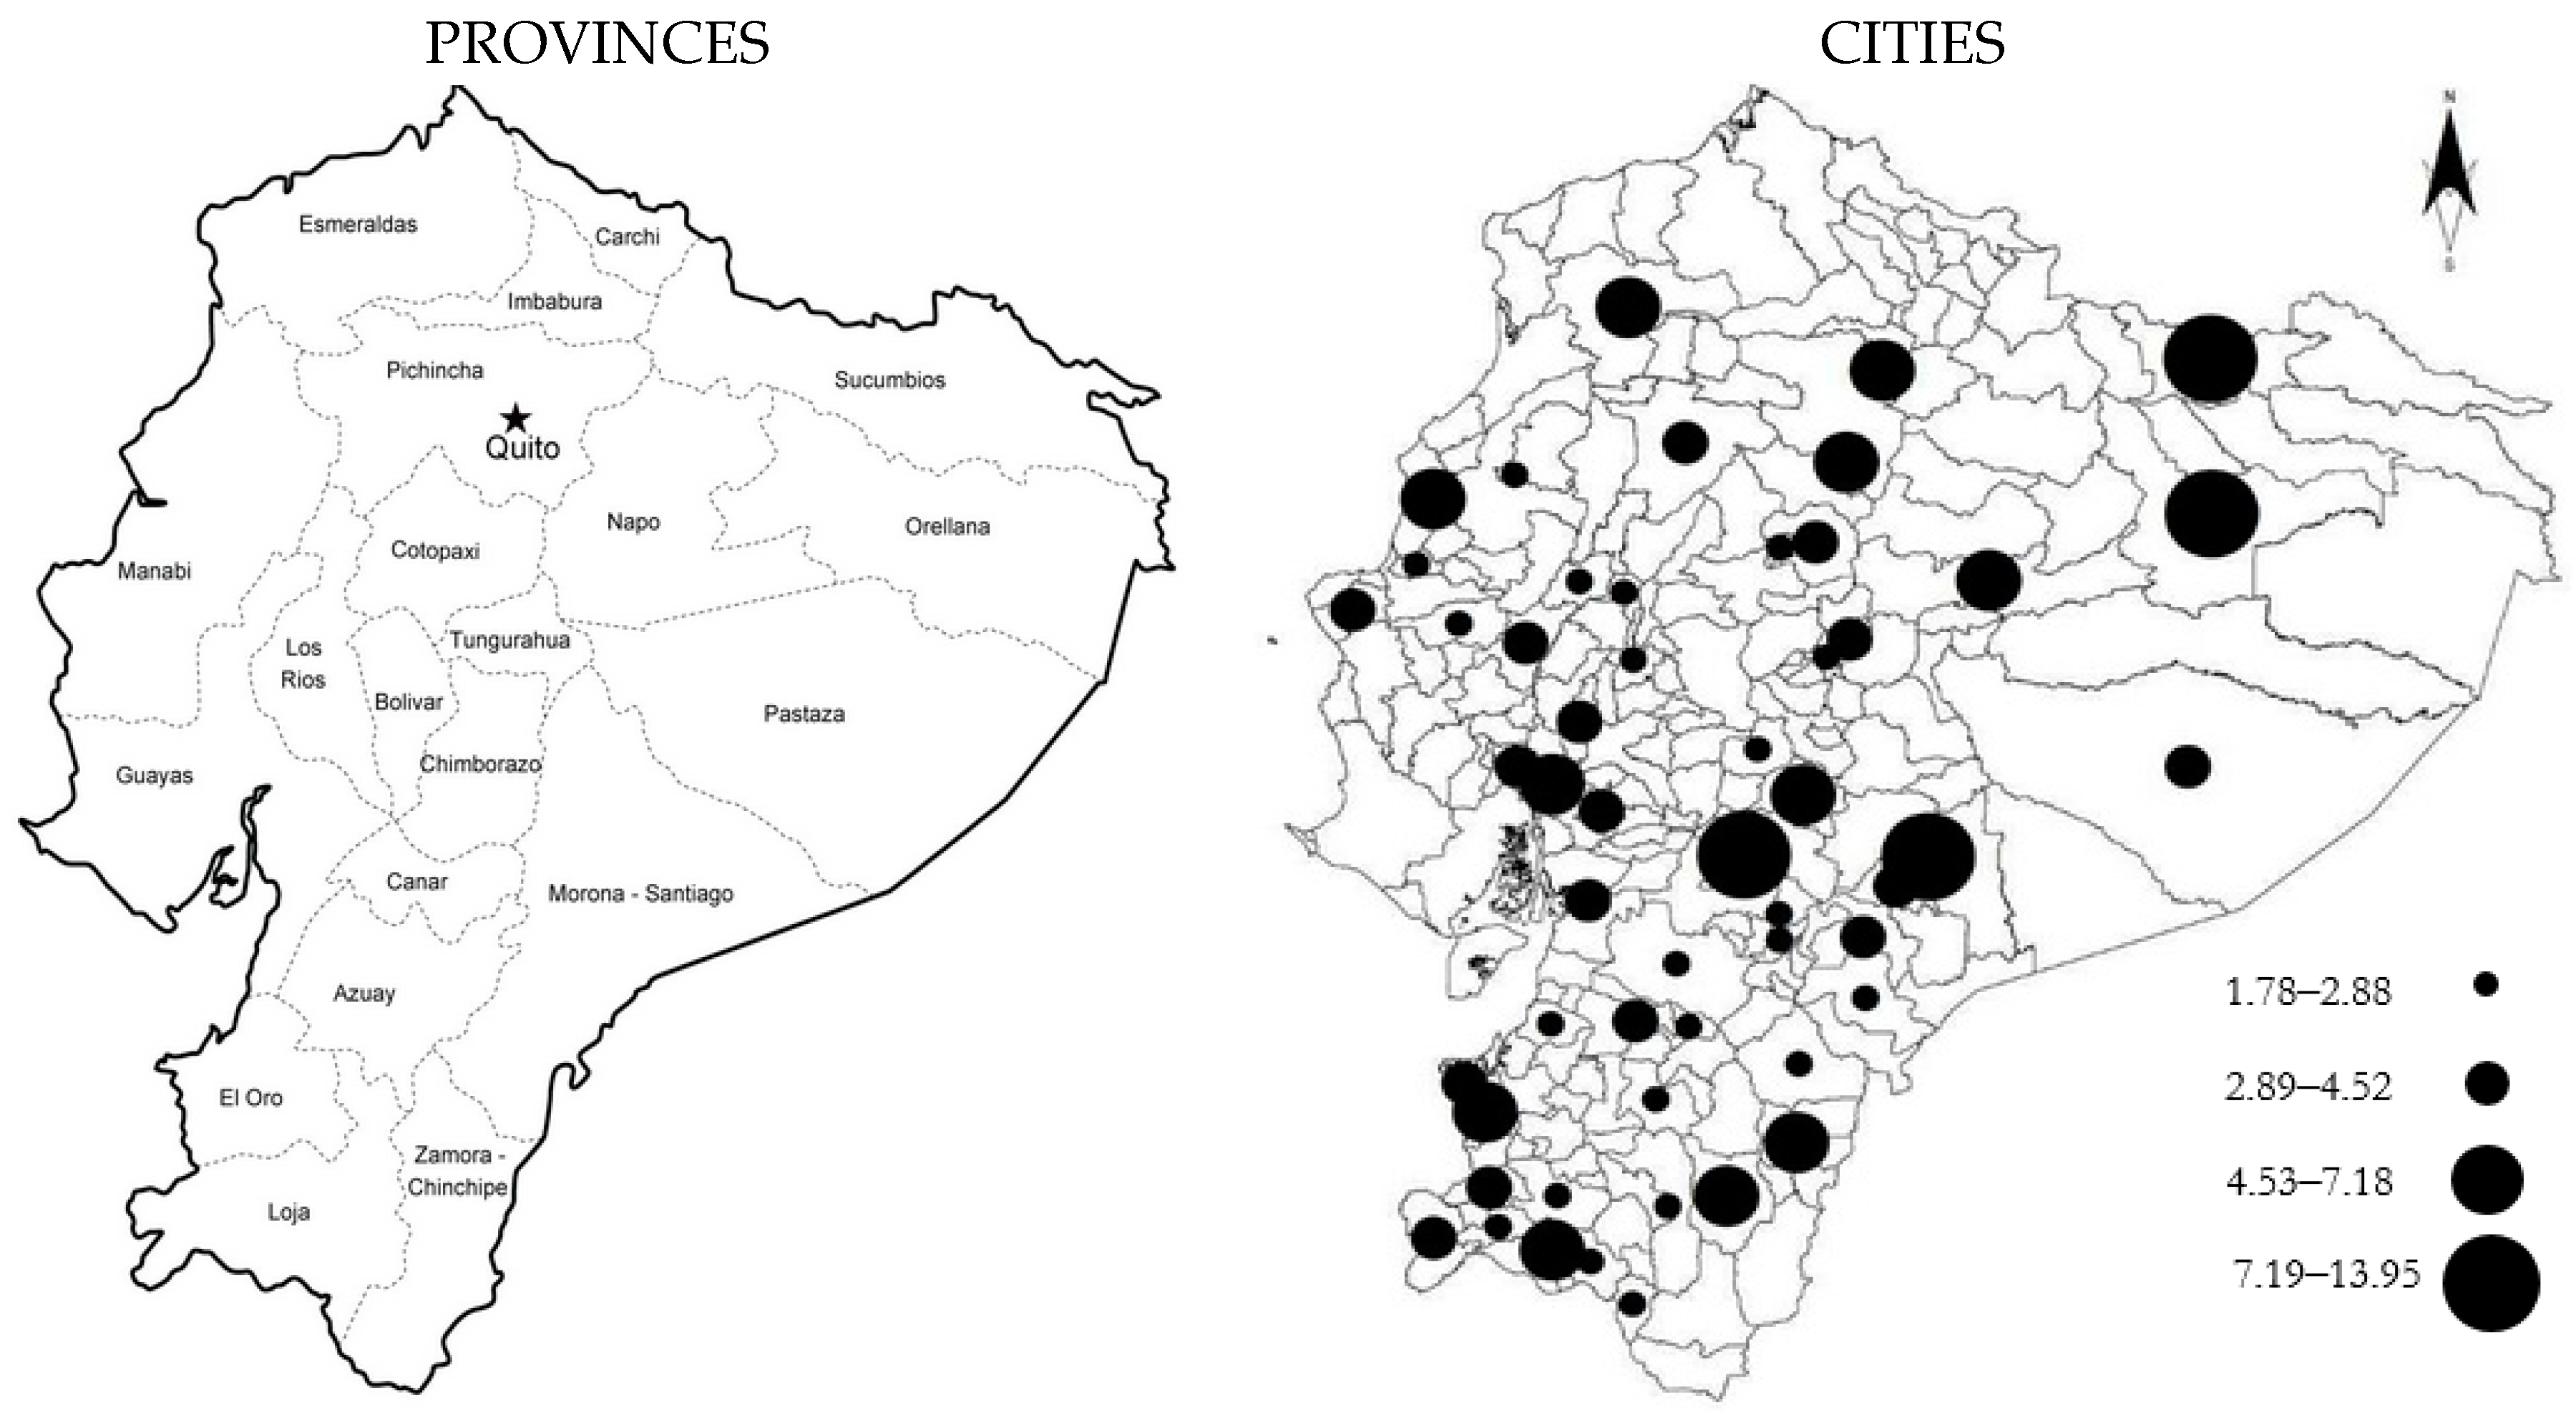
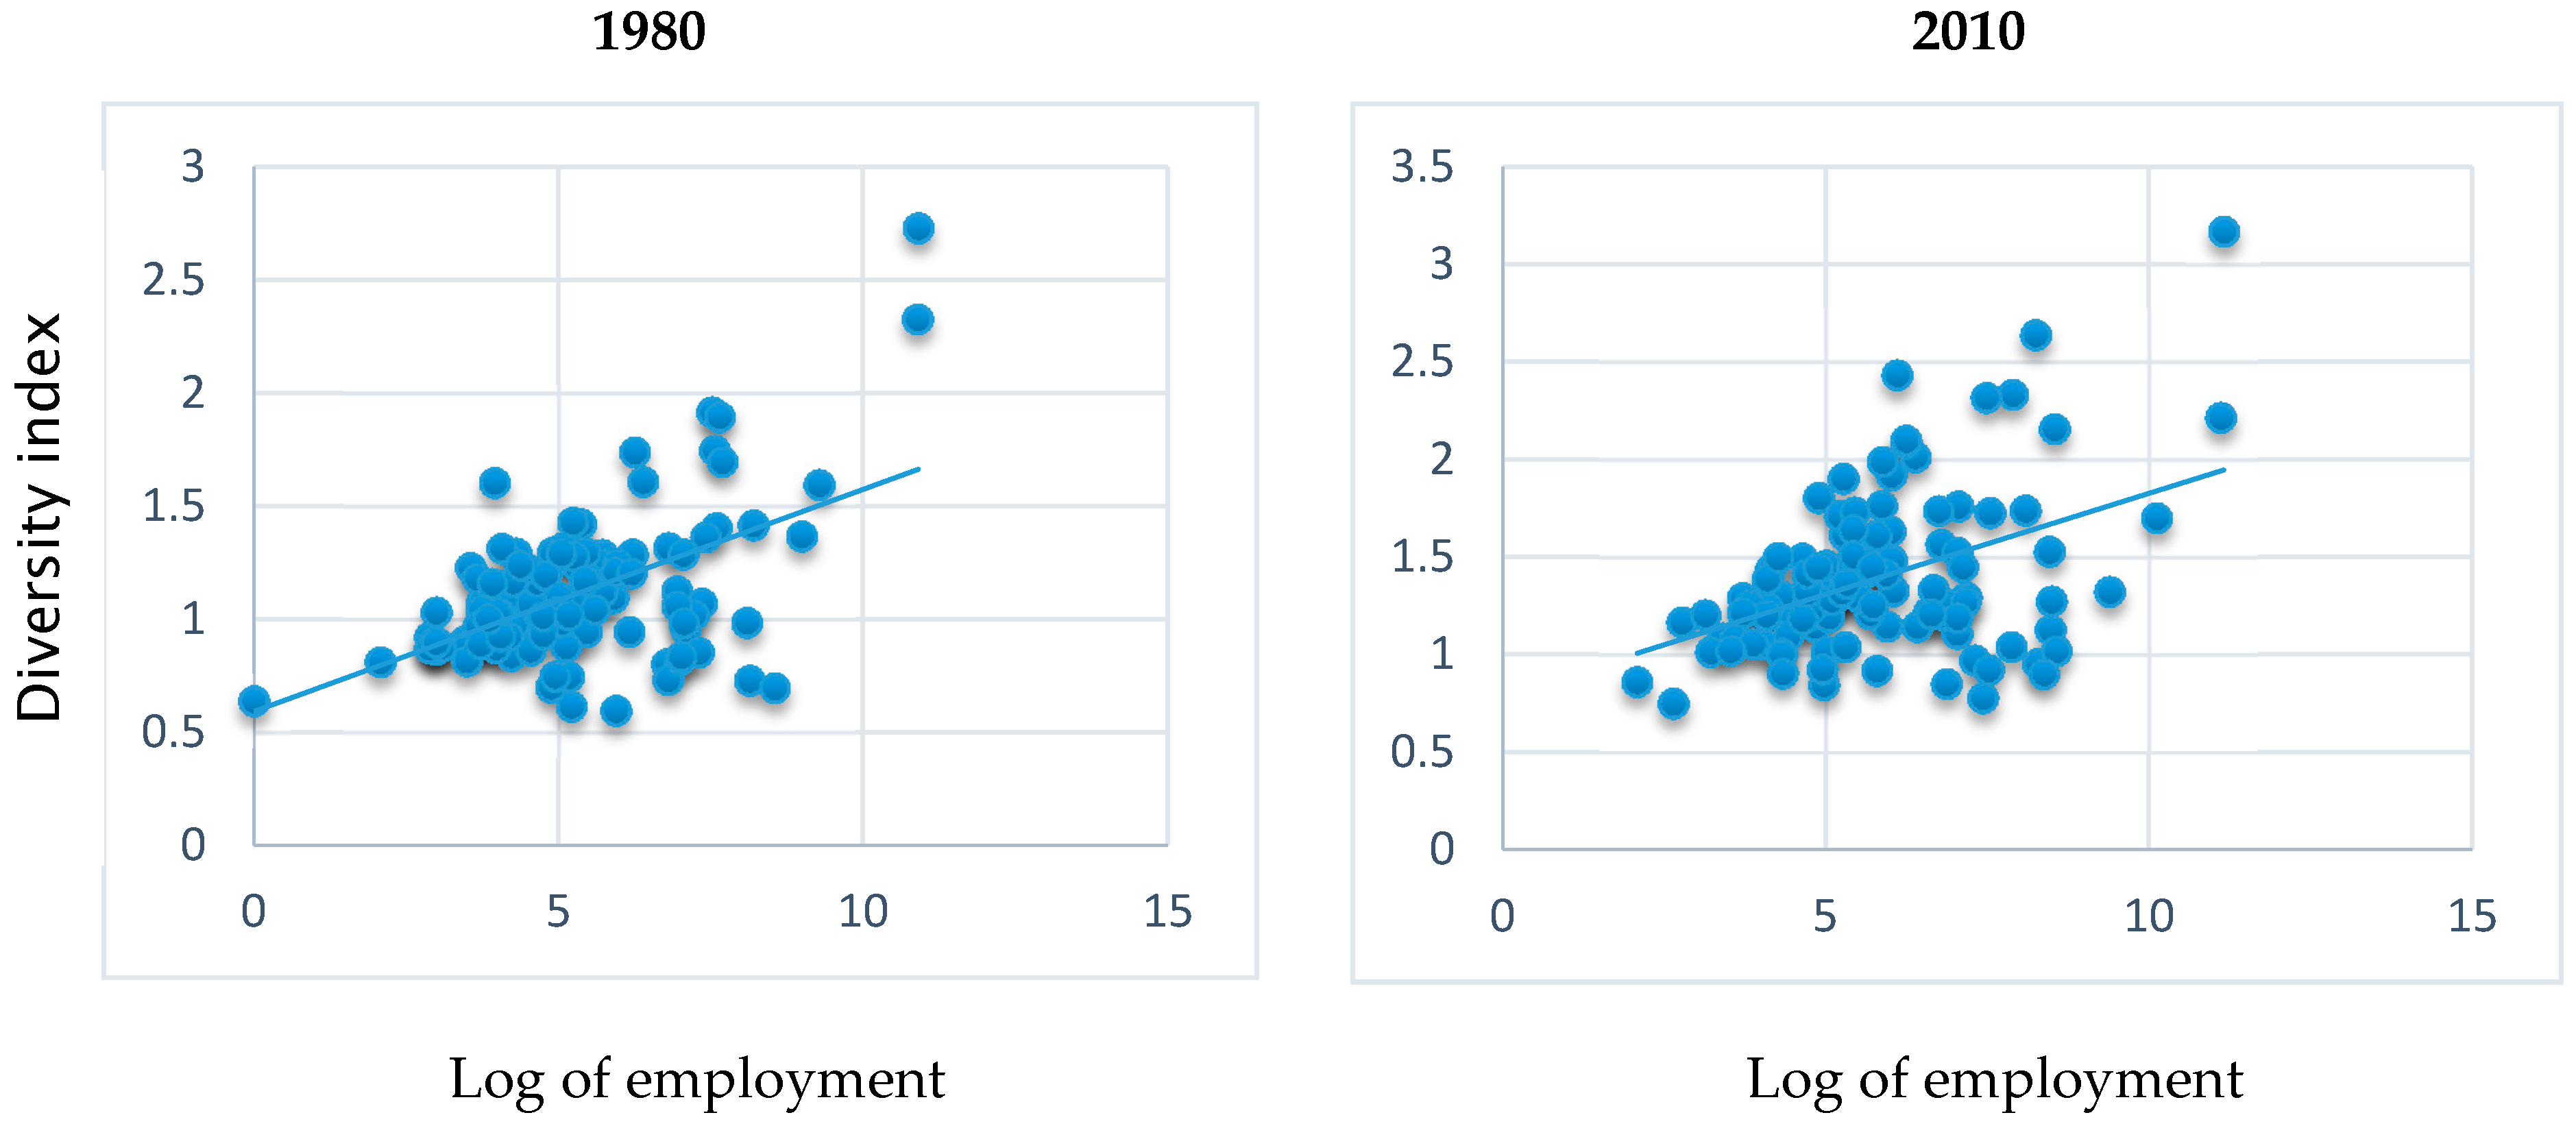
In this context, this study quantifies the impact of the localization and urbanization economies on the growth of employment, as a proxy for economic growth, in the cities of Ecuador between 1980 and 2010, years for which data are available by industry and cities from the Economic Census of this country. Localization economies are measured through the specialization index that captures productivity gains both when it is high, because total employment in a city is high, and when industry participation is high for the total employment given in a city. For urbanization economies, the Herfindahl index is a measure of the diversity, employed in economics, which indicates the economic concentration of a market; the inverse of the Herfindahl index a high index indicates a very concentrated and uncompetitive market. Density measures number of people living in an urbanized area. These results suggest that specialization affects employment growth throughout this period. Two purposes drive this research: first, to contrast the empirical results obtained by other studies carried out in developed countries [26,32,35,36,37], with those obtained in this research conducted in Ecuador, a developing country. Second, provide guidance, based on empirical results, to political managers for development of economic policies related to employment and productivity in a country that seeks to reorient its strong agro-exporting sector (manufacturing) to diversify production and, through the generation of added value, to develop new industries.
It should be noted that the contribution of this paper is not only limited to Ecuador, but extends to other Latin American countries, given the characteristics it shares with most of them in terms of its industrial composition and urbanization process.
The work is organized as follows: the next section presents a review of the literature. Section 3 contains the methodology and the empirical analysis. In Section 4, the results obtained are detailed. Finally, in Section 5 the most relevant conclusions are recorded.

2. Literature Review on Agglomeration Economies

Deepening the knowledge of the magnitude and causes of agglomeration economies has been a field of renewed interest in the economic literature from the seminal works of Smith [38] and Marshall [8] around the importance of economies of scale for agglomeration. Smith introduced the idea that scaling up allows firms and workers to specialize in specific activities, and that specialization and division of labor increase productivity. Marshall [8] posits that industries specialize geographically because proximity favors the transmission of knowledge, the reduction of costs of transporting inputs and products, and greater efficiency in labor markets. Analogously, Duranton and Puga [34] specify the mechanisms that lead to agglomeration: sharing, matching, and learning. The sharing mechanism includes the profits that come from the great variety of inputs and industrial specialization; matching involves better adjustments between employees and employers, and between buyers and suppliers or business pairs; and learning corresponds to the generation, diffusion, and accumulation of knowledge.
The theory of agglomeration economies postulates that companies enjoy positive externalities of the spatial concentration of economic activities [8]. Such benefits may arise within an industry or between them, which are referred to as localization and urbanization economies, respectively. According to the MAR (Marshall-Arrow-Romer) model [8,39,40], formalized as such by Glaeser et al. [9], the concentration of an industry in a region promotes and facilitates the spillover of knowledge and innovation between firms within the region. However, knowledge externalities between firms only occur between firms from the same industry or similar industries, and therefore are generated only by geographical concentrations of firms in the same or similar sector. In this sense, the MAR model assumes the monopoly as the best form of market competition since it protects the ideas and allows the rents of the innovation to be appropriated by the firms. The spatial concentration of economic activities can therefore positively influence the productivity and growth of these firms, and consequently of the cities that contain them. This intra-industry external effect is known as localization economies.
In contrast, Jacobs [41] indicates that cities are a source of innovation and states that the most important sources of knowledge spillover are external to the industry in which they develop their activity. In fact, he argues that diversity of industries within a region favors knowledge externalities driving innovative activities and economic growth. The foundation is that a more diverse and closer industrial fabric fosters opportunities to imitate, share, and recombine ideas and practices. Therefore, Jacobs [41] sees diversity rather than specialization as the main mechanism of economic growth; that is, a diversified local productive structure gives rise to urbanization economies.
In line with Jacobs [41], a third type of externality is recognized, rising from Porter’s [42] argument that competition is better for growth. This author argues that strong competition in the same market encourages innovation and accelerates the rate of technological progress and, therefore, the growth of productivity. Regarding spillovers of knowledge, it indicates that these occur primarily within a vertically integrated industry, which corresponds to the postulate by Marshall that specialization leads to spillovers of knowledge within industries. However, according to Combes [26], the impact of competition on information spillovers is ambiguous, as corroborated by Sutton [43] (p. 334) who “… shows that empirical studies do not succeed in establishing that competition has a positive effect on innovations”.
The empirical literature has established that the spatial concentration of industrial activity improves productivity and innovation, as well as economic growth through different approaches. In these approaches, the common denominator is the analysis of the localization–urbanization dichotomy [2,10,44]. In this paper, the first of these is addressed; therefore, empirical works whose performance measures are employment growth as a proxy for economic growth are discussed, on which the incidence of agglomeration economies is evaluated [22,26,27,29,30,36,37]. An alternative measure of economic growth is the number of new businesses. Rosenthal and Strange [45]; Van Soest et al. [29], Jofre-Monseny [46], and Mota and Brandão [47] find positive effects of localization and urbanization economies in the birth of new firms.
In line with this work, two pioneering works correspond to Glaeser et al. [9] and Henderson et al. [10], who use a dynamic perspective to estimate the impact of numerous local determinants on employment growth at the industry and city level for the United States. Similarly, Combes [26] establishes that for France the size of the local market has a negative effect on employment growth in the services sector, however, the effect is positive in manufacturing industries. Viladecans-Marsal [27] demonstrates for Spain that agglomeration economies influence the location of manufacturing activity (the influence of urbanization economies predominates in most sectors). For Germany, Blien et al. [36] determine that the size of the local market has a positive impact on the growth of industrial employment and the service sector. For Italy, Mameli et al. [37] find that localization economies have a negative effect, and urbanization economies have a positive effect on employment growth; however, their results are sensitive to the sectoral disaggregation used. Marrocu et al. [48] find that in old urban European areas, positive effects of diversity are particularly noticeable in the service sector. On the other hand, in the “new” Europe, specialization affects the low-tech manufacturing sectors positively. In general, positive results are expected mainly from urbanization economies, since economic growth depends strongly on the level of local demand. Therefore, diversified regions with strong local demand and several intermediaries in the supply chain should function better economically [31].
In Latin America, empirical literature in this field is scarce. Saito and Gopinath [49] for Chile, Da Silva Catela et al. [50] for Brazil, Pereira and Soloaga [51] for Mexico, and Guevara et al. [52] in Ecuador, analyze the incidence of agglomeration economies on the growth of labor productivity. In contrast, only Escobar-Méndez [53] and Cota [54] analyze the incidence of agglomeration economies on the growth of manufacturing employment for Mexico. Escobar-Méndez [55] analyzes the main metropolitan areas and cities of Mexico during the period 1980–2003, showing that specialized environments have a negative effect on the growth of manufacturing employment, while the results of the study by Cota [54] in the cities near the northern border of Mexico revealed that the externalities caused by industrial specialization constitute one of the explanatory factors of the growth of manufacturing employment in the period 1988−1993.
As expected, the results obtained differ according to the sector analyzed, the territorial unit, the availability of data, and the methodology used. Regarding this last aspect, it should be noted that the measurement of the agglomeration economies entails aspects of endogeneity that, according to Combes and Gobillon [32], can occur both individually and at the local level. The literature has mainly pointed out aspects of endogeneity at the local level, proposing some strategies related to fixed effects at a local level—primarily the use of instrumental variables and of delayed variables (to expand on this topic, review Combes and Gobillon [32]).
This paper approaches this problem with the use of instrumental variables, as is discussed below. Along this line, the most common approach according to Grahman et al. [55] consists of instrumentalizing the current levels of agglomeration using long delays of the population or population density, within which the work of Moomaw [35], Henderson et al. [10], Ciccone and Hall [11], Combes et al. [23], and Duranton [56], among others, fall. In these studies, the recurrent argument is that the densities observed at present are determined by previous patterns of population concentration, which in themselves are not correlated with contemporary levels of productivity.
In contrast, instruments based on contemporary data are also used; among others, Viladecans-Marsal [27] uses the average of the size of firms or taxes on economic activities, and Nakaruma [57] and Combes et al. [23] use the surface of the geographical units under analysis. Rosenthal and Strange [46] and Combes et al. [58] use geological variables related to the subsoil of industrial sites as instruments.
Finally, it should be noted that specialization and urbanization are not mutually exclusive, since specialization is a particular feature of a certain sector within an industry, while diversity is a characteristic of a total area. Consequently, both hypotheses are tested appropriately with the use of different indicators.

3. Methodology

3.1. Analysis Context: Industrial Specialization and Diversity in Ecuador

In the Ecuadorian economy, the industrial sector is the second most important in terms of gross domestic product (GDP), behind the service sector. According to World Bank Open Data [20], it is also the most dynamic, with 9% growth between 1980 and 2010. On the other hand, it is observed that economic activity tends to agglomerate in relatively few cities—primarily Guayaquil and Quito, which represent only 3.29% of the total surface area of the country (data to 2010). However, these two cities represent 16.25% and 15.48% of the population; generate 23.61% and 25.19% of the gross value added; and cover 21.35% and 28.91% of manufacturing employment, respectively. According to Fujita and Thisse [59], these data suggest the existence of strong regional disparities and, therefore, the existence of agglomerations on a spatial scale.
This study determines the incidence of localization and urbanization economies on the growth of employment in Ecuador between 1980 and 2010, years for which census data exist of the economic activity of the country at the industry and city level (Figure 1); the methodological strategy implemented is detailed in the following paragraphs. With this objective in mind, it is convenient to start by characterizing the industrial dynamism of Ecuador in terms of the variable of interest, that is, employment growth.
Figure 1 shows the growth of employment for cities that are above the average annual growth rate above of 1.78%. The behavior of these variables is generally heterogeneous as illustrated. The cities with the highest employment growth are Chunchi (13.95%), Orellana (9.41%), and Lago Agrio (8.67%). A share of 23.7% of cities show a contraction in their employment levels, of the order of −1.64% in the period analyzed.
Table 1 shows the most and least specialized cities in terms of manufacturing employment in the two years analysed. In this, it can be verified that the most specialized cities differ between the two years analysed, although not so much in the sectors in which they specialize, which are mainly those that are linked to natural resources, such as leather and wood. These are almost entirely cities in the Sierra region (except Rocafuerte and San Lorenzo), which can be categorized as medium and small cities. On the contrary, among the least specialized cities are precisely the two largest cities of the country, and in this case the industrial sectors correspond to high and medium technology.
Table 2 contains the most and least diversified cities. In the first group are those that house a wide variety of industrial activities; in almost all cases and in the two years analysed, these are provincial capitals. Therefore, although not all can be considered large cities with respect to the national total, many of them are relatively large in terms of their immediate geographical environment. The pattern between the two years is almost identical. Santo Domingo and Huaquillas in 2010 replaced Chunchi and Cuenca with respect to 1980 as among the most diversified cities.
This result is in agreement with one of the stylized facts relating to agglomeration economies proposed by Duranton and Puga [2]: large cities tend to be more diversified. In 1980 and 2010, the correlation coefficients between the size of cities measured by industrial employment and the diversity index are 0.54 and 0.43, respectively. Figure 2 permits visualization of such a positive correlation. However, in absolute terms, none of these cities is very specialized in any activity.

3.2. Data and Variables

3.2.1. Data Corresponding to Employment by Sector and City

To estimate the incidence of agglomeration economies in employment growth, data corresponding to employment by sector and city was used, the sources of which were the economic censuses of the National Institute of Statistics and Censuses (INEC) conducted in 1980 and 2010 [60]. The use of a single constructed database for this purpose, which involved a huge undertaking of gathering and digitizing the original information, is an important contribution of this work. This is the 1980 database that corresponds to Volume No. 8 (the Directory of Economic Establishments), which includes five large divisions with a level of disaggregation of activities to three digits; the Great Division 3 data corresponds to manufacturing industries and, within these, 29 economic sectors are registered. The 2010 data is disaggregated between one and six digits, and includes 31 variables for each company. The industrial classification used in this case is ISIC 4.0 (International Standard Industrial Classification of All Economic Activities), which includes 20 main activities. In summary, we worked with information from 114 cities (once homologated between both years) and 26 industries. Some analyses required additional sources of information that are recorded in each case. Table 3 shows a summary of the statistics of the main variables that underpin our analysis.
As for the geographical units of analysis, this was information at the level of cities, made up of urban and rural parishes, which also constitute the second level of administrative division in Ecuador, after the provinces. The cities total 114, not including the three corresponding to the Insular Region or Galapagos Islands (San Cristobal, Isabela y Santa Cruz) that were not taken into consideration for this work.
An important issue is that given the geographical characteristics of Ecuador, cities and regions are of very different sizes; thus, for example, the area of the largest is 19,930 km2 (Pastaza, Amazonia), while the smallest is just 19 km2 (Cevallos, Sierra). Consequently, geography is a determining factor to be taken into account in this study. The databases were homogenized, 26 sectors and 114 cities are integrated.
The agglomeration economies were measured as follows [23]. First, by considering the role of the size of the sector within a city, if externalities are important for growth; then, the clearest way to establish such effects, was to observe the growth of the same sector in different cities and analyse in which of these cities that sector grew more rapidly. Therefore, the unit of observation of the sector in a city and the measure of specialization related to localization economies was as follows:
s p e r s = e m p r s e m p r
where emprs is employment in sector s and region r. Variables were normalized at the region level.
The economies of urbanization were measured through the inverse of the Herfindahl index in terms of industries’ shares in regional employment. The industries that were considered or excluded, and the variable, were normalized at the region level.
d i v r = [ s ( e m p r s e m p p r ) 2 ] 1
where r is the number of industries. The numerator is at a maximum when all sectors except the one under analysis r* has the same size in the cities. This indicator reflects the sectoral diversity of the industry r in a city and therefore is not necessarily related to the level of specialization of the industry under analysis. This is a measure of diversity used in economics as a measure of concentration or dispersion, and is closely related to the logit [61]. The idea of entropy is borrowed, where it is used as a measure of disorder. The entropy indices are defined by:
E s ( ) = 1 2 [ r 1 R λ r ( λ r s λ r ) 1 ]
where α is a parameter that, when less than (respectively, greater than) 1, assigns more weight to observations corresponding to the lower (respectively, higher) tail of the distribution.
With the intuition that traditionally large firms are usually better able to internalize some of the local effects, while small firms have greater difficulty in doing so, Glaeser et al. [9] suggests incorporating as an additional determinant of localization economies; the average size of firms within the local industry:
s i z e r s = e m p r s / n r s e m p s / n s
where nrs is the number of firms in the sector s in the region r. However, Combes and Gobillon [32] state that its use leads to serious endogeneity problems. Therefore, introducing it into the specification should be avoided unless there is a strong instrumentation strategy.
Finally, to simultaneously control the differences between cities, Combes [26] suggests considering the density of total employment in each of these. The following indicator was used:
d e n r = e m p r a r e a r
where arear is the area of the region measured in km2.
Finally, following Combes [23], employment growth was defined as:
Δ e m p r s = log ( e m p r s a n ~ o t e m p r s a n ~ o t 1 ) log ( e m p r a n ~ o t e m p r a n ~ o t 1 )
where emprs is the level of employment by sector and region. It is therefore the difference between the growth of employment in the sector and in the region between 1980 (t − 1) and 2010 (t), and the growth of national employment in this sector in Ecuador during the same period.

3.2.2. Methodological Strategy

Selection Bias

First, it is important to mention that the data used in this study are not totally observable (there are industrial sectors that are present only in certain cities). It is a common problem in studies that use data on a local scale. To overcome this inconvenience, we included in the regressions only the units with the variable of interest. However, this can lead to biased parameters and consequently to possibly wrong conclusions (Appendix A, Table A1).
Viladecans-Marsal [27], Combes [26], and Henderson et al. [10], among others, isolate the selection bias through Heckman’s [62] two-stage model. In the first stage, one estimates a probit model of a dummy variable that takes the value of 1 if sectoral employment is observed and 0 if not, as a function of variables available for all cities. These variables are, in this work, a constant, the logarithm of the density of total employment, and industrial dummies. This estimate allows us to obtain the statistic known as the Mills ratio that captures the magnitude of this bias.
In the second stage, such a statistic is introduced in the original regression as an additional explanatory variable, thus obtaining estimates by ordinary least squares (OLS), which, although consistent, are inefficient; this necessitates using an estimate by maximum likelihood, which is efficient.
As in Combes [26], the maximum likelihood algorithm starts with a Heckman estimate. Table A1 reports the results of the probit models for employment, showing that the probability of an industry operating in a given sector and city is positively conditioned by the density of total employment and the characteristics of the industries.
In the first stage, a model was formulated to estimate the probability that a city contains an industrial sector:
P r o b ( S = 1 | Z ) = Φ ( Z γ )
where S refers to the sector (S = 1 if the sector is in the city and S = 0 otherwise), Z is a vector of explanatory variables, γ is a vector of unknown parameters and Φ is the cumulative distribution function with normal distribution.
The estimation of the model allows the prediction of the probability that an industry is concentrated in a determined city.
In the second stage, the initial model was estimated by OLS with the dependent variable of continuous growth of employment, which corrects the selection bias by incorporating the variable called the Mills inverse ratio (λ), obtained in the previous stage.

Endogeneity and Instrumental Variables

As noted above, when estimating the impact of agglomeration economies on employment growth, the literature proposes two potential sources of endogeneity: omitted variables and inverse causality (reverse causality is theoretically developed by Martin and Ottaviano, [3]), which can arise locally and individually [32].
The problems of endogeneity at the local level arise from the omission of variables related, for example, to productive facilities such as airports, transport infrastructure, or universities, which increase employment and also increase the indices of localization, urbanization, and density. In other words, any unobserved characteristic of the city that increases employment, and therefore the indices of specialization and diversity, and density, will bias the estimates.
Also, the endogeneity of the reverse causality that arises locally implies that improved results obtained in employment can attract more firms and workers in some cities, which in turn affects specialization, diversity, and density. On the other hand, problems of endogeneity at the individual level due to omitted variables appear when the workers select their location for themselves from among several cities based on the cities’ individual characteristics, and are not controlled in terms of the specification, such as unobservable skills.
The problem of reverse causality occurs in this case: when the selection of a worker’s location depends on a precise result that in turn depends on an individual shock that may be related to local characteristics. In this context, individual location options are assumed to be endogenous [63].
In this work, the instrumental variables (IV) approach allows one to simultaneously work with the omission of variables and the inverse causality at the local level, while using these in line with the empirical literature, and additional historical and geographical variables. An alternative strategy related to panel data can be consulted widely in Combes et al. [63] and Combes and Gobillon [32]. Once the endogenous regressors—specialization, diversity, and density—were defined, the following instruments were developed: (i) an index of specialization and another of diversity, constructed as in Equations (1) and (2), respectively, but from the data of births of firms between 1960 and 1980; (ii) a dummy variable of a geological nature that took the value of 1 if the city was affected by a natural disaster between 1587 and 1980, and 0 otherwise; this variable used data from the Cartography of Risks and Capacities in Ecuador [64]; (iii) the density of the population in 1950 and 1974; (iv) the urbanization index of 1980; (v) the availability of roads in 1980; and (vi) a centrality index defined as the sum of the inverse distances between cities, which was used as such because it does not explicitly impose a geographic center. As in Head and Meyer [65], this index was measured by lnΣjdij − 1, where dij represented the distances. Table A2 shows the joint correlations of each endogenous regressor with its set of instruments.
According to Combes and Gobillon [32] (p. 40), “historical values of the population or density are relevant because by remaining in time they create inertia in the population and in local economic activity”. Based on this notion, instruments to measure the variables of specialization and diversity were constructed using data related to the birth of firms, which were correlated with the level of specialization and diversity of the industries in the cities, but were not directly correlated with employment growth (Appendix A, Table A2).
It should be noted that the endogenous variables of specialization and diversity are different from their instruments although they have the same denomination. The geological dummy does not represent a direct effect on the variables of interest. The same applies to the geographical variable (availability of roads in 1980).
Estimating the effect of localization and urbanization economies, and of density on employment growth, using instrumental variables can lead to unbiased estimates. This happens if the instruments meet the conditions of relevance (Equation (7)) and exogeneity (Equation (8)). Formally, these conditions are:
Cov (Specialization, Z|.) ≠ 0; Cov (Diversity, Z|.) ≠ 0; Cov (Density, Z|.) ≠ 0
Cov (μX, Z) = 0; for X = employment
where Z denotes the set of instruments.
Equation (7) expresses that the relevance of an instrument depends on the partial correlation of the instrumental variables and the endogenous regressors. Table 4 presents the results of the ordinary least squares (OLS) estimates including regional, provincial, and industrial fixed effects. The choice of instruments is precisely subordinated to the correlations obtained.
Column 1 of Table 4 shows the partial correlation between the specialization variable and the instruments that are significant: the specialization index, the diversity index, the 1980 urbanization index, and the centrality index. Column 2 develops a similar regression, but with respect to the endogenous variable diversity. With the exception of the specialization index, all the instruments in this case are relevant at a level of significance of 1%. Column 3 shows the results obtained for density as an endogenous variable, whose variation is explained by the diversity index, the population density of 1974, the urbanization index of 1980, and the centrality index, in all cases at a level of significance of 1%.
Other statistics that should be reviewed in Table 4 is the value of R2, which suggests important correlations between the endogenous regressors and their instruments in all cases, but mainly with respect to the density of employment, both for the growth of employment between 1980 and 2010. To evaluate the relevance of the defined instruments, the test developed by Stock and Yogo [66] was applied.
Stock and Yogo [66] provide two tests for weak instruments based on the F statistic with two purposes. First, the “bias test” tests the hypothesis that in small samples the bias in regressions using 2SLS is small with respect to the endogeneity bias reported by OLS. Second, the “size test" is used to prove if an instrument is considered strong, using the Wald test. It is observed if its size is close to its level for all the possible configurations of the regression using instrumental variables.
Table 4 collects the results of the first test. The values in all cases suggest that the instruments are not weak (F statistics are greater than 10), which is confirmed when these are contrasted with the critical values reported by Stock and Yogo [66].
Section 4 discusses the exogeneity condition of the instruments.

Model Specification

Exploring the empirical significance of the agglomeration economies in employment implies considering the aspects of endogeneity already mentioned, which is conducted with a regression with instrumental variables. In particular, the two-stage least squares (2SLS) estimator was used.
The model specified to estimate the effect of agglomeration economies on the growth of employment between 1980 and 2010 of a particular industry in a certain city is:
Δ e m p i c = β 0 + β 1 log s p e i c + β 2 log d i v i c + β 3 s i z e i c + β 4 d e n c + i m r _ e + ε i c
where Δempic represents the growth of employment in the industry i and the city c, between both years; speic, divic, and sizeic are the indices of specialization, diversity, and average size of the industry i in the city c; and denc is the density of total employment. The variable imr_e is the inverse ratio of the Mills ratio for employment, introduced to control the selection bias. εic is assumed as the error term. In order to control the unobservable heterogeneity, fixed effects were introduced at the provincial, industrial, and regional levels (in Ecuador there are three natural regions: Costa, Sierra, and Oriente), as well as the literacy rate of each city, which aims to capture the qualification of the population in each case (there are no data available on the qualification of employees by industry and city).
The explanatory variables correspond to the initial year (1980). These variables were normalized by the corresponding values at the national level. All the variables were expressed in logarithms, which makes them easily comparable and interpretable.

4. Results

The estimate of Equation (9) was derived by OLS. However, these results were not entirely correct given the presence of selection bias and the endogeneity of the model. Therefore, it was necessary to apply two additional estimation strategies. Next, the specificities of each of these were explained for the measures of productivity of the variable of interest: employment.
The first column of Table 5 shows the results obtained when the estimates were made by OLS. In this case, the localization economies measured by the specialization index and the density of employment explain the decrease in employment between 1980 and 2010, while the urbanization economies measured by the diversity index explain employment growth positively.
In order to correct the selection bias, the analysis proceeded with maximum likelihood estimations through a Tobit Type II model whose results were quite similar to those obtained by OLS. In column two, the statistical significance of 1% is shown for these same variables in the growth of employment, but with a size of coefficients relatively higher than those obtained in column one. For all regressors, except for the size of the firms, which in this case has a negative sign, the signs of the coefficients of the significant variables are maintained.
Finally, column 3 of Table 5 shows the results of the estimations with instrumental variables (2SLS) that allow the endogeneity of the model to be treated. Employment growth approaches the instrumental variables: specialization index, diversity index, 1974 population density squared, the urbanization index of 1980, the centrality index, and a geological variable, which leads to results that diverge from those obtained in the previous estimates. In this case, it is evident that a 1% greater specialization of the industries in the cities in 1980 leads to 0.287% employment growth in the following 30 years. Such a positive effect of specialization in employment growth is consistent with Nakaruma [57], Henderson et al. [10], Henderson [67] (these authors only find evidence of urbanization economies for the new high-tech sectors), Blien et al. [36], and Choi and Choi [68]. However, diversity had a non-significant effect on employment growth, which was the same result as González-Val and Marcén [69].
On the other hand, the density of total employment in cities also has a positive impact. In this case, an increase of 1% in the density of cities in 1980 generates employment growth in the order of 0.097% in the subsequent 30 years. In several studies, when density and specialization were simultaneously introduced, it was found that both have a positive effect on the measure of productivity used [32,70,71].
The average size of the firms has a negative impact, with an elasticity of −0.294, almost coincident with that obtained by Combes [26] in the global regressions for industry in France; Combes [26] interprets this result as the effect of the life cycle of an industry. Other similar results regarding this variable are obtained by Glaeser et al. [9], O’Huallachain and Satterthwaite [72], and Badr et al. [73]. In the estimates using OLS and 2SLS, fixed effects of the regions, provinces, and industries are considered.
In the estimations of Table 5, the value of the F statistic that is recorded corresponds to the statistic of the minimum own value (minimum eigenvalue), which is considered an analogous measure of the F statistic defined by Stock and Yogo [66] when the estimates are conducted with more than one endogenous regressor, as in this case [74]. As before, this value is greater than 10, which indicates that the instruments are not weak. The value of F in this case represents the joint statistical significance of the endogenous regressors of employment growth, at a maximum tolerance level of 10% relative bias, as measured by the Wald statistic based on the parameters given by Stock and Yogo [66].
In general, the findings fully validate the proposal of MAR-type externalities. Table 1 previously showed the specialization of the cities of Ecuador, mainly around the sectors related to the natural resources of wood and leather. This suggests reinforcement within the industries and between firms of individual and collective learning.

Robustness of Results

In order to verify the robustness of the results described above, it was first necessary to verify that the instruments used comply with the second condition of exogeneity suggested in Equation (8). The orthogonality of the error term, which in the presence of a greater number of instruments than endogenous regressors (m < k), can be evaluated with the Sargan over-identification test in 2SLS estimates.
This statistic, like others used in models other than 2SLS, evaluates not only the non-correlation of the instruments with the error term, but also that the equation is incorrectly specified and that one or more of the excluded exogenous variables should be included in the base Equation (9) as appropriate to the employment. The values reported for this statistic in Table 5 suggest that the instruments that have been defined to deal with the endogeneity of the model of Equation (9) are exogenous, since in neither case are their p values significant. A significant statistical test could represent either of the two cases, that is, not only the non-correlation of the instruments with the error term, but also that the equation is incorrectly specified. In other words, the Sargan test allows rejection of the hypothesis of restriction of over identification, which suggests the joint exogeneity of the instruments.
Another robustness test, a strategy for estimating the growth of employment less sensitive to weak instruments, was applied, namely, the limited-information maximum likelihood (LIML) estimator. According to Cameron and Trivedi [75], in the presence of weak instruments, asymptotic theory may provide poor guidance for the actual distributions of finite samples. LIML considers the estimation of the structural parameters of our equations, taking into account only the likelihood function of the endogenous variables of Equation (9) and the identification constraints corresponding to the equation to be estimated. Table 6 shows these results in the first stage of the estimates by LIML.
The results of the partial correlations between the endogenous regressor and their respective instruments are very similar to those obtained in the 2SLS estimations, particularly regarding the value of the coefficients, although a modification in the values of the errors is evidenced as standard, but small. The values of the F statistic are exactly the same for all the endogenous returns of employment. This suggests an equal relevance of the instruments to those obtained by 2SLS.
Finally, the results obtained from the regression of employment growth ratify those previously mentioned using 2SLS, albeit with some differences to note. Table 7 shows that a 1% increase in the specialization of industries contained in a city in 1980 favours the growth of employment in these industries to the order of 0.309% in the following decade, which represents an additional 0.02% compared to the estimates using 2SLS (Table 6). Similarly, a 1% increase in the employment density of cities in 1980 determined employment growth of 0.102%, in this case only 0.005% additional to that obtained using 2SLS in Table 5. Regarding the average size of firms, the estimate by LIML attributes −0.303% employment growth, 0.009% more than before.
In summary, it was assumed that the estimates of employment growth between 1980 and 2010 were consistent in terms of the coefficients obtained.

5. Conclusions, Policy Implications, and Research Limitations

5.1. Conclusions

This research examined the effects of agglomeration economies (location and urbanization) on the growth of urban employment in the secondary sector in Ecuador between 1980 and 2010. The results obtained suggest the following conclusions:
1. Localization economies promote employment growth in industries and, consequently, in the cities of Ecuador. In this sense, the benefits of spatial concentration are internalized by companies that belong to the same industry in a given area that generate savings through greater research cooperation and lower transport rates, such as in the consumption of supplies or special services provided by others.
2. In most countries, specialized and diversified cities co-exist; however, in Ecuador they do not. In Ecuador, cities are predominantly specialized in sectors largely dependent on natural resources, and of long tradition for the country. The absence of diversity suggests the disadvantages of less innovation and the inability to imitate, share, and recombine ideas and practices between industries, as well as between companies in the same industry.
3. The significant effect of the total employment density in cities indicates the importance of the size of the economy of a city for employment growth. The results show that this variable has a positive effect on the measure of productivity used in this research, namely, employment growth.
4. Finally, the results show a negative effect of the average size of companies within the local industry on employment growth. However, this effect is not important, in the sense that it was incorporated into the estimates as an additional determinant of localization economies.

5.2. Policy Implications

The results obtained have political implications. These results suggest that in the cities of Ecuador it is necessary to strengthen diversified local production structures as a source of innovation and economic growth; that is, to promote more diverse and competitive industrial fabrics. The intervention of political managers in the proper functioning of transport and communication infrastructure, and the proximity of markets and access to specialized services is essential. In the last decade, the country has made progress in creating conditions and factors necessary to initiate a process of productive transformation. However, its growth continues to depend on the extraction of non-renewable natural resources and the production of raw materials that, in both cases, are marketed in markets with great price instability, thereby affecting the terms of trade and making the country’s trade balance vulnerable.
Secondly, it is desirable that public interventions and the state’s action in the face of the presented territorial disparities revolve around incentive and disincentive policies for the installation of new industries. Therefore, it is necessary to: (1) generate incentives (economic, financial, and fiscal) for the implementation of public and private companies in cities with few industries; (2) invest in the improvement of city infrastructure, taking into account the new demands of the global environment; (3) incentivize via taxes and restrictions, and the installation of new industries in congested metropolitan agglomerations; and (4) transfer competencies (functions and financial resources) to city governments to design their own economic and industrial development strategies.

5.3. Research Limitations

Regarding the limitations of this study, it can be mentioned, as noted by Quintana-Romero, Mendoza and Correa-Quezada [75] that reference studies are scarce due to lack of information, restrictions in the official data series, and the weak tradition of conducting spatial analysis in Ecuador.
Likewise, we recognize that the proxies used to measure agglomeration economies are imperfect. In line with the literature, the degree of specialization was used as a better representation of the potential of Marshall’s externalities because it better captures the intensity and density of interactions between companies. Other indicators, such as the location quotient, are also widely used for this purpose; however, the location quotient has received criticism because it is highly sensitive to the size of the region [76], and because corrections of the errors of its calculation significantly reverse the sign of the effect of relative concentration on local growth [23]. Regarding the measurement of Jacobs-type externalities, the Hirschman-Herfindahl index is the most common. Its various applications include those based on employment, as used in this work due to the availability of data, but also those based on patents or industrial value added. An alternative measure is the Gini index.

Author Contributions

All authors contributed equally to this work. All authors wrote, reviewed and commented on the manuscript. All authors have read and approved the final manuscript.

Funding

This research received no external funding.

Conflicts of Interest

The authors declare no conflict of interest.

Appendix A

Table A1. Probit Model, presence of zeros.
Employment
den_800.176 ***
(0.0000)
dum_sectorsignificant
constante−1.647 ***
(0.0000)
N2964
Table A2. Correlation between endogenous variables and their instruments.
SpecializationDiversityDensity
specialization index0.1135 *
(0.0000)
diversity index−0.1540 *0.1306 *0.3993 *
(0.0000)(0.0000)(0.0000)
population density19742−0.1543 *0.1921 *0.7963 *
(0.0000)(0.0000)(0.0000)
urbanization index 1980−0.1031 *0.2519 *0.4412 *
(0.0000)(0.0000)(0.0000)
geological dummy−0.0413 *0.2733 *0.2811 *
(0.0244)(0.0000)(0.0000)
centrality index−0.0707 *0.1211 *0.4604 *
(0.0001)(0.0000)(0.0000)
Note: p value of the correlation coefficient between parentheses; * p < 0.1; ** p < 0.05; *** p < 0.01.

References

  1. Feldman, M.; Audretsch, D. Innovation in Cities: Science-Based Diversity, Specialization and Localized Competition. Eur. Econ. Rev. 1999, 43, 409–429. [Google Scholar] [CrossRef]
  2. Duranton, G.; Puga, D. Diversity and Specialization in Cities: Why, Where and When Does it Matter? Urban Stud. 2000, 37, 533–555. [Google Scholar] [CrossRef]
  3. Martin, P.; Ottaviano, G.I. Growth and Agglomeration. Int. Econ. Rev. 2001, 42, 947–968. [Google Scholar] [CrossRef]
  4. Batty, M. The New Science of Cities; MIT Press: Cambridge, MA, USA, 2013; pp. 1–520. [Google Scholar]
  5. Takatoshi, T. Agglomeration in World Cities. Procedia Soc. Behav. Sci. 2013, 77, 299–307. [Google Scholar]
  6. Chuanglin, F.; Danlin, Y. Urban Agglomeration: An Evolving Concept of an Emerging Phenomenon. Landsc. Urban Plan. 2017, 162, 126–136. [Google Scholar]
  7. Dai, M.; Li, X.; Lu, Y. How Urbanization Economies Impact TPF of R & D Performers: Evidence from China. Sustainability 2017, 9, 1766. [Google Scholar]
  8. Marshall, A. Principles of Economic; MacMillan: London, UK, 1980; pp. 1–802. [Google Scholar]
  9. Glaeser, E.; Kallal, H.; Scheinkman, J.; Shleifer, A. Growth in Cities. J. Political Econ. 1992, 100, 1126–1152. [Google Scholar] [CrossRef]
  10. Henderson, J.; Kuncoro, A.; Turner, M. Industrial Development in Cities. J. Political Econ. 1995, 103, 1067–1090. [Google Scholar] [CrossRef]
  11. Ciccone, A.; Hall, R.E. Productivity and the Density of Economic Activity (No. w4313). Natl. Bur. Econ. Res. 1996, 86, 54–60. [Google Scholar]
  12. Brulhart, M.; Sbergami, F. Agglomeration and Growth: Cross-Country Evidence. J. Urban Econ. 2009, 65, 48–63. [Google Scholar] [CrossRef]
  13. Melo, P.; Graham, D.; Noland, R. A Meta-Analysis of Estimates of Urban Agglomeration Economies. Reg. Sci. Urban Econ. 2009, 39, 332–342. [Google Scholar] [CrossRef]
  14. Aarstad, J.; Kvitastein, O.A.; Jakobsen, S.E. Related and Unrelated Variety as Regional Drivers of Enterprise Productivity and Innovation: A Multilevel Study. Res. Policy 2016, 45, 844–856. [Google Scholar] [CrossRef]
  15. Beeson, P.E. Agglomeration Economies and Productivity Growth. In Sources of Metropolitan Growth; Routledge: London, UK, 2017; pp. 19–33. [Google Scholar]
  16. Castells Quintana, D. Malthus Living in a Slum: Urban Concentration, Infrastructure and Economic Growth. J. Urban Econ. 2017, 98, 158–173. [Google Scholar] [CrossRef]
  17. Cohen, J.P.; Coughlin, C.C.; Paul, C.J.M. Agglomeration, Productivity and Regional Growth: Production Theory Approaches. In Handbook of Regional Growth and Development Theories; Edward Elgar Publishing: Cheltenham, UK, 2019; pp. 104–123. [Google Scholar]
  18. Frick, S.A.; Rodriguez Pose, A. Change in Urban Concentration and Economic Growth. World Dev. 2018, 105, 156–170. [Google Scholar] [CrossRef]
  19. McCann, P.; Van Oort, F. Theories of Agglomeration and Regional Economic Growth: A Historical Review. In Handbook of Regional Growth and Development Theories; Edward Elgar Publishing: Cheltenham, UK, 2019; pp. 6–23. [Google Scholar]
  20. World Bank. World Development Report 2016. A New Economic Geography. Overview. 2016. Available online: http://www.worldbank.org (accessed on 14 June 2019).
  21. Parr, J.B. Missing Elements in the Analysis of Agglomeration Economies. Int. Reg. Sci. Rev. 2002, 25, 151–168. [Google Scholar] [CrossRef]
  22. Cingano, F.; Schivardi, F. Identifying the Sources of Local Productivity Growth. J. Eur. Econ. Assoc. 2004, 2, 720–744. [Google Scholar] [CrossRef]
  23. Combes, P.P.; Duranton, G.; Gobillon, L. Spatial Wage Disparities: Sorting Matters. J. Urban Econ. 2008, 63, 723–742. [Google Scholar] [CrossRef]
  24. Li, W.; Sun, B.; Zhang, T. Spatial Structure and Labour Productivity: Evidence from Prefectures in China. Urban Stud. 2019, 56, 1516–1532. [Google Scholar] [CrossRef]
  25. Hakansson, J.; Isacsson, G. The Spatial Extent of Agglomeration Economies across the Wage Earnings Distribution. J. Reg. Sci. 2019, 59, 281–301. [Google Scholar] [CrossRef]
  26. Combes, P.P. Economic Structure and Local Growth: France, 1984–1993. J. Urban Econ. 2000, 47, 329–355. [Google Scholar] [CrossRef]
  27. Viladecans Marsal, E. Agglomeration Economies and Industrial Location: City-Level Evidence. J. Econ. Geogr. 2004, 4, 565–582. [Google Scholar] [CrossRef]
  28. Lee, B.S.; Sosin, K.; Hong, S.H. Sectoral Manufacturing Productivity Growth in Korean Regions. Urban Stud. 2005, 42, 1201–1219. [Google Scholar] [CrossRef]
  29. Van Soest, D.P.; Gerking, S.; Van Oort, F.G. Spatial Impacts of Agglomeration Externalities. J. Reg. Sci. 2006, 46, 881–899. [Google Scholar] [CrossRef]
  30. De Vor, F.; De Groot, H.L. Agglomeration Externalities and Localized Employment Growth: The Performance of Industrial Sites in Amsterdam. Ann. Reg. Sci. 2010, 44, 409–431. [Google Scholar] [CrossRef]
  31. Beaudry, C.; Schiffauerova, A. Who’s Right, Marshall or Jacobs? The Localization Versus Urbanization Debate. Res. Policy 2009, 38, 318–337. [Google Scholar] [CrossRef]
  32. Combes, P.P.; Gobillon, L. The Empirics of Agglomeration Economies. In Handbook of Regional and Urban Economics; Duranton, G., Henderson, V., Strange, W., Eds.; Elsevier: Amsterdam, The Netherlands, 2015; Volume 5, pp. 247–348. [Google Scholar]
  33. De Groot, H.L.; Poot, J.; Smit, M.J. Which Agglomeration Externalities Matter Most and Why? J. Econ. Surv. 2016, 30, 756–782. [Google Scholar] [CrossRef]
  34. Duranton, G.; Puga, D. Micro-Foundations of Urban Agglomeration Economies. In Handbook of Regional and Urban Economics; Vernon, H., Jacques Francois, T., Eds.; Elsevier: Amsterdam, The Netherlands, 2004; Volume 4, pp. 2063–2117. [Google Scholar]
  35. Moomaw, R.L. Agglomeration Economies: Localization or Urbanization? Urban Stud. 1988, 25, 150–161. [Google Scholar] [CrossRef]
  36. Blien, U.; Suedekum, J.; Wolf, K. Local Employment Growth in West Germany: A Dynamic Panel Approach. Labour Econ. 2006, 13, 445–458. [Google Scholar] [CrossRef]
  37. Mameli, F.; Faggian, A.; McCann, P. Employment Growth in Italian Local Labour Systems: Issues of Model Specification and Sectoral Aggregation. Spat. Econ. Anal. 2008, 3, 343–360. [Google Scholar] [CrossRef]
  38. Smith, A. The Wealth of Nations; The Modern Library: New York, NY, USA, 1776; pp. 1–741. [Google Scholar]
  39. Arrow, K. The Economic Implications of Learning by Doing. Rev. Econ. Stud. 1962, 29, 155–173. [Google Scholar] [CrossRef]
  40. Romer, P. Increasing Returns and Long-Run Growth. J. Political Econ. 1986, 94, 1002–1037. [Google Scholar] [CrossRef]
  41. Jacobs, J. The Economy of Cities New York; Random House: New York, NY, USA, 1969; pp. 1–265. [Google Scholar]
  42. Porter, M.E. The Competitive Advantage of Notions. Harv. Bus. Rev. 1990, 68, 73–93. [Google Scholar]
  43. Sutton, J. Technology and Market Structure. Eur. Econ. Rev. 1996, 40, 511–530. [Google Scholar] [CrossRef]
  44. Andersson, M.; Larsson, J.P.; Wernberg, J. The Economic Microgeography of Diversity and Specialization Externalities–Firm-Level Evidence from Swedish Cities. Res. Policy 2019, 48, 1385–1398. [Google Scholar] [CrossRef]
  45. Rosenthal, S.S.; Strange, W.C. Geography, Industrial Organization, and Agglomeration. Rev. Econ. Stat. 2003, 85, 377–393. [Google Scholar] [CrossRef]
  46. Jofre Monseny, J. The Scope of Agglomeration Economies: Evidence from Catalonia. Reg. Sci. 2009, 88, 575–590. [Google Scholar] [CrossRef]
  47. Mota, I.; Brandao, A. The Determinants of Location Choice: Single Plants Versus Multi Plants. Reg. Sci. 2013, 92, 31–49. [Google Scholar] [CrossRef] [Green Version]
  48. Marrocu, E.; Paci, R.; Usai, S. Productivity Growth in the Old and New Europe: The Role of Agglomeration Externalities. J. Reg. Sci. 2013, 53, 418–442. [Google Scholar] [CrossRef] [Green Version]
  49. Saito, H.; Gopinath, M. Plants’ Self-Selection, Agglomeration Economies and Regional Productivity in Chile. J. Econ. Geogr. 2009, 9, 539–558. [Google Scholar] [CrossRef]
  50. Da Silva Catela, E.Y.; Porcile, G.; Gonçalves, F. Brazilian Municipalities: Agglomeration Economies and Development Levels in 1997 and 2007. CEPAL Rev. 2010, 101, 141–156. [Google Scholar] [CrossRef]
  51. Pereira, M.; Soloaga, I. Determinants of Regional Growth of Manufacturing Sector in 1988–2008 Mexico; Technical Report; Centro De Estudios Economicos, El Colegio De Mexico CA: Mexico City, Mexico, 2012; pp. 1–46. [Google Scholar]
  52. Guevara, C.; Riou, S.; Autant Bernard, C. Agglomeration Externalities and Urbanization in Ecuador. In Proceedings of the 55th Congress of the European Regional Science Association, Lisbon, Portugal, 25–28 August 2015; Available online: https://halshs.archives-ouvertes.fr/halshs-01212174 (accessed on 10 June 2019).
  53. Escobar Mendez, A. Employment Growth in Manufacturing Industry in Mexico. Pap. Poblac. 2011, 17, 251–276. [Google Scholar]
  54. Cota, J.E.M. Agglomeration Economies and Urban Manufacturing Growth in the Northern Border Cities of Mexico. Econ. Mex. Nueva Epoca 2002, 11, 163–190. [Google Scholar]
  55. Graham, D.J.; Melo, P.S.; Jiwattanakulpaisarn, P.; Noland, R.B. Testing for Causality Between Productivity and Agglomeration Economies. J. Reg. Sci. 2010, 50, 935–951. [Google Scholar] [CrossRef]
  56. Duranton, G. Agglomeration Effects in Colombia. J. Reg. Sci. 2016, 56, 210–238. [Google Scholar] [CrossRef]
  57. Nakamura, R. Agglomeration Economies in Urban Manufacturing Industries: A Case of Japanese Cities. J. Urban Econ. 1985, 17, 108–124. [Google Scholar] [CrossRef]
  58. Combes, P.P.; Duranton, G.; Gobillon, L.; Roux, S. Estimating Agglomeration Economies with History, Geology, and Worker Effects. In Agglomeration Economics; Glaeser, E.L., Ed.; Chicago University Press: Chicago, IL, USA, 2010; pp. 15–66. [Google Scholar]
  59. Fujita, M.; Thisse, J. Agglomeration and Market Interaction (No. 2002011); Universite Catholique De Louvain, Center for Operations Research and Econometrics (CORE): Luwan-New Town, Belgium, 2002; pp. 1–52. [Google Scholar]
  60. INEC. Directory of Economic Establishments; National Institute of Statistics and Census: San Jose, CA, USA, 1980. [Google Scholar]
  61. Combes, P.P.; Mayer, T.; Thisse, J.F. Economic Geography: The Integration of Regions and Nations; Princeton University Press: Princeton, NJ, USA, 2008; pp. 1–397. [Google Scholar]
  62. Heckman, J.J. Sample Selection Bias as a Specification Error. Econometrica 1979, 47, 153–161. [Google Scholar] [CrossRef]
  63. Combes, P.P.; Duranton, G.; Gobillon, L. The Identification of Agglomeration Economies. J. Econ. Geogr. 2011, 11, 253–266. [Google Scholar] [CrossRef] [Green Version]
  64. Demoraes, F.; D’ercole, R. Cartografia De Riesgos y Capacidades en el Ecuador. Diagnostico Previo a Planes De Intervencion De Las ONG’s. Prevencion, Mitigacion, Preparacion ante Desastres. In Evaluacion De Capacidades y Reduccion De Vulnerabilidad; Oxfam Internacional: Quito, Ecuador, 2001; pp. 1–65. [Google Scholar]
  65. Head, K.; Mayer, T. Regional Wage and Employment Responses to Market Potential in the EU. Reg. Sci. Urban Econ. 2006, 36, 573–594. [Google Scholar] [CrossRef] [Green Version]
  66. Stock, J.H.; Yogo, M. Testing for Weak Instruments in Linear IV Regression. In Identification and Inference in Econometric Models: Essays in Honor of Thomas, J. Rothenberg; Andrews, D.W.K., Stock, J.H., Eds.; Cambridge University Press: Cambridge, MA, USA, 2005; pp. 80–108. [Google Scholar]
  67. Henderson, J.V. Marshall’s Scale Economies. J. Urban Econ. 2003, 53, 1–28. [Google Scholar] [CrossRef]
  68. Choi, M.; Choi, T. Agglomeration, Productivity, and High-Growth Firms in the Manufacturing Sector of South Korea. Int. J. Urban Sci. 2017, 21, 58–71. [Google Scholar] [CrossRef]
  69. Gonzalez Val, R.; Marcen, M. Agglomeration Economies in Small Cities and Business: The Impact of the Great Recession in Aragon (Spain). Sustainability 2019, 11, 3770. [Google Scholar] [CrossRef] [Green Version]
  70. Ciccone, A. Agglomeration Effects in Europe. Eur. Econ. Rev. 2002, 46, 213–227. [Google Scholar] [CrossRef] [Green Version]
  71. Brulhart, M.; Mathys, N. Sectoral Agglomeration Economies in a Panel of European Regions. Reg. Sci. Urban Econ. 2008, 38, 348–362. [Google Scholar] [CrossRef] [Green Version]
  72. O’Huallachain, B.; Satterthwaite, M.A. Sectoral Growth Patterns at the Metropolitan level. J. Urban Econ. 1992, 31, 25–58. [Google Scholar]
  73. Badr, K.; Rizk, R.; Zaki, C. Firm Productivity and Agglomeration Economies: Evidence from Egyptian Data. Appl. Econ. 2019, 51, 1–17. [Google Scholar] [CrossRef]
  74. Cameron, A.C.; Trived, P.K. Microeconometrics Using Stata, Revised Edition; Stata Press: College Station, TX, USA, 2010. [Google Scholar]
  75. Quintana Romero, L.; Mendoza, M.A.; Correa Quezada, R. Las Regiones Ecuatorianas en el Contexto Latinoamericano; Crecimiento, Industria, Migracion y Empleo: Quito, Ecuador, 2014; pp. 13–27. [Google Scholar]
  76. Ejermo, O. Technological Diversity and Jacobs’ Externality Hypothesis Revisited. Growth Chang. 2005, 36, 167–195. [Google Scholar] [CrossRef]
Figure 1. Average annual growth of employment in the cities of Ecuador: 1980–2010. Source: Based on National Institute of Statistics and Census-INEC data [60].
Symmetry 11 01421 g001
Figure 2. Relationship between size and diversity of the cities of Ecuador. Source: Own elaboration based on INEC data [60].
Symmetry 11 01421 g002
Table 1. Most and least specialized cities of Ecuador.
CitySectorIE
Five most specialized cities
2010CotacachiLeather industry47.5
RocafuerteOther manufacturing industries n.c.p.34.5
SantiagoOther manufacturing industries27.1
GuamoteConstruction of transport materials24.3
GualaceoFootwear manufacturing14.9
1980PujiliManufacturing of professional and scientific equipment78.1
PauteOther manufacturing industries n.c.p.38.5
San LorenzoWood Industry28.2
MejíaBasic iron and steel industry25.9
CotacachiLeather industry23.6
Five least specialized cities
2010GuayaquilManufacture of other chemicals1.9
PortoviejoPreparation and conservation of fruits, legumes and vegetables.2.4
EsmeraldasDevelopment of milling products, starches and starch products2.7
MiraPrinters, publishers and related industries2.9
ChillanesManufacture of food products3.0
1980QuitoManufacturing of industrial chemicals1.7
ChimboManufacture of other chemicals1.8
MachalaPrinters, publishers and related industries2.2
LatacungaManufacture of electrical equipment2.6
MiraManufacture of plastic products3.4
Note: IE: index of specialization (measure related to localization economies), calculated as in Equation (1). n.c.p: not classified in another part. Source: Based on INEC data [60].
Table 2. Most and least diversified cities of Ecuador.
Ten Most Diverse Cities
2010ID1980ID
Quito3.17Guayaquil2.73
Loja2.64Quito2.33
Tulcán2.43Latacunga1.91
Ibarra2.33Portoviejo1.89
Portoviejo2.32Ibarra1.74
Guayaquil2.21Guaranda1.74
Santo Domingo2.16Loja1.69
Huaquillas2.10Tulcán1.61
Pasaje2.08Chunchi1.60
Guaranda2.01Cuenca1.59
Ten Least Diverse Cities
2010ID1980ID
Chillanes0.75San Lorenzo0.59
Antonio Ante0.78Eloy Alfaro0.61
Guamote0.84Sozoranga0.64
San Pedro de Pelileo0.85San Jacinto de Yaguachi0.69
Sozoranga0.86Palora0.70
Montecristi0.90Cañar0.73
Mera0.90Guano0.73
Guano0.92SigSig0.75
Otavalo0.92Mera0.75
Patate0.92Gualaceo0.80
Note: ID is the index of diversity (a measure used in economics that reports on the economic concentration of a market), calculated as in Equation (2). Source: Based on INEC data [60].
Table 3. Summary of statistics of the main variables.
VariableMeanStandard Deviation
Employment growth (productivity indicator)05630.782
Specialization−0.0970.815
Diversity−0.9830.470
Density−1.7111.958
Average size firms−0.25090.609
Note: The growth of employment (1980–2010). All variables refer to logarithms.
Table 4. First stage: employment.
VariableIIIIII
specialization index0.230 ***0.036 *−0.029
(0.029)(0.015)(0.029)
diversity index−0.091 ***0.060 ***0.240 ***
(0.025)(0.013)(0.025)
population density 19742−0.0030.017 ***0.096 ***
(0.003)(0.012)(0.003)
urbanization index 1980−0.058 *0.179 ***0.720 ***
(0.023)(0.013)(0.024)
geological dummy0.0800.345 ***0.044
(0.058)(0.030)(0.058)
centrality index−0.506 ***−0.269 ***2.100 ***
(0.143)(0.075)(0.143)
Fixed Effects
RegionYesYesYes
ProvinceYesYesYes
IndustryYesYesYes
R20.240.370.87
F-test18.65118.55498.79
R2_adjusted0.220.360.86
Note: Dependent variable: endogenous regressors. (I) employment, (II) diversity, (III) employment density. Standard error between parentheses. p-values: * p < 0.1; ** p < 0.05; *** p < 0.01. All variables are expressed in logarithms.
Table 5. Employment growth: estimates by ordinary least squares (OLS), Tobit, and instrumental variables (IV) (two-stage least squares; 2SLS).
EmploymentOLSTOBIT2SLS
specialization−0.461 ***−0.656 ***0.287 *
(0.017)(0.031)(0.146)
diversity0.123 ***0.471 ***−0.229
(0.030)(0.075)(0.149)
density−0.094 ***−0.201 ***0.097 *
(0.012)(0.019)(0.057)
size firms0.004−0.020 ***−0.294 ***
(0.023)(0.046)(0.066)
reverse ratio Mills−0.233 ***---0.210
(0.064) (0.143)
N296329632963
F------10.91
Fixed Effects
RegionYesNoYes
ProvinceYesNoYes
IndustryYesYesYes
Over identification (Sargan Test)------1.91
p value—Sargan Test------(0.5912)
Note: Standard error between parentheses. p values: * p < 0.1; ** p < 0.05; *** p < 0.01. All variables are expressed in logarithms.
Table 6. First stage: employment. Estimates by limited-information maximum likelihood (LIML).
VariableIIIIII
specialization index0.231 ***0.036 *−0.029
(0.029)(0.015)(0.029)
diversity index−0.091 ***0.060 ***0.240 ***
(0.025)(0.013)(0.025)
population density_19742−0.0030.017 ***0.096 ***
(0.003)(0.002)(0.003)
urbanization index_1980−0.058 *0.179 ***0.720 ***
(0.023)(0.013)(0.024)
geological dummy0.0800.345 ***0.044
(0.058)(0.030)(0.058)
centrality index−0.506 ***−0.269 ***2.100 ***
(0.143)(0.075)(0.143)
Fixed Effects
RegionYesYesYes
ProvinceYesYesYes
IndustryYesYesYes
R20.240.370.87
F-test18.65118.55498.79
R2_adjusted0.220.360.86
Note: Dependent variable: endogenous regressors. (I) employment, (II) diversity, (III) employment density. Standard error between parentheses. P values: * p < 0.1; ** p < 0.05; *** p < 0.01. All variables are expressed in logarithms.
Table 7. Employment growth: Estimates by LIML.
EmploymentLIML
Specialization0.309 *
(0.150)
Diversity−0.240
(0.152)
Density0.102 *
(0.045)
Size firms−0.303 ***
(0.068)
Inverse Mills ratio0.219
(0.146)
N2963
F10.91
CONTROL
Literacy index 1980Yes
FIXED EFFECTS
RegionYes
ProvinceYes
IndustryYes
OVER IDENTIFICATION TESTAnderson–Rubin1.89
Bassman F (1,2913)0.62
Note: Standard error between parentheses. P values: * p < 0.1; ** p < 0.05; *** p < 0.01. All variables are expressed in logarithms.

