Enhanced Hand-Oriented Activity Recognition Based on Smartwatch Sensor Data Using LSTMs
by
 , , and
Sakorn Mekruksavanich
1 ,
,
Anuchit Jitpattanakul
2,* ,
,
Phichai Youplao
3,4,* and
and
Preecha Yupapin
3,4
1
Department of Computer Engineering, School of Information and Communication Technology, University of Phayao, Phayao 56000, Thailand
2
Intelligent and Nonlinear Dynamic Innovations Research Center, Department of Mathematics, Faculty of Applied Science, King Mongkut’s University of Technology North Bangkok, Bangkok 10800, Thailand
3
Computational Optics Research Group, Advanced Institute of Materials Science, Ton Duc Thang University, District 7, Ho Chi Minh City 729000, Vietnam
4
Faculty of Applied Sciences, Ton Duc Thang University, District 7, Ho Chi Minh City 729000, Vietnam
*
Authors to whom correspondence should be addressed.
Symmetry 2020, 12(9), 1570; https://0-doi-org.brum.beds.ac.uk/10.3390/sym12091570
Submission received: 29 August 2020
/
Revised: 14 September 2020
/
Accepted: 18 September 2020
/
Published: 22 September 2020
(This article belongs to the Section Computer)
Abstract
:The creation of the Internet of Things (IoT), along with the latest developments in wearable technology, has provided new opportunities in human activity recognition (HAR). The modern smartwatch offers the potential for data from sensors to be relayed to novel IoT platforms, which allow the constant tracking and monitoring of human movement and behavior. Recently, traditional activity recognition techniques have done research in advance by choosing machine learning methods such as artificial neural network, decision tree, support vector machine, and naive Bayes. Nonetheless, these conventional machine learning techniques depend inevitably on heuristically handcrafted feature extraction, in which human domain knowledge is normally limited. This work proposes a hybrid deep learning model called CNN-LSTM that employed Long Short-Term Memory (LSTM) networks for activity recognition with the Convolution Neural Network (CNN). The study makes use of HAR involving smartwatches to categorize hand movements. Using the study based on the Wireless Sensor Data Mining (WISDM) public benchmark dataset, the recognition abilities of the deep learning model can be accessed. The accuracy, precision, recall, and F-measure statistics are employed using the evaluation metrics to assess the recognition abilities of LSTM models proposed. The findings indicate that this hybrid deep learning model offers better performance than its rivals, where the achievement of 96.2% accuracy, while the f-measure is 96.3%, is obtained. The results show that the proposed CNN-LSTM can support an improvement of the performance of activity recognition.
1. Introduction
Miniature sensors have driven rapid growth in the wearable technology sector, since they permit computerized monitoring at any time [1]. A wide range of affordable wearable products are now available, including smartwatches, smartphones, and smart glasses. Through their internal gyroscopes and accelerometers, these devices are able to record significant quantities of data which can then undergo analysis to determine the various activities the wearer has performed [2]. It is then possible to classify those activities and use the information for various purposes, such as monitoring the elderly [3], tracking exercise [4], or protecting people from office workers’ syndrome [5].
To date, mobile computing and human activity recognition have become popular and complex [6,7]. The data obtained from the various wearable sensors can be treated as time-series data, where a majority of studies have focused on the recognition of activity through the use of smartphones [8,9,10,11]. Almost everyone now carries a smartphone, which increases the potential of the applications they use. However, one drawback is the fact that phones are usually carried in bags or pockets, are therefore not consistently positioned on the body. Furthermore, a phone held in the trouser pocket is not ideally positioned to record hand movements, which cannot even be relied upon to maintain the same orientation as it is carried around. For female users, the smartphone is especially inconvenient as many do not even carry it in their pockets, preferring instead to use a handbag. Smartwatches, however, can solve many of these issues, and since they are worn in a fixed position on the wrist, they are the best choice to capture hand movements [12].
There are a number of benefits offered by smartwatches, in which other forms of inertial sensor technology cannot match. Among these include the fact that smartwatches are able to merge the features of a smartphone with the ability to monitor data constantly. Through small screens, it is possible for the user to interact with the smartwatch wherever they are located. The watch can be worn at all times, will be waterproof, and typically has a much longer useful battery lifespan than a smartphone [13]. Moreover, smartphones cannot always be carried during periods of strenuous exercise due to their size and shape. In contrast, smartwatches can be worn while exercising and can, therefore, generate data from the compass, GPS, accelerometer, and gyroscope, as well as monitoring heart rates [14,15].
Today’s greater availability of wearable technology has brought about increased interest in HAR in order to bring about benefits for people’s health and well-being [16]. During the past five years there has been a notable increase in the number of research papers published in this particular field [17], with a majority of these studies focusing on the applications of HAR in conventional machine learning (ML) models. Such models typically employ ML algorithms such as support vector machines, naive Bayes, decision trees, hidden Markov, and k-nearest neighbor models. The drawback to such approaches, however, is the reliance upon hand-crafted shallow feature extraction, which is a practice that relies heavily upon the knowledge of the humans performing the work [18]. Furthermore, these ML approaches apply independent statistical formulas to segment each time step within the time-series data, which leads to the time and space relationships within the data being lost when the models are trained. However, in more recent years, published studies have begun to show the accomplishments of deep learning (DL) models in addressing complicated HAR issues [19,20]. These techniques differ from the traditional ML approaches since it becomes possible to address high-level features when examining raw data from sensors.
In this study, a smartwatch-based approach to HAR is examined in the context of hand movement recognition using data from sensors in a smartwatch, along with the Wireless Sensor Data Mining (WISDM) public smartwatch dataset, which is composed of IMU sensor data that records the activity of the hands as well as data associated with eating of 51 participants were provided with the data. This study suggested the use of a hybrid deep learning model that employed LSTM networks for recognition performance improvement.
The remaining paper is structured as follows. Section 2 presents the preliminary background and related works in the research work of human activity recognition. In Section 3, an overview of the proposed smartwatch based HAR framework is presented. The details of each process in the framework are described. Section 4 conducts the experiments from various scenarios, as well as showing improvable results by the proposed framework comparing with state-of-the-art evaluation metrics. Finally, Section 5 presents the research conclusion and challenging future points.
2. Preliminary Background
2.1. Human Activity Recognition
The definition of human activity covers all physical movements involved in human life, whether necessary or otherwise. Such activity requires energy to be spent in moving the skeletal muscles, with examples including walking, eating, sitting, standing, and so forth. When conducting research involving time-series classification, human activity recognition (HAR) faces the challenges of classifying the sequences of data obtained from wearable sensors in time-series format, to determine clearly defined human movements [21,22,23,24].
Suppose a human performs some activities according to a pre-defined activity set A = {, , , …, }, where m means the number categories of physical activity. Given a time-series sequence s = {, , …, , …, } of sensor data reading is captured from the human activity information, where means the data sensor reading at time t and n denoted of sequence and n ≥ m. The HAR task aims to determine a function F to forecast the physical activity sequence which based on data sensor reading s. The function F can be defined:
Meanwhile the real activity sequence is indicated as:
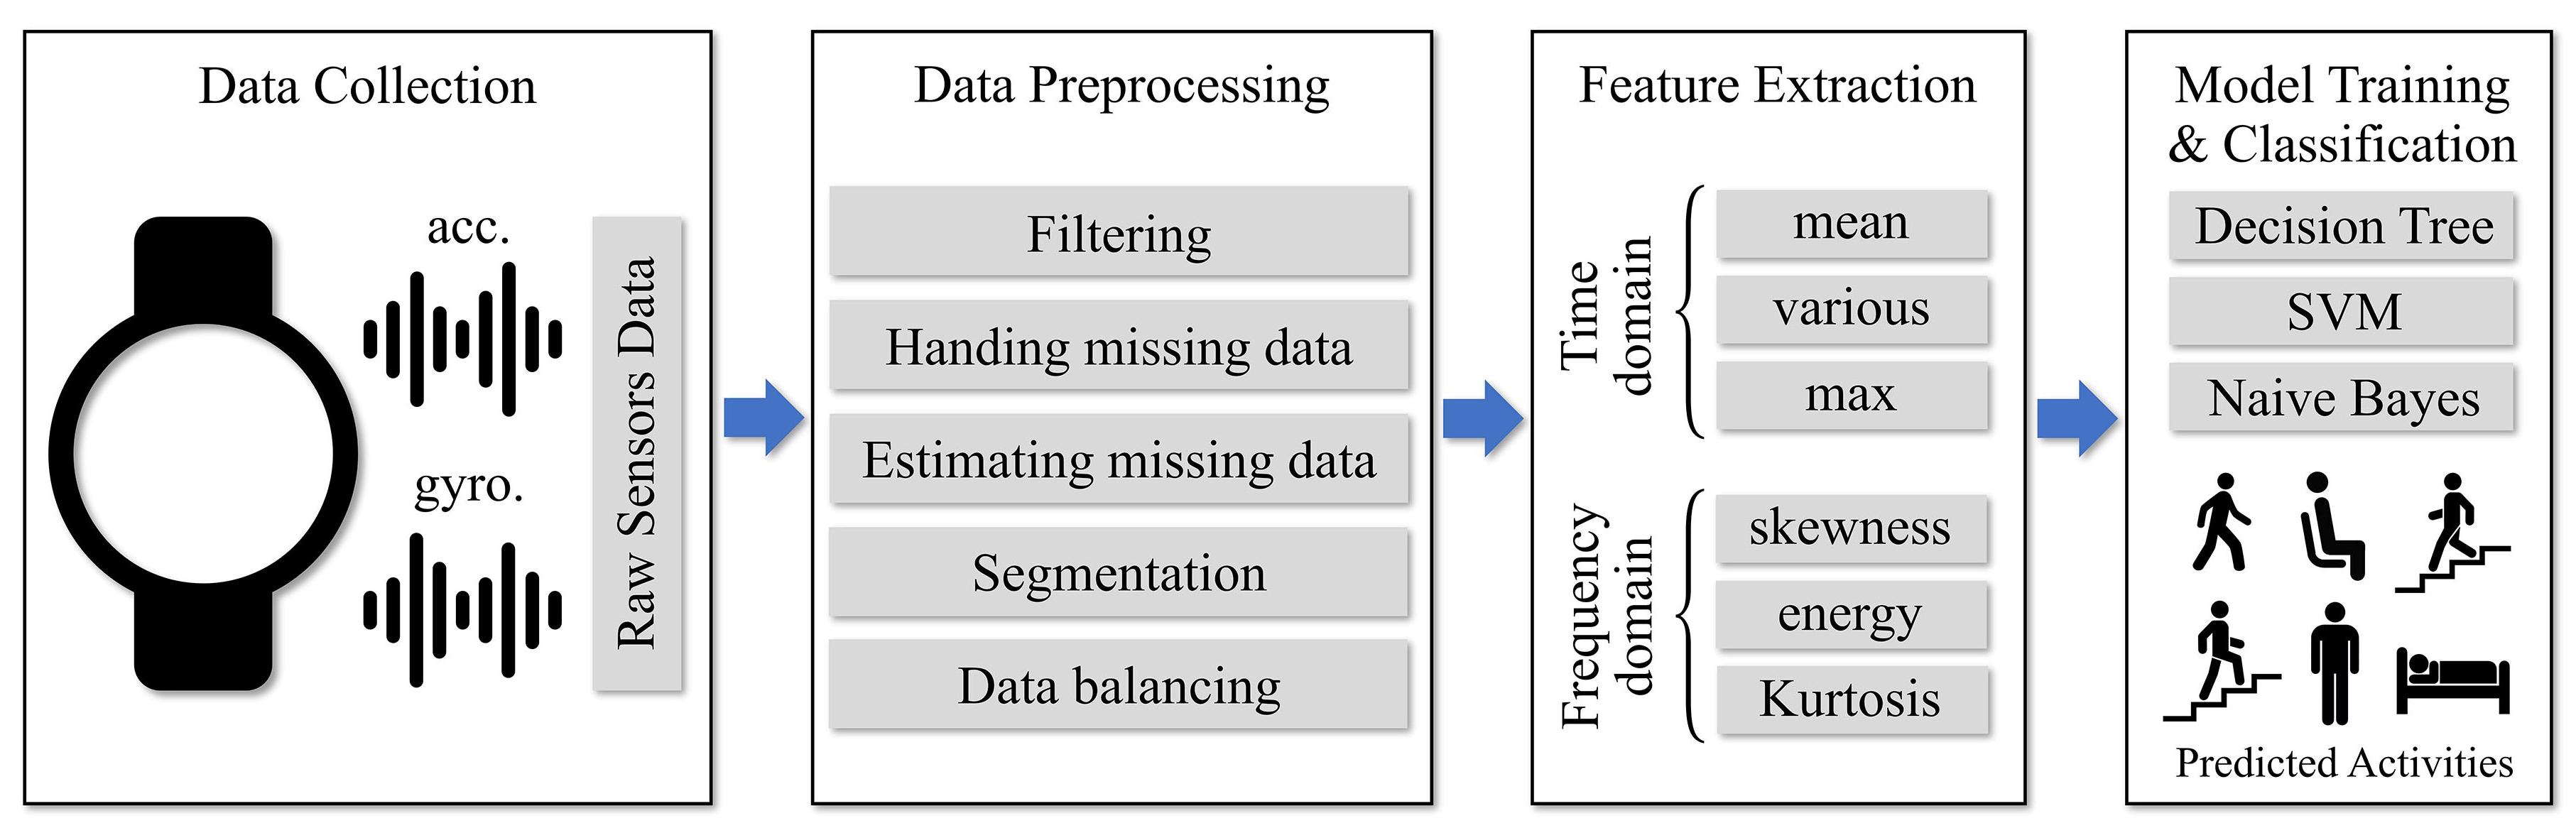
The general framework encompassing HAR using wearable sensor data is shown in Figure 1. This framework comprises four key processes which can be employed to categorize the various forms of physical activity based on raw data from the activity sensors. In the first step, the raw data are gathered from the IMU sensors carried in wearable technology. Then in step two, the data are cleaned and prepared through the preprocessing phase [25]. This involves filtering and addressing the issue of missing data from sensor errors by including estimations based on statistical formulas. The data must then be segmented and balanced. However, because the sensor data appears in time-series form, the characteristic features is necessary to be extracted from the high-dimensional data. In the final stage, these features will then be used to train the model through the use of various ML algorithms including naive Bayes, support vector machines, or decision tree. Once trained, the ML model will then be capable of recognizing and categorizing human activity.
2.2. Deep Learning with HAR
Important recent studies of HAR [17] have revealed certain problems associated with conventional machine learning techniques which ultimately influence the ability to recognize human activity. This limitation concerns the choice of hand-crafted features since the selection is dependent upon the skills and knowledge of the person taking the decisions [26]. Within the time span of just a few years, however, deep learning has been applied as a suitable alternative approach which can address these limitations effectively.
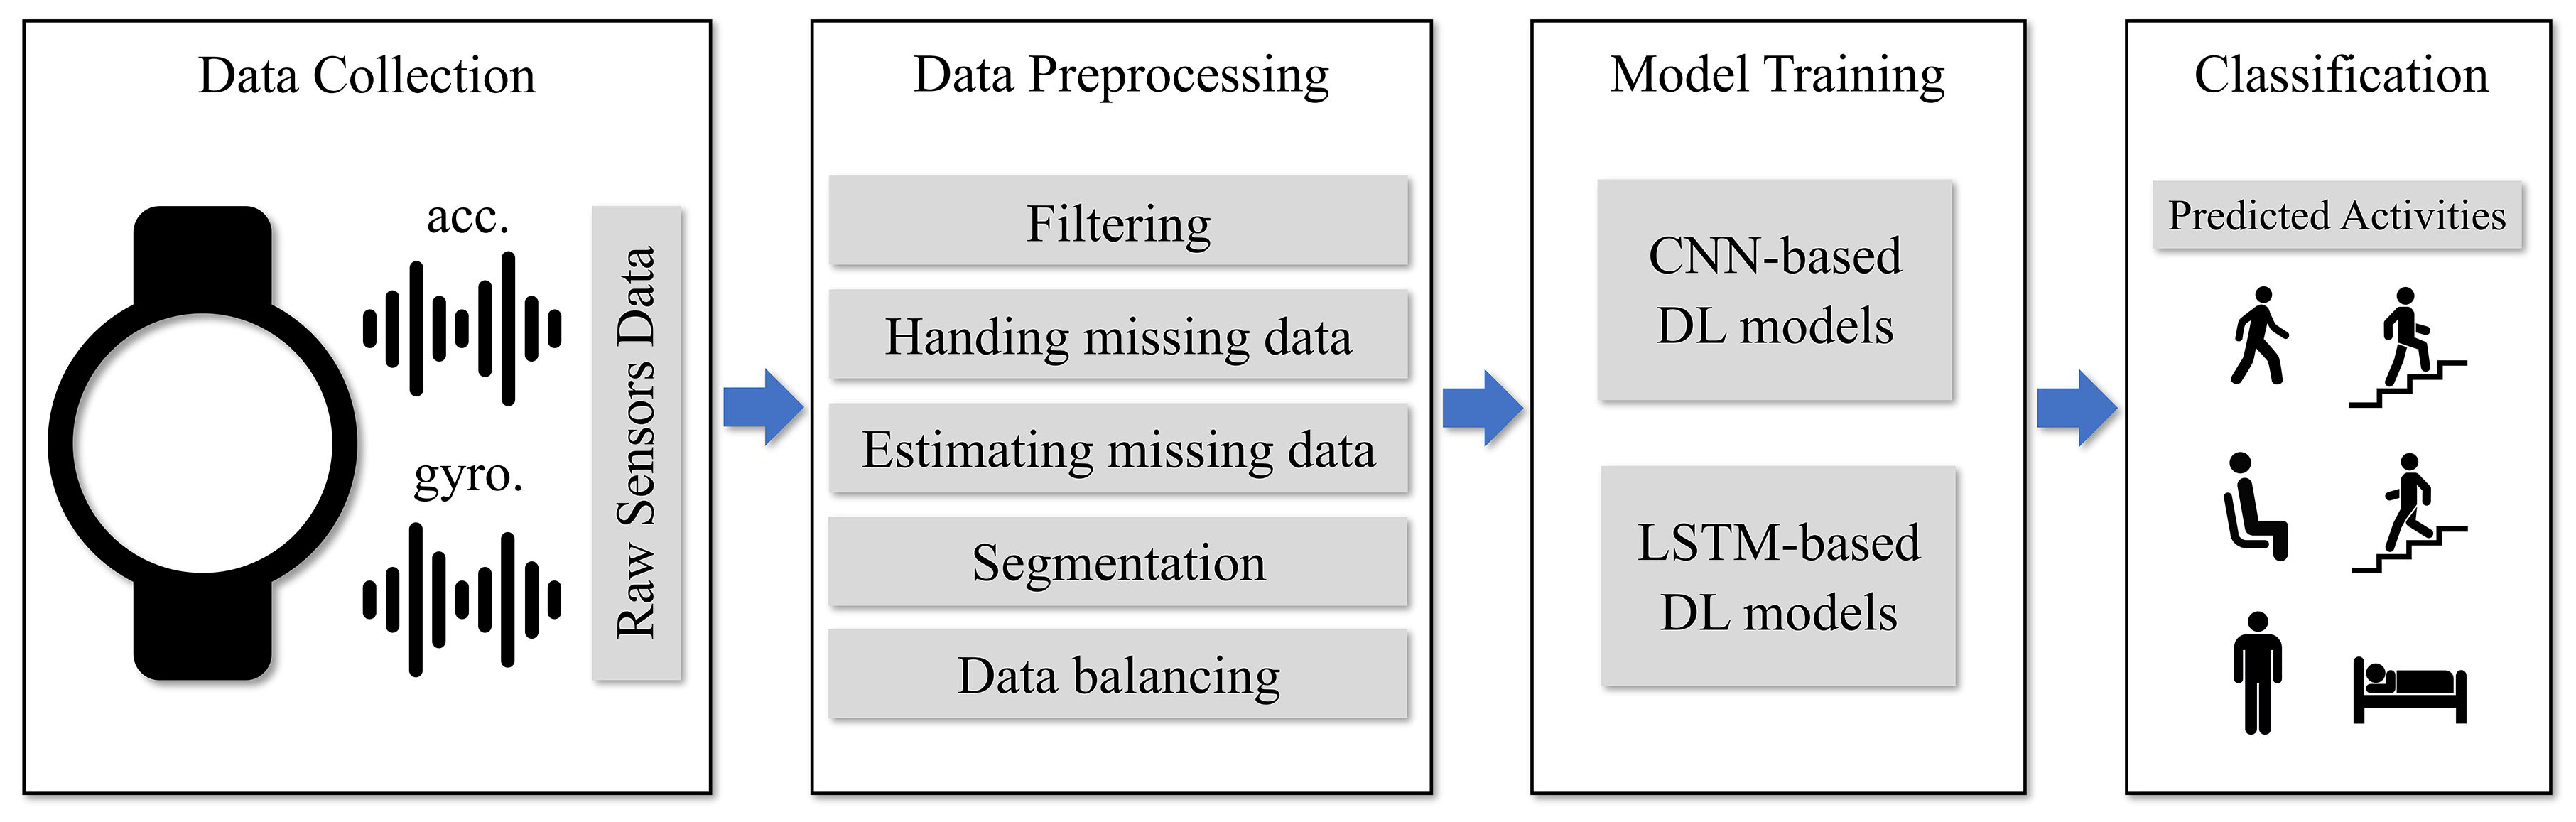
Figure 2 shows the deep learning process can eliminate the need for feature extraction in the general HAR framework. Recently, the studies have put forward several models for deep learning, which can be addressed the issues related to the time-series classification of HAR problems. Studies have examined some learning models to assess their recognition abilities in terms of miscellaneous benchmark activity datasets. Two of the main models are Convolution Neural Networks (CNNs) and Long Short-Term Memory Networks (LSTMs); they are effective for HAR problems using smartphones since they offer appropriate evaluation metrics. These two models are thus investigated in this study to determine their effectiveness in recognizing hand movements using data from smartwatches.
3. Proposed Framework
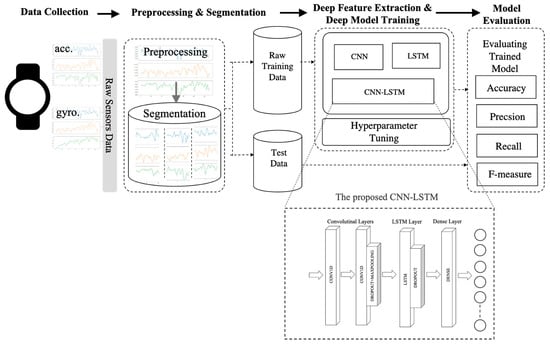
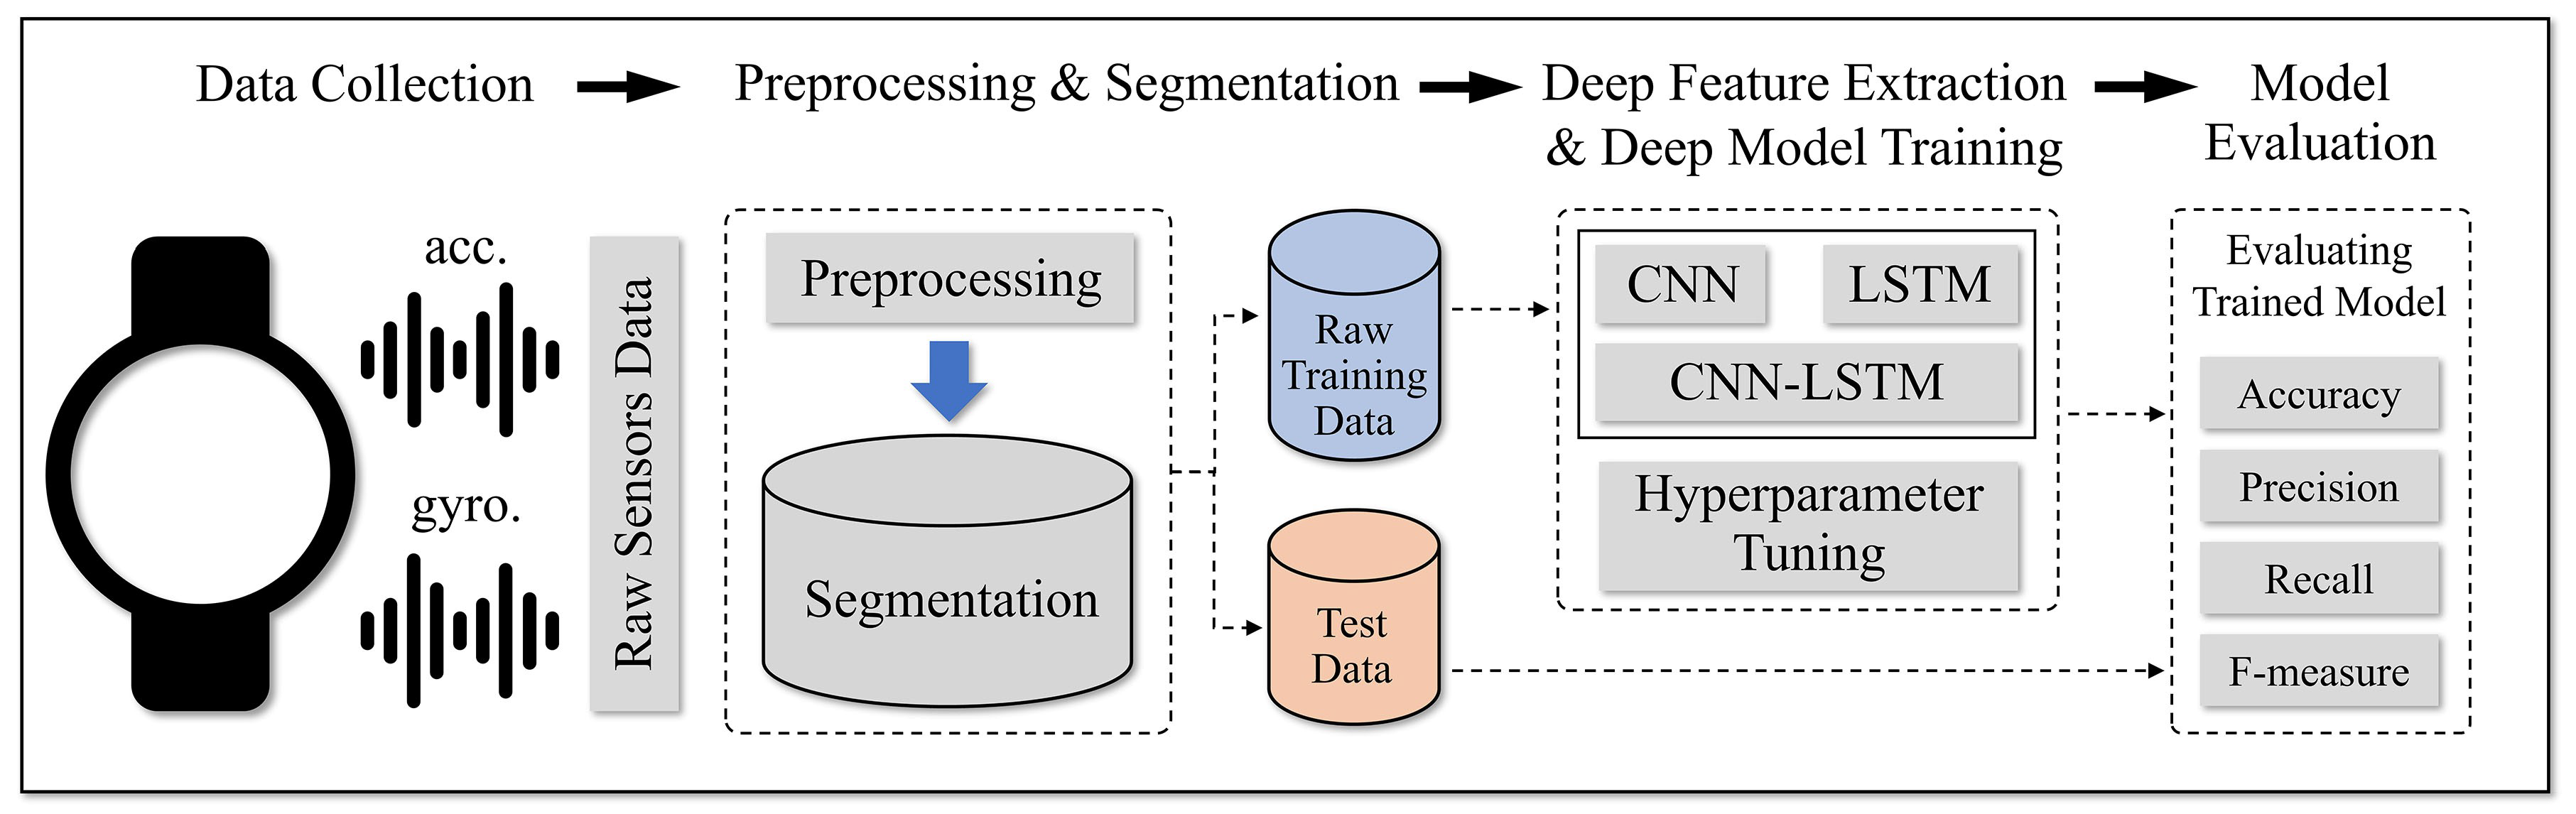
In this section, the proposed framework for hand-oriented activity recognition based on smartwatch sensor data is presented. The overall process of the framework is depicted as Figure 3.
The framework consists of four main processes (Data collection, Data preprocessing and segmentation, Deep model training, and Model evaluation).
3.1. Data Collection
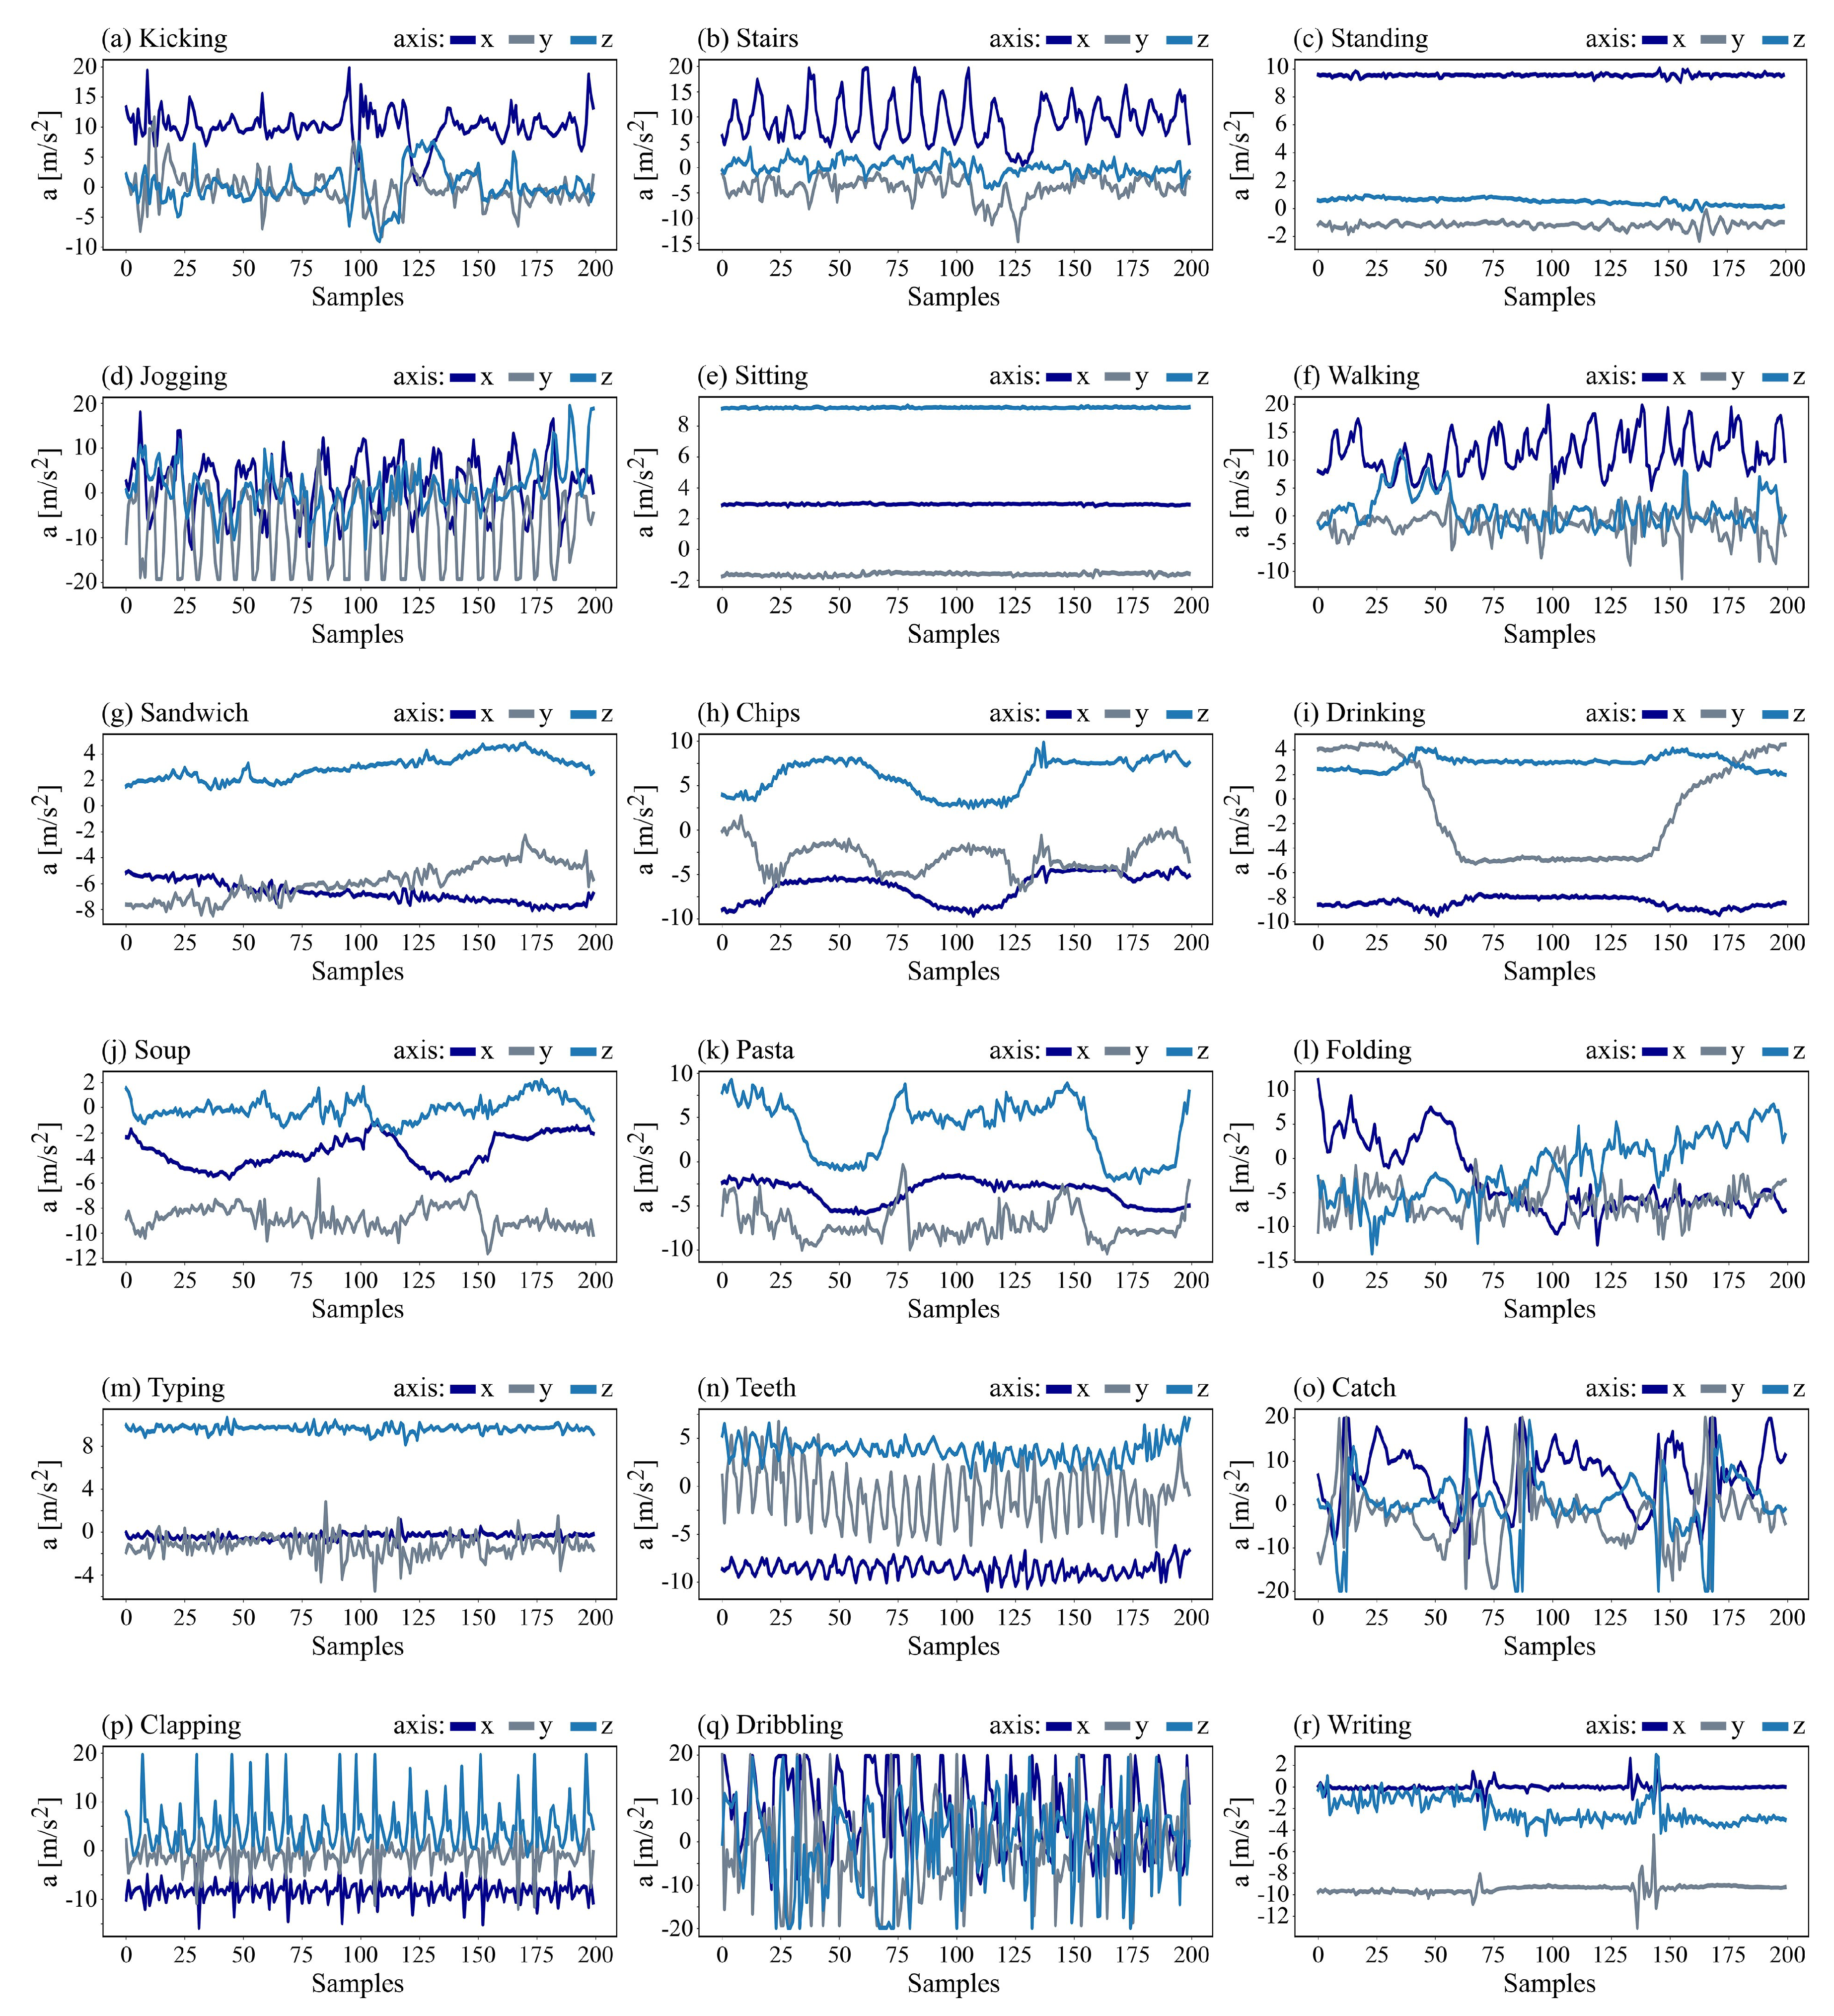
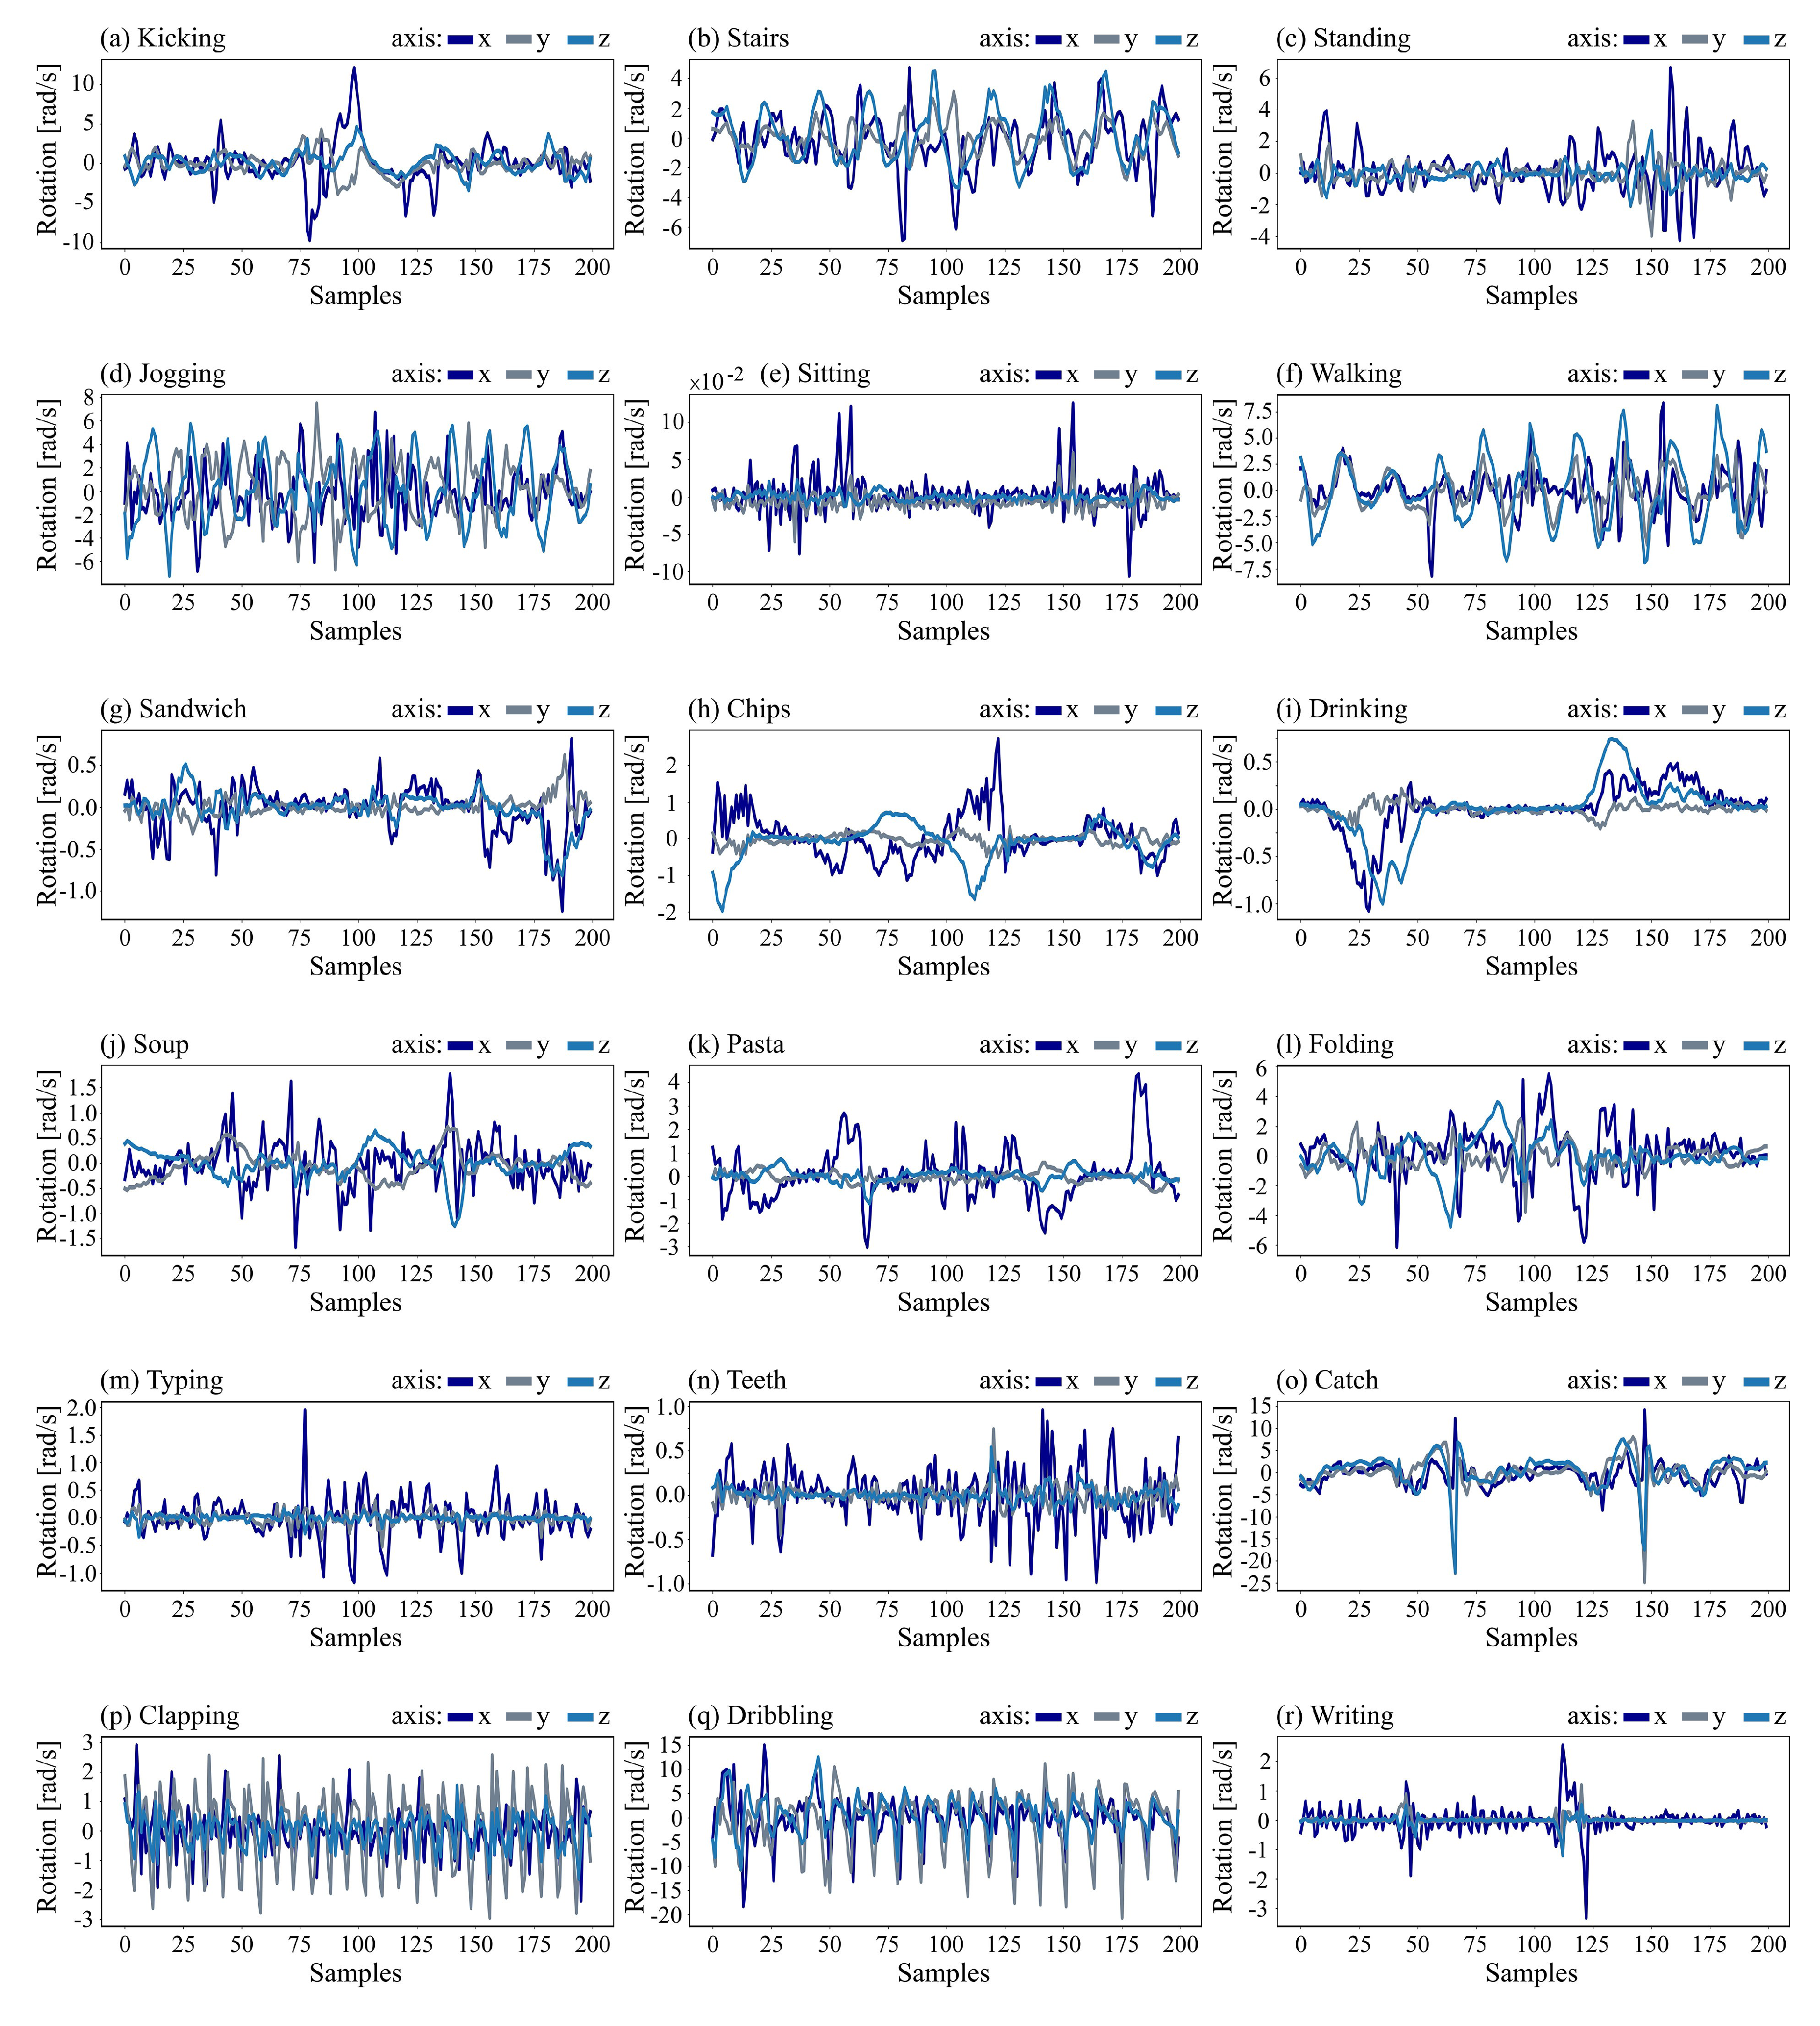
The smartwatch data used in the research work is a public benchmark dataset called WISDM from the UCI Repository [27]. This dataset provides tri-axial accelerometer data and tri-axial gyroscope data collected at a rate of 20 Hz from Android smartphones and an Android smartwatch. Data is gathered at a rate of 20 Hz in every 50 ms. The Android smartphone and smartwatch are Samsung Galaxy S5 with Android 6.0 operating system and LG G Watch running with Android Wear 1.5, respectively. These raw sensor data are recorded from 51 subjects with 18 and 25 years who performed 18 pre-defined physical activities. All subjects wear the smartwatch on their dominant hand while they are performing the activities [28,29]. These physical activities can be categorized into three main categories, i.e., non-hand-oriented activities, hand-oriented eating activities, and hand-oriented general activities. Some samples from accelerometer data and gyroscope data are illustrated in Figure 4 and Figure 5, respectively.
3.2. Data Preprocessing and Segmentation
The activities from the WISDM dataset have been found to be recorded separately from the exploratory data analysis. This means that each person performs one activity for approximately 3 min in a raw data, followed by the next activity, etc. When looking at the timestamps, it can be seen that the transitions from one activity to the next one are not continuous, but the recording has happened in isolation. The smartphone and smartwatch data is not also synchronized, i.e., they have not been collected in parallel.
This research analyzes the sensor data by exploratory data analysis and finds that there are activity data of 7 subjects did not contain all pre-defined activities. So, the seven subjects are cut-off, i.e., subject number 1616, 1618, 1637, 1638, 1639, 1640, and 1642. To handle time-series data on the HAR problem with 75% of the overlapping proportion as shown in Figure 6, the smartwatch data remains with 44 subjects from 55 subjects, where the data is also segmented by a sliding window of 10 s. The number of raw sensor data is shown in Table 1.
Given the sampling rate of 20 Hz and the windows size of 10 s, there are 200 raw sensor data for each sample. Then these sensor samples are split to 70% as training set and remaining 30% as test set for evaluating the proposed model. The numbers of smartwatch sensor samples used in this work is presented in Table 2.
3.3. Deep Model Training
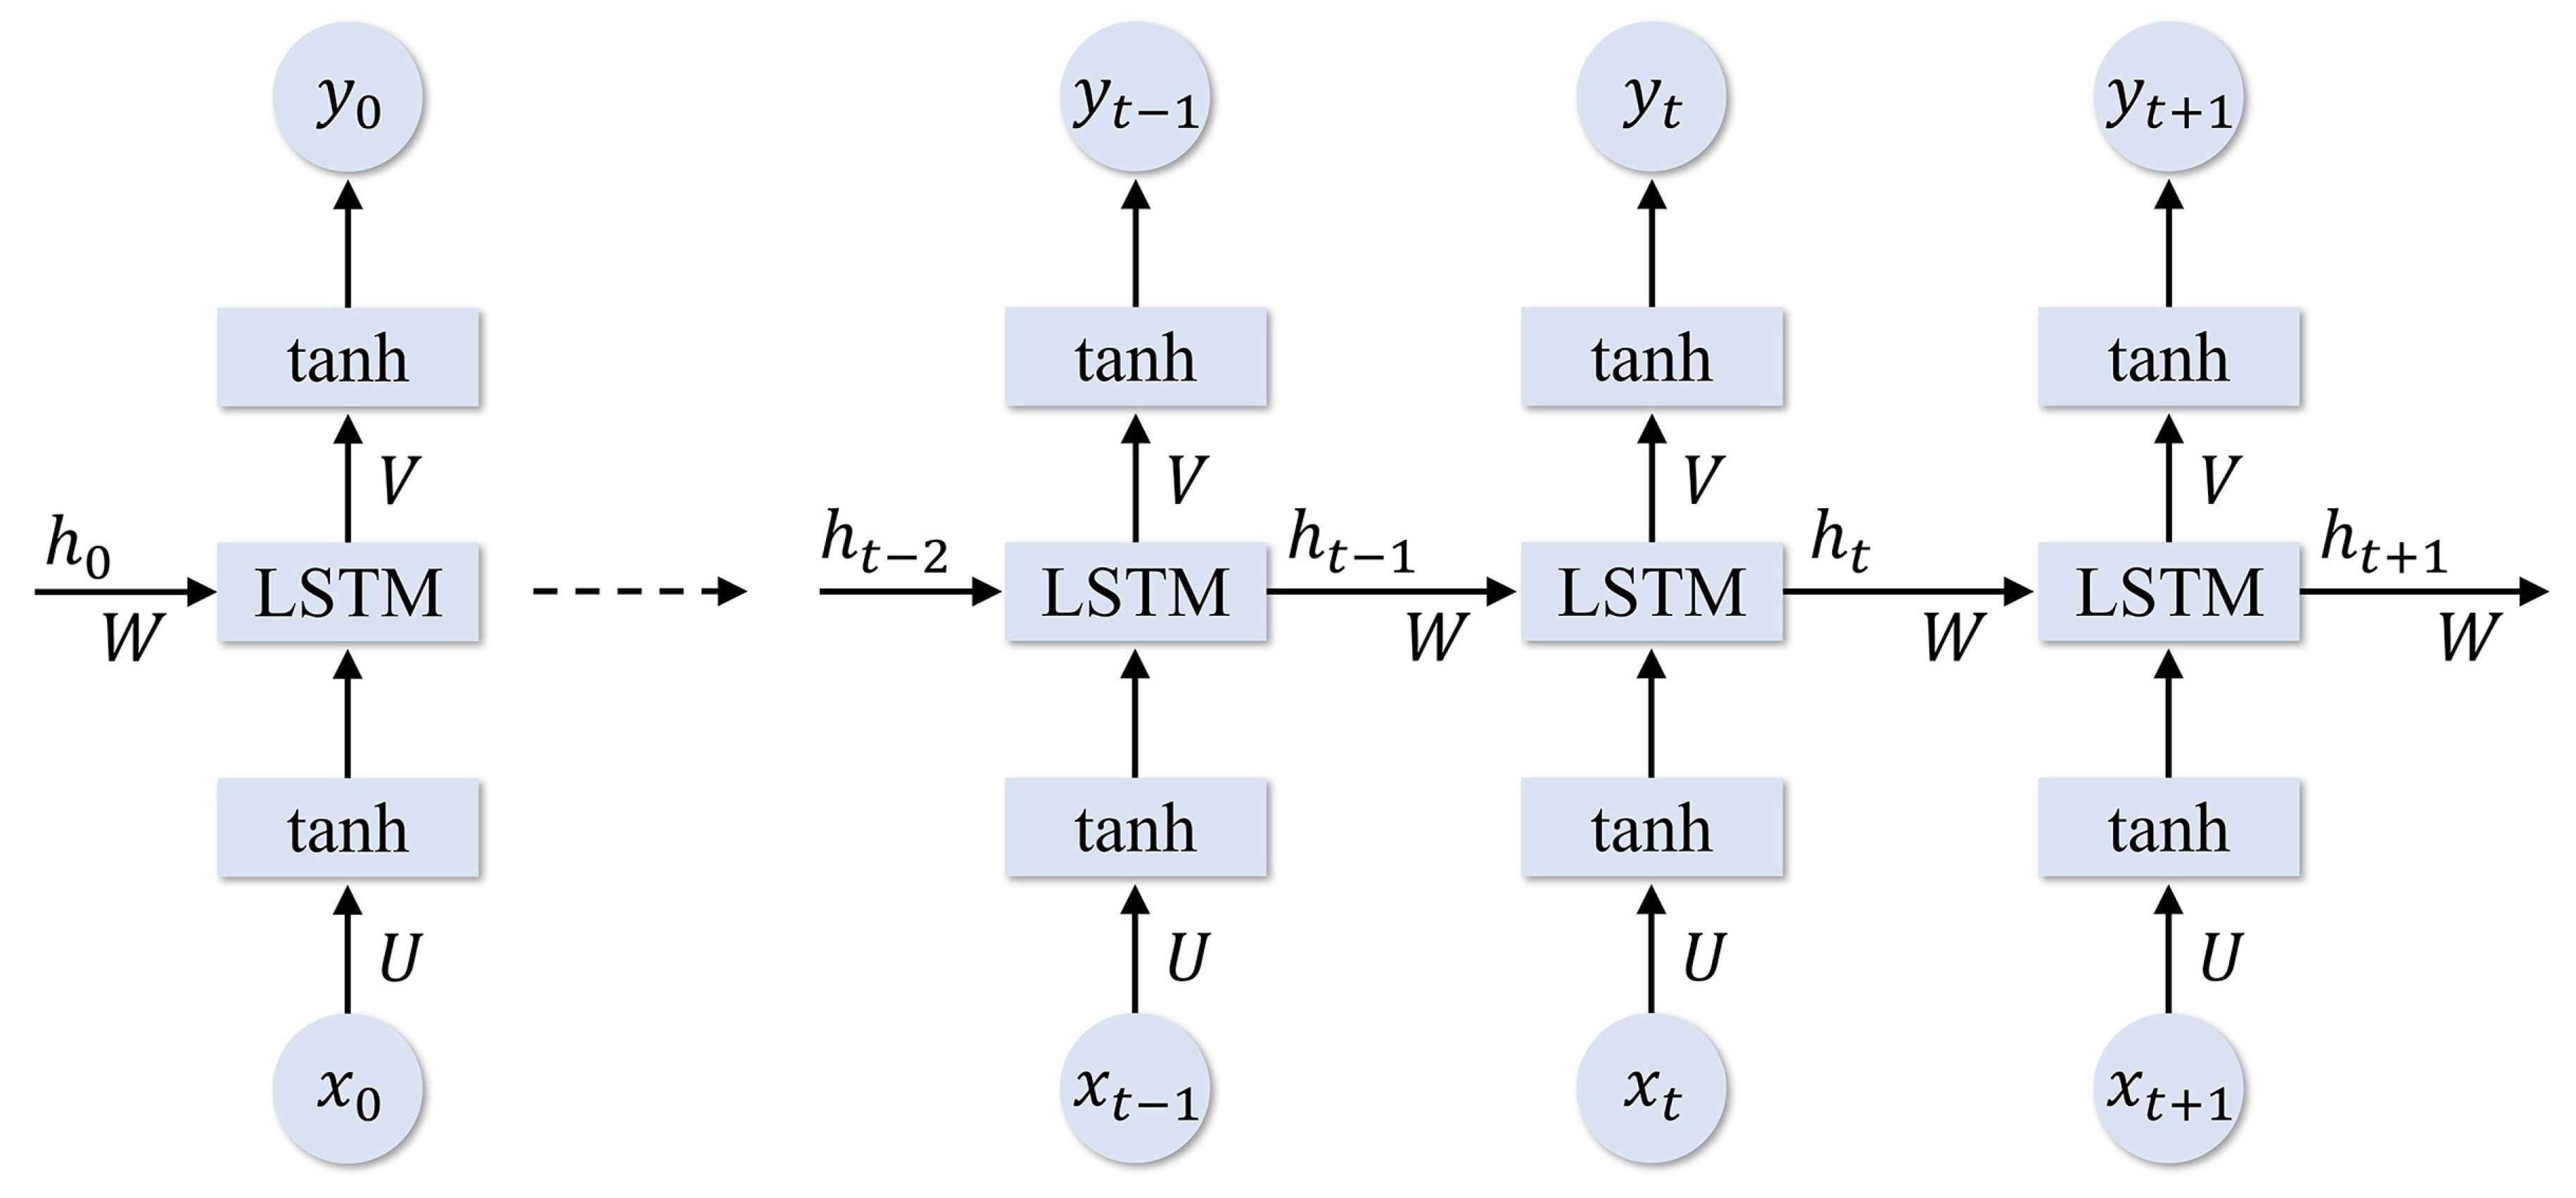
LSTM is an extended deep learning model of recurrent neural networks (RNN) [30]. LSTM is proposed to tackle vanishing and exploding gradient problems [31]. The computational process of the LSTM network can be detailed as the following process: (1) any input data X = {, , , …, , , …} is turned into the data together with the data of the hidden layer at the last stage to the hidden layer H = {, , , …, , , …} by the matrix transformation technique, and (2) the hidden layer output passes under an activation function to the last value of the output layer Y = {, , , …, , , …} as illustrated in Figure 7.
The LSTM network consists of the specific characteristic structure for memorizing information for a stretched time. The input and forget gate manipulate process to replace the new result information by comparing the internal memory with the new data feeding. This process enhances gradients to circulate effectively in time.
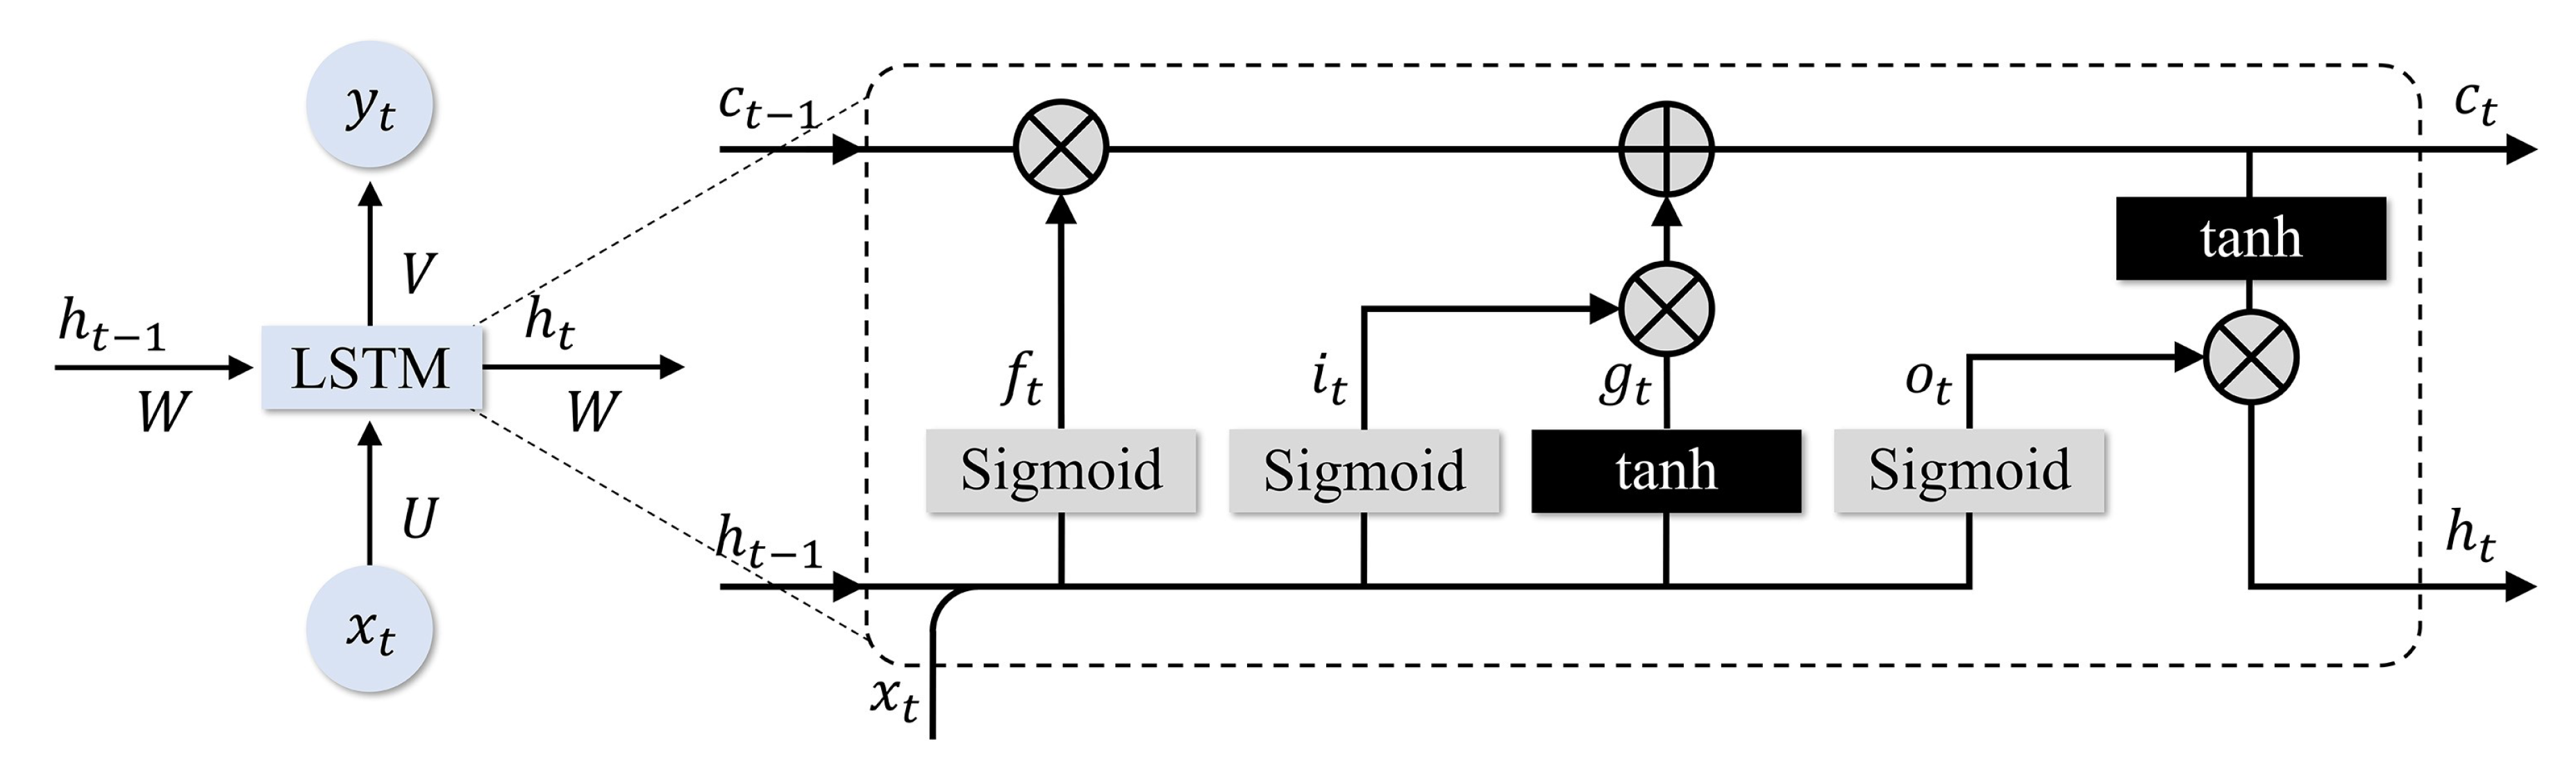
As shown in Figure 8, input gate (i), forget gate (f), output gate (o) and memory cell (C) of LSTM are designed to control what information should be stored, updated, and deleted. Gating is the technique to pass the needed information selectively [32]. This technique composes of the Sigmoid and the Hadamard product function. Derived output value within range of [0, 1] is allowed the multiplication to proceed the information. This consideration is the effective practice to initialize these gates to a value of 1 or close to 1. So, this situation is not to debilitate training initially. Therefore, each parameter at the moment t can be defined in the LSTM node.
From Figure 8, each gate that works inside an LSTM cell is mathematically defined as the following expressions [33]:
where:
- Forget gate manipulates when there is desired unnecessary data to delete.
- Input gate manipulates the input activation of new data into the memory cell.
- Input modulation gate manipulates the preeminent input to the memory cell.
- Output gate manipulates the flow of output.
- Internal state manipulates the constitutional recurrence of cell.
- Hidden state manipulates the data from the preceding data case inward the context window.
Equations (3)–(8) described the detailed process of LSTM network as following: (1) When there is a need to delete unnecessary data that involves the forget gate. (2) New data which needs to store in memory with an input gate is determined. Then the state value of an old node C is updated to the new node state C. (3) Finally, which data should be output to the layer over with an output gate is determined.
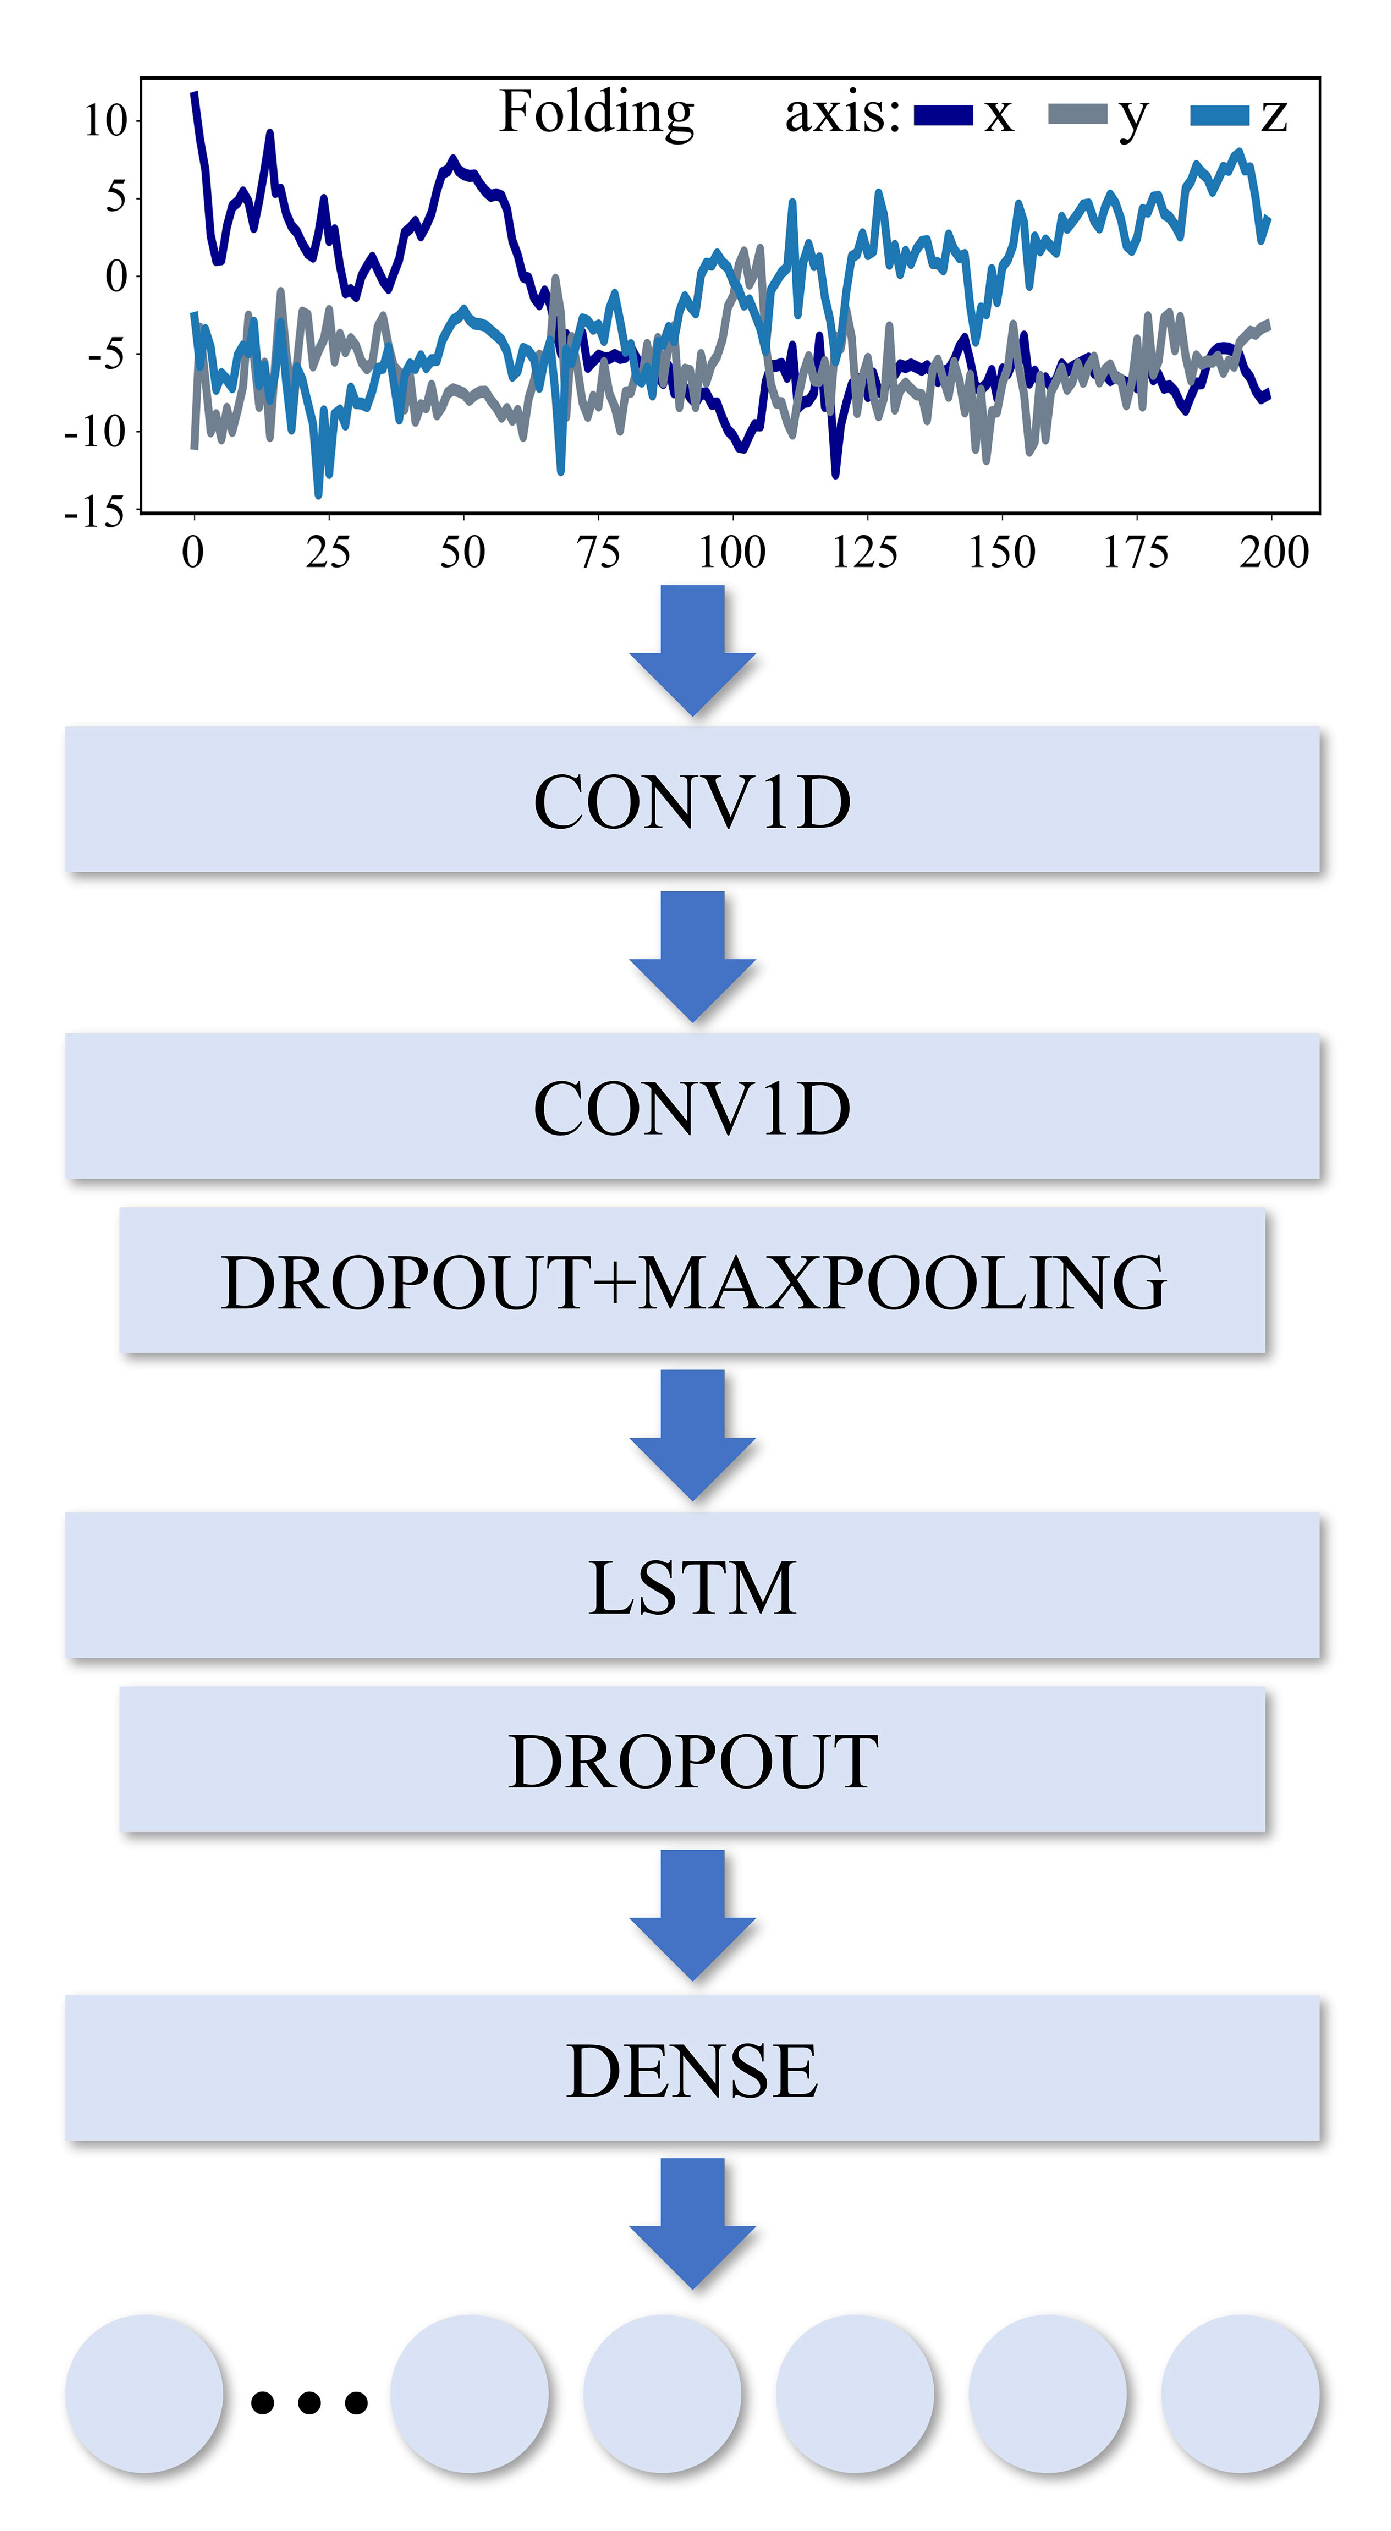
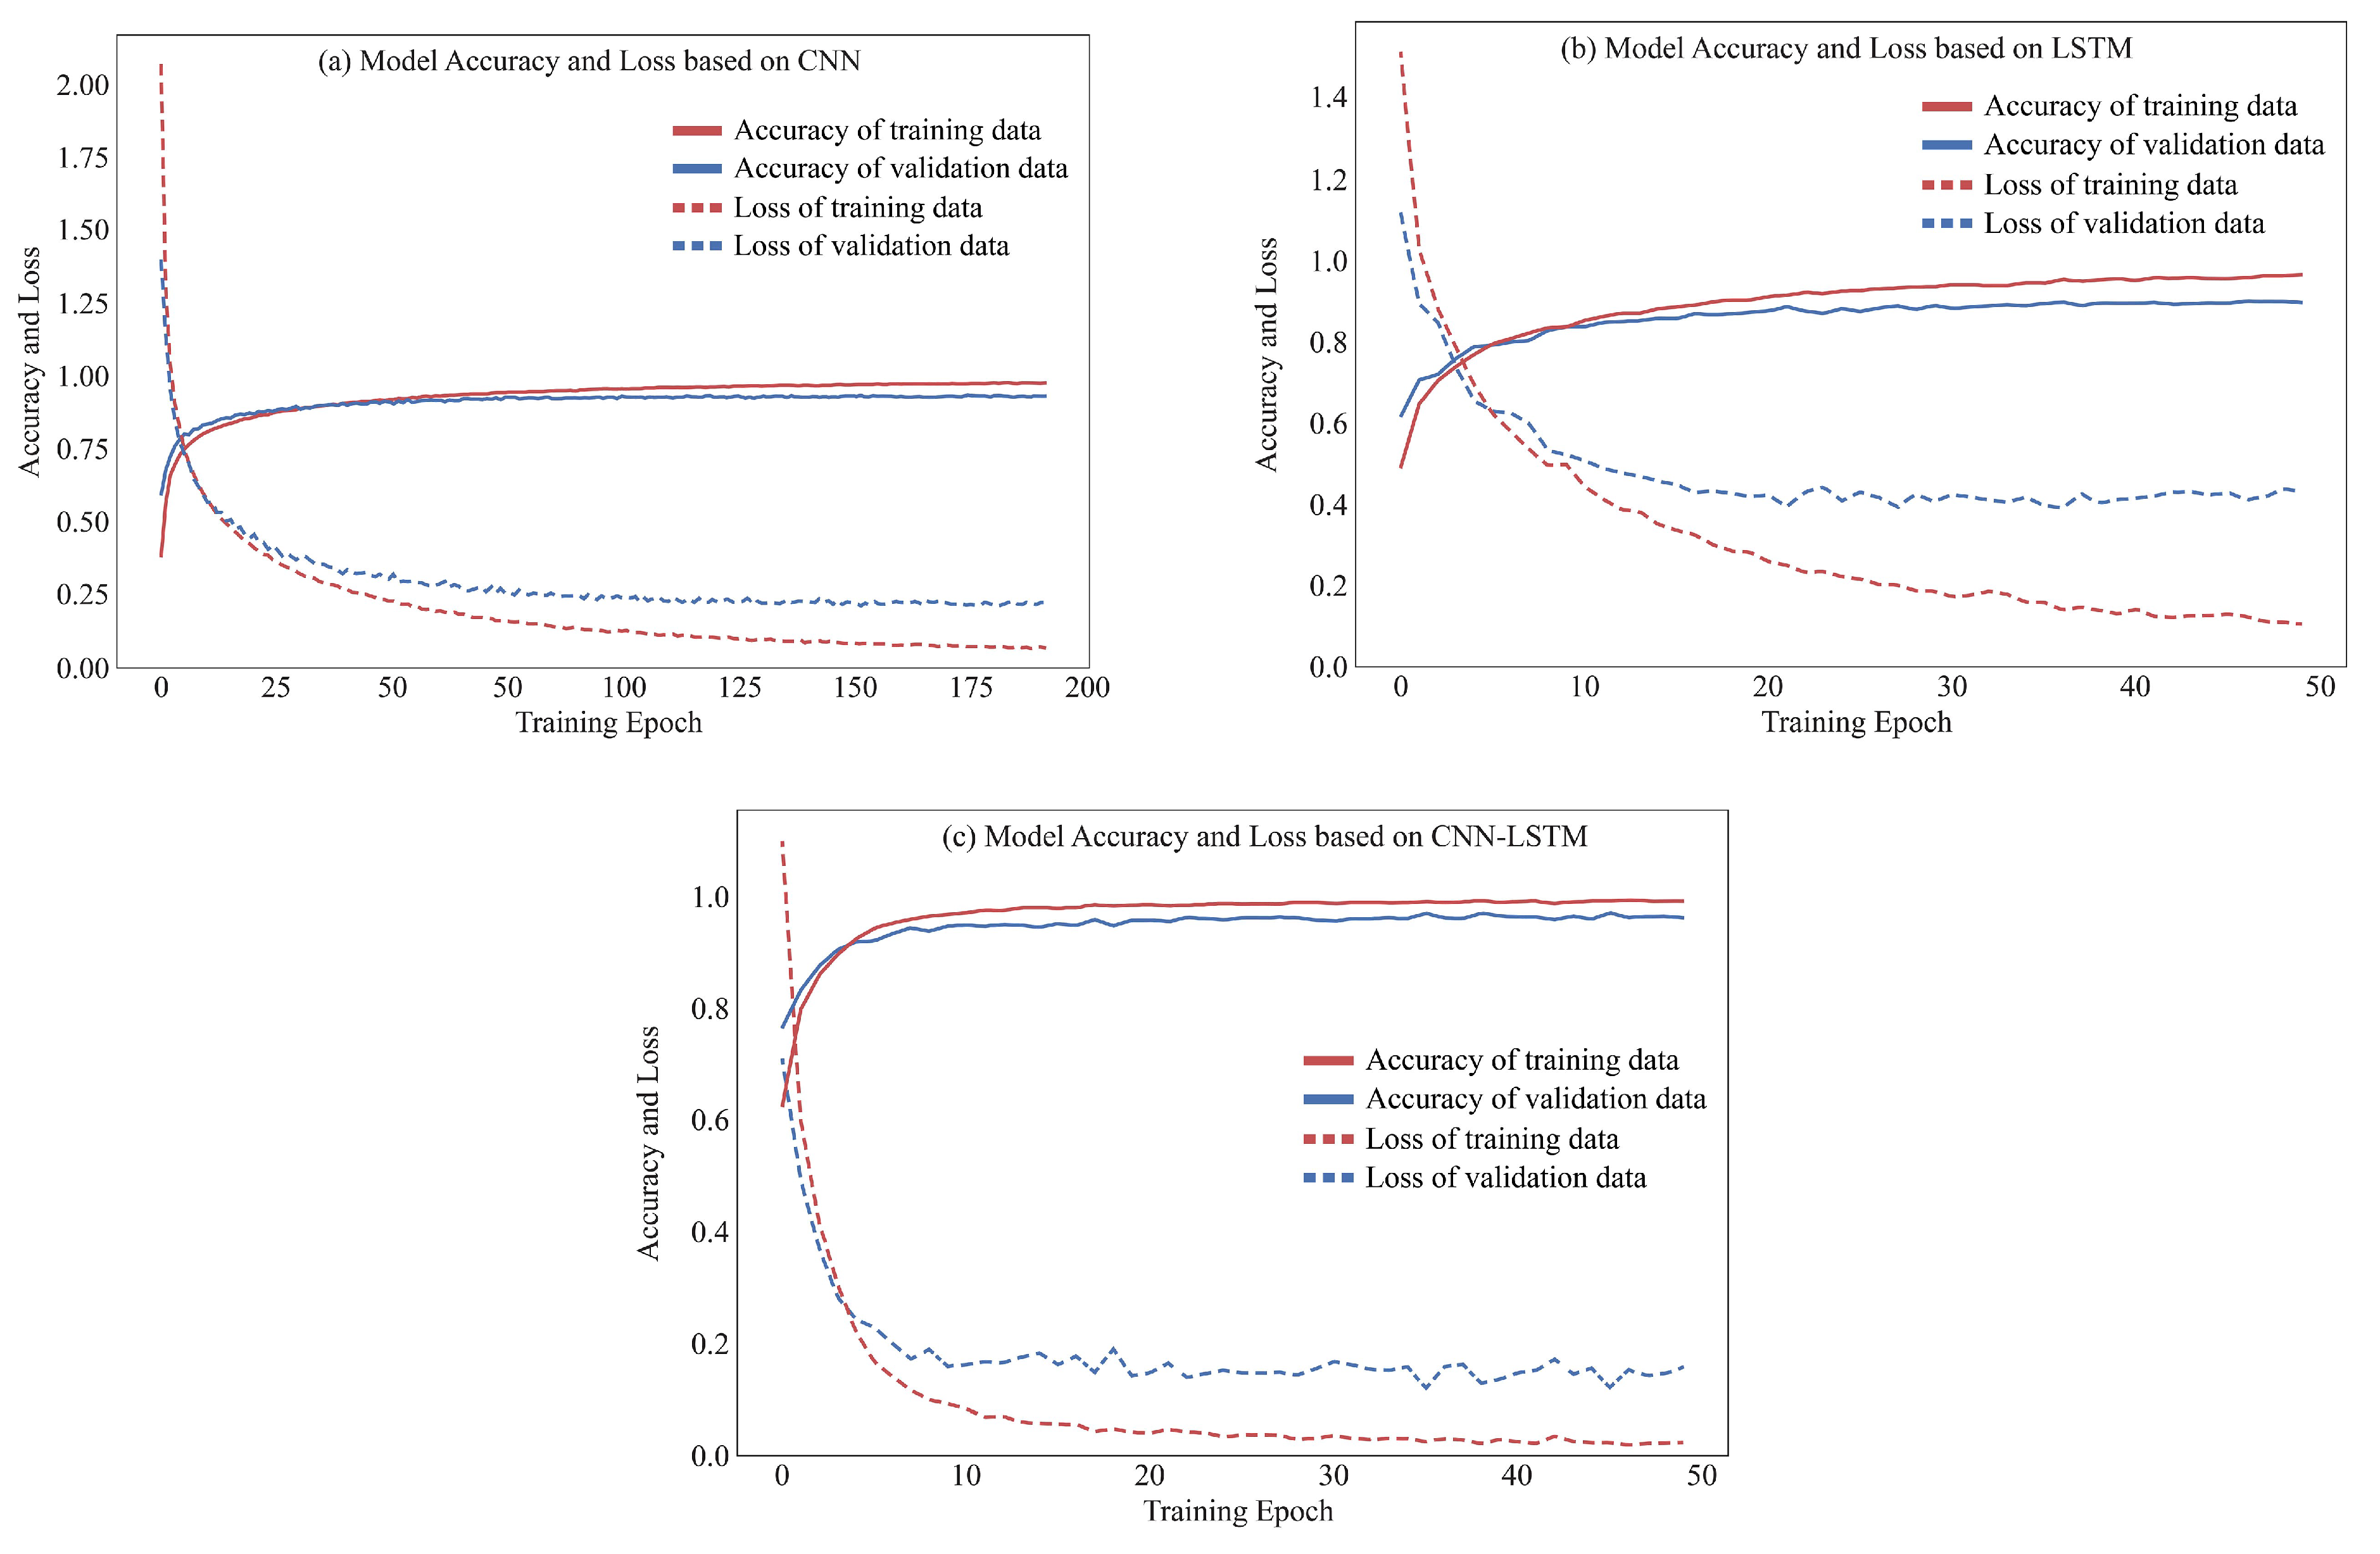
The hybrid LSTM network called CNN-LSTM is proposed to enhance the recognition performance in this research. The CNN-LSTM is consisted of two convolutional layers with one LSTM layers. The structure of CNN-LSTM can be illustrated in Figure 9. The proposed CNN-LSTM model introduces by 1D-CNN two layers with 3 × 1 kernels for extracting deep spatial appearances from smartwatch sensor data. The number of filters is set to 128 and 64 for the first and second 1D-CNN layer, respectively. The rectified linear function is used as the activation function in the proposed model. After the second 1D-CNN layer is processed, the dropout technique is applied. A LSTM layer with 128 units is then applied before a dropout layer for extracting temporal features. Finally, a completely connected dense layer is employed to the LSTM output at the final time step with a SoftMax function. Figure 10 shows accuracy and loss examples of the training process of CNN, LSTM, and the proposed CNN-LSTM. The gap between training and validation accuracy is a clear indication of the overfitting problem. Many gaps in the network affect to increase overfitting problems.
3.4. Model Evaluation
Generally four evaluation metrics for multi-class classification are employed to verify the performance of the proposed CNN-LSTM models. Accuracy, precision, recall, and F-measure are considered as performance metrics evaluation in this research work. When correctly recognized, such activity could be classified as True Positive (TP) or True Negative (TN). On the other hand, activity can be classified as False Positive (FP) or False Negative (FN) when incorrectly classified by metrics. True Positive or True Negative derive other performance metrics. Given denotes the total true positive rate for a classifier on all classes, denotes the total true negative rate, denotes the total false positive rate, and denotes the total false negative rate. These metrics are detailed following.
3.4.1. Accuracy
Accuracy shows that ratio of correctly classified issues which is the sum of correct classification divide by the total number of classifications.
3.4.2. Precision
Similar to accuracy, precision measures the accuracy value based on the negative instance fraction, which is classified as negative. The total precision (Precision) is the average of the precision for each class mean by Precisionc:
3.4.3. Recall
Recall shows the effectiveness of correctly forecasted issues as positive instances. The total recall (Recall) is the average of the recall for each class mean by Recallc:
3.4.4. F-Measure
F-measure helps to search the balancing of precision and recall. There is an uneven class distribution (larger amount of actual negatives). The F-measure for each class is denoted by F-measurec.
4. Experimental Results
4.1. Experiments
Experimental implementation is conducted by using Python 3.6.9, TensorFlow 2.2.0, Keras 2.3.1, Scikit-Learn, Numpy 1.18.5, and Pandas 1.0.5 libraries in this research. The experiments have been executed on the Google Colab platform with Tesla K80 and also optimized hyperparameters of each deep learning model by SigOpt. Three different experiments are set up with three DL models—CNN, LSTM, and proposed CNN-LSTM—as following scenarios:
- Scenario 1—Only raw accelerometer data,
- Scenario 2—Only raw gyroscope data,
- Scenario 3—Raw accelerometer data and raw gyroscope data.
Table 3 shows layer types of baseline deep learning models (CNN anf LSTM) with the proposed CNN-LSTM model.
4.2. Experimental Results
For performance evaluation, smartwatch sensor data is used from WISDM dataset by splitting 70% for training models and the remaining 30% for testing the trained models. The experimental results of all three scenarios are shown in Table 4.
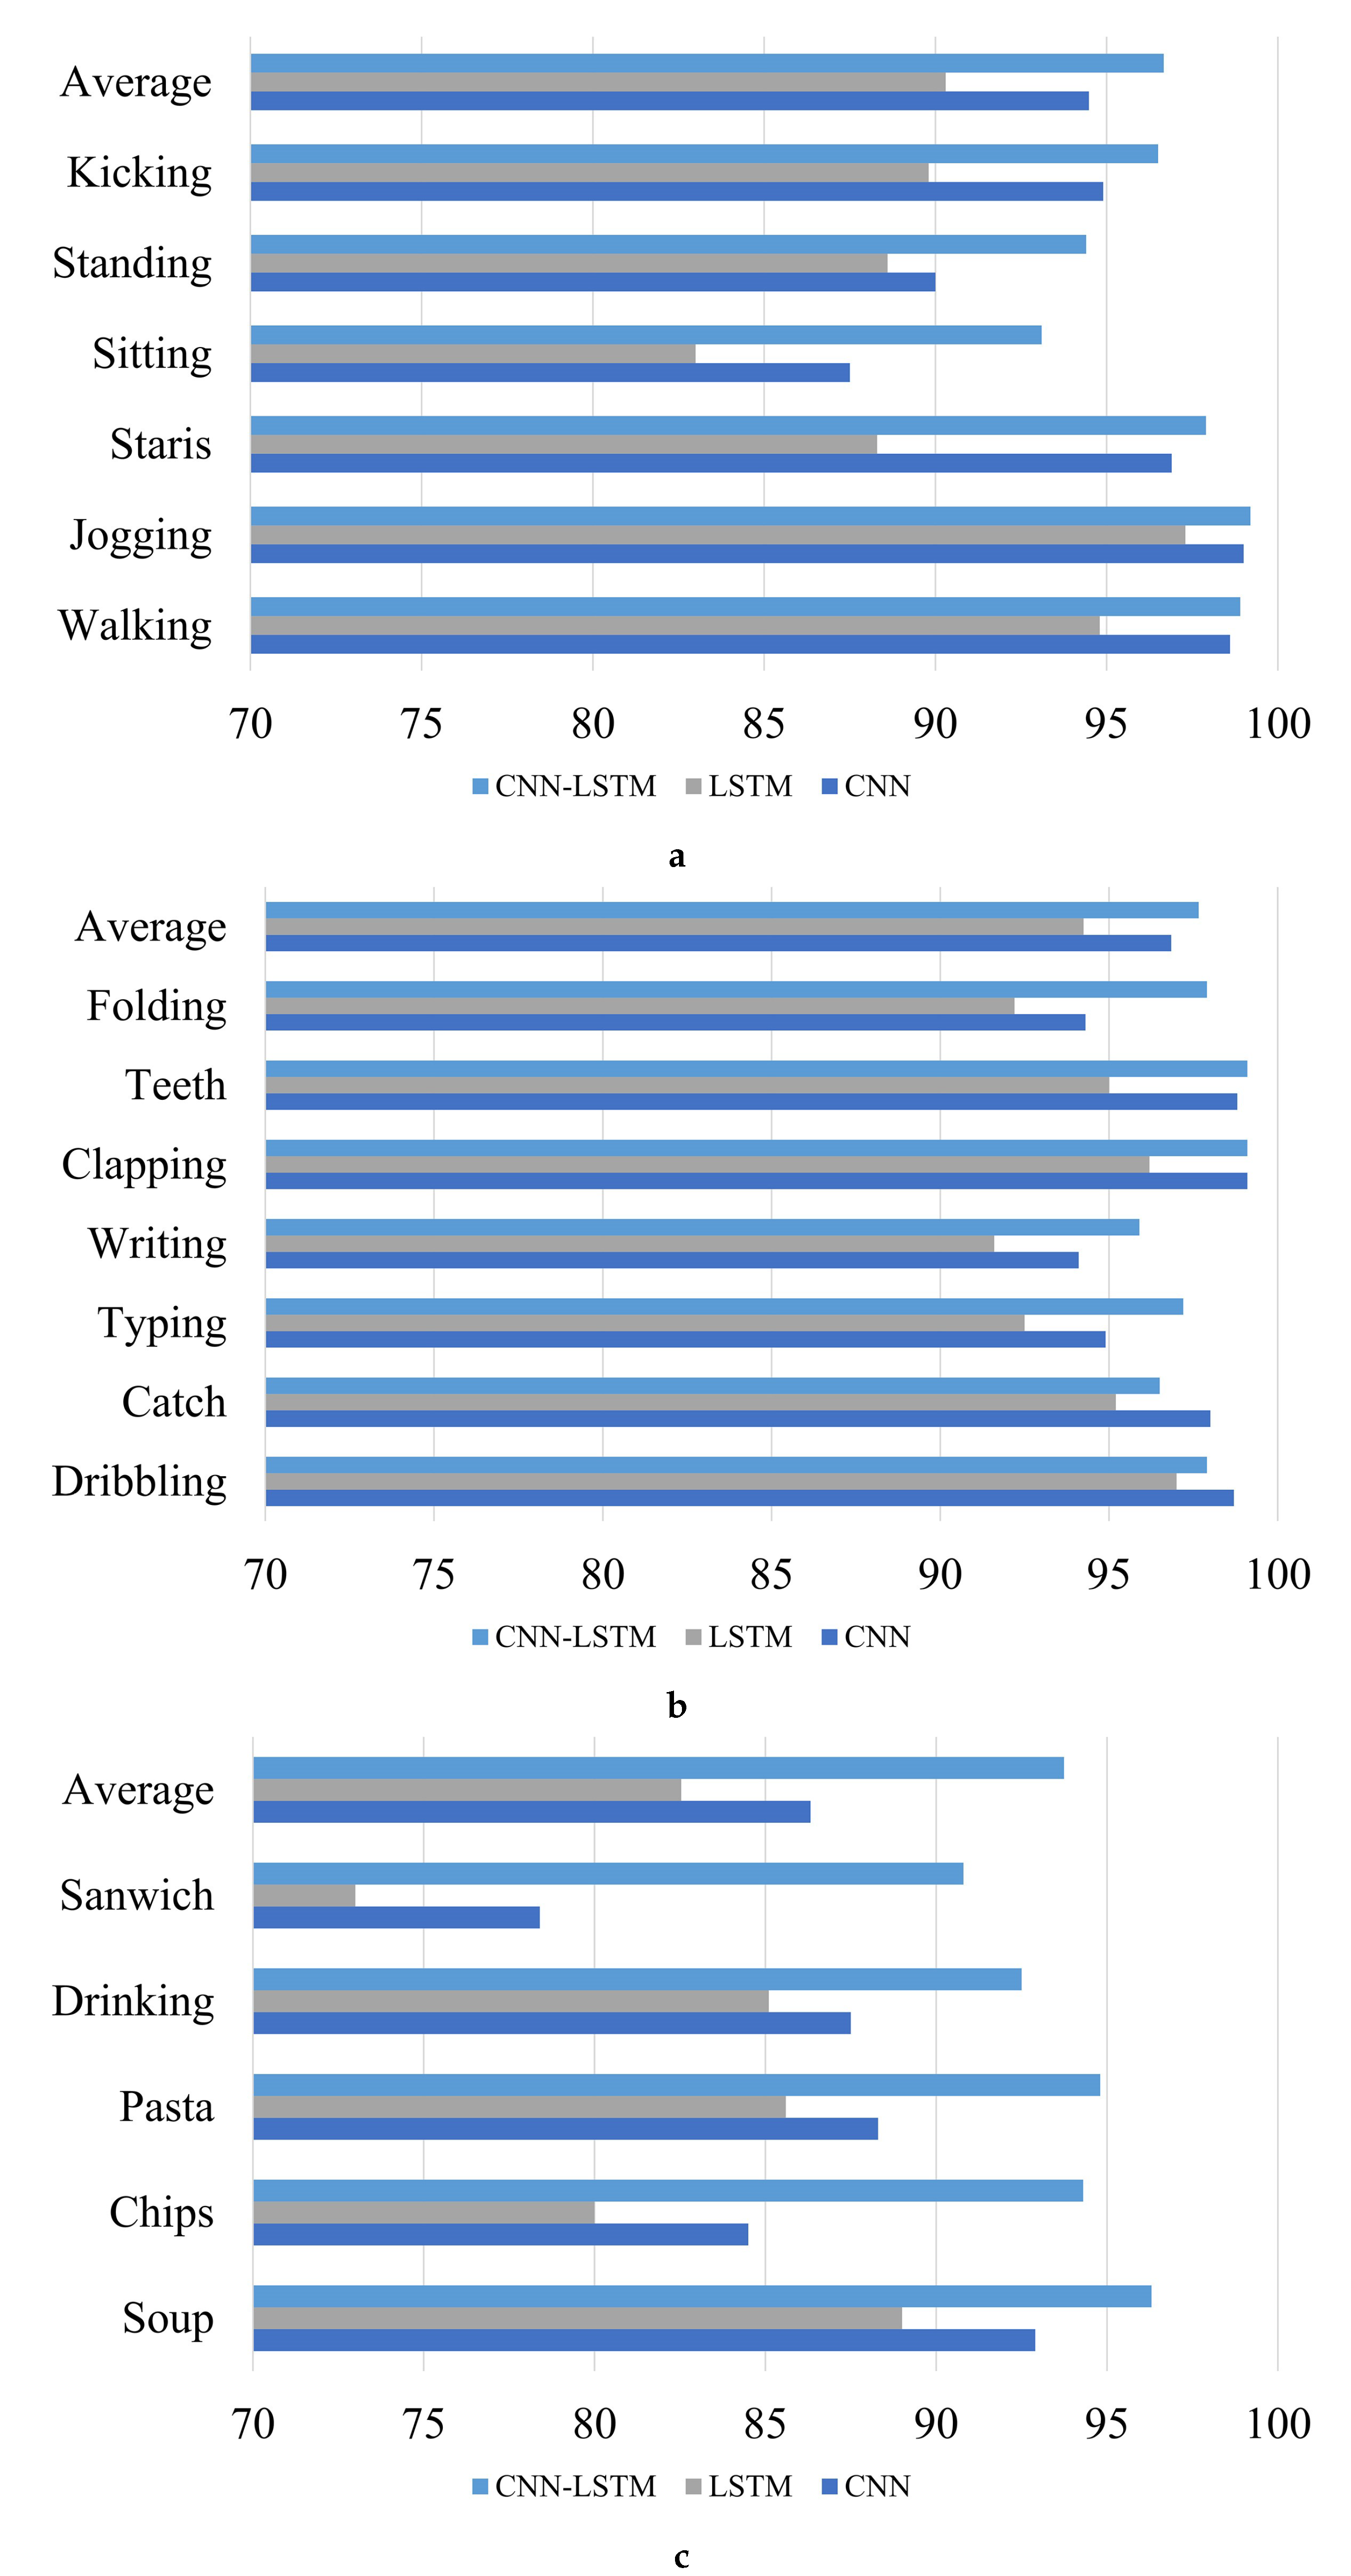
From the results in Table 4, the proposed CNN-LSTM model outperforms the other DL models in every activity. Though when analyzing the performance metrics recognition with accuracy, precision, recall, and F-measure, results of F-measure metric is only presented because they incorporate accuracy and precision. The confusion matrix for the proposed CNN-LSTM networks is shown in Table 5. Because of focusing on the comparison of different activities in this research, F-measure is chosen as the performance metric for this objective. Moreover, we can compare the effectiveness of the CNN-LSTM with the F-measure of each category of activities. The F-measure results of the different DL models trained from smartwatch sensor data are shown in Figure 11.
In order to avoid that results are biased by the particular choice of training and test dataset, the second experiment is conducted by utilizing different combination. The training, validation, and test sets are obtained using stratified ten-fold cross validation. As for the subsample, 80% of them, are used as training data. The remaining 20% are split for validation and test sets. In each fold, we ensure that the subsamples from each trial are not assigned to more than one set. The experimental results of stratified ten-fold cross validation with standard deviation value is shown in Table 6.
4.3. Comparison of Proposed CNN-LSTM Network and Other Conventional Deep Learning Networks
The significance of some deep learning network structures on model operation is explored in this section. As detailed shown in Table 4, three types of model compositions—CNN, LSTM, and the proposed CNN-LSTM—are implemented respectively for experimental results comparison. Activity recognition results are evaluated by the advanced metrics such as accuracy, precision, recall, and F-measure on the test collection. Moreover, the computation speed of training iteration is given. The research experiments are conducted by depended on the WISDM dataset.
The classical convolutional neural network (CNN) structure is commonly followed by a totally-connected layer to incorporate the features extracted from the previous layer. As can be seen that the F-measure of the CNN attends to 93.10% when the trained model is revealed to the test set composing with both accelerometer and gyroscope sensor data. In spite of classical CNN can enhance the recognition performance of the model, a massive number of parameters which more than 4 million model parameters have unavoidably to be carried. Moreover, the training stage time per epoch is still more than 9.21 s. The LSTM structure belongs to the vanilla long short-term memory neural network. This structure gains the capability to perceive temporal information from sequential data. The F-measure result of this model comes to 89.60% when both accelerometer and gyroscope sensor data used for training the model. Different from CNN structure, LSTM structure brings a smaller number of parameters—that are only 52 thousand parameters. The training stage time consumes more than 212.77 s per epoch.
In the proposed CNN-LSTM structure, the sensor data captured from smartwatch are firstly delivered into two layers of CNNs and then transferred to LSTM layers for performing the feature extraction process. Certainly, the proposed model surpasses in F-measure performance from the other deep learning networks with 96.30%. Moreover, the proposed CNN-LSTM brings a small number of parameter—that are 1.6 million model parameters. Furthermore, the model training time is spent only 20.46 s per epoch. So, the proposed model in this work is not only achieved high recognition rate of F-measure metric, but it also greatly simplifies the model structure with a smaller number of parameters.
Considering to model training speed, Figure 10 displays training speed comparison (in term of model loss and model accuracy). It becomes apparent that training loss from the proposed CNN-LSTM is decreasing faster than the baseline CNN and LSTM model. Moreover, the CNN-LSTM is more suitable than the other conventional deep learning models in term of training speed by time training per epoch.
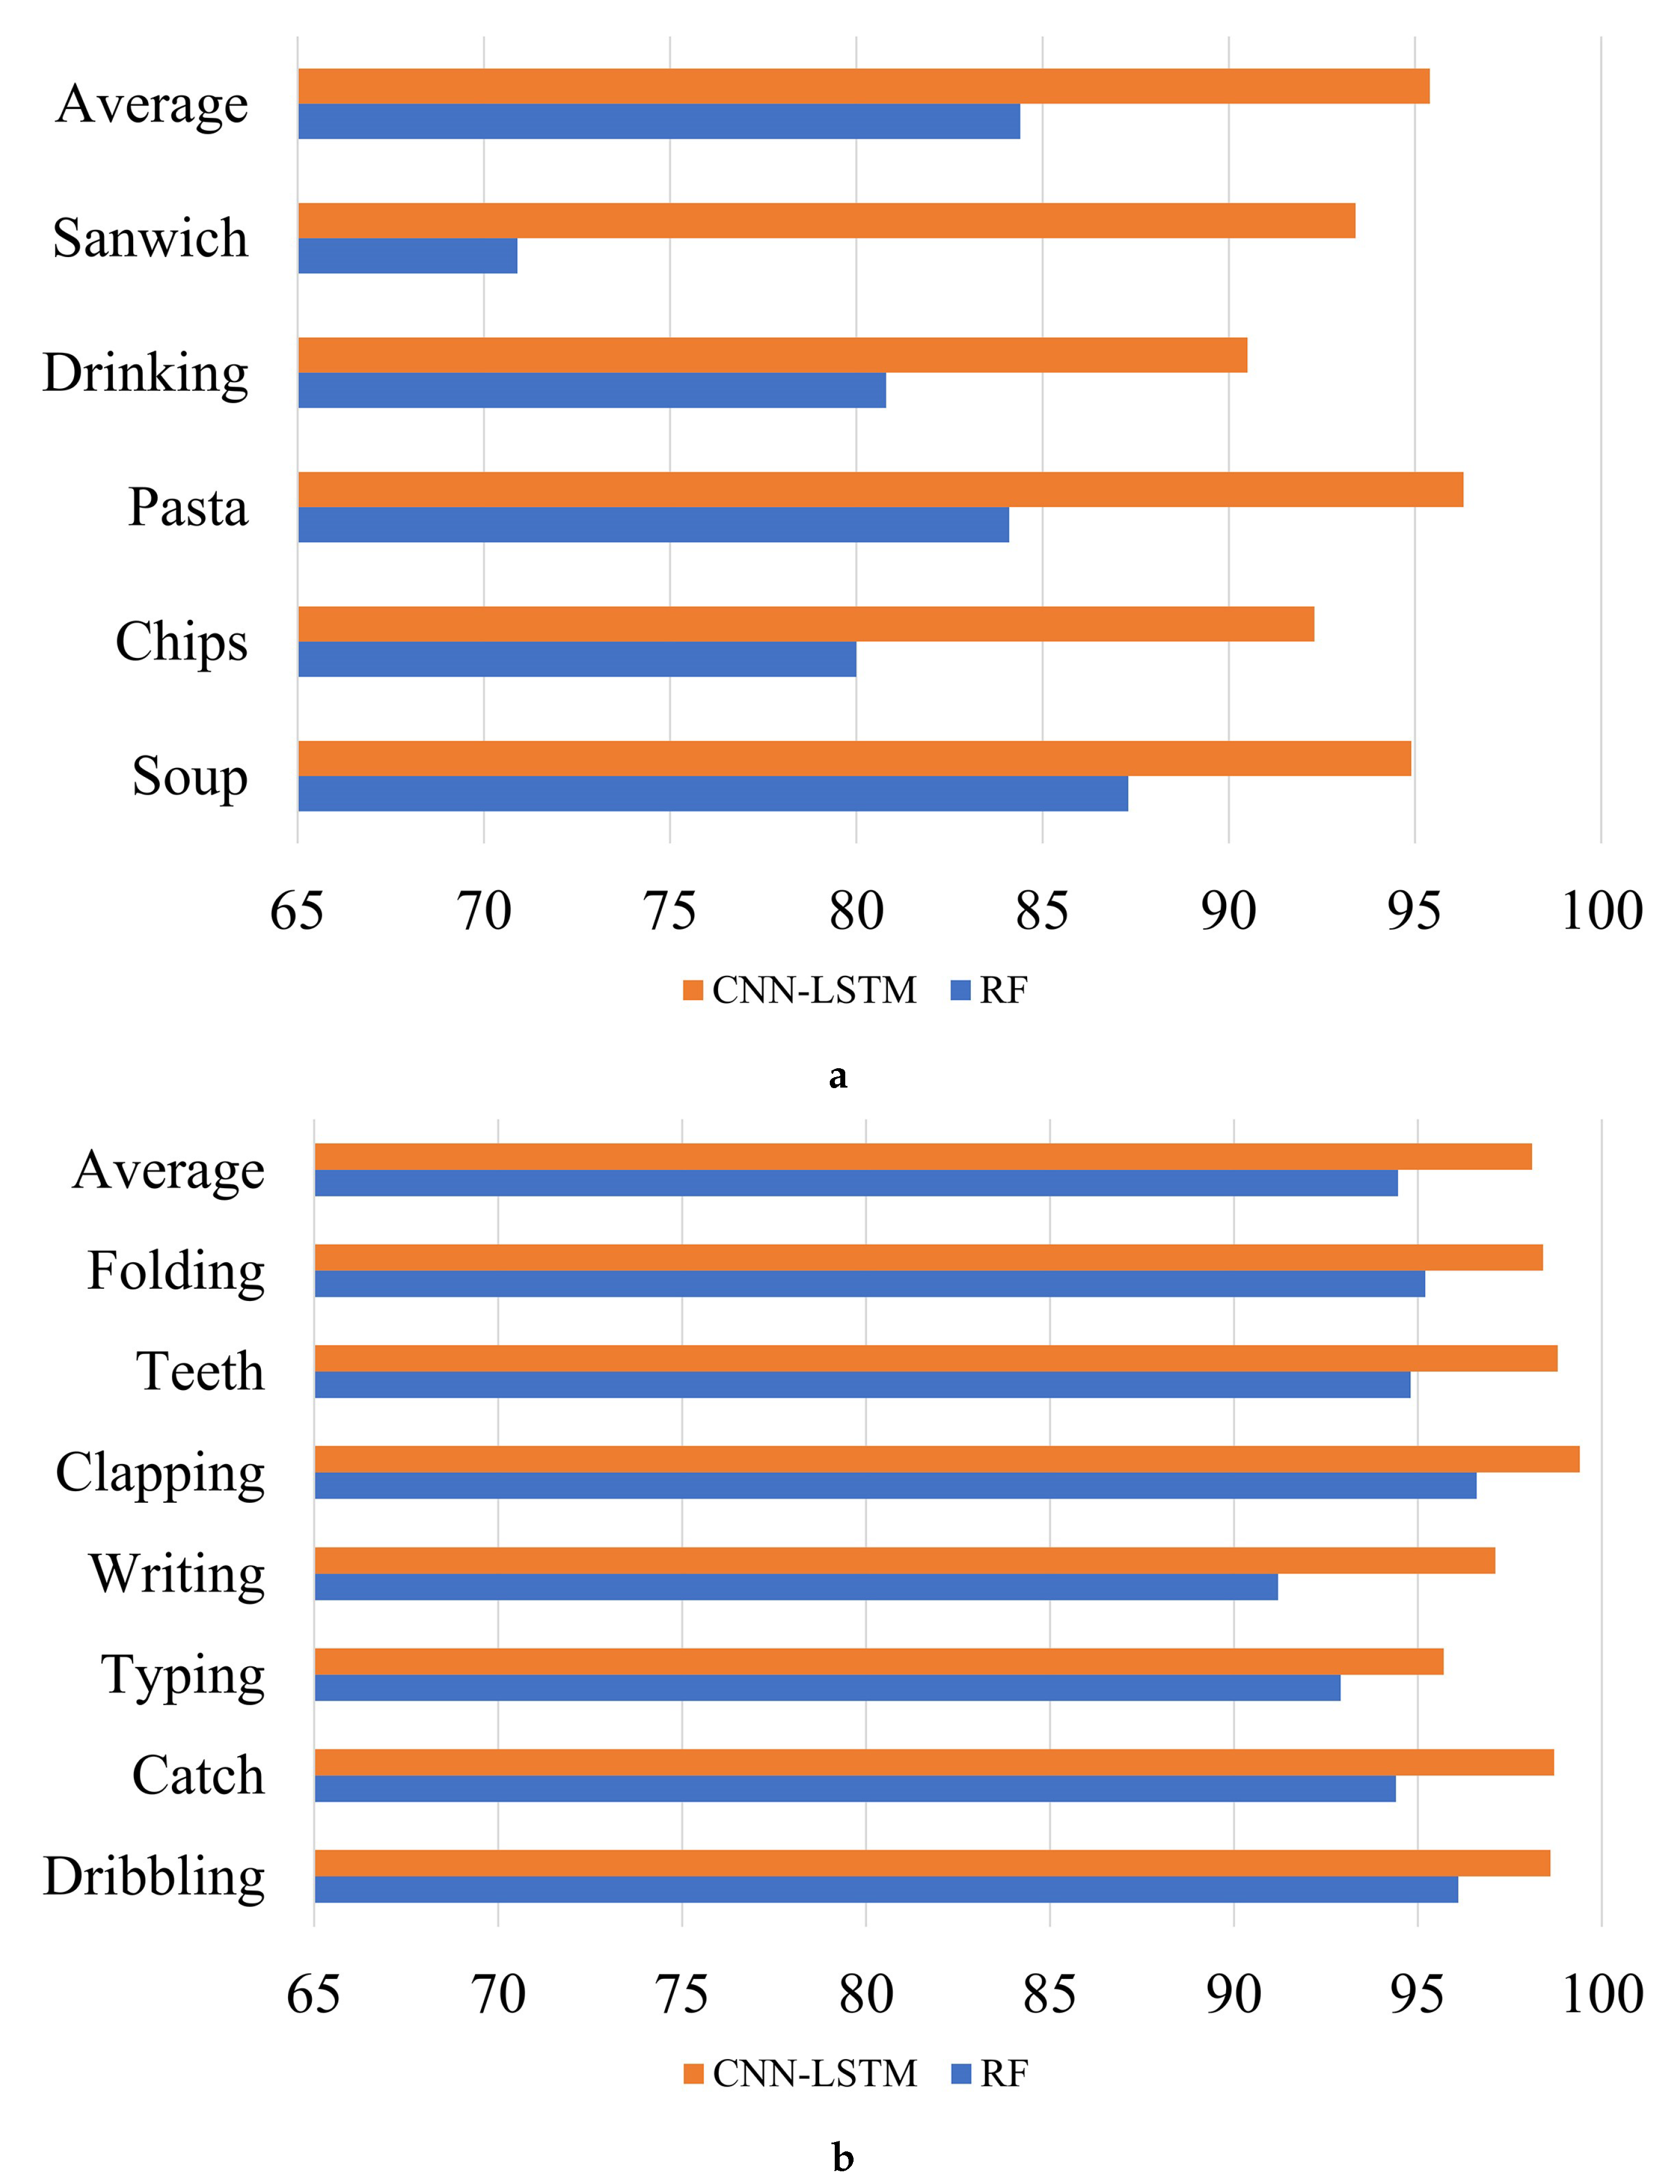
The previous work [27] uses hand-crafted features on conventional machine learning methods (decision tree and k-nearest neighbor) or an ensemble learning (random forest). The results of this work indicated that the random forest (RF) is more outperform than others. So, the proposed CNN-LSTM model is used to compared with existing trained models by the same smartwatch dataset. The comparative results is summarized in Table 7. The proposed CNN-LSTM can improve the accuracy in every scenario in the combination of sensor data. Generally, the proposed CNN-LSTM model outperform others in the conducted experiments. It is because CNN-LSTM has efficiency at dealing with complicated time series problems. Comparison performance results of the eating activity and general activity between the previous work and the proposed CNN-LSTM model can be shown in Figure 12.
5. Conclusions and Future Works
This work studied hand-oriented activity recognition using sensor data captured from a smartwatch that is collected in the WISDM dataset. The framework for smartwatch-based human activity recognition is proposed to enhance the recognition performance with a hybrid Long Short-Term Memory network. Three scenarios were employed for each deep learning model performance using the different smartwatch sensors. The evaluation metrics such as accuracy, precision, recall, and F-measure were applied. The experimental results show that the proposed CNN-LSTM model outperforms other baseline deep learning models with the highest performance metrics in every scenario. Moreover, the proposed model is compared to other previous works. The comparative results show that the recognition performance of every scenario can be enhanced by the proposed model, especially for hand-oriented activities.
The research of conventional deep learning techniques is generally depended on CNNs and LSTMs in HAR environment. With deep learning CNNs, there are two advantages over other models—-local dependency and scale invariance. The CNNs are nonetheless memory networks that be able to only extract spatially deep features from raw sensor data. Moreover, with another conventional deep learning model—LSTMs, these networks can employ the temporal dependencies in raw sensor data appear as the common alternative for human-based movement modelling with captured sensor data. So, with the proposed method CNN-LSTM in this research, an advantage is relied on to aid in extracting both the spatial features and temporal features of the signal data of human activities. For future work, developing other kinds of deep learning models and improving recognition performance through data augmentation techniques are considered for personalized smartwatch based HAR.
Author Contributions
Conceptualization and model analysis, S.M.; resource and data curation, A.J.; methodology and validation, S.M.; data visualization and graphic improvement, P.Y. (Phichai Youplao); discussion and final editing, P.Y. (Preecha Yupapin); writing-review and editing, S.M.; funding acquisition, A.J. and S.M. All authors have read and agreed to the published version of the manuscript.
Funding
This research was funded by King Mongkut’s University of Technology North Bangkok, grant number KMUTNB-62-KNOW-25 and was partially funded by School of Information and Communication Technology, University of Phayao.
Acknowledgments
The authors thank the SigOpt team for the provided optimization services.
Conflicts of Interest
The authors declare no conflict of interest.
References
- Jobanputra, C.; Bavishi, J.; Doshi, N. Human Activity Recognition: A Survey. Procedia Comput. Sci. 2019, 155, 698–703. [Google Scholar] [CrossRef]
- Vashist, S.K.; Luong, J.H. Chapter 12—Wearable Technologies for Personalized Mobile Healthcare Monitoring and Management. In Wearable Technology in Medicine and Health Care; Tong, R.K.Y., Ed.; Academic Press: Cambridge, MA, USA, 2018; pp. 235–259. [Google Scholar] [CrossRef]
- Hnoohom, N.; Jitpattanakul, A.; Inluergsri, P.; Wongbudsri, P.; Ployput, W. Multi-sensor-based fall detection and activity daily living classification by using ensemble learning. In Proceedings of the 2018 International ECTI Northern Section Conference on Electrical, Electronics, Computer and Telecommunications Engineering (ECTI-NCON), Chiang Rai, Thailand, 25–28 February 2018; pp. 111–115. [Google Scholar]
- Mekruksavanich, S.; Jitpattanakul, A. Exercise Activity Recognition with Surface Electromyography Sensor using Machine Learning Approach. In Proceedings of the 2020 Joint International Conference on Digital Arts, Media and Technology with ECTI Northern Section Conference on Electrical, Electronics, Computer and Telecommunications Engineering (ECTI DAMT NCON), Pattaya, Thailand, 11–14 March 2020; pp. 75–78. [Google Scholar]
- Mekruksavanich, S.; Hnoohom, N.; Jitpattanakul, A. Smartwatch-based sitting detection with human activity recognition for office workers syndrome. In Proceedings of the 2018 International ECTI Northern Section Conference on Electrical, Electronics, Computer and Telecommunications Engineering (ECTI-NCON), Chiang Rai, Thailand, 25–28 February 2018; pp. 160–164. [Google Scholar]
- Fu, B.; Damer, N.; Kirchbuchner, F.; Kuijper, A. Sensing Technology for Human Activity Recognition: A Comprehensive Survey. IEEE Access 2020, 8, 83791–83820. [Google Scholar] [CrossRef]
- Ferrari, A.; Micucci, D.; Mobilio, M.; Napoletano, P. On the Personalization of Classification Models for Human Activity Recognition. IEEE Access 2020, 8, 32066–32079. [Google Scholar] [CrossRef]
- Rahim, K.; Elamvazuthi, I.; Izhar, L.; Capi, G. Classification of Human Daily Activities Using Ensemble Methods Based on Smartphone Inertial Sensors. Sensors 2018, 18, 4132. [Google Scholar] [CrossRef] [PubMed] [Green Version]
- Ahmed, N.; Rafiq, J.I.; Islam, M.R. Enhanced Human Activity Recognition Based on Smartphone Sensor Data Using Hybrid Feature Selection Model. Sensors 2020, 20, 317. [Google Scholar] [CrossRef] [PubMed] [Green Version]
- Lu, W.; Fan, F.; Chu, J.; Jing, P.; Yuting, S. Wearable Computing for Internet of Things: A Discriminant Approach for Human Activity Recognition. IEEE Internet Things J. 2019, 6, 2749–2759. [Google Scholar] [CrossRef]
- Zhang, Y.; Zhang, Z.; Zhang, Y.; Bao, J.; Zhang, Y.; Deng, H. Human Activity Recognition Based on Motion Sensor Using U-Net. IEEE Access 2019, 7, 75213–75226. [Google Scholar] [CrossRef]
- Weiss, G.M.; Timko, J.L.; Gallagher, C.M.; Yoneda, K.; Schreiber, A.J. Smartwatch-based activity recognition: A machine learning approach. In Proceedings of the 2016 IEEE-EMBS International Conference on Biomedical and Health Informatics (BHI), Las Vegas, NV, USA, 24–27 February 2016; pp. 426–429. [Google Scholar]
- Porzi, L.; Messelodi, S.; Modena, C.M.; Ricci, E. A Smart Watch-Based Gesture Recognition System for Assisting People with Visual Impairments. In IMMPD ’13: Proceedings of the 3rd ACM International Workshop on Interactive Multimedia on Mobile and Portable Devices, Barcelona Spain, 22 October 2013; Association for Computing Machinery: New York, NY, USA, 2013; pp. 19–24. [Google Scholar] [CrossRef]
- Casilari, E.; Álvarez Marco, M.; García-Lagos, F. A Study of the Use of Gyroscope Measurements in Wearable Fall Detection Systems. Symmetry 2020, 12, 649. [Google Scholar] [CrossRef] [Green Version]
- Liu, Y.; Ouyang, D.; Liu, Y.; Chen, R. A Novel Approach Based on Time Cluster for Activity Recognition of Daily Living in Smart Homes. Symmetry 2017, 9, 212. [Google Scholar] [CrossRef]
- Burmaoglu, S.; Trajkovik, V.; Tutukalo, T.L.; Yalcin, H.; Caulfield, B. Chapter 14—Evolution Map of Wearable Technology Patents for Healthcare Field. In Wearable Technology in Medicine and Health Care; Tong, R.K.Y., Ed.; Academic Press: Cambridge, MA, USA, 2018; pp. 275–290. [Google Scholar] [CrossRef]
- Tüfek, N.; Özkaya, O. A Comparative Research on Human Activity Recognition Using Deep Learning. In Proceedings of the 2019 27th Signal Processing and Communications Applications Conference (SIU), Sivas, Turkey, 24–26 April 2019; pp. 1–4. [Google Scholar]
- Baldominos, A.; Cervantes, A.; Sáez, Y.; Isasi, P. A Comparison of Machine Learning and Deep Learning Techniques for Activity Recognition using Mobile Devices. Sensors 2019, 19, 521. [Google Scholar] [CrossRef] [Green Version]
- Murad, A.; Pyun, J.Y. Deep Recurrent Neural Networks for Human Activity Recognition. Sensors 2017, 17, 2556. [Google Scholar] [CrossRef] [PubMed] [Green Version]
- Lv, T.; Wang, X.; Jin, L.; Xiao, Y.; Song, M. Margin-Based Deep Learning Networks for Human Activity Recognition. Sensors 2020, 20, 1871. [Google Scholar] [CrossRef] [PubMed] [Green Version]
- Kim, H.; Kim, I. Human Activity Recognition as Time-Series Analysis. Math. Probl. Eng. 2015, 2015, 1–9. [Google Scholar] [CrossRef] [Green Version]
- Li, F.; Shirahama, K.; Nisar, M.A.; Huang, X.; Grzegorzek, M. Deep Transfer Learning for Time Series Data Based on Sensor Modality Classification. Sensors 2020, 20, 4271. [Google Scholar] [CrossRef] [PubMed]
- Kim, E.; Helal, S.; Cook, D. Human Activity Recognition and Pattern Discovery. IEEE Pervasive Comput. 2010, 9, 48–53. [Google Scholar] [CrossRef] [Green Version]
- Bulling, A.; Blanke, U.; Schiele, B. A Tutorial on Human Activity Recognition Using Body-Worn Inertial Sensors. ACM Comput. Surv. 2014, 46. [Google Scholar] [CrossRef]
- Barth, J.; Oberndorfer, C.; Pasluosta, C.; Schülein, S.; Gaßner, H.; Reinfelder, S.; Kugler, P.; Schuldhaus, D.; Winkler, J.; Klucken, J.; et al. Stride Segmentation during Free Walk Movements Using Multi-Dimensional Subsequence Dynamic Time Warping on Inertial Sensor Data. Sensors 2015, 15, 6419–6440. [Google Scholar] [CrossRef]
- Wang, J.; Chen, Y.; Hao, S.; Peng, X.; Hu, L. Deep learning for sensor-based activity recognition: A survey. Pattern Recognit. Lett. 2019, 119, 3–11. [Google Scholar] [CrossRef] [Green Version]
- Weiss, G.M.; Yoneda, K.; Hayajneh, T. Smartphone and Smartwatch-Based Biometrics Using Activities of Daily Living. IEEE Access 2019, 7, 133190–133202. [Google Scholar] [CrossRef]
- Mahloko, L.; Adebesin, F. A Systematic Literature Review of the Factors that Influence the Accuracy of Consumer Wearable Health Device Data. In Responsible Design, Implementation and Use of Information and Communication Technology; Hattingh, M., Matthee, M., Smuts, H., Pappas, I., Dwivedi, Y.K., Mäntymäki, M., Eds.; Springer International Publishing: Cham, Switzerland, 2020; pp. 96–107. [Google Scholar]
- Cosoli, G.; Spinsante, S.; Scalise, L. Wrist-worn and chest-strap wearable devices: Systematic review on accuracy and metrological characteristics. Measurement 2020, 159, 107789. [Google Scholar] [CrossRef]
- Ordóñez, F.J.; Roggen, D. Deep Convolutional and LSTM Recurrent Neural Networks for Multimodal Wearable Activity Recognition. Sensors 2016, 16, 115. [Google Scholar] [CrossRef] [PubMed] [Green Version]
- Devanne, M.; Papadakis, P.; Nguyen, S.M. Recognition of Activities of Daily Living via Hierarchical Long-Short Term Memory Networks. In Proceedings of the 2019 IEEE International Conference on Systems, Man and Cybernetics (SMC), Bari, Italy, 6–9 October 2019; pp. 3318–3324. [Google Scholar]
- DiPietro, R.; Hager, G.D. Chapter 21—Deep learning: RNNs and LSTM. In Handbook of Medical Image Computing and Computer Assisted Intervention; Zhou, S.K., Rueckert, D., Fichtinger, G., Eds.; Academic Press: Cambridge, MA, USA, 2020; pp. 503–519. [Google Scholar] [CrossRef]
- Asif, A.R.; Waris, M.; Gilani, S.; Jamil, M.; Ashraf, H.; Shafique, M.; Niazi, I. Performance Evaluation of Convolutional Neural Network for Hand Gesture Recognition Using EMG. Sensors 2020, 20, 1642. [Google Scholar] [CrossRef] [PubMed] [Green Version]
Figure 1.
The general framework of human activity recognition (HAR) using machine learning approaches.
Figure 1.
The general framework of human activity recognition (HAR) using machine learning approaches.

Figure 2.
The general framework of HAR using deep learning approaches.

Figure 3.
The proposed smartwatch-based HAR framework.

Figure 4.
Activity accelerometer data for 10 s of (a) kicking, (b) stairs, (c) standing, (d) jogging, (e) sitting, (f) walking, (g) sandwich, (h) chips, (i) drinking, (j) soup, (k) pasta, (l) folding, (m) typing, (n) teeth, (o) catch, (p) clapping, (q) dribbling, and (r) writing.
Figure 4.
Activity accelerometer data for 10 s of (a) kicking, (b) stairs, (c) standing, (d) jogging, (e) sitting, (f) walking, (g) sandwich, (h) chips, (i) drinking, (j) soup, (k) pasta, (l) folding, (m) typing, (n) teeth, (o) catch, (p) clapping, (q) dribbling, and (r) writing.

Figure 5.
Activity gyroscope data for 10 s of (a) kicking, (b) stairs, (c) standing, (d) jogging, (e) sitting, (f) walking, (g) sandwich, (h) chips, (i) drinking, (j) soup, (k) pasta, (l) folding, (m) typing, (n) teeth, (o) catch, (p) clapping, (q) dribbling, and (r) writing.
Figure 5.
Activity gyroscope data for 10 s of (a) kicking, (b) stairs, (c) standing, (d) jogging, (e) sitting, (f) walking, (g) sandwich, (h) chips, (i) drinking, (j) soup, (k) pasta, (l) folding, (m) typing, (n) teeth, (o) catch, (p) clapping, (q) dribbling, and (r) writing.

Figure 6.
Data segmentation process by a sliding window of 10 s to handle time-series data on the HAR problem.
Figure 6.
Data segmentation process by a sliding window of 10 s to handle time-series data on the HAR problem.

Figure 7.
The unfold structure of one-layer baseline Long Short-Term Memory (LSTM).

Figure 8.
The structure of an LSTM node.

Figure 9.
The proposed Convolution Neural Network (CNN)-LSTM network structure in this research.

Figure 10.
Accuracy and loss examples of the training process of (a) CNN, (b) LSTM, and (c) proposed CNN-LSTM.
Figure 10.
Accuracy and loss examples of the training process of (a) CNN, (b) LSTM, and (c) proposed CNN-LSTM.

Figure 11.
F-measure of the different deep learning (DL) models (trained from smartwatch sensor data on the WIDSM dataset) of (a) Non-Hand-Oriented Activities, (b) Hand-Oriented Activities (General), and (c) Hand-Oriented Activities (Eating).
Figure 11.
F-measure of the different deep learning (DL) models (trained from smartwatch sensor data on the WIDSM dataset) of (a) Non-Hand-Oriented Activities, (b) Hand-Oriented Activities (General), and (c) Hand-Oriented Activities (Eating).

Figure 12.
Performance (accuracy %) of comparison results: (a) Comparison results of the eating activity, and (b) Comparison results of the general activity
Figure 12.
Performance (accuracy %) of comparison results: (a) Comparison results of the eating activity, and (b) Comparison results of the general activity


Table 1.
Numbers of raw sensor data.
| 51 Subjects | Selected 44 Subjects | |
|---|---|---|
| raw accelerometer data | 3,777,046 | 2,969,030 |
| raw gyroscope data | 3,440,342 | 2,960,050 |
Table 2.
Numbers of sensor samples
| 51 Subjects | Training Set (70%) | Test Set (30%) | |
|---|---|---|---|
| raw accelerometer data | 59,380 | 41,566 | 17,814 |
| raw gyroscope data | 59,201 | 41,441 | 17,760 |
Table 3.
Layer types of baseline deep learning models and the proposed CNN-LSTM mode.
| DL Models | Layer Types |
|---|---|
| CNN | Conv1D–Dropoput–Maxpooling–Dense–Softmax |
| LSTM | Lstm–Dropout–Dense–Softmax |
| CNN-LSTM | Conv1D–Conv1d–Dropout–Maxpooling–Lstm–Dropout–Dense–Softmax |
Table 4.
Experimental results of all three scenarios with two baseline deep learning models and the proposed CNN-LSTM model.
Table 4.
Experimental results of all three scenarios with two baseline deep learning models and the proposed CNN-LSTM model.
| Scenario | Model | Evaluation Metrics | |||
|---|---|---|---|---|---|
| Accuracy | Precision | Recall | F-measure | ||
| CNN | 89.60 | 89.60 | 89.60 | 89.60 | |
| Acc. | LSTM | 87.80 | 88.00 | 87.80 | 87.90 |
| CNN-LSTM | 95.20 | 95.20 | 95.20 | 95.20 | |
| CNN | 86.40 | 86.90 | 86.40 | 86.50 | |
| Gyro. | LSTM | 84.10 | 84.30 | 84.10 | 84.00 |
| CNN-LSTM | 95.40 | 95.40 | 95.40 | 95.40 | |
| CNN | 93.10 | 93.10 | 93.10 | 93.10 | |
| Acc. + Gyro. | LSTM | 89.60 | 89.70 | 89.60 | 89.60 |
| CNN-LSTM | 96.20 | 96.30 | 96.20 | 96.30 | |
Table 5.
Confusion Matrix for the proposed CNN-LSTM.
| Walking | Jogging | Stairs | Sitting | Standing | Typing | Teeth | Soup | Chips | Pasta | Drinking | Sandwich | Kicking | Catch | Dribbling | Writing | Clapping | Folding | Recall | |
|---|---|---|---|---|---|---|---|---|---|---|---|---|---|---|---|---|---|---|---|
| walking | 952 | 1 | 4 | 1 | 0 | 0 | 0 | 0 | 0 | 0 | 0 | 0 | 6 | 3 | 0 | 0 | 0 | 1 | 98.35% |
| jogging | 2 | 933 | 5 | 0 | 0 | 0 | 0 | 0 | 0 | 0 | 0 | 0 | 0 | 2 | 2 | 1 | 0 | 0 | 98.73% |
| stairs | 1 | 1 | 977 | 3 | 0 | 0 | 0 | 0 | 0 | 1 | 0 | 0 | 6 | 2 | 0 | 0 | 0 | 7 | 97.89% |
| sitting | 0 | 0 | 4 | 956 | 16 | 1 | 0 | 1 | 3 | 2 | 5 | 14 | 0 | 0 | 0 | 7 | 0 | 2 | 94.56% |
| standing | 2 | 0 | 0 | 26 | 953 | 4 | 0 | 0 | 4 | 4 | 0 | 13 | 3 | 2 | 5 | 1 | 0 | 0 | 93.71% |
| typing | 0 | 0 | 0 | 7 | 1 | 891 | 3 | 0 | 3 | 2 | 0 | 0 | 0 | 0 | 0 | 24 | 0 | 0 | 95.70% |
| teeth | 0 | 0 | 0 | 5 | 1 | 2 | 1017 | 1 | 0 | 0 | 0 | 0 | 1 | 0 | 0 | 0 | 1 | 1 | 98.83% |
| soup | 0 | 0 | 0 | 3 | 3 | 1 | 3 | 920 | 7 | 19 | 3 | 4 | 0 | 0 | 0 | 4 | 0 | 2 | 94.94% |
| chips | 0 | 0 | 0 | 8 | 3 | 2 | 0 | 10 | 918 | 16 | 8 | 28 | 0 | 0 | 0 | 0 | 0 | 2 | 92.26% |
| pasta | 0 | 0 | 0 | 5 | 0 | 0 | 0 | 6 | 6 | 977 | 3 | 13 | 0 | 0 | 0 | 0 | 4 | 1 | 96.26% |
| drinking | 0 | 0 | 0 | 11 | 15 | 1 | 0 | 1 | 4 | 15 | 898 | 40 | 0 | 0 | 0 | 7 | 0 | 0 | 90.52% |
| sandwich | 0 | 0 | 1 | 9 | 5 | 0 | 0 | 2 | 5 | 9 | 27 | 921 | 6 | 0 | 0 | 0 | 0 | 1 | 93.41% |
| kicking | 0 | 1 | 5 | 0 | 2 | 0 | 0 | 0 | 0 | 1 | 4 | 6 | 960 | 24 | 0 | 0 | 0 | 3 | 95.43% |
| catch | 0 | 0 | 0 | 1 | 1 | 0 | 0 | 0 | 0 | 1 | 1 | 0 | 2 | 986 | 5 | 1 | 0 | 1 | 98.70% |
| dribbling | 0 | 0 | 0 | 0 | 0 | 0 | 0 | 0 | 0 | 0 | 0 | 0 | 0 | 8 | 963 | 6 | 0 | 0 | 98.57% |
| writing | 0 | 0 | 0 | 7 | 1 | 0 | 0 | 0 | 2 | 0 | 0 | 2 | 0 | 2 | 13 | 1016 | 3 | 0 | 97.13% |
| clapping | 0 | 0 | 0 | 0 | 0 | 0 | 0 | 0 | 0 | 0 | 0 | 0 | 0 | 0 | 0 | 3 | 928 | 3 | 99.36% |
| folding | 0 | 0 | 1 | 1 | 0 | 0 | 0 | 0 | 0 | 0 | 0 | 1 | 0 | 4 | 2 | 3 | 3 | 928 | 98.41% |
| Precision | 99.50% | 99.68% | 97.99% | 91.66% | 95.20% | 98.78% | 99.41% | 97.77% | 96.43% | 93.31% | 94.63% | 88.39% | 97.56% | 95.45% | 97.27% | 94.69% | 98.83% | 97.48% | 96.20% |
Table 6.
Experimental results of stratified ten-fold cross validation.
| Model | Evaluation Metrics | |||
|---|---|---|---|---|
| Accuracy (SD) | Precision (SD) | Recall (SD) | F-Measure (SD) | |
| CNN | 90.92% (+/−0.53%) | 97.12% (+/−0.73%) | 97.17% (+/−1.41%) | 97.14% (+/−0.72%) |
| LSTM | 93.96% (+/−0.46%) | 99.48% (+/−0.51%) | 98.95% (+/−0.88%) | 99.21% (+/− 0.41%) |
| CNN-LSTM | 97.40% (+/−0.38%) | 98.60% (+/−2.59%) | 99.48% (+/−0.51%) | 99.02% (+/−1.30%) |
Table 7.
Performance (% accuracy) of comparison results.
| Activity | Previous Work | Proposed CNN-LTSM | |||||
|---|---|---|---|---|---|---|---|
| Acc. | Gyro. | Acc. + Gyro. | Acc. | Gyro. | Acc. + Gyro. | ||
| Non-hand-oriented | Walking | 87.70 | 85.60 | 89.10 | 97.70 | 96.60 | 98.30 |
| Jogging | 96.90 | 93.60 | 97.30 | 99.40 | 98.70 | 98.70 | |
| Stairs | 85.50 | 70.40 | 84.00 | 96.20 | 96.50 | 97.90 | |
| Sitting | 87.30 | 62.80 | 84.00 | 92.20 | 91.80 | 94.60 | |
| Standing | 90.70 | 59.00 | 89.70 | 95.30 | 92.70 | 93.70 | |
| Kicking | 82.90 | 72.70 | 84.40 | 96.80 | 96.90 | 95.40 | |
| Average | 88.50 | 74.02 | 88.08 | 95.27 | 95.53 | 96.43 | |
| Hand-oriented general | Dribbling | 91.20 | 90.60 | 96.10 | 95.80 | 97.90 | 98.60 |
| Catch | 90.50 | 88.70 | 94.40 | 98.20 | 98.10 | 98.70 | |
| Typing | 94.10 | 83.30 | 92.90 | 95.70 | 98.60 | 95.70 | |
| Writing | 89.90 | 77.60 | 91.20 | 97.50 | 95.40 | 97.10 | |
| Clapping | 95.00 | 92.70 | 96.60 | 99.70 | 99.30 | 99.40 | |
| Teeth | 91.90 | 81.60 | 94.80 | 98.60 | 98.90 | 98.80 | |
| Folding | 89.80 | 85.30 | 95.20 | 94.60 | 97.90 | 98.40 | |
| Average | 91.77 | 85.69 | 94.46 | 97.16 | 98.01 | 98.10 | |
| Hand-oriented eating | Soup | 86.60 | 69.10 | 87.30 | 97.30 | 91.00 | 94.90 |
| Chips | 78.80 | 60.60 | 80.00 | 88.90 | 94.30 | 92.30 | |
| Pasta | 83.30 | 68.30 | 84.10 | 93.70 | 94.80 | 96.30 | |
| Drinking | 80.90 | 65.20 | 80.80 | 87.30 | 89.30 | 90.50 | |
| Sandwich | 72.70 | 50.50 | 70.90 | 89.20 | 88.60 | 93.40 | |
| Average | 80.46 | 62.74 | 80.62 | 91.28 | 91.60 | 93.48 | |
© 2020 by the authors. Licensee MDPI, Basel, Switzerland. This article is an open access article distributed under the terms and conditions of the Creative Commons Attribution (CC BY) license (http://creativecommons.org/licenses/by/4.0/).
Share and Cite
MDPI and ACS Style
Mekruksavanich, S.; Jitpattanakul, A.; Youplao, P.; Yupapin, P. Enhanced Hand-Oriented Activity Recognition Based on Smartwatch Sensor Data Using LSTMs. Symmetry 2020, 12, 1570. https://0-doi-org.brum.beds.ac.uk/10.3390/sym12091570
AMA Style
Mekruksavanich S, Jitpattanakul A, Youplao P, Yupapin P. Enhanced Hand-Oriented Activity Recognition Based on Smartwatch Sensor Data Using LSTMs. Symmetry. 2020; 12(9):1570. https://0-doi-org.brum.beds.ac.uk/10.3390/sym12091570
Chicago/Turabian StyleMekruksavanich, Sakorn, Anuchit Jitpattanakul, Phichai Youplao, and Preecha Yupapin. 2020. "Enhanced Hand-Oriented Activity Recognition Based on Smartwatch Sensor Data Using LSTMs" Symmetry 12, no. 9: 1570. https://0-doi-org.brum.beds.ac.uk/10.3390/sym12091570
Note that from the first issue of 2016, this journal uses article numbers instead of page numbers. See further details here.