1. Introduction
According to the 2019 Edelman Trust Barometer survey conducted in 27 countries, trust in government information and media channels remains low. The gap between the informed public and the majority of the population is growing (13 points in 2018, 16 points in 2019) [
1].
In cases in which the audience does not have substantial knowledge or experience regarding the events and environments, it is mainly dependent on information provided by the media [
2]. According to previous studies [
3,
4], the media use various manipulation techniques and mechanisms, such as opinion shaping or focusing the attention of the audience on specific topics. The availability of various news sources on the Internet is an additional factor affecting our perception, which can create confusion caused by personal subjective thoughts, such as personal TV, blogs, and unproven news [
5].
In this regard, it is important to understand how the media use their influence to mitigate the negative impacts of the media and encourage positive effects [
6].
Researchers focus their efforts on media content evaluation due to its practical relevance for news agencies, advertising companies, and the public sector. Media content analysis allows us to predict the probable popularity of news articles [
7], provide targeted and high-quality articles for users, and devise PR strategies for the promotion of goods or services [
8,
9]. For the public sector, this provides a tool for promotion and outreach of innovations, PR planning, and identifying negative content prohibited by law. Individual users can quickly and efficiently filter large amounts of information.
Each media article can be described by a set of properties that are often heterogeneous. For instance, these properties can include both objective indicators (the number of shares and comments) and subjective indicators (emotional tone or sentiment). In essence, we need to attribute the published text to a specific class that allows us to evaluate, for example, the degree of its impact on the audience or the need for a more detailed analysis. For this, we need to identify the specified properties (evaluation criteria), and assess their relative importance and the magnitude of the presence of this property in the analyzed text. Then the values of the properties are aggregated to obtain an estimate based on which we attribute the text to a particular class. Having obtained these estimates for the article’s assembly of one medium, and by variously combining these estimates, we can classify the media.
These estimates for one article and one medium may not be equal to zero for several properties and classes at a time. In addition, it is preferable to obtain estimates for a medium having at least part of the corpora because obtaining all published articles can be difficult.
One more limitation may be associated with the absence of a marked-up corpus of texts for solving semantically complex problems of media classification.
In this work, we consider the problem of classifying news texts devoted to socially significant events published in the media. The task is addresses in the process of media monitoring in Kazakhstan. We identify negative news messages then classify the media.
The method we propose is based on a topic modeling and multiple-criteria decision making (MCDM) approach, which reduces the cost of labeling the corpus of documents. The method also shows results comparable to more labor-intensive approaches based on supervised learning.
In addition to the introduction, the paper consists of the following sections:
The
Section 2 describes current problems, mass media monitoring services, and their features and limitations;
The
Section 3 describes the proposed model for multimodal mass media evaluation;
The
Section 4 describes the corpora that was processed, properties and classes, and results of method verification on the task of identification of negative information on socially significant topics.
In conclusion, we discuss the results obtained, the advantages and disadvantages of the proposed algorithm, and outline the directions for future research.
2. Related Works, Tools and Methods
2.1. Media Monitoring Tasks and Tools
Reference [
10] provides the following definition of media monitoring: “media monitoring is the process of observing media news flow continuingly to identify, capture and analyze contents containing specific topic keywords”. However, this definition couples the process of monitoring with the method (keywords-based). Hence, we generalize the definition of media monitoring as the process of content analysis of mass media. Media monitoring can be used for comparison between large corpora of texts (task 1). For example, in a task comparing Turkish and English, the corpora of news related to science is considered. Moreover, media monitoring includes such tasks as social behavior, public opinion identification [
11,
12], and online sales trend analysis [
13] (task 2), and comparison of preferences and characteristics of population segments (task 3). For example, Macharia [
14] analyses gender inequality. Media monitoring tools are an important part of reputation management (task 4). The most frequently implemented functions are brand mentions (with or without direct tagging), relevant hashtags (branded and unbranded), mentions of competitors, and general trends applicable to some industry. The main question that can be answered with the help of such tools is: “Do you know what they say about your company or brand in the media?”. There are a significant number of products that monitor the media and social media, some of which are listed in
Table 1 [
15,
16,
17].
The systems listed in
Table 1 mostly implement reputation management-related tasks, in addition to manual methods of analysis, such as keyword-based queries with application of TF-IDF (term frequency-inverse document frequency) indicators [
12,
18].
Although the application of keyword queries provides a certain level of interpretability, it nonetheless imposes limitations on these online systems and services:
As a rule, they are limited in query semantics, and query results need further manual selection [
10].
The results of query execution depend on the search algorithm and the current system/database state. Such services generally do not have features for saving query results [
18].
These tools do not address the issues of evaluating the media sources themselves.
These tools are limited in the evaluation criteria that are assessed, which are usually only sentiment analysis, and only some forms of media coverage index are assessed.
For more research-oriented tasks (comparison of corpora related to different countries/cultural spaces, population segment preferences and public opinion analysis, topical trends and seasonality, etc.) automatic clusterization of texts is often performed using the latent Dirichlet distribution (LDA) [
19,
20,
21], and classification of documents is performed using machine learning models [
10,
13,
17,
22]. It should be noted that a supervised learning approach is possible if a significant volume of a labeled dataset is available. Modern state-of-the-art models for text classification, such as BERT and GPT (Generative Pre-Trained Transformer), require at least tens of thousands of training examples for fine-tuning, while also being extremely complex (billions of parameters/weights), and require GPUs (graphical processing units) for sufficient computational performance. In addition, for research purposes, a tool is needed that allows us to ask more diverse questions and perform a comparative analysis of the media. The main goal of such a tool is to provide experts, researchers, managers, and supervisors with a comprehensive and powerful set of analytical tools to obtain up-to-date relevant reports, visualizations, and evaluations of public mass media publications in a certain given area of interest. To address these tasks in a situation when obtaining large volumes of labeled texts is not possible, the MCDM approach can be applied in combination with the topic modeling of news corpora.
2.2. Topic Modeling and MCDM
Given the variety of digital sources of information and significant volume of news, there is a growing demand for their automated analysis. The evaluation of the properties of media texts can be based on natural language processing methods, for which significant progress has been achieved. In turn, the aggregation of the values of heterogeneous properties is often performed using systems of multiple-criteria decision making (MCDM). Topic analysis or topic modeling is one of the actively applied natural language processing (NLP) methods. Topic modeling is a method based on the statistical characteristics of collections of documents, and is used for text summarization, information extraction, information retrieval, and classification [
23]. The essence of this approach lies in the intuitive understanding that the documents in the collection form groups in which the frequency of words or word combinations differs.
Topic modeling is used as an attempt to overcome the limitations of BERT [
24] and other deep learning NLP models, such as the necessity for large volumes of manual labeling and significant computational complexity, while also preserving the idea of transfer learning by transferring knowledge from large unlabeled datasets to obtain knowledge on high-level hidden latent structures of the corpora.
Topic modeling is well developed in terms of algorithms and methods based on a statistical language model, and the use of document clusters related to a set of topics allows solving problems of synonymy and polysemy of terms [
25]. Probabilistic topic models describe documents (M) by discrete distribution of the set of topics (T), and topics by discrete distribution of the set of terms [
26]. That is, the topic model determines the topic to which each document belongs and which words form each topic. Probabilistic latent semantic analysis (PLSA), a popular latent Dirichlet distribution (LDA) method [
27], and its extension BigARTM [
28], are used to build a topic model of document corpora. A detailed description of the methods is presented in
Appendix A.
In cases in which it is necessary to make a decision based on a variety of heterogeneous parameters and alternatives, several methods are used to take into account the relative importance of the parameters and aggregate their values as one or a small number of estimates. By their nature, such tasks are related to the field of multicriteria decision making widely used in decision support systems (DSS) [
29,
30,
31], which is also applicable in NLP [
32]. MCDM uses many methods to make a decision based on heterogeneous criteria, including [
33]: Weighted Linear Combination (WLC) and Ordered Weighted Averaging (OWA) [
34]; potentially all pairwise rankings of all possible alternatives (PAPRIKA) [
35]; ELECTRE [
36]; preference ranking technique for order performance by similarity to ideal solution (TOPSIS) [
37]; Multi-attribute utility theory (MAUT) [
38]; Preference Ranking Organization Method for Enrichment of Evaluations (PROMETHEE) [
39]; VIKOR [
40]; analytical hierarchy process (AHP) [
41]; fuzzy logic [
42]; and Bayesian networks [
43,
44].
Following the Bayes equation, the conditional probability of the validity of hypothesis
h conditional to the event
e is expressed in the form:
where
p(
e│
h) is the conditional probability of occurrence of the event
e given
h is true,
p(
h) is the prior probability of hypothesis
h,
p(
e│∽
h) is the conditional probability of
e given
h is false, and
p(∽
h) is the probability that the event
h is not true, which, according to the formula for the total probability, can be calculated as:
Thus, to calculate the conditional probability p(h│e), the probabilities p(e│h), p(e│∽h), and the prior probability p(h) is are sufficient.
Some of the methods listed above, such as PAPRIKA, PROMETHEE, TOPSIS, ELECTRE, and AHP, include mechanisms for obtaining expert evaluations. AHP [
45] uses its scale of paired criteria comparison. To obtain criterion weights, the normalized matrix is calculated:
As a result, the normalized final weights are calculated:
In this paper, the BigARTM topic model is used to calculate conditional probability distributions of documents by topics, properties, and one or more classes. To evaluate properties’ weights in the classification process, we use AHP, which has proven its practicability in many studies [
46]. The aggregation of topics’ effects on the final mass media assessment (MMA) is carried out using the Bayesian method, which ultimately allows calculation of the expected hypotheses on certain media publication’s characteristics.
3. Method of Media Evaluation Process
3.1. MMA Workflow
We believe that texts with a significant impact on the social information environment should be considered more carefully than texts related to private or everyday household issues, humor, etc. We propose to first consider popular articles gaining strong reaction from the audience; then, of these, identify the groups of news of social significance; and, finally, analyze the latter more thoroughly by evaluating the sentiment of the article’s content.
The proposed model considers assessments of each publication in three modalities:
Topics, obtained through topic modeling. For example, sports, education, economics, accidents, etc.
Properties. An arbitrary list of properties can be used. It is necessary to have a process to obtain assessments of the influence of each topic on each of the chosen properties. Examples of such processes are described in
Section 4. Examples of properties are sentiment, social significance, objectivity, manipulativeness, politicization, etc.
Classes. Identification of articles related to each class is in general the final goal of the proposed method. The chosen properties should have some correlation with or influence on the final classes. In the case of the article the final class is negative information relating to socially significant topics.
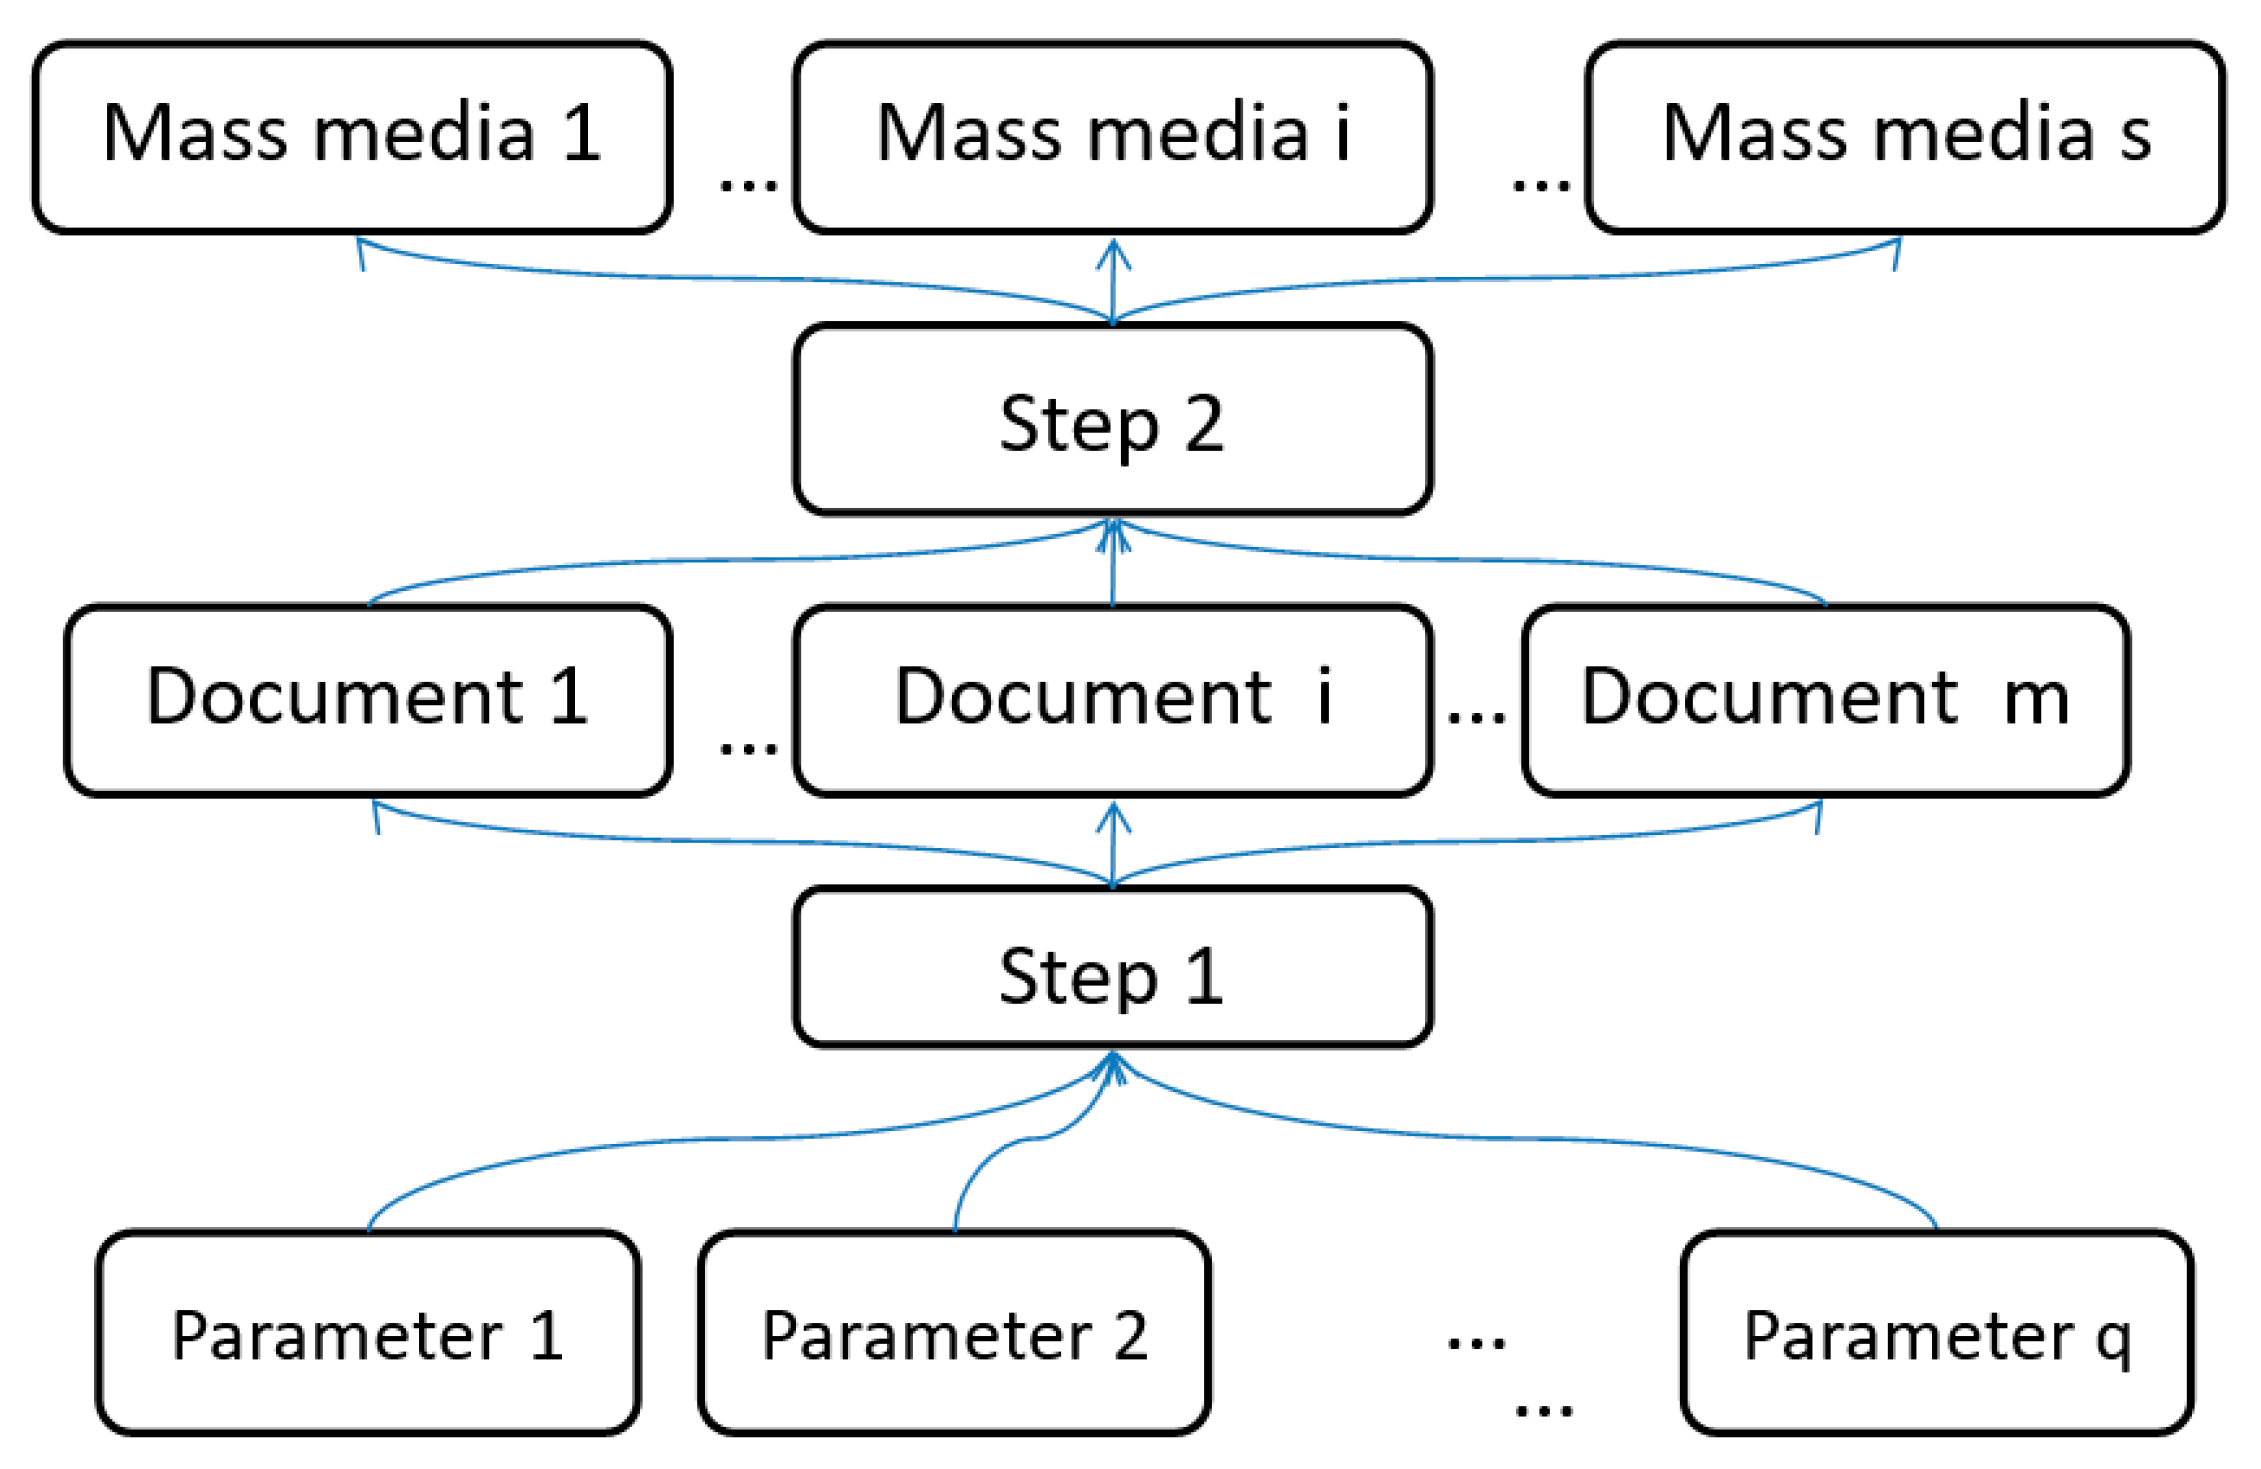
The process of analyzing media text is summarized as follows (
Figure 1):
Compilation of a list of properties which can be used to determine whether the text belongs to one of the classes;
Evaluation of the comparative significance of the properties based on AHP;
Calculation of the properties’ estimates for each text based on the topic model of the corpora;
Aggregation of the properties’ estimates and their comparative significance to obtain a decision on the class to which the text can be assigned (Step 1);
Evaluation of the media based on the classifications of the texts obtained (Step 2).
The listed stages are implemented as an algorithm for multimodal assessment. The main idea of multicriteria assessment and aggregation of subjective and objective properties was initially described in [
44]. To implement the described process, we defined the text properties as described in [
47,
48], and their weighted significance for the task of assigning the text to the above classes, and developed an algorithm for calculating properties’ estimates based on the topic model of the text corpora. The proposed application of the topic model generated using cluster analysis (unsupervised learning) in conjunction with classes and attributes defined by experts is noteworthy. In this approach, the semantics of the distribution are determined by the user (expert), and the initial topic modeling depends on the corpora of documents. Application of the Bayesian approach allows the probability of a hypothesis to be assessed based on incomplete information with a part of the text corpora. In other words, it allows evaluation estimates for a medium for the mentioned modalities to be obtained by processing only a part of the text corpora, albeit with reduced accuracy.
3.2. MMA–Description of Implementation
The purpose of the algorithm is to aggregate the weights of the correspondence of articles to topics, and then the correspondence of topics to parameters/properties and classes. This allows correspondence estimations of the media to be obtained in three modalities: topics, properties, and classes. We named the algorithm multimodal mass media assessment (M4A). The algorithm includes two steps. In the first step, it generates the topic model and calculates the values of conditional probabilities p1, …, p6 (see below). The second step aggregates the conditional probability distributions obtained and calculates the assessments of the properties of each mass medium and their attribution to certain classes.
3.2.1. Step 1. Conditional Probabilities Calculation
The input data and the conditional probability matrices obtained are shown in
Figure 2, in which mass media sources (MMS) represent a set of text sources. The S media (MMS) are the sources of m documents (papers), which are obtained by applying data collection systems (process 2). The resulting corpora M is divided into topic clusters T (process 1). Experts shape classes C (process 4) by determining the properties of Q classes (process 3). Properties are described by dictionaries and features.
Next, we describe the process of how the M4A model is calculated. Several computational details should be first noted in the context of Bayesian aggregation. If subjective probability
p(
e│
h) is equal to 0.5, it will not have an impact on the target hypothesis
p(
h│
e), which can be interpreted as inconclusive or irrelevant. Hence, if
p(
e│
h) is higher than 0.5, its effect on the target hypothesis is positive, and if it is lower than 0.5, its effect is negative. This peculiarity implies that the normalization at each step of the calculation process should be adjusted correspondingly. For example, if a feature/event has a positive impact of 0.8 but is only applied to a certain object with weight of 0.5, it would not be correct to simply multiply these two numbers and renormalize the product, because the result of multiplication would be 0.4, hence, a small negative impact, which does not conform with the actual feature/event impact of 0.8 (positive). Furthermore, there would be no guarantee in later attempts to renormalize the results that the middle (0.5) would be maintained. It should also be clarified that the weight (0.5) in the previous example usually corresponds to the degree to which the document corresponds to a topic, which was assigned a certain impact value (0.8). However, this may change from one step of the model to another as noted below. To resolve this issue, a custom process of normalizing the weighted impact was introduced, which is performed according to the following formula:
where
p is the impact of a feature/event/topic and
w is the weight (or the degree to which the object relates to the given feature/event/topic). Then, the Bayesian aggregation process described above is applied. The last step is the normalization of each row of the resulting matrix, which is also customized: all values below 0.5 are normalized separately to the range [0, 0.5] and all values above 0.5 are normalized to [0.5, 1]. This normalization prevents damping of values to maintain values at an adequate level of saturation in addition to the multiple matrix transformations (
p1 ->
p6).
The process of calculating the P matrices can be described as follows (
Figure 2):
The P1 matrix describes the relationship between topics and evaluation criteria. It can be obtained using different methods, including dictionary generation, manual labeling, and (semi-) automatic labeling via the multi-corpus approach [
49].
The P2 matrix describes the relationship between the documents and the topics, and is obtained using topic modeling (in LDA-based topic models it corresponds to the theta matrix).
The P3 matrix is obtained by performing the first stage of AHP, i.e., reducing the pairwise comparison matrix of evaluation criteria to a column vector of each criterion importance.
P4 describes the relationship between topics and target classes. The P4 matrix is calculated as a custom matrix multiplication of p1 by p3. By custom matrix multiplication we refer to the custom weighted impact with customized normalization, as described above.
P5 describes evaluations of the relationships of each document to each target class, and is calculated using the custom matrix multiplication.
P6 describes evaluations of relationships of each document to each evaluation criterion and is also calculated using the custom matrix multiplication.
The main result of the process is the P5 matrix, which describes the relationship of each document to target classes, which are composed of evaluation criteria. The P6 matrix can also have utility, which is dependent on the usefulness of the evaluation criteria.
After obtaining the estimates for each article, the media is evaluated in the second step of the proposed model described below.
3.2.2. Step 2. Mass Media Assessment
The second step of the model is the aggregation of document evaluations by each criterion and class to obtain a total evaluation for each mass media source. To evaluate the overall impact that a given mass media source has on the overall information field with regard to a given criterion, two elements have to be considered: the overall volume of the values of the given criteria among the documents published in the given source, and the average value of the given criteria. If we consider social significance as an example, we could refer to these two elements as the overall volume of socially significant documents and concentration of socially significant documents. This means that even if the concentration of socially significant news is high, but the mass media generally publishes only a few news articles each month, its overall impact is low. However, if this news has high volume in mass media with high publication activity, the overall impact should also take into account the concentration of such news, which might be low. To aggregate these two elements, the following formula was proposed:
where
is the total impact of source
s,
is the sum of all document’s evaluations,
is the maximum sum of all document’s evaluations among all other sources, and
is the number of documents inside the source. Hence, this formula is upper-bounded by 1 and its values are non-negative. This is a relative value and should be used in cases in which there is a significant number of sources to rank them according to both volume and concentration of documents in regard to given criteria.
4. Data and Verification
The P2 matrix was obtained using BigARTM topic modeling on a corpus of 804,829 news publications from 40 Kazakhstani sources published from 01 January 2018 to 31 December 2019. Corpus and data used for verification are available at [
50].
The BigARTM model was calculated with smooth “sparse theta regularizer” (tau = 0.15), “decorrelator phi regularizer” (tau = 0.5), and “improve coherence phi regularizer” (tau = 0.2). The number of topics was 200. The parameters were chosen in the course of grid search optimization.
To perform a computational experiment, a set of three evaluation criteria were chosen: popularity/resonance, social importance, and negative sentiment. It was proposed to calculate the composite class of socially acute negativity. The AHP
Table 2 was processed and completed by experts, and the following values for the P3 matrix were obtained:
0.58 for negative sentiment;
0.22 for resonance/popularity;
0.19 for social importance.
Each column of the P3 matrix was obtained differently, which showcases the flexibility of the proposed model:
Negative sentiment values for each topic were obtained by manual labeling of two experts, which were cross-checked for inconsistencies, corrected, and averaged. Each topic was represented by 25 top words/phrases and each expert was asked to give an estimate of this topic’s sentiment on a scale from 0 to 10, where 5 is neutral, 0 is highly positive, and 10 is highly negative. It should be noted that sentiment labeling may not reflect the author’s opinion in each text, but rather the negativity or positivity of an event described in a given news publication.
Resonance/popularity was labeled automatically by a method of analyzing the multicorpus imbalance because the number of views and other activity indicators of some ratio of the documents are known. Each topic was labeled automatically based on the proportion of popular/resonant news on the topic.
Social importance was also labeled automatically but on the basis of expert labeling of sources. This was straightforward: documents from a corpus of official state development programs, including development plans for different regions, industries, and directions, were considered to be socially important, whereas documents from common mass media sources were considered to be generally socially non-important, or have neutral social importance. This can be considered to be in assessment of topical asymmetry between the corpus of the news publication and the corpus of governmental development programs and documents. Different sources can also be assigned to different groups and corpora sequentially using expert labeling, or the separation can be performed using some other explicit property.
Hence, the conducted experiment demonstrates how three main methods for obtaining topics evaluations can be obtained:
Manual topic-level labelling;
Automatic or semi-automatic labelling based on objective properties;
High-level labelling of sources, corpora, or some other explicit properties, and then assigning the measure of topical asymmetry as topic weights
Let us consider the top news by each of the criteria, and the top news of the composite target class:
Table 3,
Table 4,
Table 5 and
Table 6 show the top five news items by each of the criteria and by the final class, respectively. It should be noted that the top news items by resonance/popularity in
Table 3 were hand-picked from the top 500 news items because the variety of topics is very narrow and the top news items mostly consist of sports-related publications. News titles were translated into English for convenience. Top news items by negative sentiment consist mostly of homicide, investigation of planned terrorist activities, catastrophes (such as the Arys explosion in 2019), and human rights-related issues (rallies, freedom of assembly, police brutality, etc.). Top news items by popularity mostly consist of sports news, celebrity news, and various lifestyle publications. Top socially important news mostly consists of state employment programs, infrastructure programs, and the main directions of social support by the government. It is important to note that the top news items by the final aggregated class do not generally intersect with the top news items by the three properties. This indicates that the three properties are independent and that there is the potential for the aggregated class to be more informative. The top news items by the final class consist mostly of information about the popular illegal opposition movement “DCK” (Democratic Choice of Kazakhstan), extremist religious movements, planning of terrorist activities, and instances of police cruelty. Indeed, these news items are popular, related to socially significant topics (mostly related to national security), and negative, but do not fully correlate to any of the three properties. Extended lists of the top news items are presented in
Appendix C.
Table 2,
Table 3,
Table 4 and
Table 5 illustrate that the top news items by the estimated values correspond to the respective criteria. However, such manual verification naturally cannot be used to verify the model’s results. Hence, a methodology for cross-validation of news was proposed:
A subset of 10% of news publications was randomly labeled as a test set.
The described model calculation was performed, starting from the topic modeling stage, without taking the news in the test set into account.
Then, when all necessary weights were obtained (matrices P1 to P4), matrices P5 and P6 were calculated for the whole corpus, i.e., both the test set and training set.
A random subsample of 1000 news items labeled as the test set was randomly selected from the top 10 and bottom 10 percentiles according to the calculated estimates for each of the three criteria and the final class. Only the top and bottom news items were considered because experiments have shown that a significant proportion of news cannot be labeled by either experts or the system. This, in turn, is because not all news items are, for example, socially significant or insignificant; most news items can be considered to be socially significant to some extent. It should be noted that 20 percent of the corpora is nonetheless a considerable volume of news items—around 160,000. Hence, the goal of the verification is to ensure that the precision of the model is high, whereas recall is not considered to be critical according to the proposed methodology.
These subsamples were manually labelled by experts. Experts were provided with title, date, URL, and media source. This was performed for negative sentiment, social significance, and the final class. Manual labeling was not necessary for resonance/popularity because true values of the number of views were known and used for verification.
Quality metrics were calculated.
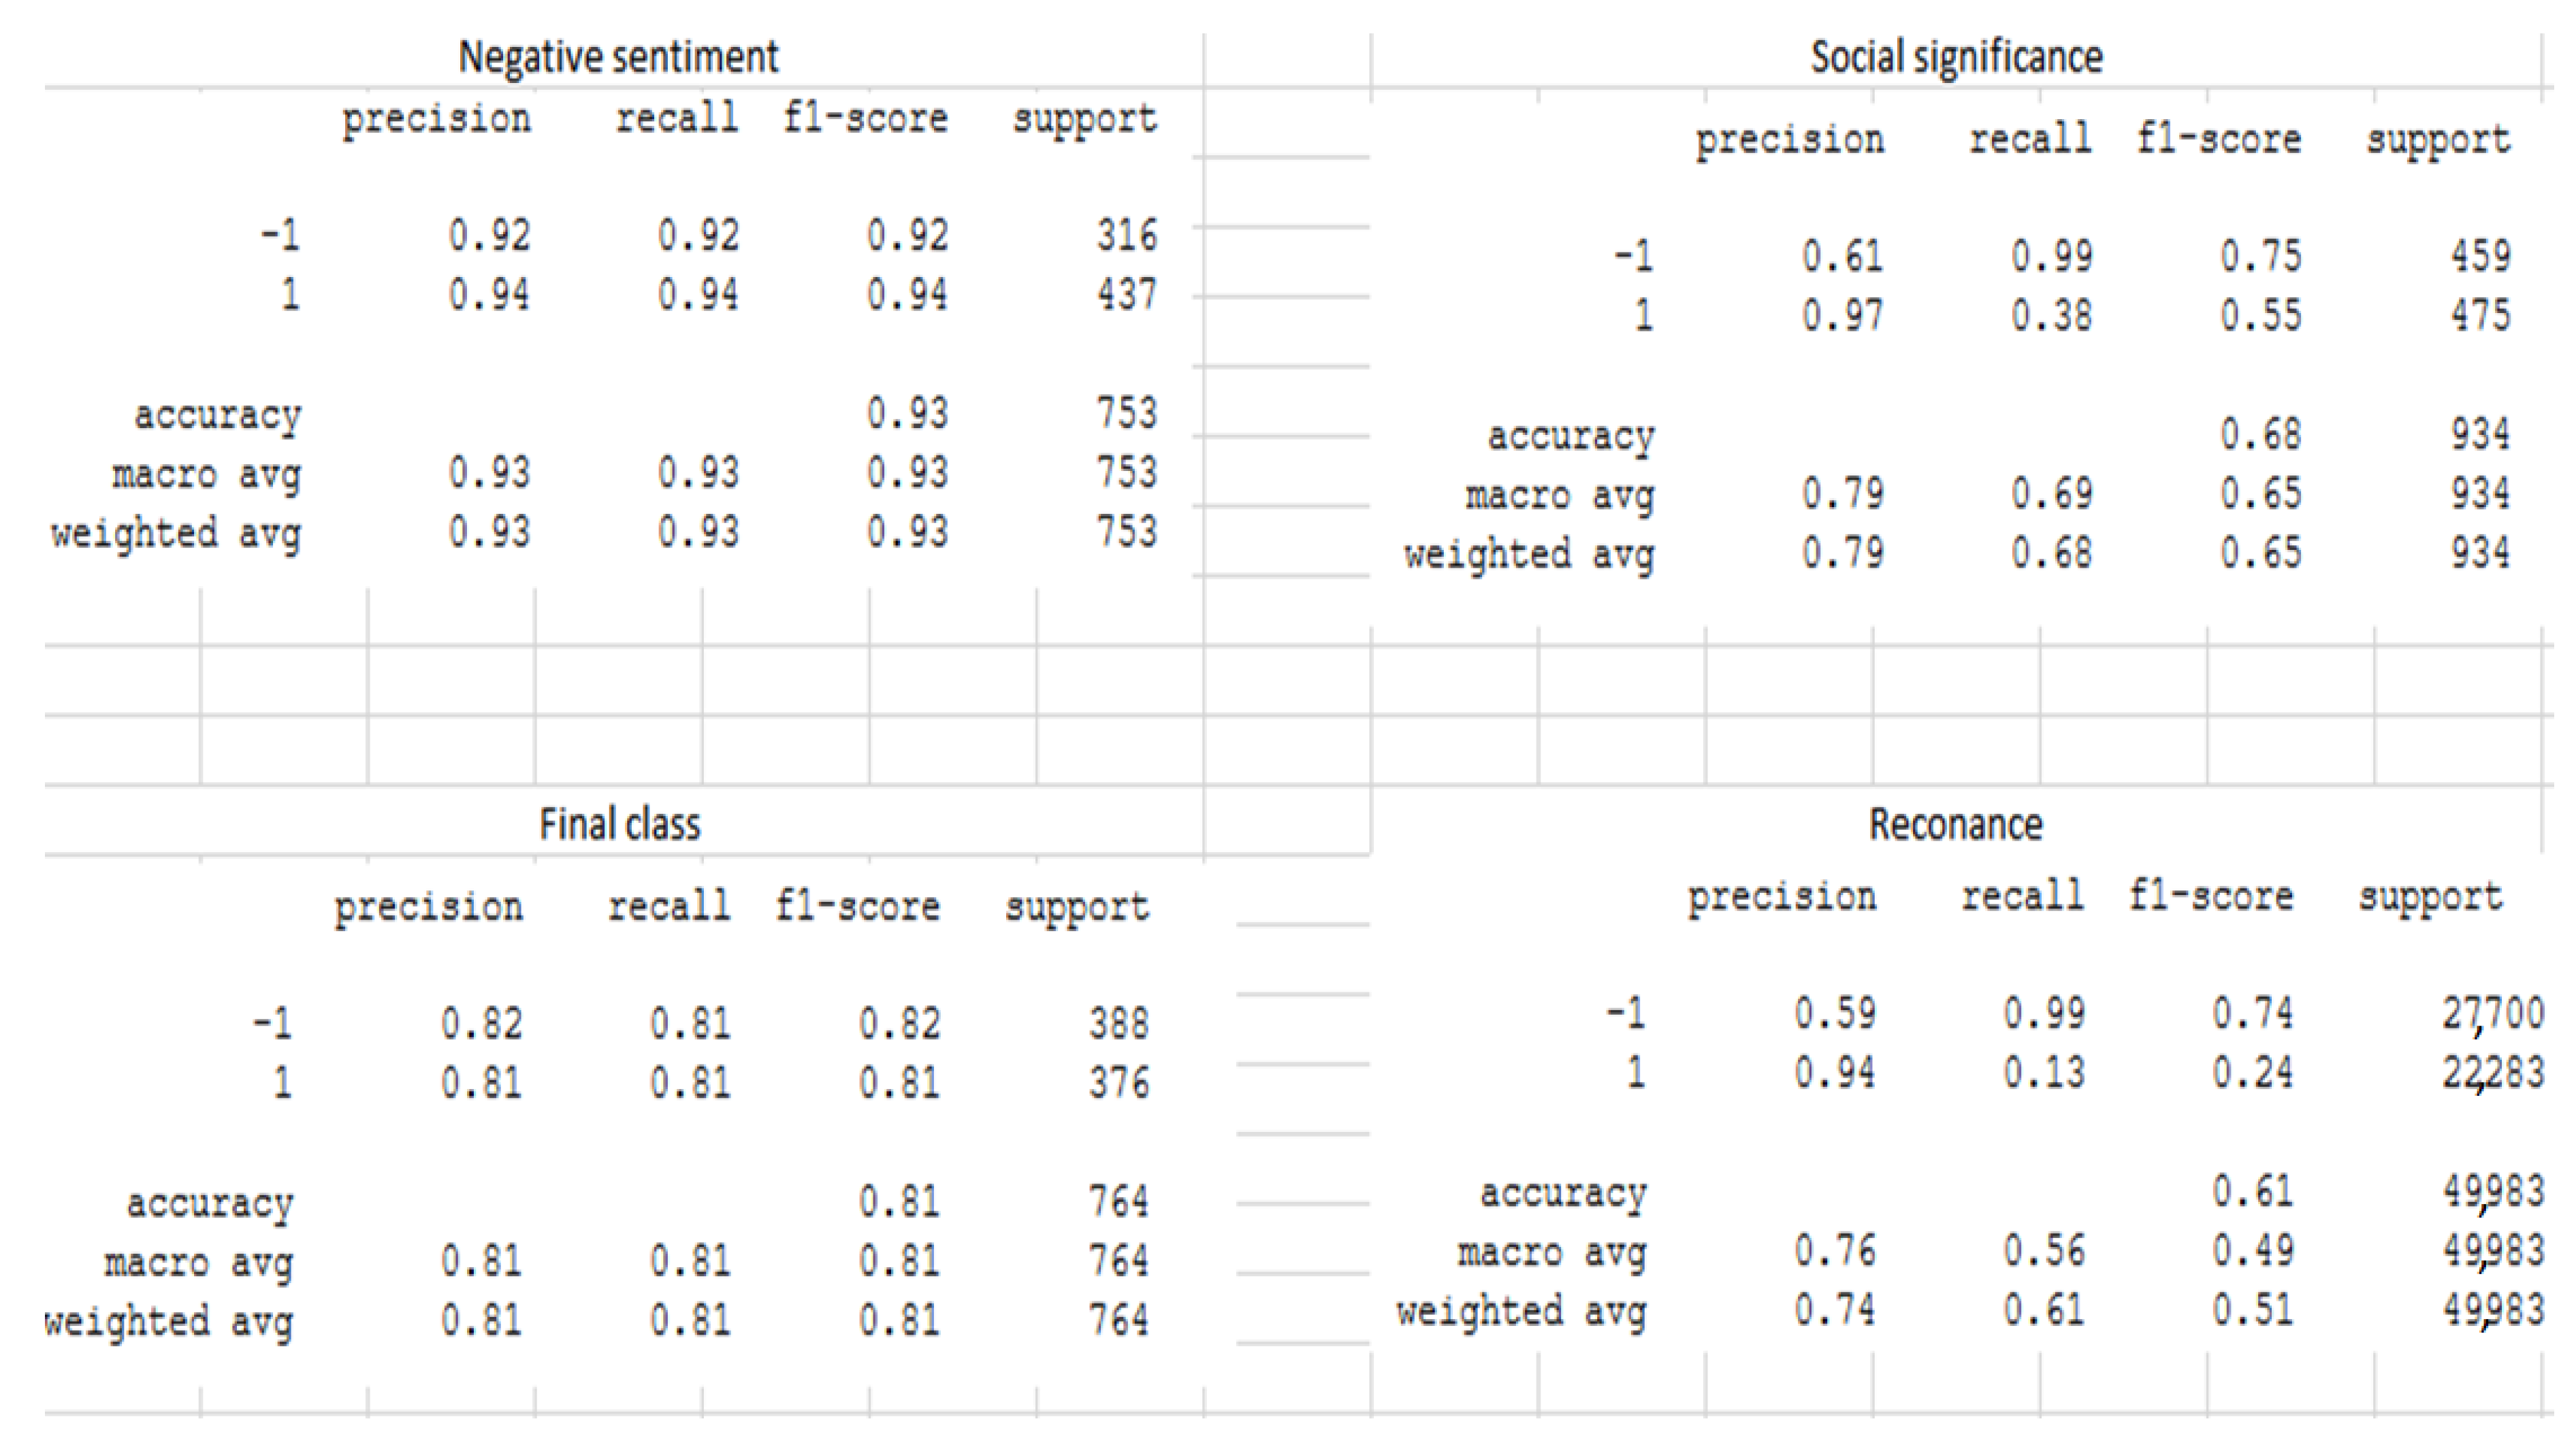
Table 7 shows the results of model verification. It can be observed that the lowest results were obtained for resonance/popularity, even though objective activity indicators were known. This can be related to the fact that popularity (number of views) is mostly connected with the article’s title, and much less related to topics highlighted in the text, whereas the proposed model analyzes texts based on high-level topic structures. Social significance evaluations also show lower than average performance, whereas negative sentiment, which is a more simplistic criterion for classification, was predicted with the area under receiver operating characteristics curve (ROC AUC) of 0.93. The final class was also classified with significant predictive power, achieving an ROC AUC of 0.81. Overall, it can be concluded that the model demonstrates significant predictive power, but due to the uncertain subjective nature of the considered criteria, a trade-off between precision and recall is necessary. In this case, precision was indeed high: for resonance, precision for the positive class was 0.94; for social significance it was 0.97; for negative sentiment it was 0.94; and for final class, precision of 0.81 was achieved. Recall ranged from 0.13 (resonance) to 0.94 (negative sentiment). It should be noted that these results were obtained with a relatively simple model (without any elements of Recurrent Neural Networks or deep learning) and the calculation of all necessary weights and parameters was either automatic, or required minimal manual labeling. Detailed metrics are presented in
Appendix B.
To compare the classification quality of the proposed model, a modern transfer learning approach was applied to the data, specifically, the BERT transformer model. A pretrained model from the DeepPavlov library (RuBERT, Russian, cased, 12-layer, 768-hidden, 12-heads, 180 M parameters) was used to obtain sentence embeddings for the texts, which were average pooled into text embeddings. Then, a gradient boosting model from the sci-kit learn package was trained on the 1000 labelled texts for each criterion (which were also used for the validation of the proposed MMA model). K-fold cross-validation of the obtained modeled showed that the results of the proposed model are comparable with those of modern deep learning transformer models in situations with a low number of labelled objects, which is the case with many classification problems, with the exception of a few well-researched problems, such as sentiment analysis. ROC AUC values for the BERT-embedded-based models were: 0.65 for final class, 0.7 for social significance, 0.72 for negative sentiment, and 0.88 for resonance. These results are comparable to those of the proposed MMA model. It should also be noted that modern research shows that embedding pre-trained BERT models can be used to obtain results that are close to state-of-the-art quality for a number of problems, including text classification, even without fine-tuning [
51]. Hence, fine-tuning of the BERT model was not considered in this work, particularly given the low volume of labelled data.
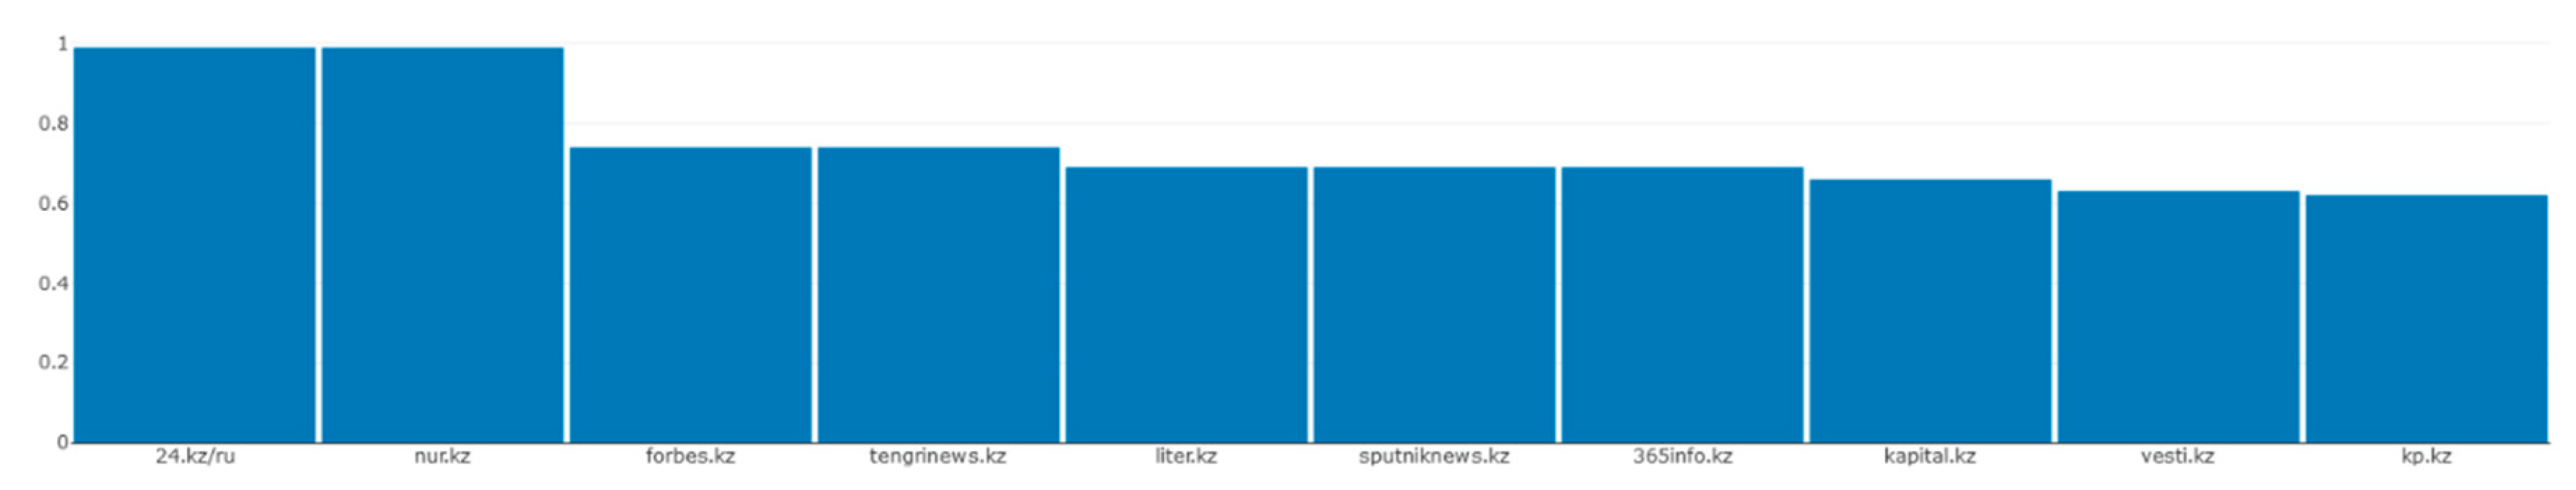
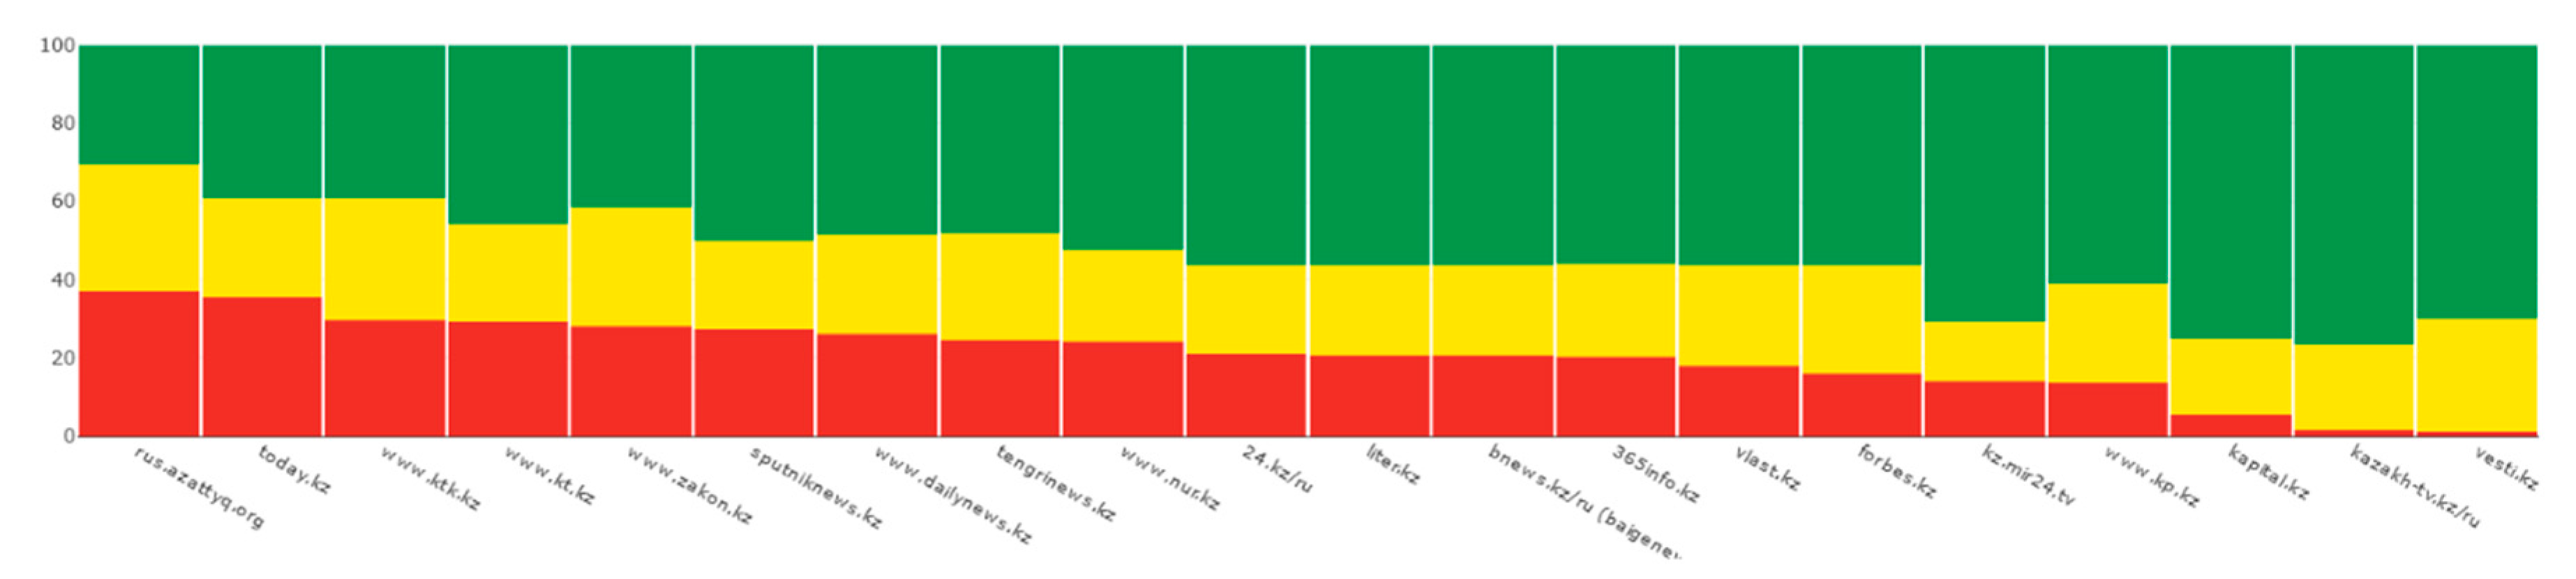
Figure 3 illustrates the comparative evaluation of the top media sources by the negative information on socially significant topics. For sentiment, another type of analysis can be applied, for example, considering the distribution of sentiment among different mass media sources. In
Figure 4 neutral news corresponds to news with sentiment evaluated to the range [0.4, 0.6].
5. Conclusions
The media, as the “fourth power, has a significant share of responsibility for the process of shaping attitudes, opinions, the meaningful context of public life, and objective descriptions of the work of state bodies. In this regard, it is useful to evaluate not only individual documents but also the media as a whole in terms of the validity of specific semantically defined hypotheses; that is, to answer the questions such as “Is the media a source of socially significant information?”, “Does the media publish popular articles?”, and “Does the media exhibit objectivity?”. The answer to these questions allows us to undertake a multifaceted assessment of articles and the media in general, in addition to performing comparative analysis. The proposed multicriteria classification approach also allows complex search requests to be executed, which are not only based on keywords, unlike traditional full-text search engines; for example, a list of negative socially significant news items that exhibit objectivity for a certain period can be requested.
This paper proposes a method that provides answers to the above questions based on objective features of the corpus of media articles and subjectively assigned high-level expert labeling.
The proposed model was validated based on both lists of top news publications for each of the considered properties and classes, which look coherent and logically consistent, and on standard Machine Learning metrics, such as F1 Score and ROC AUC, calculated on four subsamples of 1000 news items manually labeled by experts.
The obtained results indicate that the algorithm will provide the required media estimates by aggregating the estimates of the array of documents belonging to them. An approach for the evaluation of mass media sources was developed that uses both concentrations of news with high predicted values of the considered property/class and the overall volume of the publications.
However, the described approach has a number of limitations:
The topic modeling applied to obtain vector representations of texts performs analysis at the so-called bag of words level and does not take into account more subtle semantics of the texts, order of words and n-grams, etc., which considerably limits the potential quality of the algorithm.
Expert assessments of the significance of attributes are subject to considerable subjectivity.
The described approach performs best for large corpora (a minimum of 50,000 to 100,000 texts) of long texts (at least 100 to 150 words). Preliminary experiments have shown that applying the proposed model to smaller corpora, particularly if the corpus is not representative of the general population, results in significantly lower predictive power.
To overcome these shortcomings, further studies are suggested to apply models using distributive semantics methods to form a topic model, or to move the problem of high-level labeling to text embedding space. Such an approach would presumably take into account the semantic content of the text, in contrast to counting the number of words. In the current study, the results for the three properties ranged from ROC AUC 0.56 to 0.93 with high (>0.9) precision, whereas the result for the final class was ROC AUC 0.81. The results were compared to the state-of-the-art BERT model. It was found that the results are comparable, at least in the situation of a limited volume of manually labelled texts.
The proposed model was implemented as a scheduled worker in an informational system for mass media monitoring and evaluation [
52]. The source code of the system is available at [
53] and source code for workers (preprocessors, models, parsers) is available in a separate repository [
54]. Other similar systems discussed in this paper are mostly aimed at monitoring certain brands or products in the mass media, and mostly perform statistical analysis by keyword searches and forming statistical reports on frequency of words, phrases, and tags, lists of publications by date/popularity/source, etc. The developed system, in which the proposed model is integrated, allows classical problems, such as simple reports or sentiment analysis, to be solved. In addition, it also has a number of unique use-cases, which distinguish it from existing solutions:
Automatic analysis by topic, significant event, and object without the necessity to form keyword-based queries.
Analysis by an arbitrary list of criteria, not limited by sentiment, but also including social significance, popularity, manipulativeness, propagandistic content, relationship to a certain country, relationship to a certain area/topic, etc. It should also be noted that several approaches exist to undertaking these assessments, which are either automatic or require only a small volume of high-level labeling.
Analysis of dynamic behavior of topics.
Predictive analysis at the topic level (trends, changes in discourse, vocabulary).
Author Contributions
Conceptualization, R.I.M., K.Y. and R.M.; methodology, R.I.M. and R.M.; software, K.Y. and S.M.; validation, T.B. and Y.K.; formal analysis, R.I.M.; investigation, K.Y., M.Y., Y.K., T.B. and S.M.; resources, R.M.; data curation, K.Y. and S.M.; writing—original draft preparation, R.I.M. and K.Y.; writing—review and editing, M.Y. and K.Y.; visualization, R.I.M. and K.Y.; supervision, R.I.M. and R.M.; project administration, R.M.; funding acquisition, R.M. All authors have read and agreed to the published version of the manuscript.
Funding
This research was funded by the Committee of Science under the Ministry of Education and Science of the Republic of Kazakhstan, grant BR05236839.
Conflicts of Interest
The authors declare no conflict of interest.
Appendix A. LDA and BigARTM Description
LDA can be expressed by the following equality:
which represents the sum of mixed conditional distributions on all
T set topics, where
is the conditional distribution of words in themes, and
is the conditional distribution of topics in the news. Transition from conditional distribution
in
is carried out at the expense of the hypothesis of conditional independence, according to which the appearance of words in news
m on the topic
t depends on the topic, but does not depend on the news
m, and is common for all news. This ratio is fair, based on the assumption that there is no need to maintain the order of documents (news) in the body and the order of words in the news. In addition, the LDA method assumes that the components
and
are generated by Dirichle’s continuous multidimensional probability distribution. The purpose of the algorithm is to search for parameters
and
by maximizing the likelihood function with appropriate regularization:
where
is the number of occurrences of the word
w in the document
m, and
is the logarithmic regularizer. To determine the optimal number of thematic clusters
T, the method of maximizing the coherence value calculated using UMass metrics is often used [
55]:
where
is the number of documents containing the words
and
, and
is the number of documents containing only the word
. On the basis of this measure, the coherence value of a single thematic cluster is calculated:
where
is the cluster word count, and
is the smoothing factor, which is usually equal to 1.
The more documents with two words relative to documents containing only one word, the higher the coherence value of an individual topic. As a result, thematic clusters were chosen in which the maximum average coherence value is reached:
BigARTM
BigARTM is an open-source library for parallel construction of thematic models on large text cases whose implementation is based on the additive regularization approach (ARTM), in which the maximization of the logarithm of plausibility, restoring the original distribution of
W words on documents
D, is added to a weighted sum of regularizers (2), by many criteria:
where
is the number of occurrences of the word
w in the document
d,
is the word
w distribution in topic
t,
is the distribution of the topic
t over the documents
d. This summand,
, is a weighted linear combination of regularizers, with non-negative
weights. BigARTM offers a set of regularizers implemented on the basis of Kulbac–Leilbler divergence, in this case demonstrating the entropic differences between the distributions of the initial matrix
p’(
w|
d) and the model
p’(
w|
d):
Smoothing regularizer, based on the assumption that the matrix columns
are generated by Dirichlet distributions with hyperparameters
and
(identical to the implementation of the LDA latent placement model, in which hyperparameters can only be positive).
In this way we can highlight background topics, defining the vocabulary of the language, or calculate the general vocabulary in the section of each document.
Decreasing the regularizer, the reverse smoothing regularizer:
aims to identify significant subject words, so-called lexical kernels, in addition to subject topics in each document, zeroing out small probabilities.
Decorrective regularizer makes topics more “different”. The selection of themes allows the model to discard small, uninformative, duplicate, and dependent themes.
This regularizer is independent of matrix . The estimation of differences in the discrete distributions is implemented , in which the measure is the covariance of the current distribution of words in the topics versus the calculated distributions .
Appendix B. Detailed Verification Metrics
Detailed results of method evaluation are shown in the figure below.
It should be noted that support (number of objects) differs because experts had the option of labeling each object as 0 on a Likert scale, which can be interpreted as unknown/non-reliable. These news items were excluded from metrics calculations because the problem statement is to identify the most distinctive examples of objects with high values of a given property with the best possible precision.
Figure A1.
Results of method evaluation.
Figure A1.
Results of method evaluation.
Appendix C. Extended Lists of News Items by Each Property and Class
Table A1.
Top news items by negative sentiment.
Table A1.
Top news items by negative sentiment.
| Sentiment_m4a | Date | Title | Source |
|---|
| 0.857 | 1 November 2019 | A whole arsenal of weapons was seized from a resident of Almaty. | 24.kz/ru |
| 0.857 | 6 May 2019 | The explosion of ammunition occurred in Arys | nur.kz |
| 0.853 | 13 March 2018 | Movement “Democratic Choice of Kazakhstan” recognized as extremist | 365info.kz |
| 0.851 | 28 May 2020 | Another activist was summoned for questioning after the ban on the movement “Koshe partiyasy”. | rus.azattyq.org |
| 0.846 | 5 January 2020 | Suspect of attempted murder detained in Temirtau. | today.kz |
| 0.839 | 19 September 2019 | The Metropolitan Court upheld the order to arrest the 22-year-old activist. | rus.azattyq.org |
| 0.838 | 9 June 2020 | The body of a man was found in an apartment in Zhezkazgan. | zakon.kz |
| 0.838 | 23 June 2019 | One person died in the explosions in the town of Arys. | liter.kz |
| 0.837 | 22 September 2019 | Nur-Sultan police: on September 21, fifty people were detained in the capital. | rus.azattyq.org |
| 0.836 | 21 February 2018 | AI: in Kazakhstan in 2017, human rights were predominantly violated in three areas | rus.azattyq.org |
| 0.834 | 29 May 2020 | Aktobe activists are called to the police after the ban “Koshe partiyasy”. | rus.azattyq.org |
| 0.833 | 15 October 2019 | Almaty resident held a single picket in defense of Dzhakishev. | rus.azattyq.org |
| 0.833 | 3 October 2019 | Qaharman activists condemned police actions during arrests September 21 | rus.azattyq.org |
| 0.833 | 27 June 2019 | The regional akim assured that the city would be restored after the blasts, and local residents would be able to return to their homes. | sputniknews.kz |
| 0.832 | 5 June 2018 | A particularly large batch of heroin was stored in Kostanay’s grave. | 24.kz/ru |
| 0.829 | 10 November 2019 | | rus.azattyq.org |
| 0.829 | 13 October 2019 | The prosecutor requested restriction of liberty for Yerkin Kaziev, who is accused of participating in DCK chats. | rus.azattyq.org |
| 0.829 | 21 July 2019 | Police opened a case under the article “Self-administration” after an attack on journalists in Almaty. | rus.azattyq.org |
| 0.829 | 26 June 2019 | Military deminers in Arys are clearing the streets and buildings adjacent to the warehouse where the arsenal was stored. People are warned of the danger of returning home. | sputniknews.kz |
| 0.829 | 19 May 2019 | A resident of Tekeli is suspected of killing his neighbor. | dailynews.kz |
Table A2.
Top news items by estimated popularity.
Table A2.
Top news items by estimated popularity.
| Resonance_m4a | Date | Title | Source |
|---|
| 0.99 | 12 September 2019 | The ex-captain of “Barys” threw the 250th puck in KHL and helped his club to win the fifth match in a row. | vesti.kz |
| 0.958 | 1 December 2018 | Barys hockey players suffered a huge defeat. | 365info.kz |
| 0.944 | 26 December 2019 | Danelia Tuleshova presented a video for the song “Don’t cha”. | liter.kz |
| 0.923 | 27 October 2019 | Dimash Kudaibergen performed at a concert of Igor Cool in New York. | 365info.kz |
| 0.917 | 8 October 2018 | Rosehip: decoction during pregnancy | nur.kz |
| 0.917 | 31 May 2018 | Anastacia and Baigali Serkebaev will take part in Voice of Astana. | tengrinews.kz |
| 0.916 | 29 April 2019 | Pugacheva awarded the “Gold Star” to 11-year-old Yerzhan. | 365info.kz |
| 0.916 | 16 December 2018 | Dimash Kudaibergen recognized as Singer of the Year at Shanghai International Film Festival | bnews.kz/ru (baigenews.kz) |
| 0.915 | 18 June 2019 | The composition “This love” performed by the winners of the project “Voice of Children” can be downloaded at digital platforms. | sputniknews.kz |
| 0.909 | 25 April 2020 | Easy ways to clean and revitalize the liver are named | 24.kz/ru |
| 0.909 | 17 July 2019 | Dimash Kudaibergen announced a duet with Lara Fabian. | bnews.kz/ru (baigenews.kz) |
| 0.909 | 2 May 2019 | Chicory in folk medicine: application | nur.kz |
| 0.908 | 26 October 2019 | Dimash Kudaibergen flew to New York. | 365info.kz |
| 0.904 | 29 October 2019 | The date of the broadcast of “Evening Urgant” with participation of Dimash Kudaibergen became known. | bnews.kz/ru (baigenews.kz) |
| 0.904 | 14 October 2019 | Barys’s goalkeeper was recognized as the best goalkeeper of the sixth week of the regular CHL Championship. | vesti.kz |
| 0.904 | 1 May 2019 | Kazakhstan’s national team beat Lithuania at the 2019 World Cup in Nur-Sultan. | bnews.kz/ru (baigenews.kz) |
| 0.904 | 18 December 2018 | Kazakhstan’s youth team beats BCIHL league stars dryly. | 24.kz/ru |
| 0.904 | 9 December 2018 | How useful is a rosehip for men and women | nur.kz |
| 0.904 | 14 October 2018 | Astana “Barys” was defeated by Omsk “Avangard”. | 24.kz/ru |
| 0.903 | 9 March 2018 | “Barys at home gave in overtime to CSKA Moscow. | dailynews.kz |
Table A3.
Top news items by social importance.
Table A3.
Top news items by social importance.
| State Program (General TM is Detailed)_m4a | Date | Title | Source |
|---|
| 0.997 | 9 April 2019 | 210 billion tenge was allocated for the program “Business Road Map 2020” for four years. | bnews.kz/ru (baigenews.kz) |
| 0.974 | 30 April 2018 | 14 water supply facilities were delivered to SKO in 2017 | forbes.kz |
| 0.957 | 5 May 2020 | Over 1.2 million people will be employed in 2020. | 24.kz/ru |
| 0.953 | 5 May 2020 | More than 1.2 million people will be covered by employment promotion measures in 2020 | bnews.kz/ru (baigenews.kz) |
| 0.943 | 3 April 2020 | 690 thousand Kazakh people will get jobs | 365info.kz |
| 0.938 | 2 June 2020 | More than 196 thousand workplaces were created within the frames of RS and other state programs. | 24.kz/ru |
| 0.938 | 5 May 2020 | It is planned to create 255 thousand workplaces within the framework of the road map on employment. | kt.kz |
| 0.938 | 5 May 2020 | More than 10 thousand people were employed under the “Roadmap for Employment” in Kazakhstan. | today.kz |
| 0.938 | 17 September 2018 | The number of small companies is growing in Kazakhstan | kapital.kz |
| 0.937 | 2 June 2020 | More than 5 thousand projects have started to be implemented under the Road Employment Card | kapital.kz |
| 0.936 | 10 March 2018 | 18.1 million tons of grain are threshed in Kazakhstan. | vlast.kz |
| 0.928 | 6 April 2019 | It is planned to fully provide Kazakhstani people with centralized water supply in 2023. | vlast.kz |
| 0.928 | 4 February 2019 | We intend to carry out a full inventory of rural settlements in Kazakhstan. | vlast.kz |
| 0.928 | 16 September 2018 | The number of active companies increased by 2% for the month and 11% at once for the year. | forbes.kz |
| 0.927 | 29 April 2019 | Schools, kindergartens and roads will be renovated in 52 Kazakh villages in 2019. | kt.kz |
| 0.927 | 25 September 2018 | The Government approved the draft state program of regional development until 2020 | kt.kz |
| 0.926 | 23 May 2019 | The share of rural population in Kazakhstan decreased by almost 4% over 7 years | bnews.kz/ru (baigenews.kz) |
| 0.926 | 30 October 2018 | In Kazakhstan since the beginning of the year 9801 microcredits have been issued. | kt.kz |
| 0.925 | 22 August 2018 | Cargo traffic volumes jumped by 9% for the year | kapital.kz |
| 0.924 | 21 May 2019 | Ministry of National Economy of the Republic of Kazakhstan: at the end of 2018, the share of SMEs in GDP was 28.3%. | dailynews.kz |
Table A4.
Top news items by final aggregated class (negative information on socially significant topics).
Table A4.
Top news items by final aggregated class (negative information on socially significant topics).
| Potential Hazard_m4a_class | Date | Title | Source |
|---|
| 0.872 | 13 March 2018 | Movement “Democratic Choice of Kazakhstan” recognized as extremist | 365info.kz |
| 0.864 | 13 March 2018 | The VWC was banned in Kazakhstan as a movement calling for the forcible seizure of legitimate power and incitement of discord in society. | sputniknews.kz |
| 0.856 | 29 March 2018 | Adding to the DCK groups in Telegram, what may be the consequences for citizens | rus.azattyq.org |
| 0.844 | 23 September 2019 | In Almaty, two women are being tried on charges of participation in a banned religious organization. | rus.azattyq.org |
| 0.84 | 9 December 2018 | The Prosecutor General’s Office of Kazakhstan recognized Yakyn Inkar as extremist. | kp.kz |
| 0.837 | 21 May 2018 | Sentence of those convicted in Tablighi Jamaat case remained almost unchanged | rus.azattyq.org |
| 0.82 | 8 October 2019 | KNB employee arrested on suspicion of violence against transgender Victoria Berkhodjaeva | bnews.kz/ru (baigenews.kz) |
| 0.819 | 18 June 2018 | Journalists in Uralsk were summoned for questioning on the eve of the planned protests. | rus.azattyq.org |
| 0.818 | 25 October 2019 | Employees of the Anti-Corruption Service of the East Kazakhstan Oblast are accused of torture | rus.azattyq.org |
| 0.818 | 4 February 2019 | A resident of Astana who intended to create a cell “Hizb-ut-Tahrir” was detained. | rus.azattyq.org |
| 0.817 | 1 November 2019 | A whole arsenal of weapons was seized from a resident of Almaty. | rus.azattyq.org |
| 0.817 | 6 August 2018 | The inhabitant of Zhanaozen was sentenced to 7 years for the propaganda of terrorism. | rus.azattyq.org |
| 0.816 | 14 October 2019 | Serik Zhahin, accused of supporting the CPD, was sentenced to one year’s imprisonment. | rus.azattyq.org |
| 0.815 | 1 June 2018 | Detained high-ranking fighter against corruption | 365info.kz |
| 0.814 | 4 June 2020 | In Mangistau region two people were detained on suspicion of extremism | kt.kz |
| 0.813 | 9 November 2019 | In Kazakhstan they want to impose life imprisonment for rape of children | vlast.kz |
| 0.811 | 5 June 2018 | A particularly large batch of heroin was stored in Kostanay’s grave. | 24.kz/ru |
| 0.81 | 7 June 2020 | Adherents of the destructive current detained for drug trafficking to Atyrau | 24.kz/ru |
| 0.81 | 29 May 2020 | Aktobe activists are called to the police after the ban “Koshe partiyasy”. | rus.azattyq.org |
| 0.81 | 19 July 2018 | In Tomsk, the FSB detained a supporter of radical Islamists from Kazakhstan | forbes.kz |
References
- Edelman, R. Edelman Trust Barometer. Available online: https://www.edelman.com/research/2019-edelman-trust-barometer (accessed on 25 April 2020).
- Miller, D. Promotional strategies and media power. In The Media: An Introduction; Briggs, A., Cobley, P., Eds.; Longman: London, UK, 1998; pp. 65–80. [Google Scholar]
- Bushman, B.; Whitaker, J. Media Influence on Behavior. In Encyclopedia of Human Behavior; Elsevier: Amsterdam, The Netherlands, 2012; pp. 571–575. [Google Scholar]
- Don, W.; Zongchao, C.; Cylor, S. Media Effects. In International Encyclopedia of the Social & Behavioral Sciences, 2nd ed.; Elsevier: Amsterdam, The Netherlands, 2015; Volume 3, pp. 29–34. [Google Scholar]
- Ko, H.; Jong, Y.; Sangheon, K.; Libor, M. Human-machine interaction: A case study on fake news detection using a backtracking based on a cognitive system. Cogn. Syst. Res. 2019, 55, 77–81. [Google Scholar] [CrossRef]
- Bushman, B.; Whitaker, J. Media Influence on Behavior. Reference Module in: Neuroscience and Biobehavioral Psychology. 2017. Available online: http://0-scitechconnect-elsevier-com.brum.beds.ac.uk/neurorefmod/ (accessed on 24 November 2020).
- Mishra, S.; Rizoiu, M.A.; Xie, L. Feature driven and point process approaches for popularity prediction. In Proceedings of the 25th ACM International on Conference on Information and Knowledge Management; Association for Computing Machinery: New York, NY, USA, 2016; pp. 106–107. [Google Scholar]
- Tatar, A.; Antoniadis, P.; Amorim, M.D.; Fdida, S. Ranking News Articles Based on Popularity Prediction. In Proceedings of the 2012 IEEE/ACM International Conference on Advances in Social Networks Analysis and Minng, Istanbul, Turkey, 26–29 August 2012. [Google Scholar] [CrossRef]
- Bandari, R.; Asur, S.; Huberman, B.A. The Pulse of News in Social Media: Forecasting Popularity. Available online: https://arxiv.org/pdf/1202.0332.pdf (accessed on 20 September 2020).
- Bauer, M.W.; Suerdem, A. Developing science culture indicators through text mining and online media monitoring. In OECD Blue Sky Forum on Science and Innovation Indicators; LSE Research: Ghent, Belgium, 2016; pp. 19–21. [Google Scholar]
- Willaert, T.; Van Eecke, P.; Beuls, K.; Steels, L. Building Social Media Observatories for Monitoring Online Opinion Dynamics. Soc. Media Soc. 2020, 6. [Google Scholar] [CrossRef]
- Neresini, F.; Lorenzet, A. Can media monitoring be a proxy for public opinion about technoscientific controversies? The case of the Italian public debate on nuclear power. Public Underst. Sci. 2016, 25, 171–185. [Google Scholar] [CrossRef] [PubMed]
- Thanasopon, B.; Sumret, N.; Buranapanitkij, J.; Netisopakul, P. Extraction and evaluation of popular online trends: A case of Pantip.com. In Proceedings of the 2017 9th International Conference on Information Technology and Electrical Engineering (ICITEE); IEEE: New York, NY, USA, 2017; pp. 1–5. [Google Scholar]
- Macharia, S. Global Media Monitoring Project (GMMP). Int. Encycl. Gend. Media Commun. 2020, 1–6. [Google Scholar] [CrossRef]
- Barysevich, A. Top of the Best Social Media Monitoring Tools. Available online: https://www.socialmediatoday.com/news/20-of-the-best-social-media-monitoring-tools-to-consider/545036/ (accessed on 19 May 2020).
- Agilitypr. Media Monitoring Ultimate Guide. Available online: https://www.agilitypr.com/media-monitoring-ultimate-guide/ (accessed on 19 May 2020).
- Newberry, C. Social Media Monitoring Tools. Available online: https://blog.hootsuite.com/social-media-monitoring-tools (accessed on 19 May 2020).
- Barile, F.; Ricci, F.; Tkalcic, M.; Magnini, B.; Zanoli, R.; Lavelli, A.; Speranza, M. A News Recommender System for Media Monitoring. In Proceedings of the IEEE/WIC/ACM International Conference on Web Intelligence, Thessaloniki, Greece, 14–17 October 2019; pp. 132–140. [Google Scholar]
- Guo, Y.; Barnes, S.J.; Jia, Q. Mining meaning from online ratings and reviews: Tourist satisfaction analysis using latent dirichlet allocation. Tour. Manag. 2017, 59, 467–483. [Google Scholar] [CrossRef] [Green Version]
- Curiskis, S.; Drake, B.; Osborn, T.; Kennedy, P. An evaluation of document clustering and topic modelling in two online social networks: Twitter and Reddit. Inf. Process. Manag. 2020, 57, 102034. [Google Scholar] [CrossRef]
- Nikulchev, E.; Ilin, D.; Silaeva, A.; Kolyasnikov, P.; Belov, V.; Runtov, A.; Pushkin, P.; Laptev, N.; Alexeenko, A.; Magomedov, S.; et al. Digital Psychological Platform for Mass Web-Surveys. Data 2020, 5, 95. [Google Scholar] [CrossRef]
- Basnyat, B.; Anam, A.; Singh, N.; Gangopadhyay, A.; Roy, N. Analyzing Social Media Texts and Images to Assess the Impact of Flash Floods in Cities. In 2017 IEEE International Conference on Smart Computing (SMARTCOMP); IEEE: New York, NY, USA, 2017; pp. 1–6. [Google Scholar]
- Mashechkin, I. Methods for calculating the relevance of text fragments based on thematic models in the problem of automatic annotation. Comput. Methods Program. 2013, 14, 91–102. (In Russian) [Google Scholar]
- Devlin, J.; Chang, M.-W.; Lee, K.; Toutanova, K. BERT: Pre-Training of Deep Bidirectional Transformers for Language Understanding. Available online: https://arxiv.org/abs/1810.04805 (accessed on 15 September 2020).
- Parkhomenko, P.; Artur, G.; Nikita, F. Review and experimental comparison of text clustering methods. Proc Inst. Syst. Program. Russ. Acad. Sci. 2017, 29, 161–200. (In Russian) [Google Scholar]
- Vorontsov, K.V.; Potapenko, A.A. Regularization, robustness and sparseness of probabilistic thematic models. Comput. Res. Modeling 2012, 4, 693–706. (In Russian) [Google Scholar] [CrossRef] [Green Version]
- Blei, D.; Andrew, Y.; Michael, J. Latent dirichlet allocation. J. Mach. Learn. Res. 2003, 3, 993–1022. [Google Scholar]
- Vorontsov, K.; Frei, O.; Apishev, M.; Romov, P.; Dudarenko, M. BigARTM: Open Source Library for Regularized Multimodal Topic Modeling of Large Collections. In International Conference on Analysis of Images, Soc. Networks and Texts; Springer: Cham, Switzerland, 2015; pp. 370–381. [Google Scholar]
- Scott, J. A decision support system for supplier selection and order allocation in stochastic, multi-stakeholder and multi-criteria environments. Int. J. Prod. Econ. 2015, 166, 226–237. [Google Scholar] [CrossRef] [Green Version]
- Mardani, A. Sustainable and renewable energy: An overview of the application of multiple criteria decision-making techniques and approaches. Sustainability 2015, 7, 13947–13984. [Google Scholar] [CrossRef] [Green Version]
- Wanderer, T.; Stefan, H. Creating a spatial multi-criteria decision support system for energy related integrated environmental impact assessment. Environ. Impact Assess. Rev. 2015, 52, 2–8. [Google Scholar] [CrossRef]
- Hoceini, Y.; Mohamed, C.; Moncef, A. Towards a new approach for disambiguation in NLP by multiple criterian decision-aid. Prague Bull. Math. Linguistics 2011, 95, 19–32. [Google Scholar] [CrossRef]
- Kumar, A. A review of multi criteria decision making (MCDM) towards sustainable renewable energy development. Renew. Sustain. Energy Rev. 2017, 69, 596–609. [Google Scholar] [CrossRef]
- Yager, R. On ordered weighted averaging aggregation operators in multi criteria decision making. IEEE Trans. Syst. Man Cybern. 1988, 18, 183–190. [Google Scholar] [CrossRef]
- Hansen, P.; Franz, O. A new method for scoring additive multi-attribute value models using pairwise rankings of alternatives. J. Multi-Criteria Decis. Anal. 2008, 15, 87–107. [Google Scholar] [CrossRef]
- Figueira, J.; Vincent, M.; Bernard, R. ELECTRE methods. In Multiple Criteria Decision Analysis: State of the Art Surveys; Springer: New York, NY, USA, 2005; pp. 133–153. [Google Scholar]
- Lai, Y.; Ting-Yun, L.; Ching-Lai, H. Topsis for MODM. Eur. J. Oper. Res. 1994, 76, 486–500. [Google Scholar] [CrossRef]
- Detlof, V.W.; Fischer, G.W. Multi-attribute utility theory: Models and assessment procedures. In Utility, Probability, and Human Decision Making; Springer: Dordrecht, The Netherlands, 1975; pp. 47–85. [Google Scholar]
- Brans, J. A Preference Ranking Organization Method: (The PROMETHEE Method for Multiple Criteria Decision-Making). Manag. Sci. 1985, 31, 647–656. [Google Scholar] [CrossRef] [Green Version]
- Opricovic, S.; Gwo-Hshiung, T. Extended VIKOR method in comparison with outranking methods. Eur. J. Oper. Res. 2007, 178, 514–529. [Google Scholar] [CrossRef]
- Saaty, T. Group decision making and the AHP. In The Analytic Hierarchy Process; Springer: Berlin/Heidelberg, Germany, 1989; pp. 59–67. [Google Scholar]
- Charabi, Y.; Adel, G. PV site suitability analysis using GIS-based spatial fuzzy multi-criteria evaluation. Renew. Energy 2011, 36, 2554–2561. [Google Scholar] [CrossRef]
- Abaei, M. Developing a novel risk-based methodology for multi-criteria decision making in marine renewable energy applications. Renew. Energy 2017, 102, 341–348. [Google Scholar] [CrossRef]
- Mukhamediev, R.I.; Mustakayev, R.; Yakunin, K.; Kiseleva, S.; Gopejenko, V. Multi-Criteria Spatial Decision Making Support System for Renewable Energy Development in Kazakhstan. IEEE Access. 2019, 7, 122275–122288. [Google Scholar] [CrossRef]
- Saaty, T.L. Decision Making for Leaders: The Analytic Hierarchy ProcessfFor Decisions in a Complex World; RWS Publications: Pittsburgh, PA, USA, 1990. [Google Scholar]
- Saati, T.; Andreychikova, O. About measuring the intangible. An approach to relative measurements based on the principal eigenvector of a pairwise comparison matrix. Cloud Sci. 2015, 2, 5–39. (In Russian) [Google Scholar]
- Ospanova, U.; Atanayeva, M.; Akoyeva, I.; Buldybayev, T. Informative features of bias and reliability of electronic Mass Media. Sociologia 2019, 2, 259–270. (In Russian) [Google Scholar]
- Atanayeva, M.; Buldybayev, T.; Ospanova, U.; Akoyeva, I.; Nurumov, K.; Baimakhanbetov, M. Methodology for determining informative features of news texts and checking their significance. Sci. Asp. 2019, 3, 277–296. (In Russian) [Google Scholar]
- Mukhamediev, R.I.; Musabayev, R.R.; Buldybayev, T.; Kuchin, Y.; Symagulov, A.; Ospanova, U.; Yakunin, K.; Murzakhmetov, S.; Sagyndyk, B. Experiments to evaluate mass media based on the thematic model of the text corpus. Cloud Sci. 2020, 7, 87–104. (In Russian) [Google Scholar]
- Yakunin, K. This Repo Presents Data Illustrating Results Obtained by Applying Multi Model Mass Media Assessment (M4a) to a Corpora of News Publication from Kazakhstan Media. Available online: https://github.com/KindYAK/M4A-Data (accessed on 14 September 2020).
- Peters, M.; Ruder, S.; Smith, N. To Tune or Not to Tune? Adapting Pretrained Representations to Diverse Tasks. arXiv 2019, arXiv:1903.05987. [Google Scholar]
- Barakhnin, V.; Kozhemyakina, O.; Muhamedyev, R.; Borzilova, Y.; Yakunin, K. The design of the structure of the software system for processing text document corpus. Bus. Inform. 2019, 13, 60–72. [Google Scholar] [CrossRef]
- Yakunin, K. Media Monitoring System. Available online: https://github.com/KindYAK/NLPMonitor (accessed on 14 September 2020).
- Yakunin, K. Airflow DAGs for NLPMonitor. Available online: https://github.com/KindYAK/NLPMonitor-DAGs (accessed on 14 September 2020).
- Mimno, D.; Wallach, H.; Talley, E.; Leenders, M.; McCallum, A. Optimizing Semantic Coherence in Topic Models. In Proceedings of the 2011 Conference on Empirical Methods in Natural Language Processing, Edinburgh, UK, 27–31 July 2011; pp. 262–272. [Google Scholar]
| Publisher’s Note: MDPI stays neutral with regard to jurisdictional claims in published maps and institutional affiliations. |
© 2020 by the authors. Licensee MDPI, Basel, Switzerland. This article is an open access article distributed under the terms and conditions of the Creative Commons Attribution (CC BY) license (http://creativecommons.org/licenses/by/4.0/).

 ,
, 


