Sentiment Analysis of Social Media via Multimodal Feature Fusion


School of Computer Science and Technology, Qilu University of Technology (Shandong Academy of Sciences), Jinan 250353, China
*
Author to whom correspondence should be addressed.
Symmetry 2020, 12(12), 2010; https://0-doi-org.brum.beds.ac.uk/10.3390/sym12122010
Submission received: 20 November 2020
/
Revised: 28 November 2020
/
Accepted: 30 November 2020
/
Published: 5 December 2020
(This article belongs to the Section Computer)
Abstract
:In recent years, with the popularity of social media, users are increasingly keen to express their feelings and opinions in the form of pictures and text, which makes multimodal data with text and pictures the con tent type with the most growth. Most of the information posted by users on social media has obvious sentimental aspects, and multimodal sentiment analysis has become an important research field. Previous studies on multimodal sentiment analysis have primarily focused on extracting text and image features separately and then combining them for sentiment classification. These studies often ignore the interaction between text and images. Therefore, this paper proposes a new multimodal sentiment analysis model. The model first eliminates noise interference in textual data and extracts more important image features. Then, in the feature-fusion part based on the attention mechanism, the text and images learn the internal features from each other through symmetry. Then the fusion features are applied to sentiment classification tasks. The experimental results on two common multimodal sentiment datasets demonstrate the effectiveness of the proposed model.
1. Introduction
With the increasing popularity of social media, people are increasingly keen to express their views or opinions on social media platforms. In social media, hundreds of millions of data records are generated every day. A large volume of data is in the form of text and image combinations, which constitute a huge volume of multimodal data. Rich sentimental information exists in the multimodal data. The data are helpful to understand people’s attitudes and views on some events by analyzing the sentiment of multimodal data. Multimodal sentiment analysis has great application value in box office predictions, political elections, stock market predictions, and so on. In the graphic data of social media, text and images contain sentimental information, which is different and complementary to each other. Compared with the single-mode data of text or an image, multimodal data contains more information and can better reveal the real feelings of users. However, multimodal sentiment analysis remains a particularly challenging task. First, sentimental information in different modal data is different, so the sentimental feature representation of the modal data must be obtained effectively for sentiment analysis. From the human viewpoint, not all image areas in a picture are related to sentimental expression, and not all words in text data are related to sentiment. Therefore, in feature extraction, we should highlight the sentimental key areas of the image and eliminate the noise interference in the textual data. Second, different modal data must express the underlying features of different dimensions and attributes. In previous studies, the sentiment analysis of single-mode texts primarily used traditional statistical methods, which are highly dependent on the quality of the extracted features [1,2]. For example, Rodger et al. [3] used data envelopment analysis (DEA) as a Word Sense Disambiguation (WSD) tool to automatically identify the appropriate meaning of words in sentences, so as to determine the inherent meaning of voter intentions regarding possible political candidates. The sentiment analysis of single-mode images also depends on the quality of features selected by hand-designed extraction rules. These images often contain redundant sentimental information. With the continuous development of machine learning and deep learning, researchers have developed many new methods for sentiment analysis of multimodal data and have achieved good results [4,5].
Multimodal sentiment analysis is an increasingly important research field, and many researchers have conducted studies in this field. For multimodal sentiment analysis tasks, the core challenge is how to make better use of modal internal information and modal interaction information. The internal information of the mode is information that can be mined and used by a single independent mode, and the interaction between modes provides useful information. The interaction between modes can be determined by the correlation and connection between different modes [6,7]. Determing how to use the interactive information between different modes is also the biggest difference between multimodal tasks and single-modal tasks. Therefore, multimodal affective analysis must determine effective ways to combine the information of each mode. By capturing the similar structure between different modal data, effective information missing in traditional tasks is captured to maximize the fusion of modal information and the interaction between the modes.
However, most of the previous studies cannot effectively use the internal information and interaction information of text and image modes. Xu et al. [8] proposed a deep semantic network for multimodal sentiment analysis. The long short-term memory (LSTM) model of image features combined with an attention mechanism was used to extract keywords, but this only focused on the one-way influence of the image on the text without considering the influence of the text on the image. Xu et al. [9] also proposed a new co-memory network to learn the interaction information between text words and image content, and then applied the obtained fusion features to sentiment classification. However, the coarse-grained attention mechanism of this method can be regarded as using a single attention vector to participate in multiple content types, which may hide some features of the involved content and lead to information loss.
To solve the above problems, this paper proposes a multimodal sentiment classification model based on a fine-grained attention mechanism. First, given the high noise of the textual data, we use the denoising autoencoder to extract features that represent the original text more accurately. Second, the improved variational auto-encoder combined with the attention mechanism is used to extract image features. Then, a fusion model based on the attention mechanism is proposed to learn the modal fusion representation vector of the image and text information interactively. This model can focus on the relevant parts of the text and image, and fuse the most useful information from both.
Our contributions in this paper are summarized as follows:
- We use a denoising autoencoder and improve the variational auto-encoder combined with an attention mechanism (VAE-ATT) to extract text features and image features, respectively, to extract more accurate features representing the original data.
- We propose a new multimodal cross-feature fusion model based on the attention mechanism (CFF-ATT), which can effectively fuse the features of different modes and provide more effective and accurate information for sentiment classification.
Finally, the method was tested on two different standard Twitter datasets. A comparative experiment was conducted, which fully verified the feasibility and superiority of the proposed model in this paper.
The remainder of the article is structured as follows. Section 2 briefly discusses the recent work in the field of multimodal sentiment analysis. Section 3 describes the proposed multimodal sentiment classification model based on the attention mechanism. Section 4 presents and discusses the experimental results of the model on two different Twitter datasets and the comparison experiments. Finally, Section 5 summarizes the paper and proposes future work in multimodal sentiment analysis.
2. Related Work
Traditional sentiment analysis is mostly based on textual data [10]. In recent years, due to the rapid popularization of social media, users can express their views and opinions in different forms such as text, image, audio, video, and so on, which promotes the multimodality of the content uploaded by users on social networking sites. Therefore, multimodal sentiment analysis has become a research hotspot in the fusion of textual and image information. Previous studies have primarily used traditional feature-based classification methods to achieve sentiment classification. Borth et al. [11] extracted 1200 adjective–noun pairs using the machine learning method, combined them as mid-level features of images with original features, and calculated their sentimental scores. Cao et al. [12] used a sentiment dictionary to extract textual features, using adjective–noun pairs (ANP) to extract visual sentiment ontology in images and describing it as its sentimental feature. Finally, the text and image features were weighted and fused, and then sentiment classification was conducted. Poria et al. [13] extracted the sentimental features of text, voice, and video and then spliced them together to input a support vector machine (SVM) classifier for sentiment classification. Wang et al. [14] built a unified cross-media bag-of-words model for text and images, and obtained text and image features through this model. Then, logistic regression, SVM and the Naive Bayes classifier were used to classify these features and make a comparative analysis. Baecchi et al. [15] proposed a new semi-supervised sentiment classification model, CBOW-DA-LR, which expanded the CBOW model, represented text features with a distributed vector, extracted image features with the denoising autoencoder, and classified textual and image-fusion features in an unsupervised and semi-supervised manner.
With the rapid development of machine learning and the deep neural network, multimodal sentiment analysis based on deep learning has made a series of achievements. You et al. [16] proposed a cross-modal consistent regression (CCR) method, which considered that the sentimental tendencies of image, text, and joint features of images and text should be consistent. Therefore, in the process of text and image-feature fusion, the consistency constraint was added to obtain the fusion feature vector, and then sentiment classification was conducted. You et al. [17] proposed a TreeLSTM model using a tree structure combined with a visual attention mechanism. The model analyzed the sentimental polarity of text and images using the internal correlation between the text and image and obtained good results. Chen et al. [18] combined the attention mechanism with SVM and a convolutional neural network (CNN), constructed a text sentiment classification model and image sentiment classification model, and then studied the different effects of various fusion methods on image and text sentiment classification. Yu et al. [19] used CNN to extract text features at the word, phrase, and sentence levels and then fused the text and image features in a feature layer to complete the sentiment classification task. Cai et al. [20] used two independent CNNs to learn the text and image features, and then took them as the input for another CNN to learn the internal relationship between the text and image.
Xu et al. [8] proposed a deep semantic network for multimodal sentiment analysis and extracted keywords with the LSTM model of image features combined with the attention mechanism. Xu et al. [9] also proposed a new co-memory network to learn the interaction information between text words and image content, and then applied the fusion features obtained to sentiment classification. In particular, video can also be regarded as a kind of multimodal data. Poria et al. [21] proposed an analysis framework for video sentiment classification, the model uses multi-core learning (MKL) to fuse video, audio, and text features for classification. Zadeh et al. [22] proposed the tensor fusion method to extract the joint feature representation of video data. This method is used to model single-mode, dual-mode and triple-mode features, and effectively learn the interaction information for each mode.
3. Proposed Model
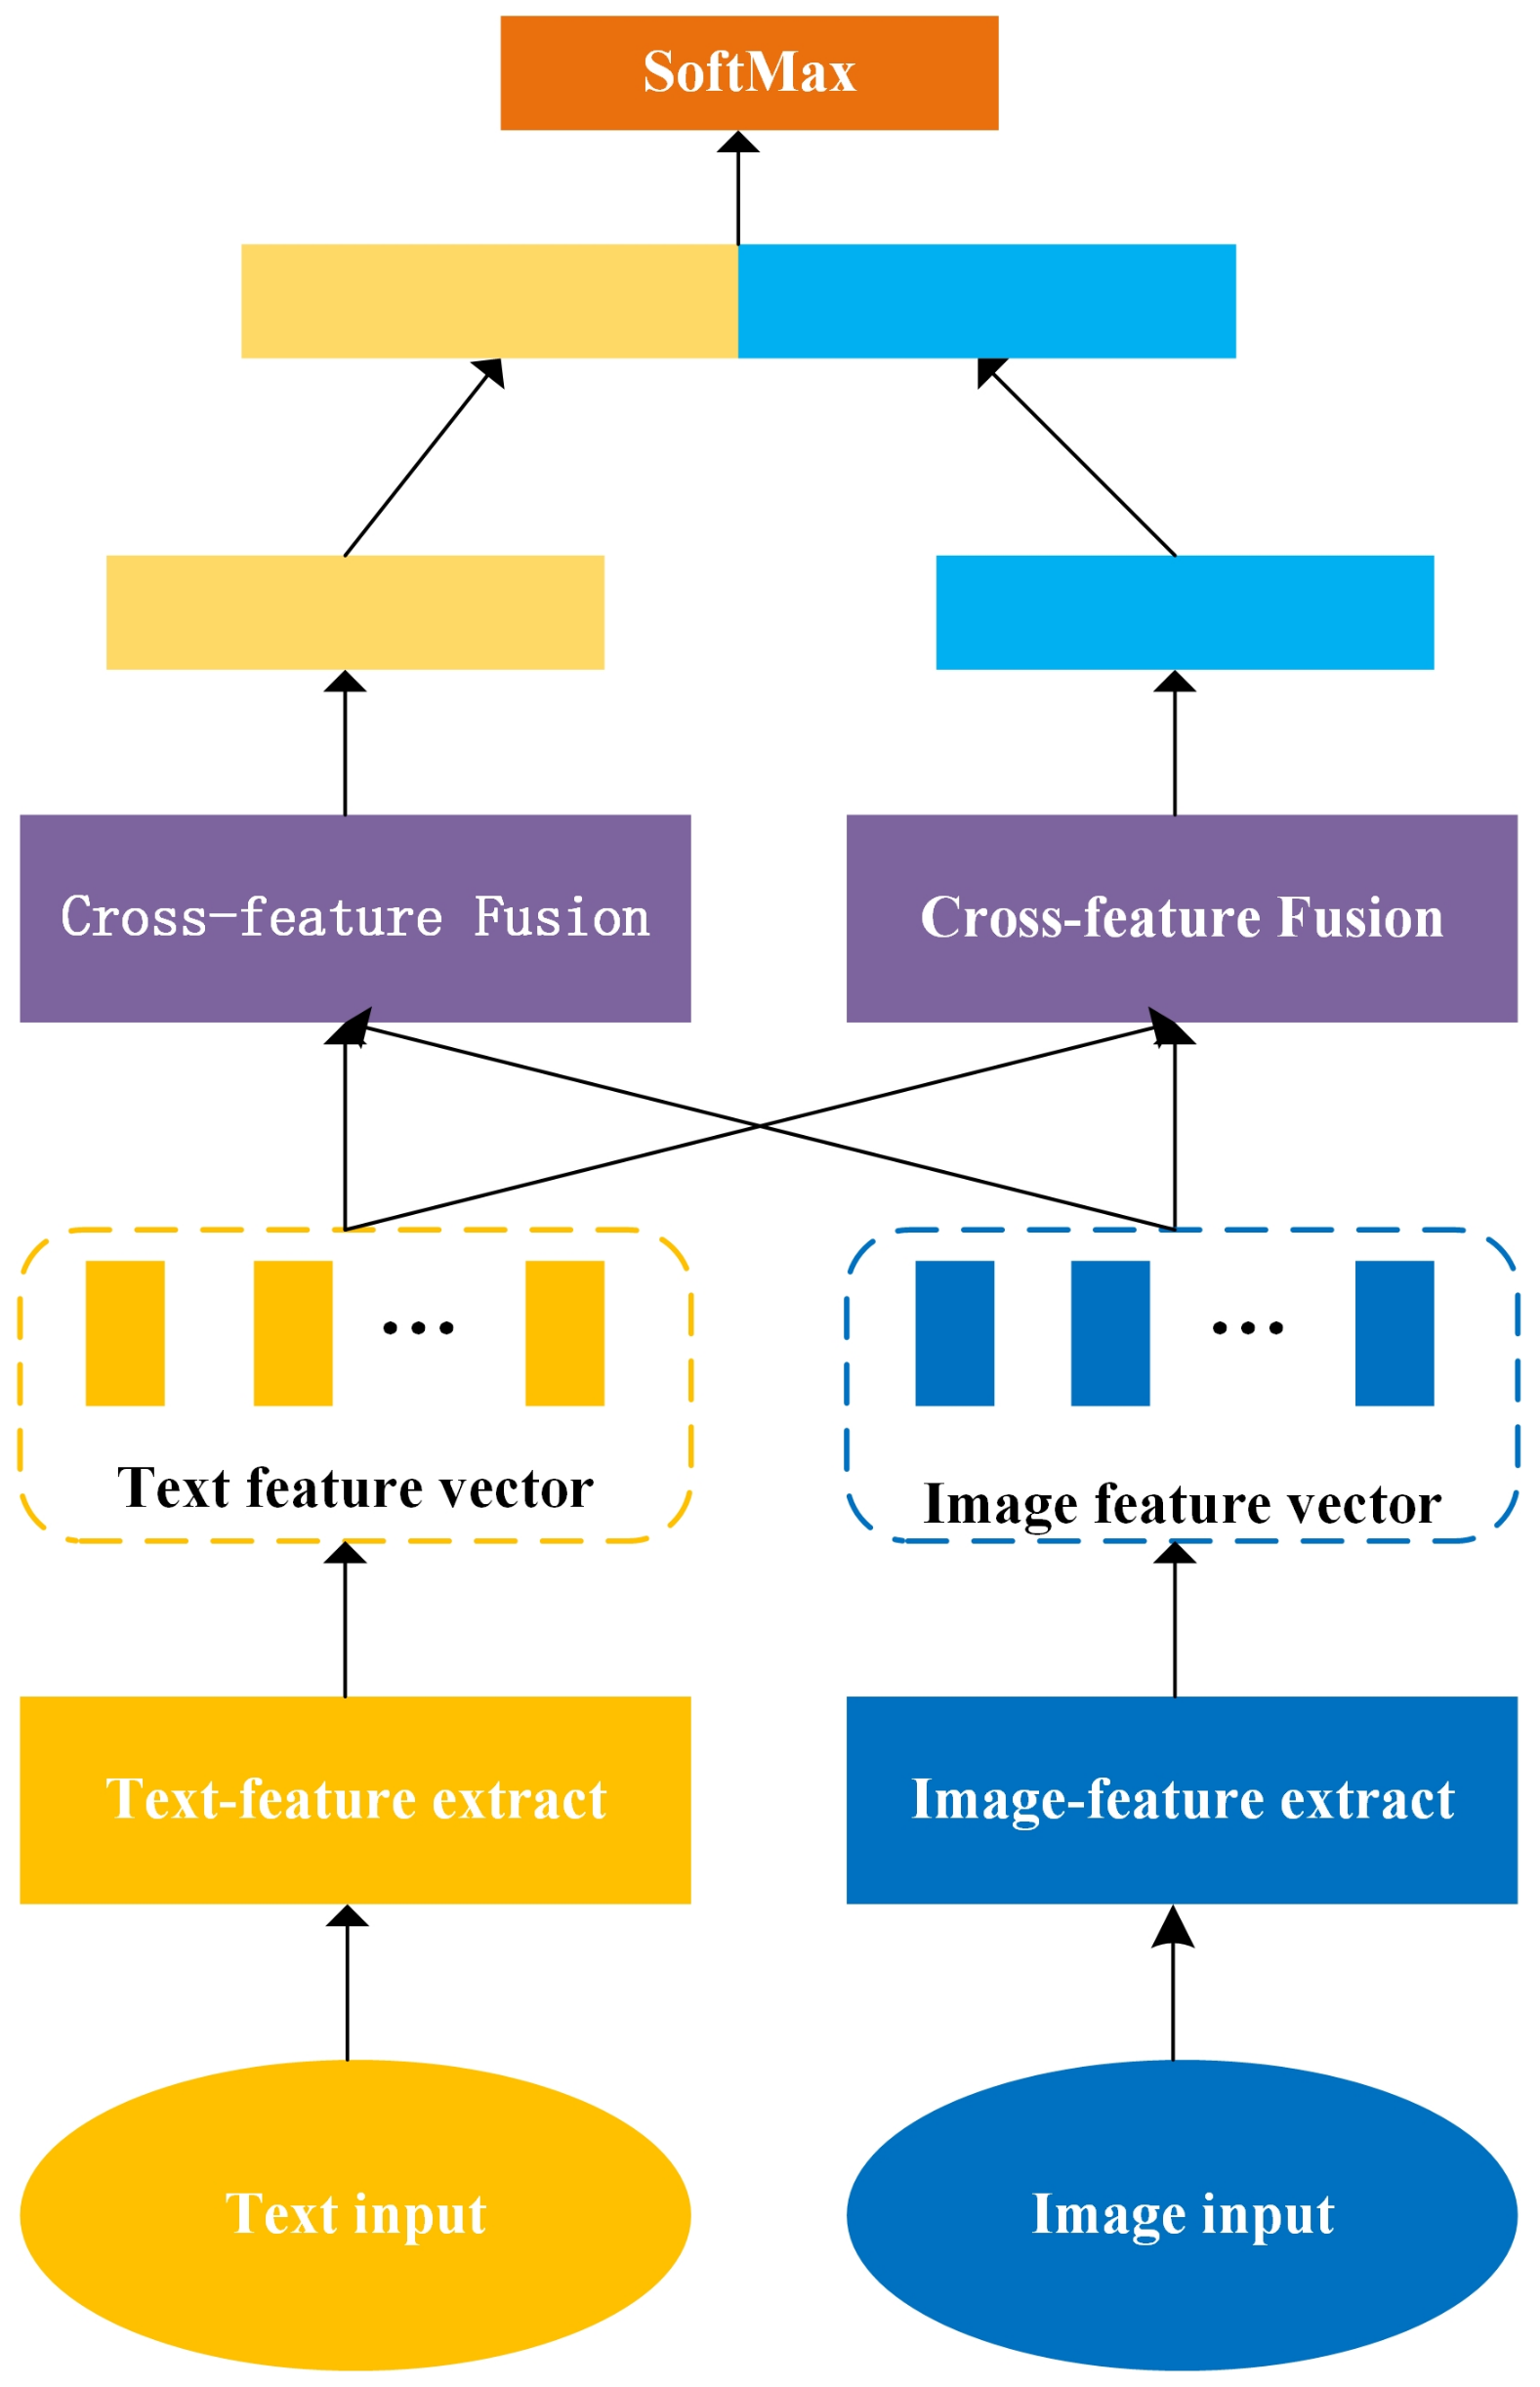
In this section, we introduce our multimodal sentiment analysis model: CFF-ATT. The text and image data in social media often exist at the same time, but sometimes a single text may correspond to multiple images. To facilitate the processing of multimodal data, we consider them to exist symmetrically, that is, we assume that a text corresponds to an image. The proposed model has the same level of processing for text and an image, and finally, fuses their features. This takes full advantage of their symmetry. We set an image–text pair as , where X denotes a single text, , and I denotes a single image. The goal of our model is to correctly predict the sentimental polarity of image–text pairs . The overall framework of the model presented in this paper is shown in Figure 1. The bottom layer of the model is the text-feature extraction module and image-feature extraction module, transforming the text from to , where is the dimension of the word vector. The image was converted to a fixed-size vector. The next layer of the model is a feature fusion module, which contains an attention mechanism that interactively learns shared implicit representations of the text and images to fuse them across modes. At the top of the model is a full connectivity layer, which connects two different main and secondary features from the fusion module as input to complete the sentiment classification.
3.1. Text-Feature Extraction Module
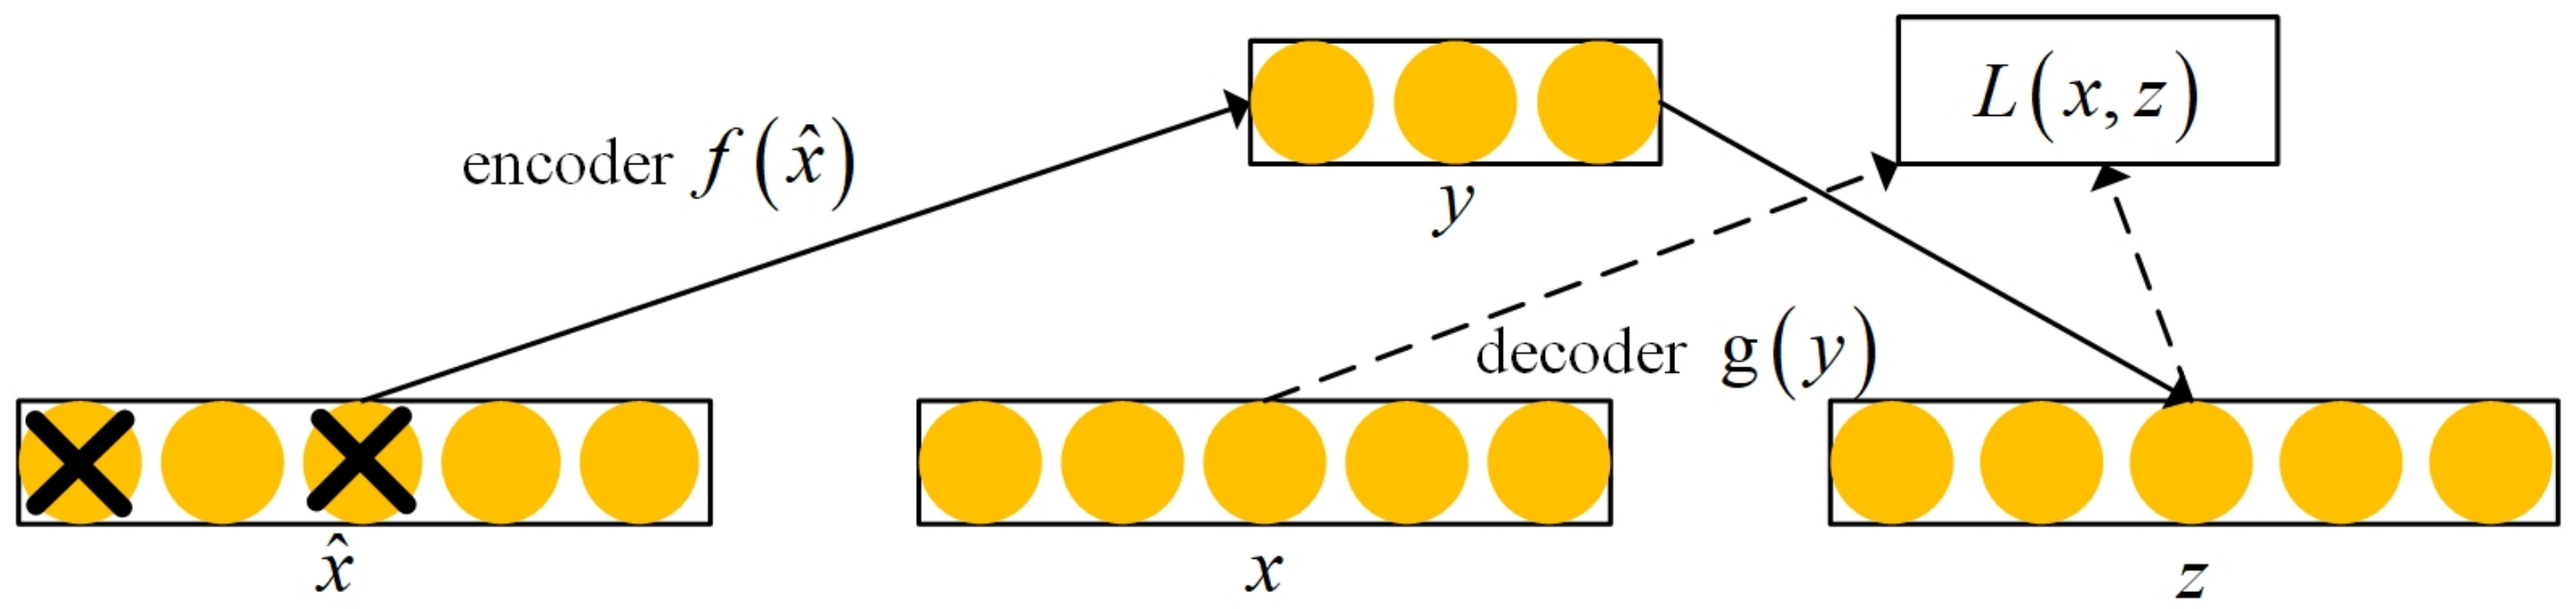
The function of the text-feature extraction layer is to map each word to a low-dimensional vector, also known as word embedding. Considerable noise exists in the textual data of social media, which affects the accuracy of feature extraction. To eliminate noise interference and obtain more robust features, we used a denoising autoencoder (DAE) to extract text features [23]. The denoising autoencoder erases the original input matrix with a certain probability distribution (usually using the binomial distribution), that is, each value is randomly set to zero. In this way, part of the features of some data is missing. The loss of data features makes the original data “impure”. This kind of data “impurity” is similar to adding noise. To remove the noise interference, the encoder conducts a training series and finally achieves the purpose of reproducing the original data, which is the meaning of denoising. Specifically, the vectorized matrix representation of the text was destroyed to obtain the matrix. The damaged matrix was input into the encoder to obtain the encoding, and then a reconstruction matrix was obtained by the reconstruction of the decoder. The reconstructed matrix was compared with the original matrix to obtain the reconstruction error. Then, the parameters of the encoder and decoder were adjusted to minimize the reconstruction error to obtain the final encoding. Taking the encoding features obtained from the upper layer as the input of the lower layer, the coding of the lower layer was obtained using the same method. Finally, the above process was repeated until a specified number of layers was encoded. In short, by constructing a deep network and training a low-dimensional feature code layer by layer, the low-dimensional feature most representative of text was extracted to achieve the feature dimensionality reduction of high-dimensional text data. The structure of the denoising autoencoder is presented in Figure 2.
The encoder was used for dimensionality reduction of high-dimensional data. First, the input vector x was destructed to obtain , and then it was input into the encoder . After the linear transformation and activation function, the implicit encoding result is finally obtained. Decoder was used for the reconstruction process of low-dimensional coding, that is, the hidden layer data were mapped back to the reconstruction, which is expressed as the following functions:
where is a nonlinear activation function, and its expression is:
where is the activation function of the decoder, is the transposition of W. Therefore, we only need to train W. Moreover, and are bias vectors. We used the function in this paper.
The training process for a DAE is to find the minimum reconstruction error of parameter in the training sample set. The expression of the reconstruction error is as follows:
where L is the reconstruction error function. In the experiment, the cross-entropy loss function is always superior to the square deviation loss function. Therefore, we adopted the cross-entropy loss function, and the expression is as follows:
where n is the sample number of the training set, is the i-th input, and is the corresponding data after decoding and reconstruction of the i-th input.
The autocoder was trained by the classical stochastic gradient descent algorithm. In each iteration, the weight matrix was updated by Formula (6):
where is the learning rate, and and adopt the same updating method.
3.2. Image-Feature Extraction Module
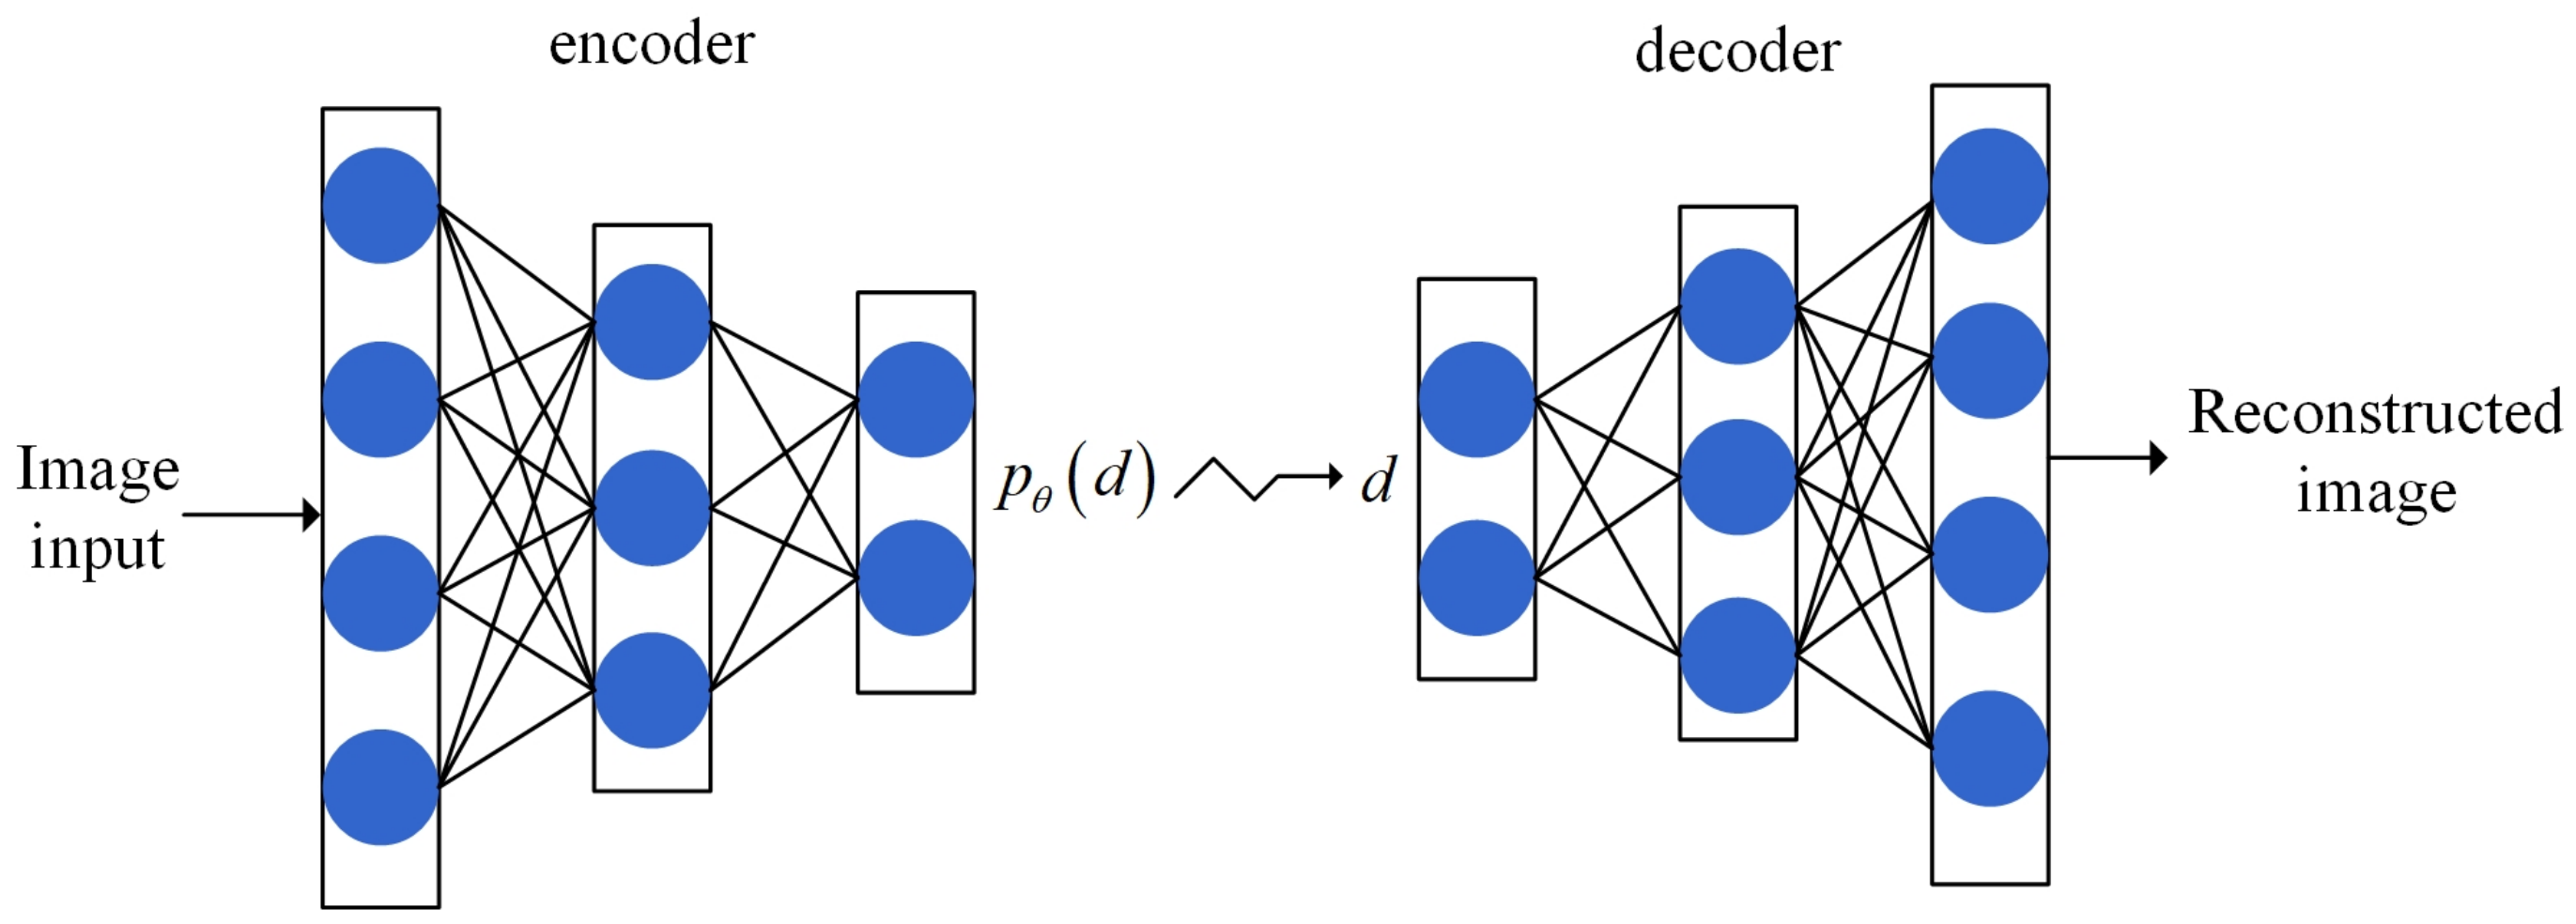
We used an improved attention-based variational auto-encoder (VAE-ATT) to extract image features. Our goal is to automatically learn from the data to map from the raw data to the representation of the data. The deep neural network VAE comprises an encoder and decoder. As displayed in Figure 3, the essence of VAE is to extract the hidden features of data and build a model from hidden features to the generated targets. The encoder extracts the potential reasonable variables from the original data, and then constrains the coding results with Gaussian noise so that they are hidden features that obey the Gaussian distribution. The model constructed by the decoder maps the hidden features to the reconstructed probability distribution, which should be as similar as possible to the original distribution.
The network VAE has two components: the encoder network E with parameter and decoder D with parameter . The loss function is as follows:
where represents the encoder from the data space to the hidden space, and stands for the decoder from the hidden space to data space.
The loss function consists of two parts. The first term of Formula (9) is the reconstruction error, which drives the reconstructed distribution closer to the input distribution . The second term aims to reduce the KL divergence and drive closer to the prior distribution. To achieve this reconstruction, VAE captures the most important characteristic factors that can represent the original input data.
In particular, we experimented with the variant - of VAE [24]; - introduces the understanding of the entanglement prior, assuming that the data are generated based on mutually independent factors. Thus, these factors can be represented by different independent variables in the representation. The prior unentanglement can promote the encoder to learn the concise abstract representation of the data, which can be used in various downstream tasks and improves the sample efficiency.
As shown in Formula (10), - introduces an adjustable super parameter , which can control the balance between the dimension of hidden variables and the reconstruction accuracy. Moreover, the isotropic property of the Gaussian prior also introduces invisible constraints to the posteriori of learning. Changes in can alter the level of learning during training, thus encouraging the learning of different representations. In the experiment, it is necessary to adjust its value to promote the characterization after unwrapping.
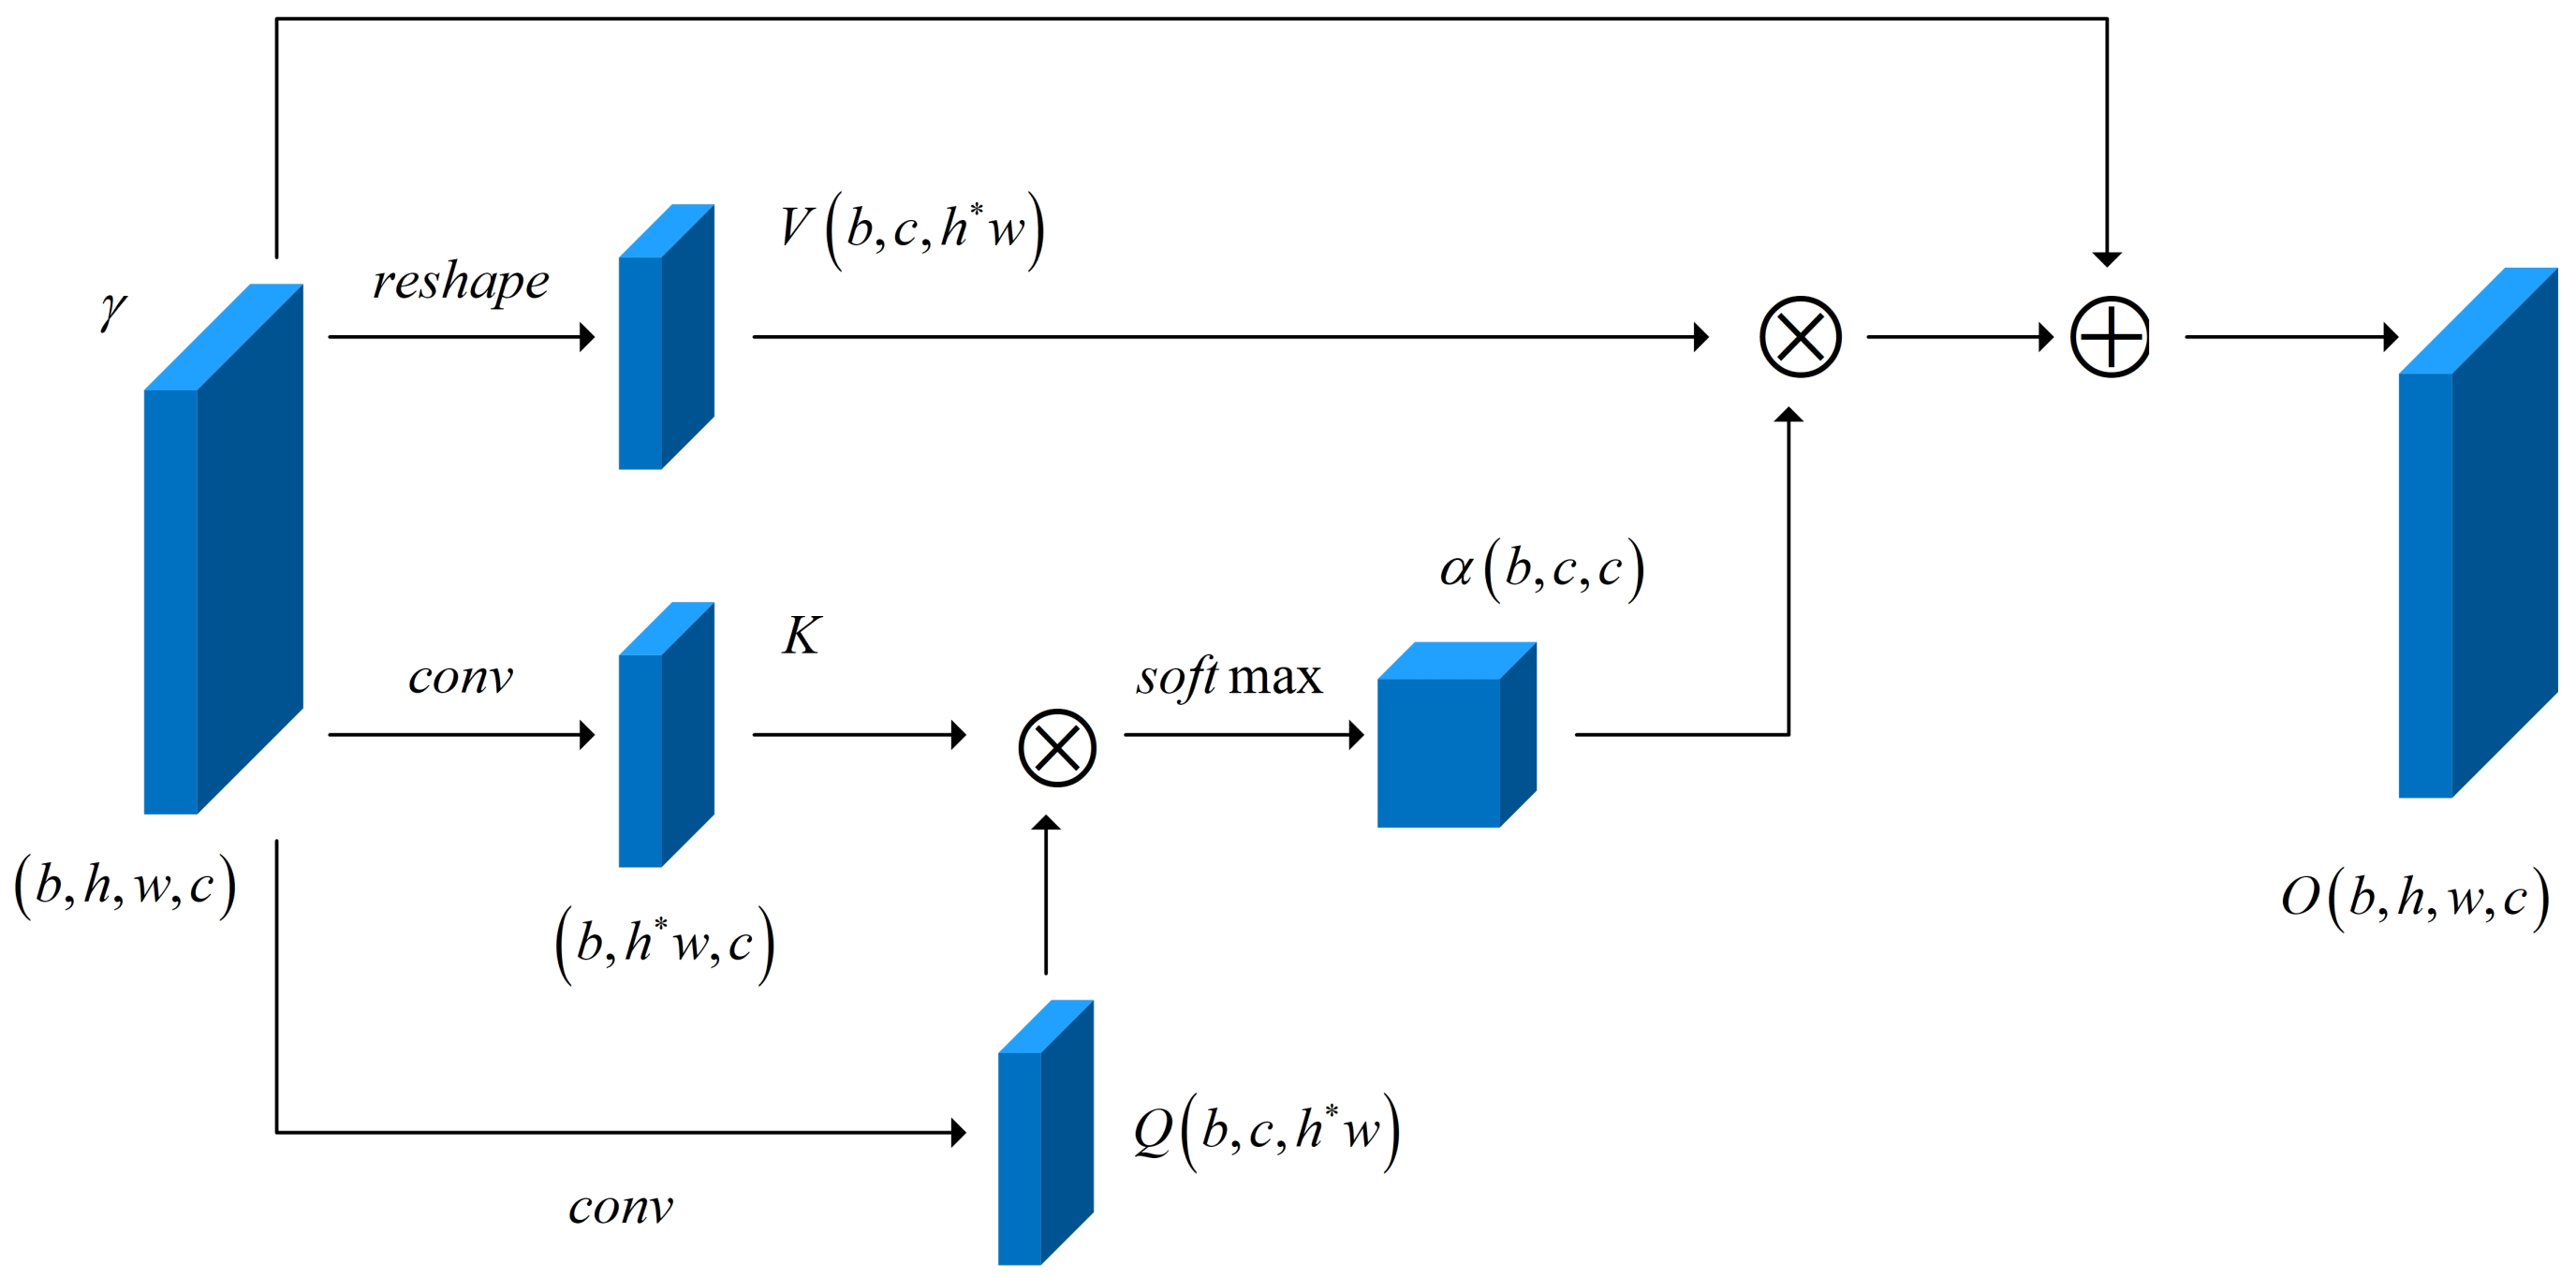
Bengio et al. [25] proposed that the representation suitable for specific tasks and data domains can significantly improve the learning success rate and robustness of the training model. Therefore, we constructed the attention mechanism for the high-level representation of VAE extraction. The self-attention and human visual attention mechanisms play a similar role, screening some key information from a considerable amount of information, and focusing on the important information. Figure 4 illustrates the internal structure of the attention model. This module analyzes the total characteristics of the input data, captures the dependence between channels, and predicts the importance of the channels so that it can selectively emphasize certain features.
The input of the attention module was constructed according to the hidden feature produced by the pretraining encoder, , where b is the batch size, h and w are the length and width of the feature map respectively, and c is the number of channels. As indicated in Formulas (11)–(14), Q and K are new feature graphs obtained by integrating input feature through cross-channel information of a convolution kernel, and the dimensions were transformed into , where . Then, matrix multiplication was performed between Q and K transposed, and finally, the Softmax function was used for normalization to obtain the probability distribution of the attention mechanism with the dimension . The significance of this design is to calculate the influence weight between each channel number of , which can highlight the role of the key feature graph and reduce the influence of redundant features on the overall classification performance.
Finally, the weight coefficient and the original feature were weighted and summed, and then the scale coefficient was adjusted to obtain the highly discriminative feature expression , as follows:
where was initialized to zero, and gradually assigned to a large weight in the learning process.
3.3. Feature-Fusion Module
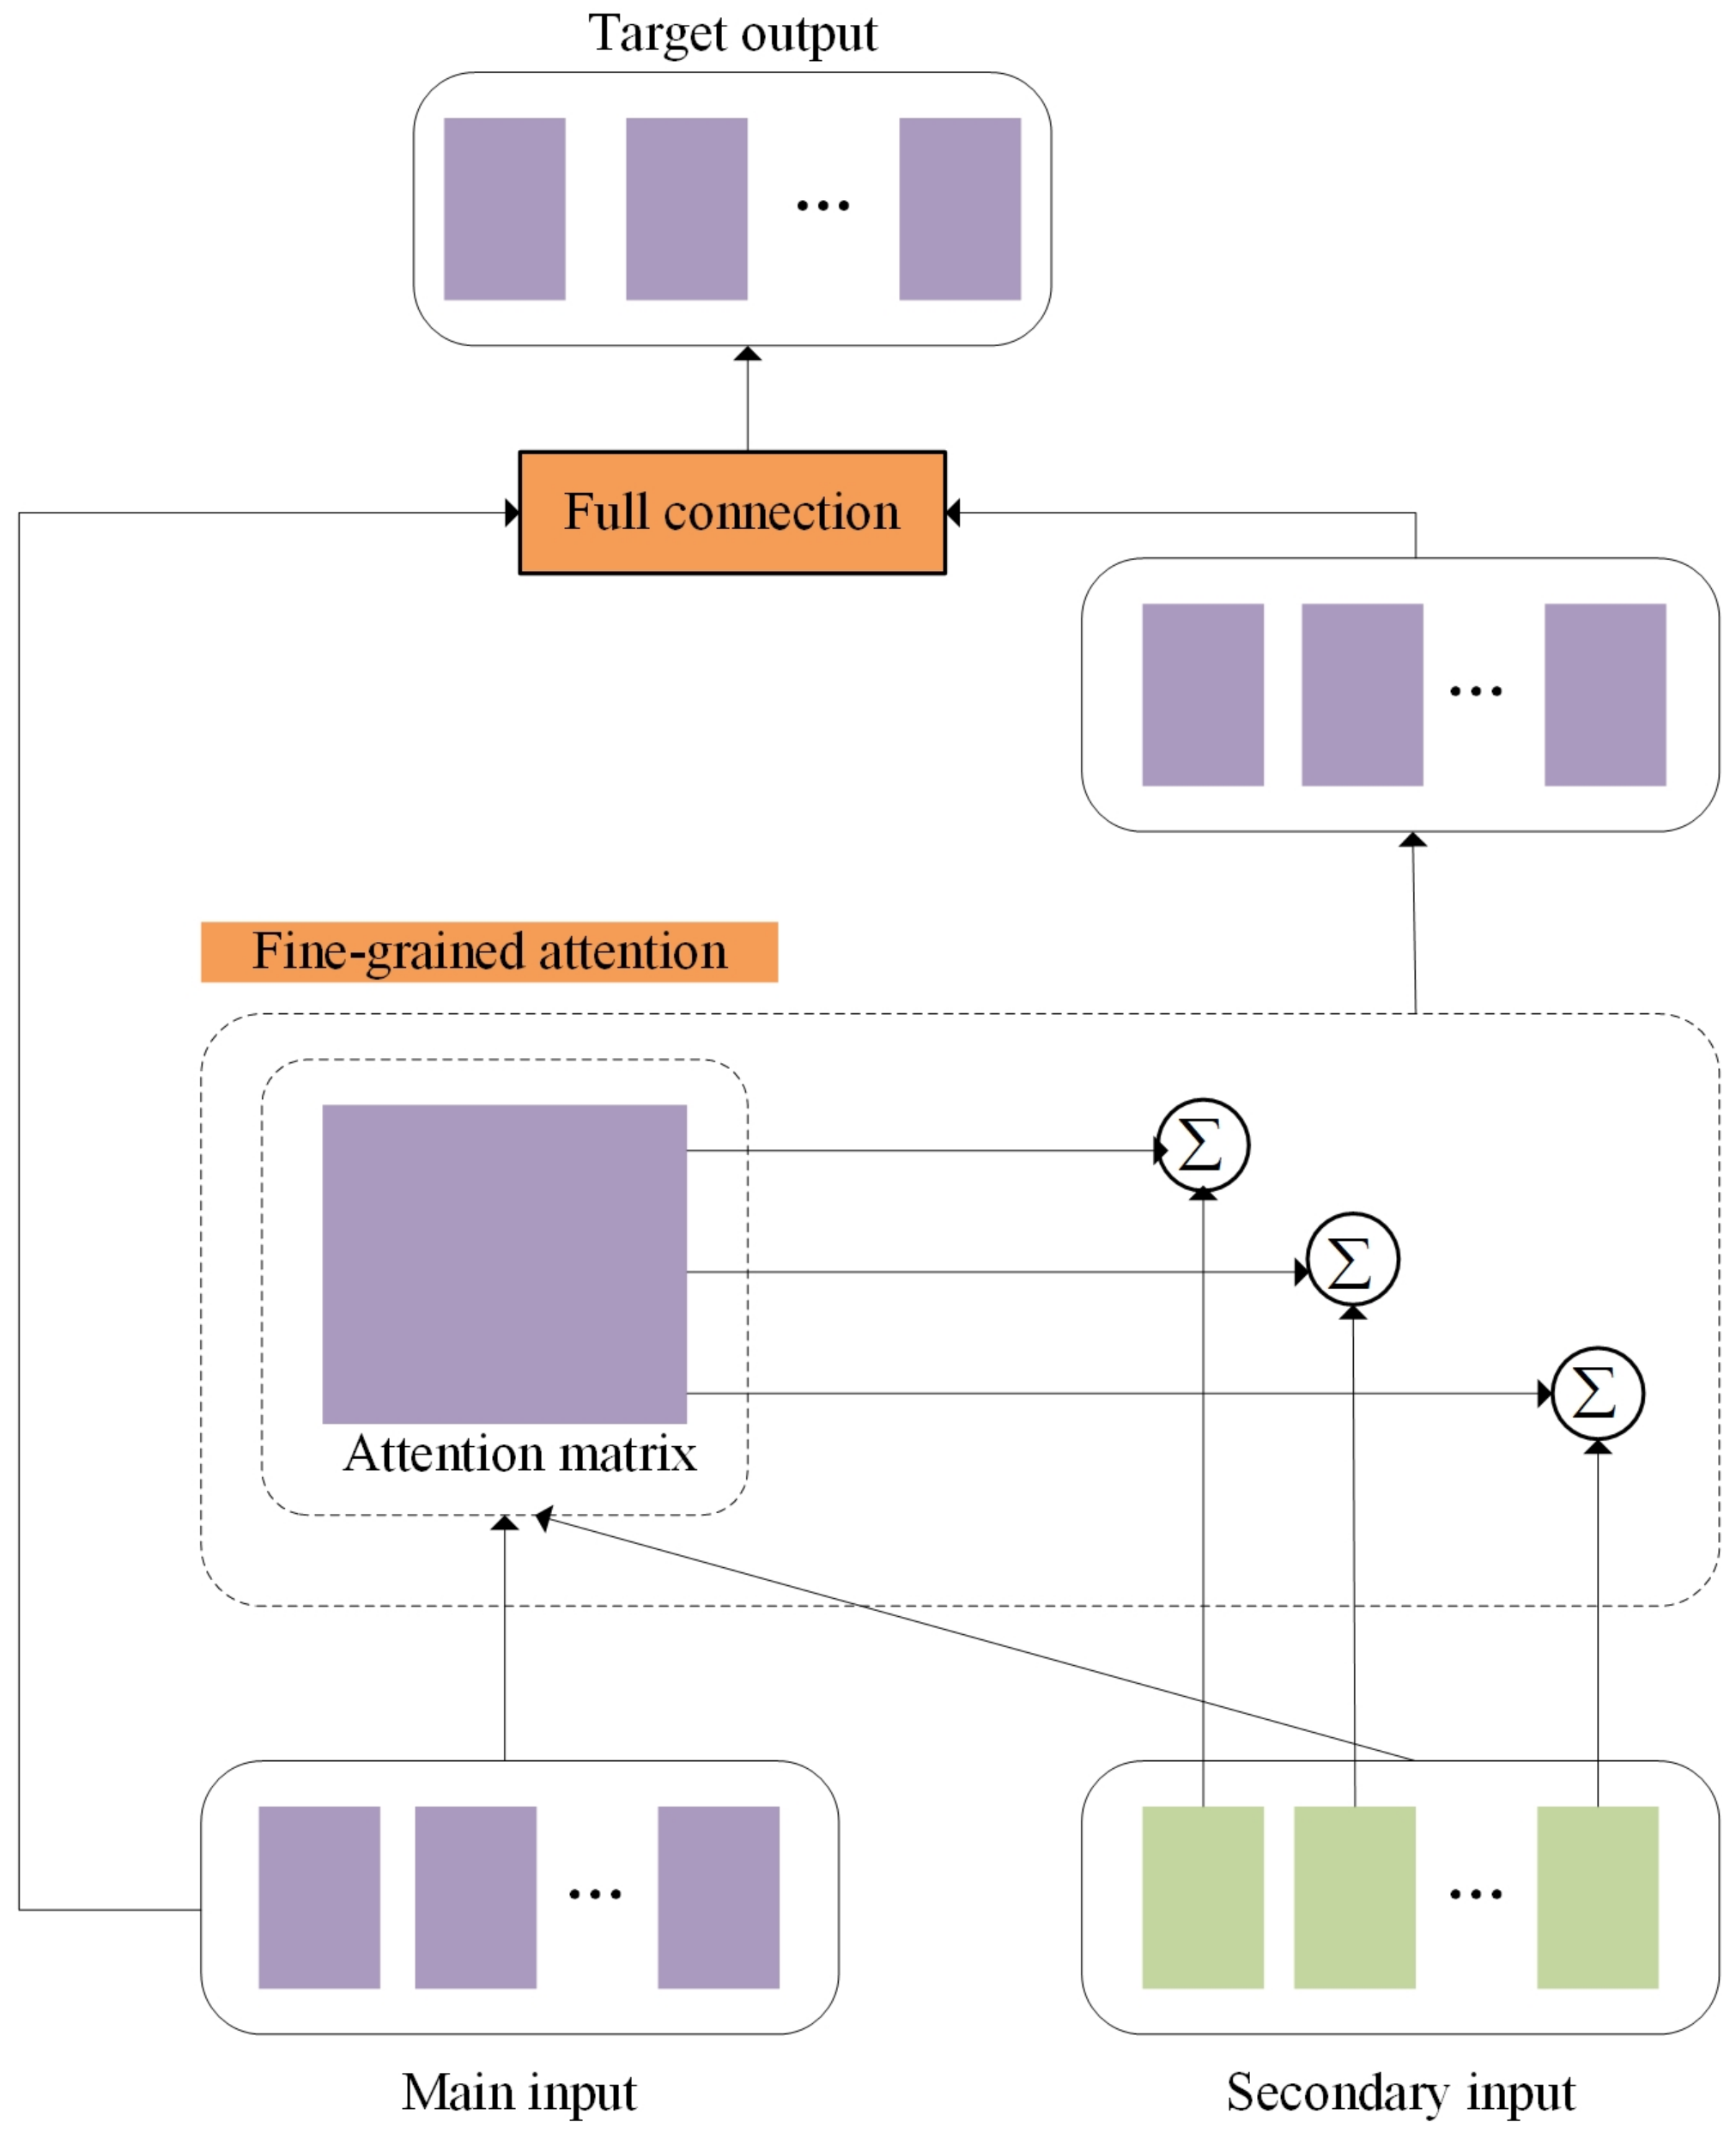
For the features extracted by the text-feature extraction module and image-feature extraction module, we designed a cross-feature-fusion module based on the attention mechanism, CFF-ATT, to fuse them. The details of the feature-fusion module are presented in Figure 5. The output features of the first two modules were taken as the input of the feature fusion module, one of which is the main input and the other is the secondary input. The two input modes were fused to generate the target mode output. Setting the main input as , and secondary input as , we project the main input E and the secondary input G into the same shared vector space:
where , , , and in the above formula are the training parameters, and is the dimension of the shared vector space. We used and to calculate the attention matrix , where represents the correlation between the i-th content of the main input and the i-th content of the secondary input. The attention matrix can be expressed as follows:
To measure the importance of each secondary input to the main input, we used the Softmax function to quantify M:
Then, we obtained the secondary input J based on the attention mechanism:
Finally, the main input E and the attention-based secondary input J were spliced at the full connection layer to obtain the fusion feature :
where , .
3.4. Output Layer
Through the above modules, we obtained the fused features. One part is the feature with the text as the main feature and the image as the auxiliary feature, and the other part is the feature with the image as the main feature and the text as the auxiliary feature. Connecting them, we input the final output layer and used the Softmax classifier for sentiment classification.
4. Experiments and Results
This section discusses the experimental results of our model on two different Twitter datasets and the comparative experiments with other baseline methods. Finally, we make a visual verification of the effect of the attention mechanism on image feature extraction.
4.1. Datasets and Setup
In this experiment, we used MVSA-Single and MVSA-Multiple [26], which are two common multimodal sentiment datasets. The MVSA-Single dataset contains 5129 text-image pairs from Twitter. An annotator annotated each text and image with one of three sentiments (positive, negative, or neutral). The MVSA-Multiple dataset contains 19,600 text-image pairs from Twitter. Unlike the previous dataset, each text–image pair was annotated with one of the three sentiments by three different annotators. Each annotator’s judgment on the text or image was not affected by that of the others.
As for the MVSA-multiple dataset, because each text or image has three sentimental tags, these three sentimental tags may be the same or different, which can affect our judgment of the sentimental polarity of the text or image. Thus, we think that the text or image is meaningful and can only be used if two or more of the three sentimental tags of text or image are the same. In addition, when the two sentimental polarities of a text–image pair reflected by the sentimental tag are the same, it is easy to classify the sentiment. However, in some tweets from these two datasets, the text sentiment polarity and image sentiment polarity were inconsistent, which affected our subsequent sentiment classification task. To obtain more accurate data, we deleted those tweets with one polarity of positive sentiment and another polarity of negative sentiment. For tweets with one polarity of neutral sentiment and one positive (or negative) sentiment, we considered the sentimental polarity to be positive (or negative), that is, we ignored the neutral sentimental label. After processing the dataset using the above method, we obtained the MVSA-Single dataset with 4511 text–image pairs and the MVSA-Multiple dataset with 17,024 text–image pairs. We randomly divided the dataset into training , verification and testing sets according to the ratio of 8:1:1.
4.2. Experimental Parameter Setting
We scaled each image in the dataset to 224 × 224 pixels. The improved variational auto-encoder learns from the original pretraining dataset. In the - training phase, the Adam optimizer was used, and the fixed learning rate was 0.001. The encoder model uses the CNN. Each image outputs 2048 10 × 10 area feature maps. The decoder comprises a deconvolutional neural network. The loss function measures the reconstruction error of the image through cross-entropy, whereas it measures the difference between the distribution of hidden variables and the unit Gaussian distribution through KL divergence. According to the convergence property of the loss function, to obtain randomness and avoid falling into local optimization, the batch size selected in this paper was 128. In the training process, to avoid model overfitting, we also used dropout and early-stopping techniques. We set the shared space size of the feature-fusion module to 100, and its dropout rate was 0.3.
4.3. Baselines
We compared our model with the baseline approaches below on two MVSA datasets.
- SentiBank + SentiStrength [11] extracted 1200 adjective–noun pairs to analyze the features of the image and calculate the sentimental score of the text part.
- CBOW + DA + LR [15] used the skip-gram and denoising autoencoder to learn the internal features of the text and image in an unsupervised and semi-supervised way and then connected them for sentiment classification.
- CNN-Multi [20] used two independent CNNs to extract text and image features, and input these features into another CNN for sentimental classification.
- DNN-LR [19] trained the neural network for text and image, and then extracted their respective features, connectting and inputting them into a logistic regression for sentiment classification.
- MultiSentiNet [8] extracted the deep semantic features of the image, including the visual, object and scene information, and proposed a visual feature-guided attention LSTM model to absorb these text words that are important to sentiment analysis.
- CoMn [9] used the relationship between the image and text and proposed a stacked co-memory network to represent the interaction between the visual and text information iteratively to conduct sentimental analysis.
4.4. Experimental Results
We chose the accuracy rate and F1-score as our experimental evaluation indicators, and the calculation is as follows:
where TP is the number of samples correctly marked as positive, FP is the number of samples incorrectly marked as positive but actually negative, TN is the number of samples correctly marked as negative, and FN is the number of samples incorrectly marked as negative but actually positive.
Table 1 presents the results of comparing our model with other baseline methods on the two MVSA datasets. The experimental results of the baseline method in Table 1 were retrieved from published papers. CoMN(6) represents CoMN with six memory jumps. This is a CoMN model with the best classification effect known in the relevant paper.
As listed in Table 1, the performance of SentiBank + SentiStrength is the worst. This model only used the traditional statistical features to represent the sentimental information of text and images, and failed to extract the most useful internal features of the text and images. Thus, it cannot accurately determine the sentimental polarity of tweets.
Next, CBOW + DA + LR used a denoising autoencoder to generate images. By reducing the image error, CBOW + DA + LR can extract more accurate image features, and combine them with word embedding to complete the sentiment classification task. Therefore, the effect is better than that of SentiBank + SentiStrength.
Moreover, CNN-Multi and DNN-LR used the deep learning neural network to extract text and image features. When the data volume was small, such as in the MVSA-single dataset, their performance was worse than that of CBOW + DA + LR; however, when the data volume was relatively large, such as in the MVSA-multiple dataset, the performance was better than that of CBOW + DA + LR. This demonstrates that these two deep learning models require more training to improve their learning effect.
When processing text and images, MultiSentiNet considered the semantic information of the visual features and highlighted the influence of the image information on the text information. Thus it obtained good experimental results.
In addition, CoMN considered the mutual influence and interactive promotion of text information and image informatio; thus, its experimental results were better than those of MultiSentiNet, which only focuses on the influence of the image information on the text information. However, the attention mechanism in CoMN used a single attention vector to participate in multiple content types, which may lead to information loss.
Our model eliminated noise interference in the textual data and extracted the more important image features. We used the feature-fusion module based on a fine-grained attention mechanism to learn the modal fusion features of the image and text information interactively. Therefore, we obtained better experimental results than CoMN.
4.5. Attention Visualization
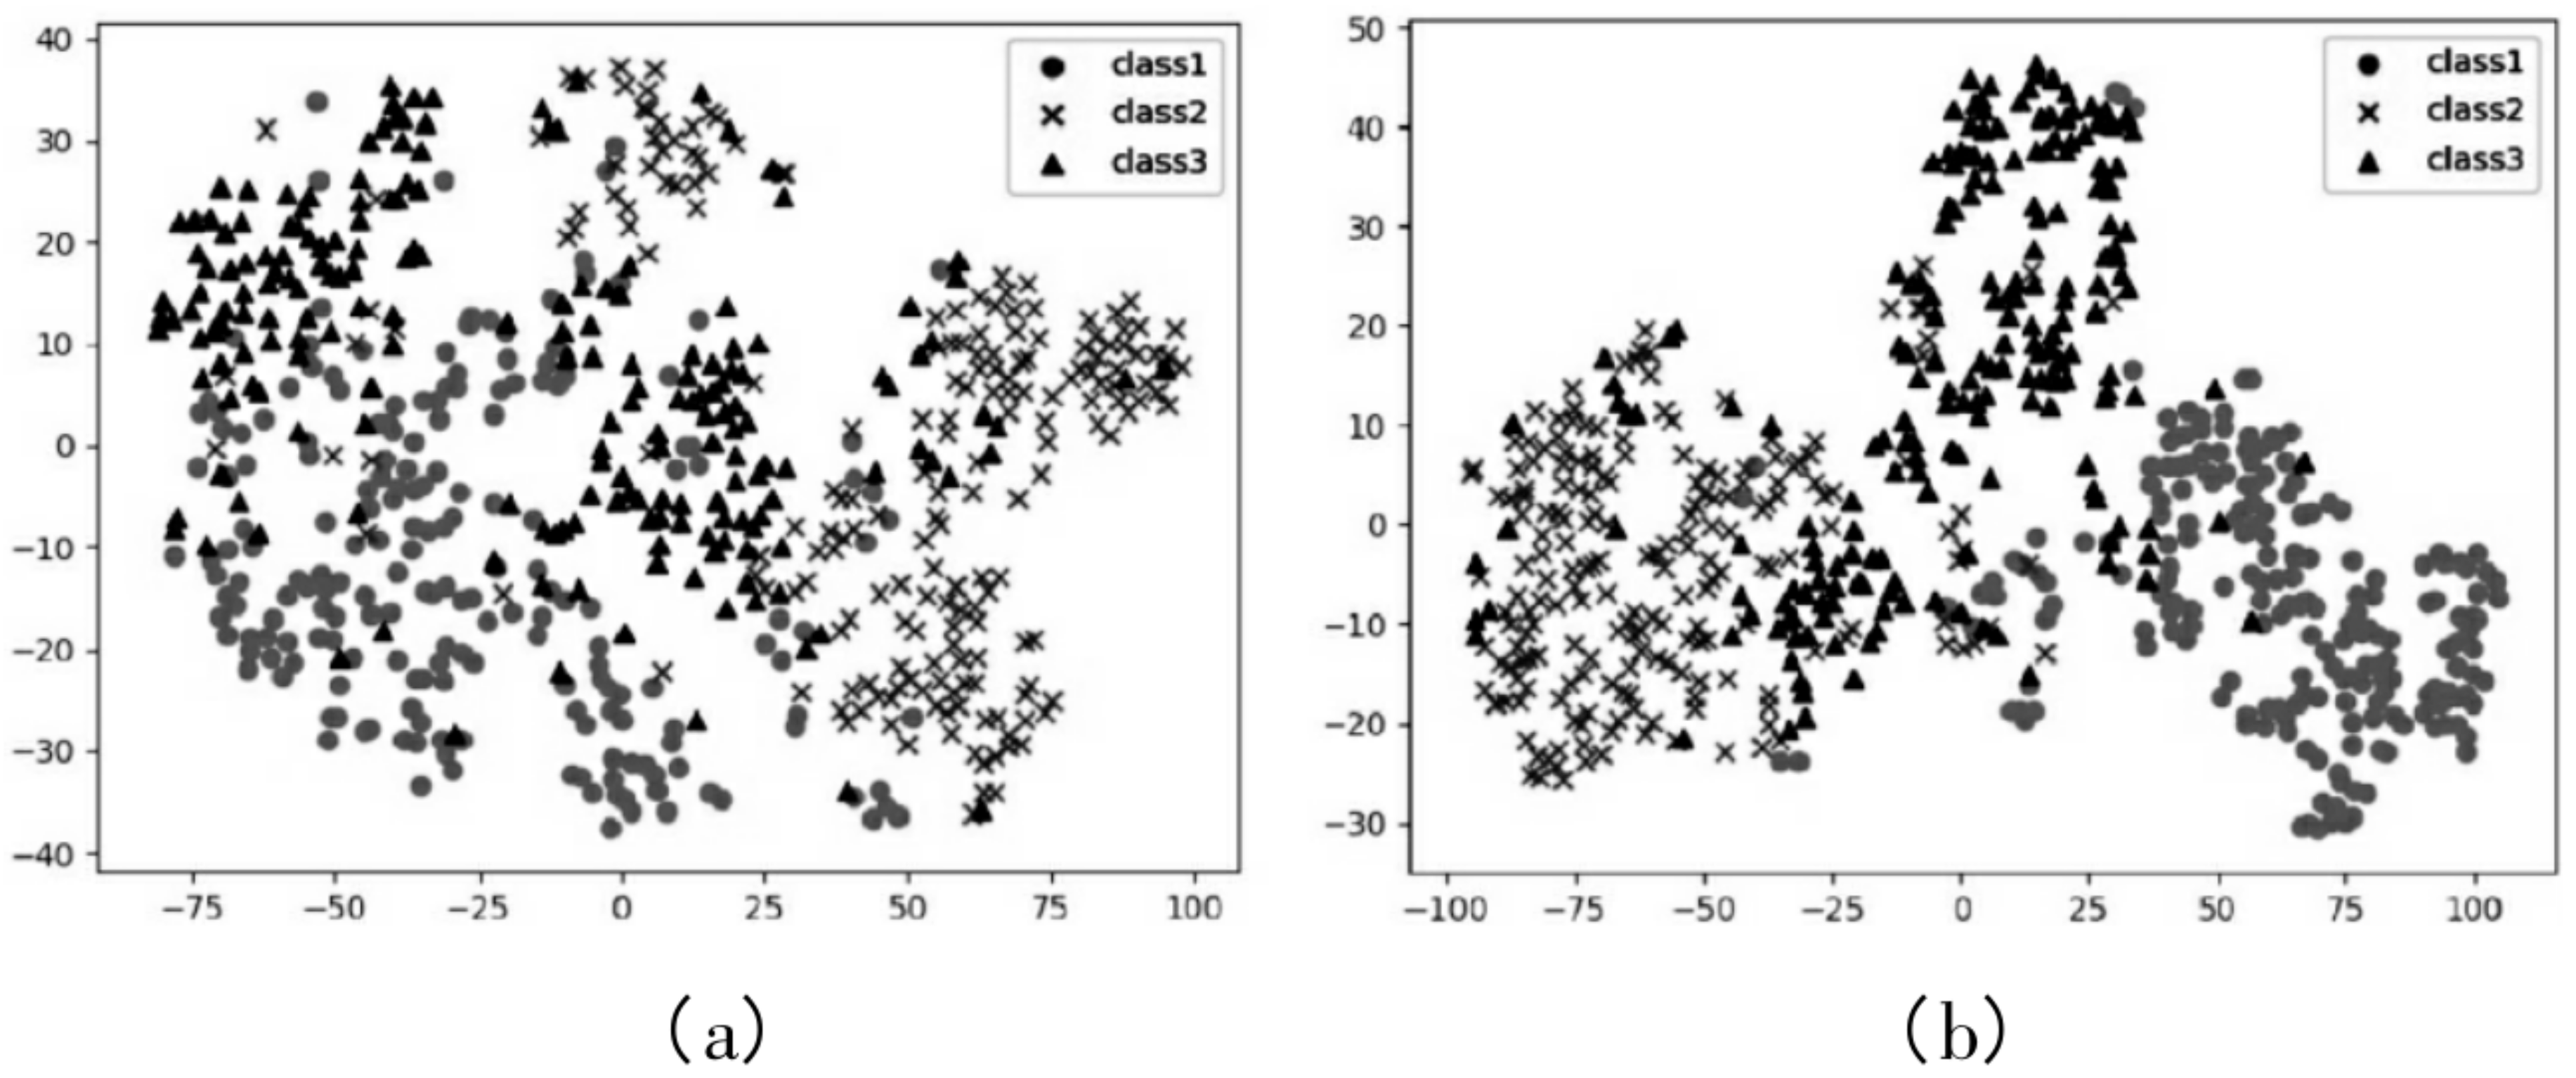
In this section, we visualize the effect of the attention mechanism on image feature extraction. In the experiment, we used the t- algorithm [27] to reduce the dimensionality of the eigenvalues output of the network and projected it into a two-dimensional space. Figure 6 is the feature visualization diagram of part of the testing set in the MVSA-Single dataset experiment. Figure 6a is the early feature of the image feature before it enters the attention module, and Figure 6b is the image feature after it is enhanced by the attention mechanism. To make the image expression clearer, three kinds of images, positive, neutral and negative, were sampled in the t- experiment, and the dimensions of the three kinds of images were reduced. The three marking symbols in Figure 6 represent three different categories. Among them, class1 represents positive sentiment samples, class2 represents negative sentiment samples, and class3 represents neutral sentiment samples. After the improvement of the features of the attention module, the distribution difference between different image categories is more obvious. The standard deviation of intra class distance is reduced, and the standard deviation of class spacing is increased. The experimental results reveal that the attention mechanism can capture key features in advanced features, which is helpful to improve the accuracy of the sentiment classification task.
5. Conclusions and Future Work
Multimodal sentiment analysis of social media is a challenging task. This paper proposes a multimodal sentiment analysis model based on the attention mechanism. This model can effectively eliminate noise interference in the textual data of social media and obtain more accurate text features. Combined with the attention mechanism, the image features that are more important to sentiment classification are extracted. In terms of feature fusion, the attention mechanism is introduced again to fuse features in different modes effectively, which learns the interactive information between text and images. The model used modal internal information and modal interaction information to effectively obtain the sentimental feature representation of multimodal data, accurately judged the sentimental polarity of users’ tweets, better revealed users’ real feelings, and helped us understand people’s attitudes and views towards certain events on social media. The experimental results on two open datasets demonstrate the feasibility and superiority of our proposed model.
In future work, we aim to improve the existing models and methods and study more modalities, including audio, video, and so on. We intend to find more effective methods of feature extraction and feature fusion to provide more effective information for sentiment analysis.
Author Contributions
Conceptualization, K.Z.; methodology, K.Z.; software, J.L.; validation, W.L.; formal analysis, Y.G. and K.Z.; investigation, J.L. and W.L.; resources, Y.G. and J.Z.; data curation, J.Z.; writing—original draft preparation, K.Z.; writing—review and editing, Y.G.; visualization, J.L. and W.L.; supervision, J.Z.; project administration, Y.G. All authors have read and agreed to the published version of the manuscript.
Funding
This work was supported by the National Key R&D Program of China (No. 2019YFB1404700).
Acknowledgments
The authors are very thankful to the editor and referees for their valuable comments and suggestions for improving the paper.
Conflicts of Interest
The authors declare no conflict of interest.
References
- Liu, B. Sentiment analysis and opinion mining. Synth. Lect. Hum. Lang. Technol. 2012, 5, 1–167. [Google Scholar] [CrossRef] [Green Version]
- Wilson, T.; Wiebe, J.; Hoffmann, P. Recognizing contextual polarity in phrase-level sentiment analysis. In Proceedings of the Human Language Technology Conference and Conference on Empirical Methods in Natural Language Processing, Vancouver, BC, Canada, 6–8 October 2005; pp. 347–354. [Google Scholar]
- Rodger, J.; Murrar, A.; Chaudhary, P.; Foley, B.; Balmakhtar, M.; Piper, J. Assessing American Presidential Candidates Using Principles of Ontological Engineering, Word Sense Disambiguation, and Data Envelope Analysis. Management 2020, 20, 22. [Google Scholar]
- Fan, F.; Feng, Y.; Zhao, D. Multi-grained attention network for aspect-level sentiment classification. In Proceedings of the 2018 Conference on Empirical Methods in Natural Language Processing, Brussels, Belgium, 31 October–4 November 2018; pp. 3433–3442. [Google Scholar]
- Li, Z.; Wei, Y.; Zhang, Y.; Yang, Q. Hierarchical attention transfer network for cross-domain sentiment classification. In Proceedings of the Thirty-Second AAAI Conference on Artificial Intelligence, Hilton, New Orleans Riverside, New Orleans, LA, USA, 2–7 February 2018. [Google Scholar]
- Woo, S.; Park, J.; Lee, J.Y.; So Kweon, I. Cbam: Convolutional block attention module. In Proceedings of the European Conference on Computer Vision (ECCV), Munich, Germany, 8–14 September 2018; pp. 3–19. [Google Scholar]
- Li, X.; Xie, H.; Chen, L.; Wang, J.; Deng, X. News impact on stock price return via sentiment analysis. Knowl.-Based Syst. 2014, 69, 14–23. [Google Scholar] [CrossRef]
- Xu, N.; Mao, W. Multisentinet: A deep semantic network for multimodal sentiment analysis. In Proceedings of the 2017 ACM on Conference on Information and Knowledge Management, Singapore, 6–10 November 2017; pp. 2399–2402. [Google Scholar]
- Xu, N.; Mao, W.; Chen, G. A co-memory network for multimodal sentiment analysis. In Proceedings of the 41st International ACM SIGIR Conference on Research & Development in Information Retrieval, Ann Arbor, MI, USA, 8–12 July 2018; pp. 929–932. [Google Scholar]
- Liu, B.; Zhang, L. A survey of opinion mining and sentiment analysis. In Mining Text Data; Springer: Boston, MA, USA, 2012; pp. 415–463. [Google Scholar]
- Borth, D.; Ji, R.; Chen, T.; Breuel, T.; Chang, S.F. Large-scale visual sentiment ontology and detectors using adjective noun pairs. In Proceedings of the 21st ACM International Conference on Multimedia, Barcelona, Spain, 21–25 October 2013; pp. 223–232. [Google Scholar]
- Cao, D.; Ji, R.; Lin, D.; Li, S. A cross-media public sentiment analysis system for microblog. Multimed. Syst. 2016, 22, 479–486. [Google Scholar] [CrossRef]
- Poria, S.; Cambria, E.; Hussain, A.; Huang, G.B. Towards an intelligent framework for multimodal affective data analysis. Neural Netw. 2015, 63, 104–116. [Google Scholar] [CrossRef]
- Wang, M.; Cao, D.; Li, L.; Li, S.; Ji, R. Microblog sentiment analysis based on cross-media bag-of-words model. In Proceedings of the International Conference on Internet Multimedia Computing and Service, Xiamen, China, 10–12 July 2014; pp. 76–80. [Google Scholar]
- Baecchi, C.; Uricchio, T.; Bertini, M.; Del Bimbo, A. A multimodal feature learning approach for sentiment analysis of social network multimedia. Multimed. Tools Appl. 2016, 75, 2507–2525. [Google Scholar] [CrossRef] [Green Version]
- You, Q.; Luo, J.; Jin, H.; Yang, J. Cross-modality consistent regression for joint visual-textual sentiment analysis of social multimedia. In Proceedings of the Ninth ACM International Conference on Web Search and Data Mining, San Francisco, CA USA, 22–25 February 2016; pp. 13–22. [Google Scholar]
- You, Q.; Cao, L.; Jin, H.; Luo, J. Robust visual-textual sentiment analysis: When attention meets tree-structured recursive neural networks. In Proceedings of the 24th ACM International Conference on Multimedia, Amsterdam, The Netherlands, 15–19 October 2016; pp. 1008–1017. [Google Scholar]
- Chen, Y.; Zhang, Z. Research on text sentiment analysis based on CNNs and SVM. In Proceedings of the 2018 13th IEEE Conference on Industrial Electronics and Applications (ICIEA), Wuhan, China, 31 May–2 June 2018; pp. 2731–2734. [Google Scholar]
- Yu, Y.; Lin, H.; Meng, J.; Zhao, Z. Visual and textual sentiment analysis of a microblog using deep convolutional neural networks. Algorithms 2016, 9, 41. [Google Scholar] [CrossRef] [Green Version]
- Cai, G.; Xia, B. Convolutional neural networks for multimedia sentiment analysis. In Natural Language Processing and Chinese Computing; Springer: New York, NY, USA, 2015; pp. 159–167. [Google Scholar]
- Poria, S.; Peng, H.; Hussain, A.; Howard, N.; Cambria, E. Ensemble application of convolutional neural networks and multiple kernel learning for multimodal sentiment analysis. Neurocomputing 2017, 261, 217–230. [Google Scholar] [CrossRef]
- Zadeh, A.; Chen, M.; Poria, S.; Cambria, E.; Morency, L.P. Tensor fusion network for multimodal sentiment analysis. arXiv 2017, arXiv:1707.07250. [Google Scholar]
- Vincent, P.; Larochelle, H.; Bengio, Y.; Manzagol, P.A. Extracting and composing robust features with denoising autoencoders. In Proceedings of the 25th International Conference on Machine Learning, Helsinki, Finland, 5–9 July 2008; pp. 1096–1103. [Google Scholar]
- Higgins, I.; Matthey, L.; Pal, A.; Burgess, C.; Glorot, X.; Botvinick, M.; Mohamed, S.; Lerchner, A. Beta-Vae: Learning Basic Visual Concepts with a Constrained Variational Framework. 2016. Available online: https://openreview.net/forum?id=Sy2fzU9gl (accessed on 19 November 2020).
- Bengio, Y.; Courville, A.; Vincent, P. Representation learning: A review and new perspectives. IEEE Trans. Pattern Anal. Mach. Intell. 2013, 35, 1798–1828. [Google Scholar] [CrossRef]
- Niu, T.; Zhu, S.; Pang, L.; El Saddik, A. Sentiment analysis on multi-view social data. In Proceedings of the International Conference on Multimedia Modeling, Miami, FL, USA, 4–6 January 2016; Springer: New York, NY, USA, 2016; pp. 15–27. [Google Scholar]
- Maaten, L.v.d.; Hinton, G. Visualizing data using t-SNE. J. Mach. Learn. Res. 2008, 9, 2579–2605. [Google Scholar]
Figure 1.
Overall structure of the multimodal sentiment analysis model.

Figure 2.
Structure diagram of the denoising autoencoder.

Figure 3.
How VAE works.

Figure 4.
Network structure of the attention model and its corresponding feature dimensions.

Figure 5.
Feature fusion module.

Figure 6.
Visualization results of image features projected to two-dimensional space by t-. (a) The early feature of the image feature before it enters the attention module. (b) The image feature after it is enhanced by the attention mechanism.
Figure 6.
Visualization results of image features projected to two-dimensional space by t-. (a) The early feature of the image feature before it enters the attention module. (b) The image feature after it is enhanced by the attention mechanism.


Table 1.
Experimental results of baseline method and our model on two MVSA datasets.
| Model | MVSA-Single | MVSA-Muliiple | |||
|---|---|---|---|---|---|
| ACC | F1 | ACC | F1 | ||
| Baselines | SentiBank + SentiStrength | 0.5205 | 0.5008 | 0.6562 | 0.5536 |
| CBOW + DA + LR | 0.6386 | 0.6352 | 0.6422 | 0.6373 | |
| CNN-Multi | 0.6120 | 0.5837 | 0.6630 | 0.6419 | |
| DNN-LR | 0.6142 | 0.6103 | 0.6786 | 0.6633 | |
| MultiSentiNet | 0.6984 | 0.6963 | 0.6886 | 0.6811 | |
| CoMN(6) | 0.7051 | 0.7001 | 0.6892 | 0.6883 | |
| Proposed Model | 0.7144 | 0.7106 | 0.6962 | 0.6935 | |
Publisher’s Note: MDPI stays neutral with regard to jurisdictional claims in published maps and institutional affiliations. |
© 2020 by the authors. Licensee MDPI, Basel, Switzerland. This article is an open access article distributed under the terms and conditions of the Creative Commons Attribution (CC BY) license (http://creativecommons.org/licenses/by/4.0/).
Share and Cite
MDPI and ACS Style
Zhang, K.; Geng, Y.; Zhao, J.; Liu, J.; Li, W. Sentiment Analysis of Social Media via Multimodal Feature Fusion. Symmetry 2020, 12, 2010. https://0-doi-org.brum.beds.ac.uk/10.3390/sym12122010
AMA Style
Zhang K, Geng Y, Zhao J, Liu J, Li W. Sentiment Analysis of Social Media via Multimodal Feature Fusion. Symmetry. 2020; 12(12):2010. https://0-doi-org.brum.beds.ac.uk/10.3390/sym12122010
Chicago/Turabian StyleZhang, Kang, Yushui Geng, Jing Zhao, Jianxin Liu, and Wenxiao Li. 2020. "Sentiment Analysis of Social Media via Multimodal Feature Fusion" Symmetry 12, no. 12: 2010. https://0-doi-org.brum.beds.ac.uk/10.3390/sym12122010
Note that from the first issue of 2016, this journal uses article numbers instead of page numbers. See further details here.