
Functional Connectivity in Developmental Dyslexia during Speed Discrimination


Institute of Neurobiology, Bulgarian Academy of Sciences 1, 1113 Sofia, Bulgaria
*
Author to whom correspondence should be addressed.
Symmetry 2021, 13(5), 749; https://0-doi-org.brum.beds.ac.uk/10.3390/sym13050749
Submission received: 10 April 2021
/
Revised: 21 April 2021
/
Accepted: 23 April 2021
/
Published: 25 April 2021
(This article belongs to the Special Issue Simulation and Modelling in Natural Sciences, Economics, Biomedicine and Engineering II)
Abstract
:A universal signature of developmental dyslexia is literacy acquisition impairments. Besides, dyslexia may be related to deficits in selective spatial attention, in the sensitivity to global visual motion, speed processing, oculomotor coordination, and integration of auditory and visual information. Whether motion-sensitive brain areas of children with dyslexia can recognize different speeds of expanded optic flow and segregate the slow-speed from high-speed contrast of motion was a main question of the study. A combined event-related EEG experiment with optic flow visual stimulation and functional frequency-based graph approach (small-world propensity ϕ) were applied to research the responsiveness of areas, which are sensitive to motion, and also distinguish slow/fast -motion conditions on three groups of children: controls, untrained (pre-D) and trained dyslexics (post-D) with visual intervention programs. Lower ϕ at θ, α, γ1-frequencies (low-speed contrast) for controls than other groups represent that the networks rewire, expressed at β frequencies (both speed contrasts) in the post-D, whose network was most segregated. Functional connectivity nodes have not existed in pre-D at dorsal medial temporal area MT+/V5 (middle, superior temporal gyri), left-hemispheric middle occipital gyrus/visual V2, ventral occipitotemporal (fusiform gyrus/visual V4), ventral intraparietal (supramarginal, angular gyri), derived from θ-frequency network for both conditions. After visual training, compensatory mechanisms appeared to implicate/regain these brain areas in the left hemisphere through plasticity across extended brain networks. Specifically, for high-speed contrast, the nodes were observed in pre-D (θ-frequency) and post-D (β2-frequency) relative to controls in hyperactivity of the right dorsolateral prefrontal cortex, which might account for the attentional network and oculomotor control impairments in developmental dyslexia.
1. Introduction
Developmental dyslexia is defined when poor reading is accompanied by normal intelligence, adequate education, and a lack of other psychologically important factors [1]. Visual processing in developmental dyslexia is the main area of this study. The relatively poor performance of dyslexics in motion processing tests [2,3] is evidence of a major deficiency in visual processing in dyslexia [4,5]. The shortcoming in the differentiation of speeds [6,7] is selectively related to the velocity factor on reading sub-skills, characterized by fluency and reading speed [8], but does not correlate with any measures for their accuracy, presuming that this deficit results neither from dysfunctions in visual nor from those in the attentional system in developmental dyslexia [9]. In this debut, the question still remains whether deficiencies in the processing of visual motion in dyslexia are specific to motion or are resulted from dysfunctions in the visual or attention systems [10]. Various visual attention deficits in dyslexia include difficulties in tasks with serial search [11,12,13], attentional orientation with a peripheral cue [14], or suppressed peripheral visual information [15], selective attention [16,17], and attentional focusing [18]. While reading, the combining of identified letters in the appropriate sequence forms words using the circuits and processes that are involved in visually searching for an object or recognizing it in a crowded field. On another side, the attentional orientation to the letters and temporal sequence of identified letters in words through the feedback to visual brain area V1 proceeds to sequential spatial letter parsing after their consecutive recognition in the ventral stream of the brain [13]. Beyond this atypical activation of some ventral occipitotemporal partitions implicated in recognition of an object, deficiency in visual attention with consequent poor reading can be produced by abnormal activity in structures of the visual dorsal/magnocellular pathway or the feedback to the primary visual cortex [13]. According to the global or local reading processing [19,20], an analytic strategy is used to process local visual information when reading that is preferred for letter processing before literacy. When unfamiliar stimuli are perceived, it is more likely to include the model for global processing [21]. In the subgroups with differed global and local processing is difficulty observed interference patterns [22,23]. According to global and local modes of attention [21], people perceive the patterns through the active global system when broad categories in memory are integrated into existing familiar structures, while through the local attentional system, activating narrow categories helps to perceive details by exclusion other incoming stimuli. Dyslexics with speed reading disability have a greater deficit in global processing, while dyslexics with a deficit in reading accuracy have more difficulties in local processing [24]. In previous research of dyslexia, deficits in the processing of motion are related to a specific type of reading difficulty, underlying in each of them could be disturbed different neurocognitive mechanism [25].
Improving coherent motion detection in children with reading disabilities [26] demonstrated the effectiveness of the intervention on the visual magnocellular system, which also changed the saccadic eye movements, increased their reading accuracy, and reduced visual errors. Faster movements found in discrimination coherent motion improved the accuracy of reading and lexical decision at higher levels of the visual magnocellular system [27]. Discrimination of the figure-ground movement also affected the magnocellular system in children with dyslexia and reduced phonological errors [28,29]. As a result of improved functioning levels of the dorsal stream, fewer phonological errors, improvements in visual time, attention, working memory, progress in reading fluency, and phonological processing were found. The training effects of visual rehabilitation [30] among the unisensory areas are accomplished through the synaptic reorganization and the mechanisms of neuroplasticity. These changes are enhanced through the mechanisms of learning that stimulate multisensory maturation in normally developing children [31], occurring later in development [32]. Training not only stimulates compensation in oculomotor and visual functions [30] but contributes to multisensory integration [33].
In the present study, for evaluation of dyslexia, the evoked brain activity measures flow speed recognition through visual stimuli containing different contrast in the speed components of expanded radial flow. Experimental models on dyslexia suggest that a contribution to dyslexic’s perceptual difficulties have dysfunctions of the secondary visual areas and the koniocellular layer of the lateral geniculate nucleus, which pulvinar function is linked to visuomotor planning and could have an important role in the detection of deficits in visual motion perception in developmental dyslexia [5]. Velocity discrimination tasks assess motion-sensitive information and their performance depends upon the brain activation in middle temporal complex MT+/V5 [34,35]. The locus of the neural mechanism, mediating the visual perception of motion exists along the parietal pathway included the middle temporal area (MT+/V5). Its dysfunction could explain the neuronal causes of various deficits in motion perception at dyslexia [36]. Inability in speed discrimination found in dyslexics [37] has been linked to lesions of the MT/V5+ and the medial superior temporal area MST [38,39]. First, in PET and fMRI studies, the MT/V5+ was found to be involved in visual-spatial attention to multidimensional stimuli speeds [40,41]. These studies also revealed by manipulating the difficulty of speed discrimination, that the harder leads to hyperactivity of the dorsal parietal, lateral occipital, right frontal cortices, and less activity in the dorsal visual cortex V3 [42]. When processing of optical flow can be obtained shift of the image of the object on the retina when an object or observer moves and when the head or eyes move [43]. Maintaining the image of the fovea during the smooth pursuit with a gaze of a moving object, the perception of motion is due to not only of detecting displacements on the retina but also of recognizing whether they are caused by real displacements of an object or performer’ movements or both [43]. A recognition mechanism, through flow parsing [44,45], consists of the split of motion information on a retina into components for self-motion and an object-motion. Neural representation of optic flow encompasses higher-level motion areas in a large network of cingulate, insular, parietal, temporal regions, as middle superior temporal areas MST and MT+ [41,46,47], ventral intraparietal area VIP [48,49], dorsomedial parieto-occipital visual areas V6 and V6A [50,51], precuneus and visual cingulate sulcus [49], parieto-insular vestibular cortex [49], and caudal subdivision of posterior parietal cortex within anterior precuneus [43]. The flow-parsing mechanism involves several visual areas in the dorsal stream, activated by an object movement within the visual field or by displacement of the image on the retina by eye movements [52]. In addition to recognition of a real movement, the V6 and V3A/V7 dorsal areas are in a network, which contributes to the stability of the perception during the pursuit by eyes [53], extracts of self-movement, and provides on moving object information [43]. The motion components, like speed and motion direction, characterize a global (coherent) motion, reflect information for local motion and self-motion, object-motion extraction from retinal one through the brain areas, performing the flow-parsing. Flow field stimuli modulate responses in MT (V5)/MST+, dorsomedial area DM/V6+, included partially the parieto-occipital sulcus (POs), and as a function of flow type and speed sensation, the dorsal V3 area and the lateral posterior precuneus, also involved in the processing of the optic flow speed [54,55]. The dorsomedial parieto-occipital area DM/V6 possesses contour orientation selectivity, sensitive to long continuous lines, and a smaller part of the dorsomedial area is sensitive to the direction of pattern motion compared to the MT area [50]. The self-motion in relation to the surroundings is analyzed in V6 and the individual object motions in relation to the scene in the MT area [50]. Recently, a subdivision of the V6 region, responsive to flows with wide angles, has been found, containing a distinct fovea representation and a large representation of the visual periphery [56] with rostral feedforward connection to the cortex between the parietal and occipital lobes, which in turn, is directly connected to the frontal regions responsible for hand movement control, including also the premotor cortex [57].
This study hypothesizes that children with developmental dyslexia (DD) exhibit an atypical hierarchy of visual processing, which is not specific to certain stimuli and characterized by atypical activation in the early visual cortices, not limited only to the processing of visual motion components. The children with DD may show instability in dorsal cortical sequence overlapped partially the magnocellular geniculate cortical and the ventral visual pathways where the dyslexic children could show hyper-/or hypoactivation in early visual cortices for slow/or high-speed flow stimuli. The main aim is to investigate whether and how the motion-sensitive areas (V5/MT, MT/MST+, V3A/V7, and V6, parietal areas) in children with dyslexia can segregate these types of low/high-speed differences and whether the altered hierarchy of visual processing in the dorsal/ventral stream is visual specific to certain stimuli or not. Also, the study will be focused on how the visual remediation programs can affect the functional visual network in developmental dyslexia comparing with those of typical readers and the dyslexics before visual training.
2. Materials and Methods
2.1. Participants
Children with developmental dyslexia were included in a long-term study and repeatedly monitored in the schools. Dyslexics underwent visual training in a follow-up study [58] and were observed for neuronal changes before producing good reading skills as a result of training. Twenty-five dyslexic children (15 girls; 8–9 years old) and twenty-one age-matched controls (10 girls) participated in an electrophysiological study. The parents and their children agreed to participate in an EEG study after signing an informed consent according to the Helsinki Declaration. The research was approved by the Ethics Committee of Institute of Neurobiology and Institute for Population and Human Studies, BAS (No. 41/12-07-2019), and the Ministry of Education and Science (No. 09-69/28-03-2017). The schoolchildren pass through neuropsychological tests [59]. Psychological test battery DDE-2 was applied to examine developmental dyslexia [60,61]. Psychometric tests were used to assess reading, writing skills and phonological awareness [62]. For the children with learning difficulties, not only the Raven test for nonverbal intelligence “Progressive Matrices” [63] but also the Girolami–Boulinier test for non-verbal perception “Differently Oriented Marks” [64,65] was applied.
2.2. Experimental Paradigm
This visual motion paradigm was radially moving flow fields, the expansion of each appears in pair with a referent speed and a different speed. The duration of each stimulus (flow) in a pair was relatively short 300 ms with abrupt onset/offset and an interval of 500 ms between two compared stimuli in a pair. Every pair set was interleaved with a pseudo-random gap to 1.2–2.5 s between them, so the bias of the neural response is minimized due to the brisk on-off switch of the flows. The stimulus duration of 300 ms was sufficient to achieve both the strong reaction to visual stimulus and to reduce spontaneous eye movements during a stimulus presentation. There were no constraints on maintaining fixation while viewing flows to have a more natural visual experience as possible. The approach was a classical formulation of flow fields with more explicitly denoising of surfaces, boundaries, and the flow field motion over time by median filtering [66]. To improving accuracy, a median filtering step applies after every warping step within coarse to fine estimation in the incremental process of flow. The algorithm with first ranks in both endpoint and angular errors optimizes its objectives through a medium step of filtering. The flow is regulated in a big spatial neighborhood adaptively in a further expanding region. The filter is used between the values in the flow intermediately during the warping on all pixels. Fewer iterations are applied without reusing the results of sorting adjacent pixels. This procedure significantly reduces computational costs. There is a small loss of performance on small-scale motion sequences. Two terms are combined for small, fast-moving objects. The permanent term is about some constant property of the image. An expected variability of the flow in the image at large displacement is modeled by a spatial term. A set of parameters as speed and direction were estimated from the movie frames with the assumption that the neighboring blocks share a similar motion since the motion in a frame is coherent [67].
The requirement in speed discrimination was to identify a faster extended optical flow in two successive stimuli. In the fine velocity discrimination, the velocity discrimination stimuli in the pair moved at 4.5°/s vs. a reference speed of 4.0°/s. In the coarse condition, the velocity discrimination stimuli moved at 5.0°/s vs. the reference speed, defined in a previous psychophysical procedure [9,68,69]. Speed identification is one particular instance of speed discrimination. The second term in the couple after the referent one is used for two types of speed discriminations. The speed differences were 0.5 and 1 to the reference. The task was performed in a darkened room. The presentation of white optical flows was centrally in the visual field on a black screen (Alienware 17.3-inch FHD with resolution 1920 by 1080 pixels with a pixel pitch of 0.1989 mm, 60 Hz refresh rate). Generation of stimuli was performed by in-house development Matlab script (Mathworks, Inc., Natick, MA, USA) on NVIDIA GeForce GTX 1080 graphics card. All stimuli were expanded radial optic flows [67] with a circular eccentricity of 14° from the fixation point with an average luminance of 50 cd/m2. The viewing was binocular at a distance of 57 cm to the screen. In the velocity discrimination, the speed was judged from children by a left or right response key for fast speed than a reference or slow. The children respond after the second stimulus-off with the right thumb each time when they see flow with similar velocity to the reference one. They press another button with the left thumb each time when a faster flow appears after the reference one in the pair. As their attention is kept high during the experiment, a period of 500 ms after the second flow-off is included in the analysis. For the reaction time, all response times that were less than 0.100 s and more than 3.0 s were excluded as outliers. The duration of each trial was restricted to 800 ms with trail onset at the second flow in the pair, including a period after target off. For each condition, 30 different trials were included, a total of 60 trials.
2.3. EEG Signal Pre-Processing
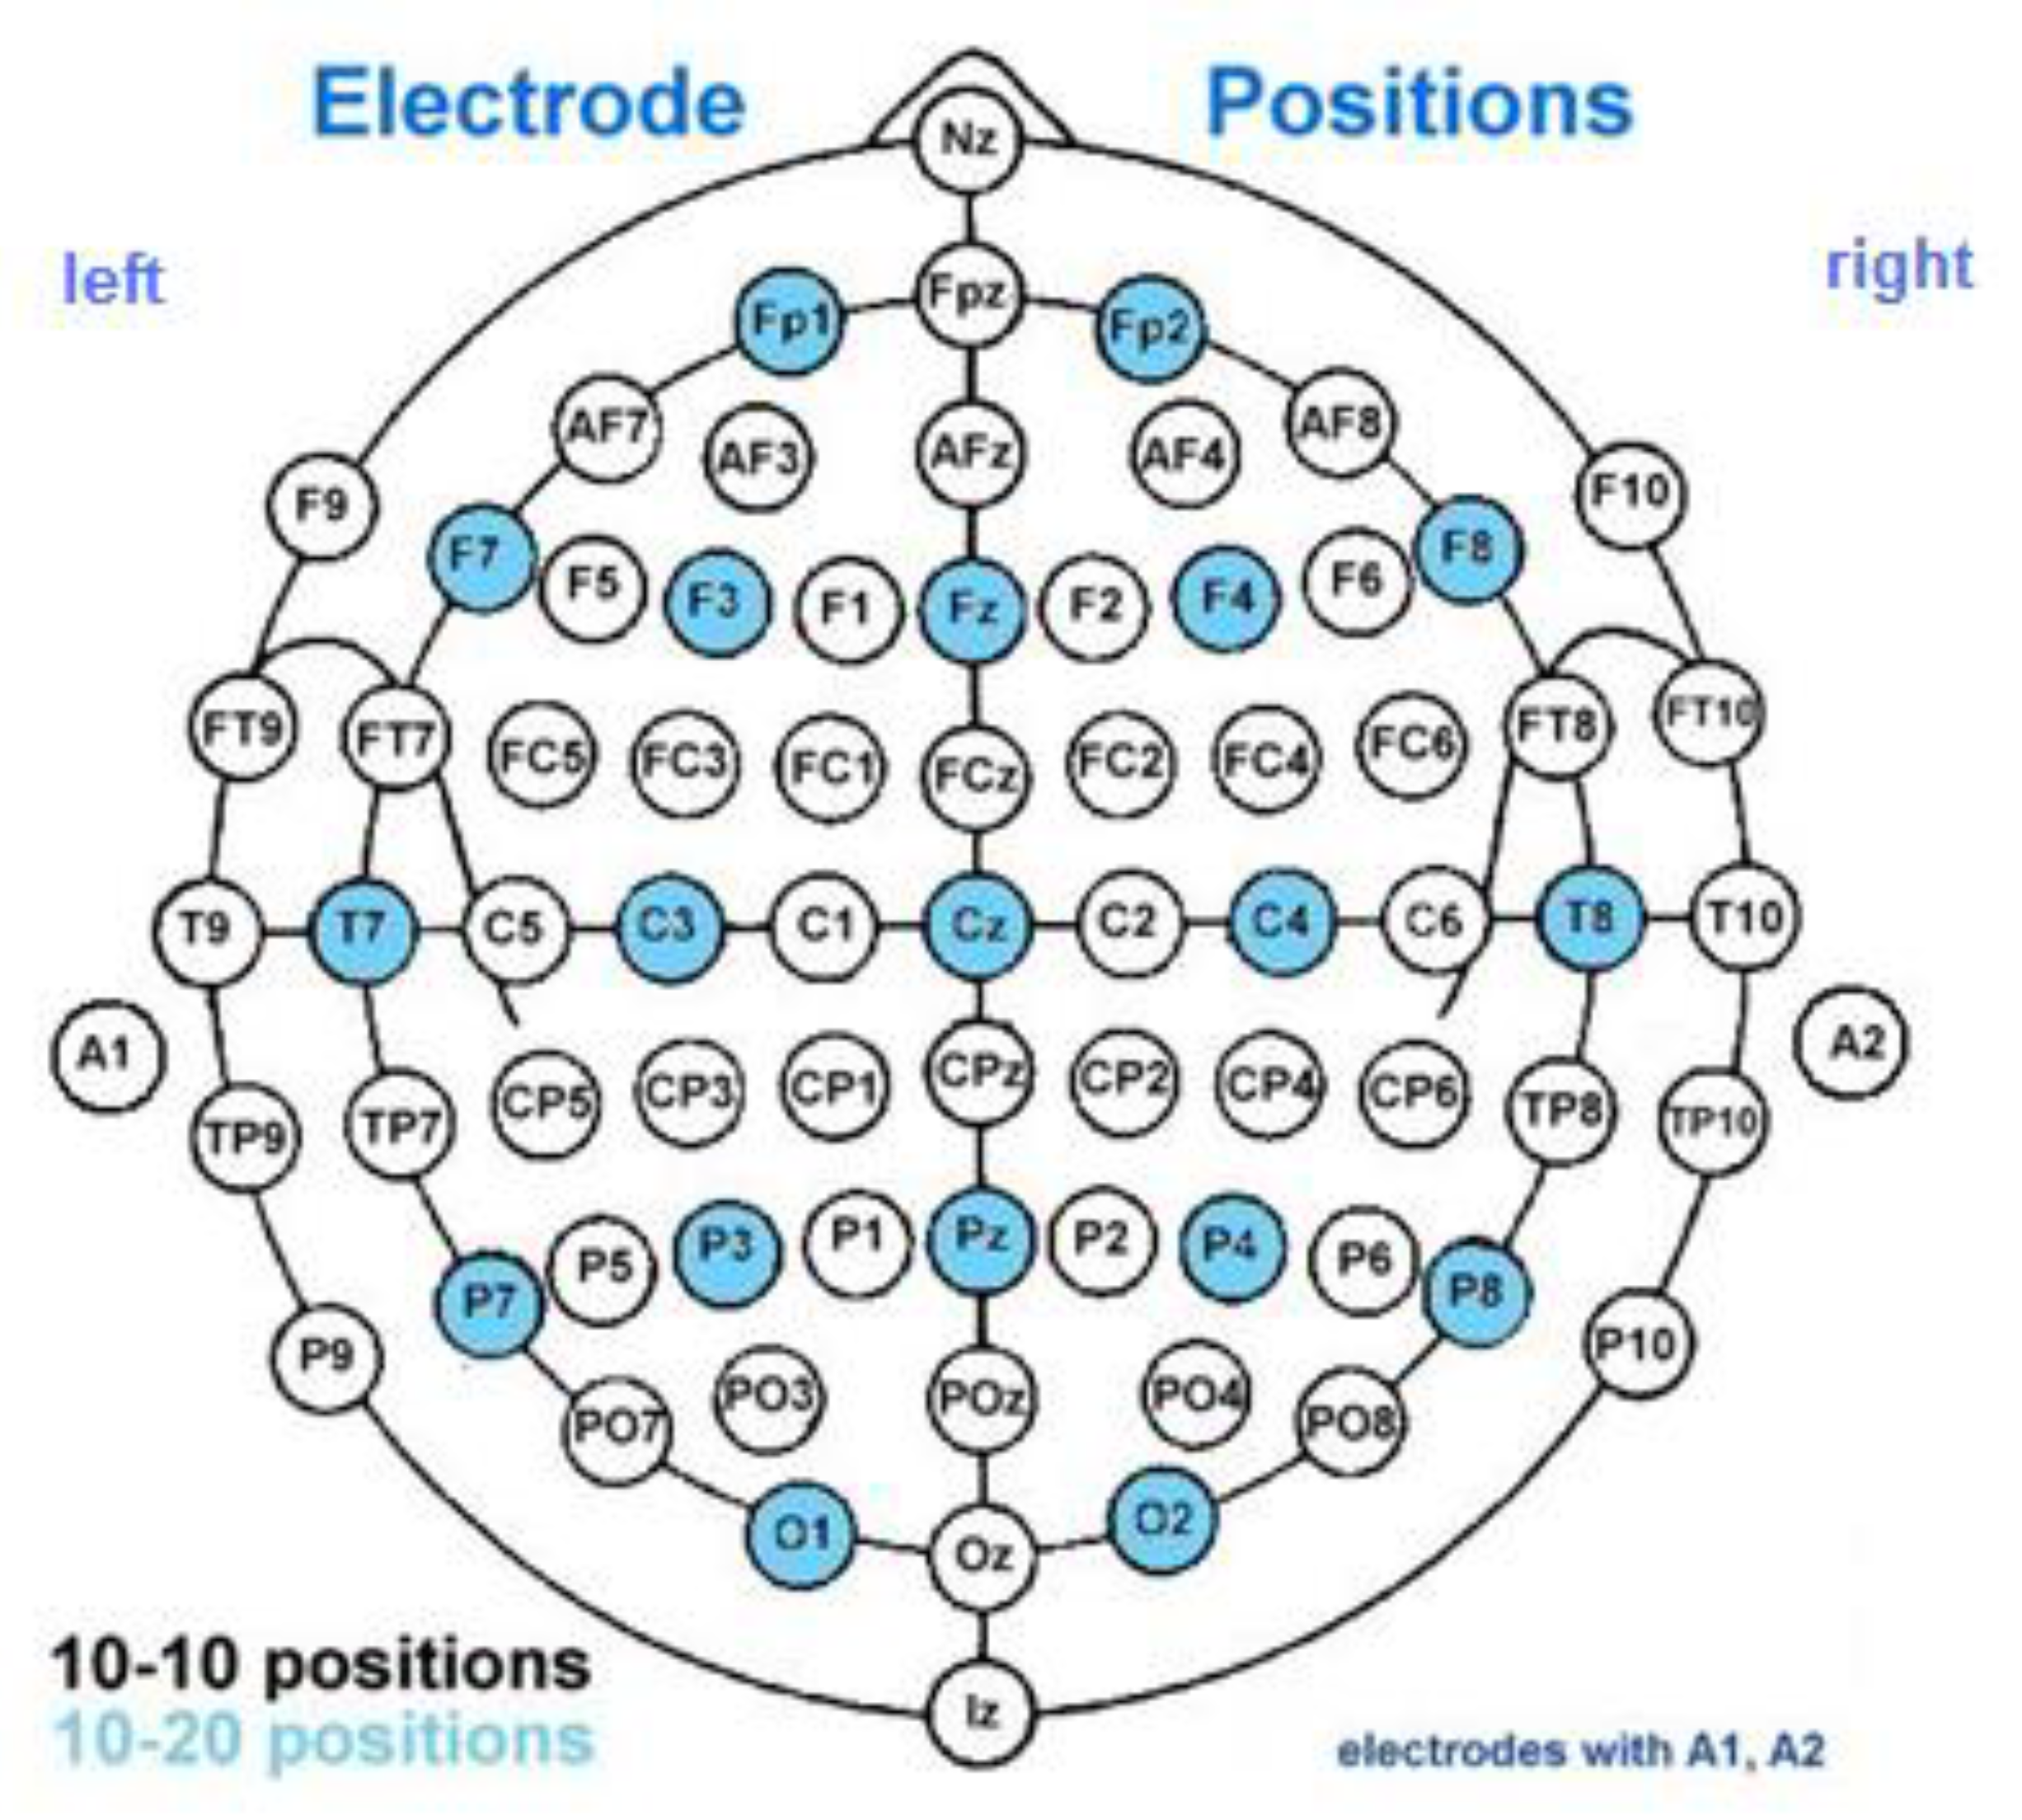
The EEG experimental procedure has been described elsewhere [58]. The head position of EEG sensors (Brain Rhythm Inc., Taiwan) were in accordance with a system 10/20: Fz, F3, F4, C3, C4, Cz, T7, T8, P3, P4, Pz, O1, O2, Oz, and a system 10/10: AF3, AF4, F7, F8, FT9, FT10, FC3, FC4, FC5, FC6, C1, C2, C5, C6, CP1, CP2, CP3, CP4, TP7, TP8, P7, P8, PO3, PO4, PO7, PO8, with a ground sensor placed on the forehead, and reference sensors—on both processus mastoidei (Figure A1). The impedance of the skin was ≥5 kΩ. The continuous electrophysiological data were sampled with a rate of 250 Hz. Band-pass filters were applied from delta to gamma frequencies (δ = 1.5–4; θ = 4–8; α = 8–13; β1 = 13–20; β2 = 20–30; γ1 = 30–48; γ2 = 52–70 Hz) and a notch filter of 50 Hz. The trials were segmented relative to the onset of the stimulus, lasting up to 800 ms. The trials, containing artifacts and exceeded ± 200 µV were rejected. The analysis was included only those trials with high SNR and correct responses [70]. After this preprocessing, the average trial number per condition was 30 over subjects. The smallest number of artifact-free and correct segments was 20 per condition and subject.
2.4. Small-World Propensity
The phase synchronization across all possible pairs of electrodes, defined by the Phase Lag Index (PLI) [71,72] for each frequency band, measures the asymmetry of the distribution of the instantaneous phase differences using Hilbert transform. When the PLI is 0 then two signals have no phase difference. When a PLI has a value of 1, then the phase difference of those signals is different from 0 mod π. PLI is not sensitive to adulterated correlations due to adjacent source and volume conduction [71,72]. The networks are created from statistics over strengths of the connections (edges, links) between neighbored nodes. Several main metrics reflect the behavior at a global brain level of the network as segregation, integration, and hubness [73,74]. The ability of the network to process information within a region or a group of interconnected neighbored brain areas (so-called nodes) is described as segregation, while the network capacity to compound information between different regions of the brain (nodes) describes the network integration [75]. Graph measure, which characterizes brain network segregation, defined by a part of the adjacent neighbors of nodes, describes the clustering coefficient [76,77]. Graph measure, which characterizes the network integration, defined by a mean shortest length of the paths between all node pairs, describes the characteristic length of the path in the network [76,77]. The hubness includes measures of each node as strength of its connection to all other nodes, and betweenness centrality as the part of all shortest lengths of the paths cross the node in the network [73,74,78]. The part of all shortest lengths of the paths, containing a given edge, is the betweenness centrality of this link in the network. The small world is described from the ratio of the measures as the characteristic length of path and the clustering coefficient, as well as the global efficiency, quantified by the inversed mean length of the paths and described the information exchange across the network [74]. A new graph metric, called small-world propensity SWP, assesses the density variations of the network [79] and sensitivity to the strengths of functional connections between nodes. The weak and strong links have different contributions to the overall functioning of the network [80]. This method does not ignore the weak links because it does not apply thresholding techniques as in other approaches. These links can identify as potential pathological biomarkers [80].
The comparison of the characteristic path length and clustering coefficients of null models as random graph (Lrand, Crand) and regular lattice (Llatt, Clatt) describes the small-world structure of observed weighted networks (Lobs, Cobs) by the SWP (denoted by ϕ). The nodes of these graphs have the same number and probability power distribution of degrees [79]. The deviations of the Lobs and the Cobs (∆L, ∆C) of the observed network from its null models quantifies ϕ:
ϕ = 1 − ((∆C2 + ∆L2)/2)½;
∆C = (Clatt − Cobs)/Clatt − Crand);
∆L = (Lobs − Lrand)/(Llatt − Lrand)
These models assume that adjacent nodes in the observed network are connected with higher strength and stronger edges than remote nodes. The observed edge weights are arranged in the lattice model of a weighted network. The highest weight is assigned to edges with the shortest Euclidean distance between nodes. The weights of edges are ranked by decreasing strengths. The randomly distributed connections with N highest weights across the edges and represented in a one-dimensional lattice with a unit distance. The next connections with N-1 highest weights across the edges are represented in a two- dimensional lattice. In this way, all edges in the observed network are arranged in the lattice. The higher weights in the built lattice are assigned to distances that corresponded to the higher strength of near edges. The edges with the highest strength in the lattice network are located on the diagonal of the adjacency matrix. A high Clatt and low Llatt characterize the lattice network. The network rewires when the deviation ∆C is maximal. The random network has connections randomly assigned throughout the matrix and small shortest paths between them. The random network has small values of Crand and long lengths of Lrand. When significant clustering between the nodes lacks locally that the random model is highly integrated and not segregated. These reference networks are important to calculate ϕ of an observed network. The observed networks can have values of Lobs or Cobs that exceed those of the lattice or random null models. If these measures are lower than 0 or higher than 1, then the ϕ sets to a range [0, 1]. The real word networks with high Lobs and Cobs (low deviations ΔL, ΔC) have ϕ ≈ 1. The values of ϕ close to 0 are associated with larger deviations ΔL and ΔC from the null models, a smaller small-world structure, and high measures of the small-world. The real power of ϕ quantifies the degree of small-world structures between the networks. Relatively large ϕ values of real networks indicate small-world properties. The real networks with high ϕ close to 1 are guided by big Cobs and short Lobs (low ΔC, low ΔL). A big Cobs and moderate Lobs (low ΔC, moderate ΔL), as well as modest Cobs and short Lobs (moderate ΔC, low ΔL), can drive the relative high ϕ. Smaller small-world structure with values of ϕ close to 0 is maintained by larger deviations ΔL and ΔC from the respective null models [79].
The adjacency matrices with 40 to 40 nodes of the weighted graph, built by PLI between all pair sensors, are estimated for each frequency band (δ ÷ γ). The SWP measures are estimated for controls and dyslexics, based on the Brain Connectivity Toolbox for MATLAB, at http://www.seas.upenn.edu/~dsb/, accessed on 1 January 2016 [79].
2.5. Statistical Analysis of Global SWP Measures
Group comparisons of the global ϕ, ΔL, ΔC measures are implemented by bootstrap nonparametric procedures with 1000 random permutations for each condition and frequency [81,82]. Independent permutation tests require corrections for multiple comparisons. The Bonferroni correction was applied to the significance level (p = α/3 = 0.017).
2.6. Statistical Analysis of Local SWP Measures
Local measures of the nodes in the network are strength and betweenness centrality (BC). The betweenness centrality of the nodes is defined through a conversion of the weights into distances in the adjacency matrix. A large number of shortest paths join in edges with high values of BC. The sum of the weights of links for each node defines its strength. The local characteristics of each node values are divided by their mean values between the nodes. Many shortest paths pass through nodes with high BC/strength, which have a substantial role in the information processing of the network [77]. A graph with maximum BC/strength is more integrated [73,78]. The most important nodes call hubs of the network. The local measures are estimated based on MATLAB’s brain connectivity toolbox [74]. At the level of network nodes, the strength and BC of the nodes were evaluated by nonparametric permutation cluster-based statistics [81]. This analysis is performed for the hubs, defined by nodes with maximal strength/BC crossed the selective threshold criteria (one standard deviation over a mean group node’s strength/BC). The significant clusters are identified by applying a critical value for the (max cluster) statistics. Throughout control of the false alarm rate with multiple comparison corrections, repeated clusters pass significantly the threshold criteria and defined an ordered sequence. The histograms of the nodes have indices corresponding to the sensors. The medians of their distributions are sensitive to the hemispheric differences. The control of the multiple selected thresholds requires Bonferroni correction (p = α/2 = 0.025). Non-parametric statistics are accomplished on MATLAB. The significant results are bold in the tables. The selection criteria are applied also for the links and edge BC, presented on the figures, drawn by BrainNet Viewer version 1.63 [83]. (See Appendix A).
2.7. Statistical Analysis of Behavior Parameters
The behavior parameters as a performance accuracy and reaction times during EEG sessions were compared between pre-training and post-training dyslexic groups and between neurotypical readers and dyslexics for each condition (low/high-speed contrasts) based on a nonparametric test (Kruskal–Wallis test [KW test]).
3. Results
3.1. Behavior Measures
The first language of the participants was Bulgarian. The classification of hand preference [84] showed that all children had right-hand preferences. They were with normal or adjusted to normal vision. They scored ≥98 points in their nonverbal intelligence test [63]. Children who had difficulty reading, along with accuracy or speed in reading subtests of the DDE-2 battery and the “Reading Abilities” battery below the norm with a standard deviation of standardized data of normally reading children were included in the dyslexic group [85]. Children, participating in the study as controls, were recruited from the schools of the dyslexics. They were of the same age and socio-demographic background as the dyslexic group (Table A1). They did not have dyslexia and concomitant language disorders, according to the accuracy and speed of reading in DD2 tests (Table A1).
The children with DD before training discriminated poorly the speed differences in comparison to the control group (p = 0.02, χ2 = 5.83, slow-speed contrast; p = 3.77 × 10⁻⁴, χ2 = 16.32, high-speed contrast; Table 1).
After visual training sessions, these children improved accuracy in the speed discrimination in comparison to the group before training (p = 0.01, χ2 = 6.07, slow-speed contrast; p = 1.04 × 10⁻⁴, χ2 = 19.02, high-speed contrast).
3.2. Impact on Motion Measures on Global SWP Measures
For the global SWP measures in the low-speed contrast of the radial flows, the significant differences were found between the controls and the pre-D in the θ ÷ γ1 frequency range, as well as between the pre-D and the post-D in β ÷ γ1. In the high-speed condition, the significant differences were found between the controls and the pre-D in the β2 frequency band as well as between the pre-D and the post-D in α, β, γ1. In both speed contrasts in the groups from θ to γ1 frequency ranges, there was a decrease in ϕ and ΔL, and an increase in ΔC with increasing frequency. The pre-D, compared to the controls, had statistically higher ϕ in α ÷ γ1 and ΔL in θ, β2 and γ1 bands for the low-speed contrast, while compared to the post-D—higher ϕ and ΔL in β1 ÷ γ1 (p < 0.01, χ2 > 6.57; Table 2). For the high-speed contrast, the pre-D was with higher ϕ in β2 (p < 0.003, χ2 > 8.65; Table 3) than the controls and with higher ϕ in α to γ1 and ΔL in α, β2 (p < 0.011, χ2 > 6.43; Table 3) than the post-D. The pre-D had a statistically lower ΔC vs. controls in θ ÷ γ1 for low-speed (p < 0.008, χ2 = 7.03; Table 2) and in β2 for the high-speed contrast (Table 3: p = 0.002, χ2 = 8.94), while vs. post-D—in β1 ÷ γ1 (p < 1. 2 × 10⁻⁵, χ2 > 8.43; Table 2) and in α ÷ γ1 (p < 0.003, χ2 > 8.46; Table 3). The post-D had a statistically higher ΔC and lower ΔL in β1-network compared to the controls for the low-speed contrast (ΔC: p = 0.017, χ2 = 5.68; ΔL: p = 0.006, χ2 = 7.47; Table 2), while for the high-speed contrast—statistically lower ϕ and higher ΔC in α and β1 (p < 0.005, χ2 > 7.75; Table 3).
3.3. Impact on Motion Measures on the Strength and Betweenness Centrality of Nodes
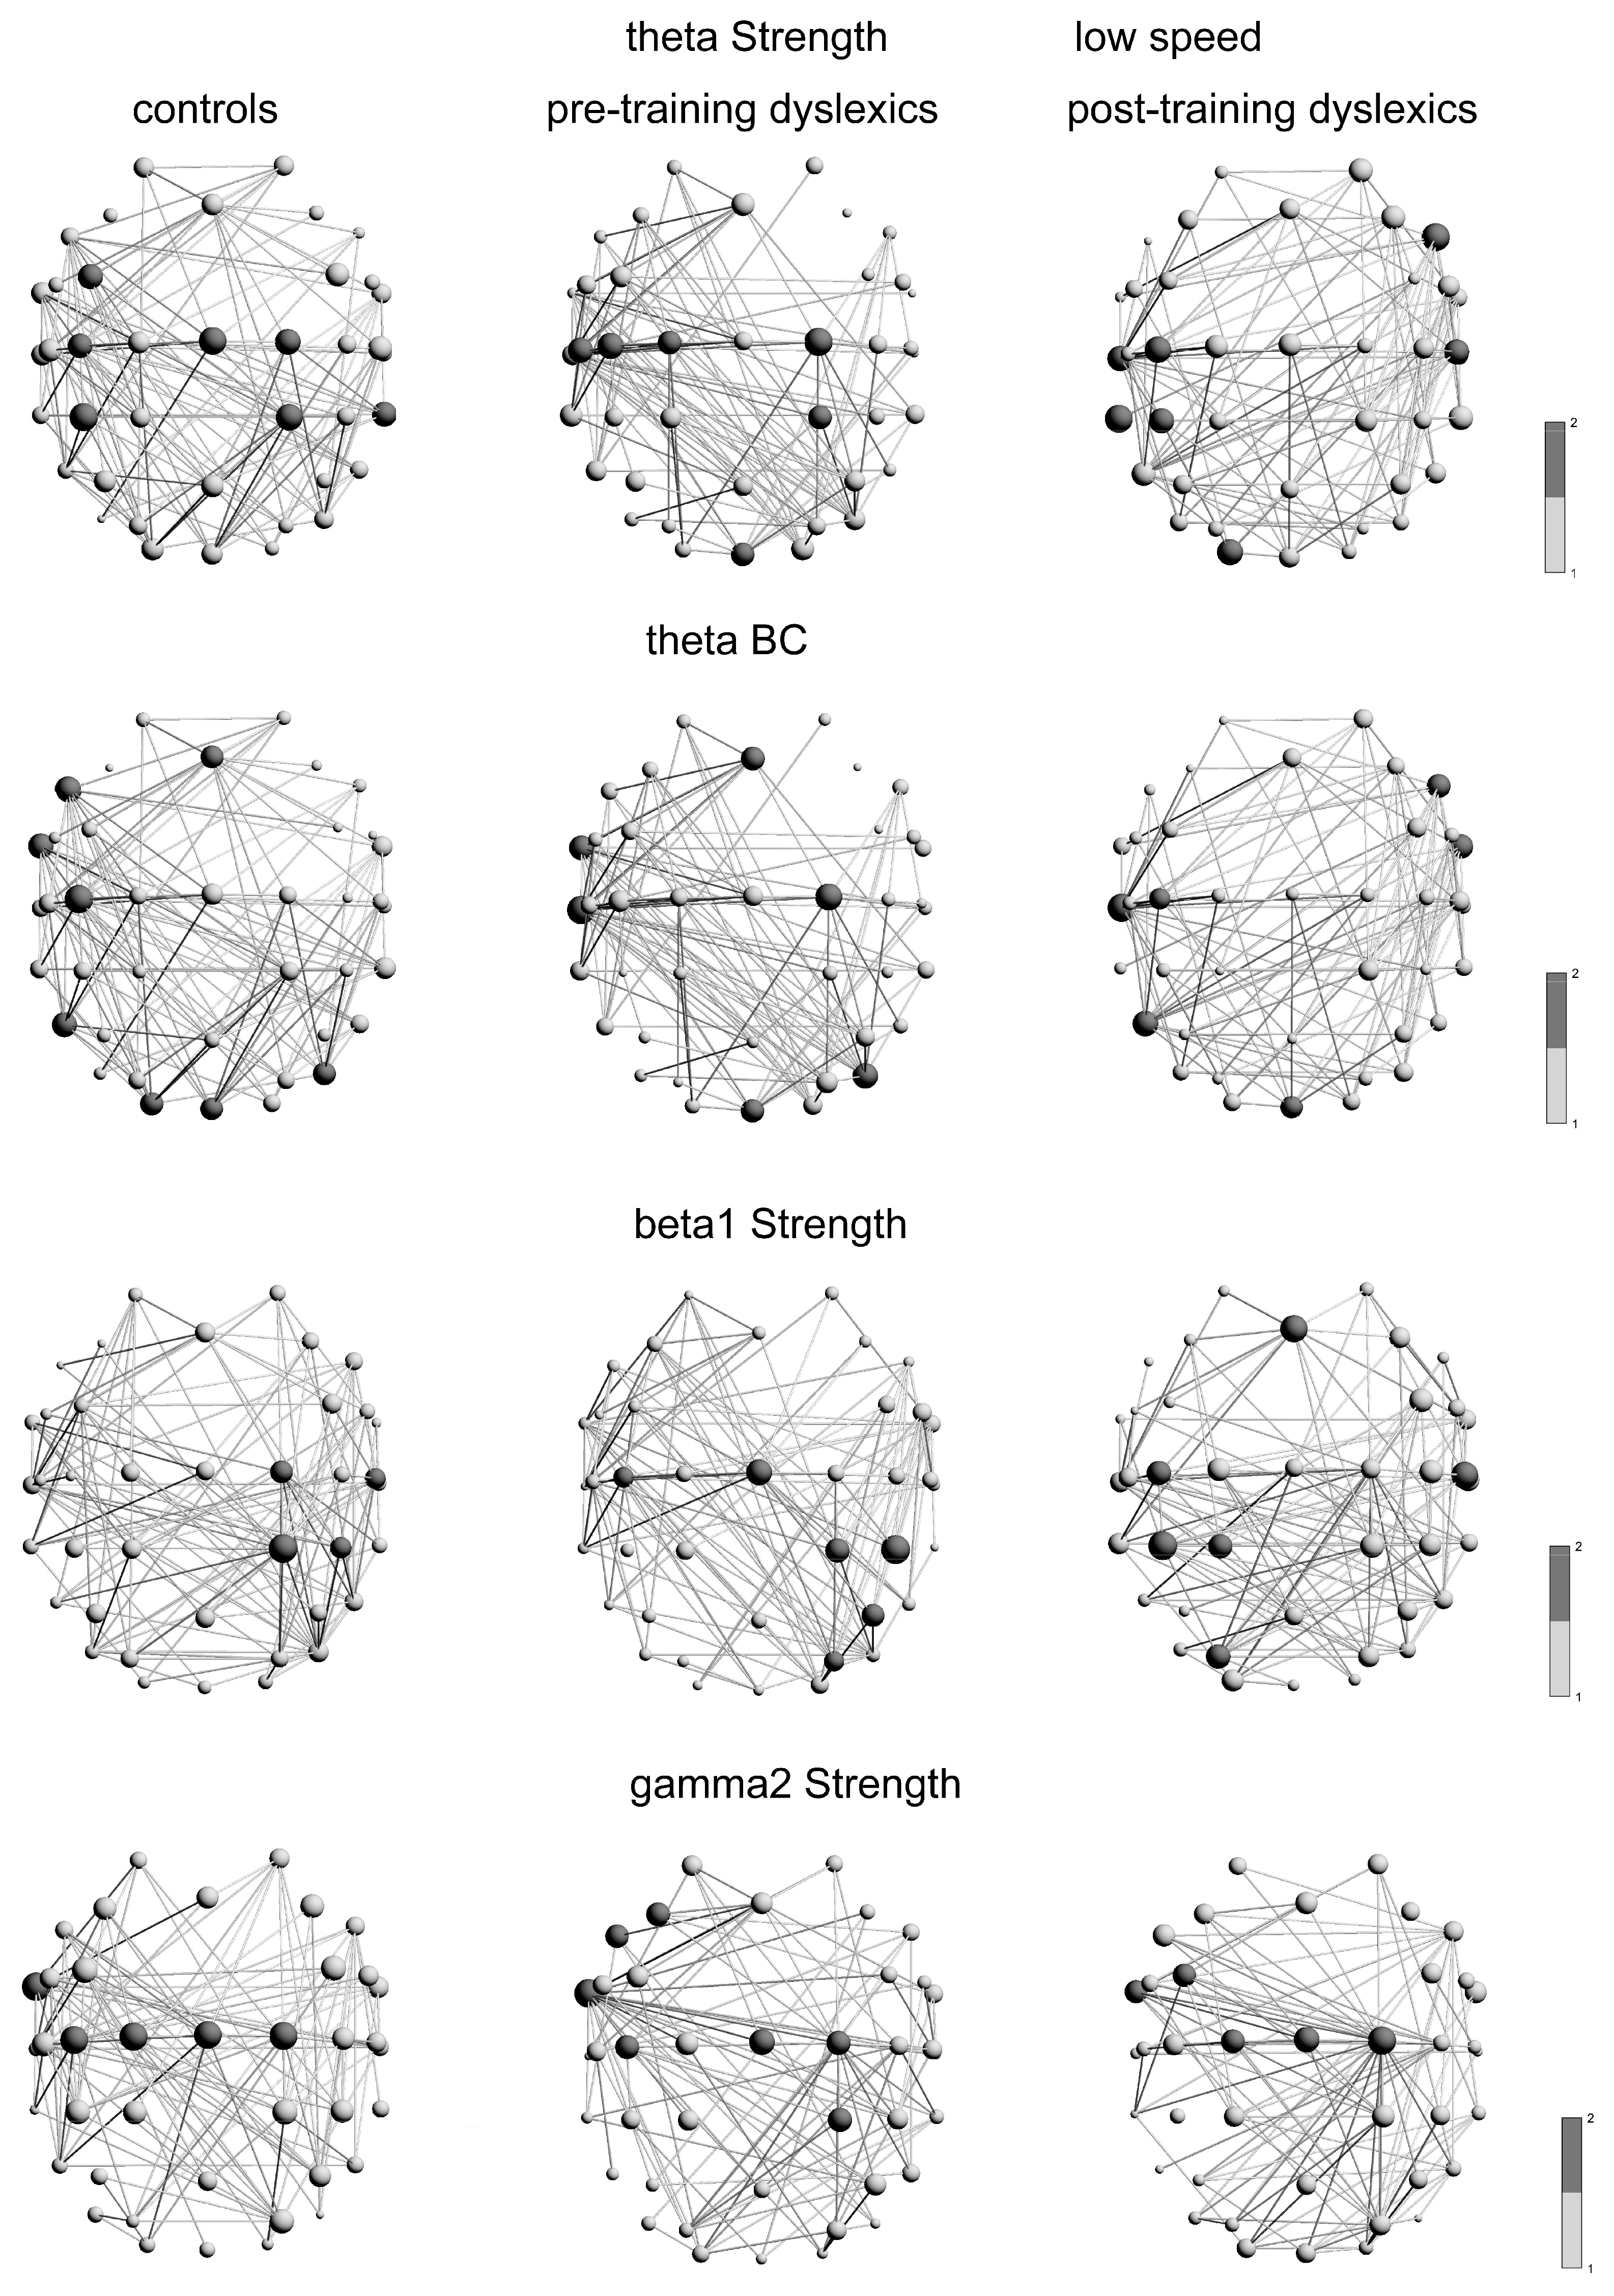
3.3.1. Hub Distributions in the Graphs at Low-Speed Contrast
The hub distributions in the graphs of the θ-frequency networks, based on the strength of nodes, were significantly different between controls and pre-D (p = 0.022, χ2 = 5.19), as well as between pre-D and post-D (p = 0.015, χ2 = 5.88; Table A2). The typical readers and post-D had significantly more hubs in the left hemisphere than the pre-D. For the controls, the hubs were distributed in the left hemisphere at a middle frontal gyrus (MFG; FC3: Brodmann area BA6—premotor and supplementary motor cortices: pre-SMA, SMA; [86]), postcentral gyrus (PSTCG; C3: BA123/6—primary somatosensory and motor cortices), inferior parietal lobe (IPL; CP3: BA40/123—supramarginal gyrus (subareas PFt/PFm; [87]); ventral intraparietal sulcus VIP or IPSmot; [43]). The hubs of the controls were distributed in the right hemisphere at precentral gyrus (PRECG; Cz: Brodmann areas BA4/6, C2: Brodmann areas BA4/6/123—primary motor, pre-motor, somatosensory cortices; [86]), superior parietal gyrus (SPL; CP2: BA5/7—areas PGa/7A/7PC; LIP; [87]; Figure 1A), middle temporal gyri (MTG; TP8: Brodmann areas BA21/22/37/20; medial superior and middle temporal areas, lateral occipitotemporal/posterior inferior temporal gyri, adjacent to posterior fusiform/lingual gyrus; [88]; MST/MT/V5/V4; [87]).
The hubs for pre-D were in the bilateral PRECG (C1-2), left PSTCG (C3: BA123/6; C5: BA123/40/43—primary somatosensory cortex and supramarginal gyrus with extension into the Sylvian fissure to PFop; [87]), SPL (CP2), a part of the cuneus of the occipital lobe (Oz: BA18, visual area V2). After training of the dyslexics, the hubs were observed in the right inferior frontal gyrus (IFG; F8: BA45/47—Broca’s area, orbital frontal cortex), bilateral PSTCG (C3: BA123/6; C6: BA123/40), left middle temporal gyrus (MTG; T7: BA21/22—MT/MST, TP7: BA21/37/22—MT+/V5/MST; [87]), left IPL (CP3), left middle occipital gyrus (MOG; O1: BA19—associative visual V3 area; Figure 1A, 3rd graph). The hub distributions of controls and post-D were no significant difference (p = 0.64, χ2 = 0.22).
The hub distributions in the graphs of the θ-frequency networks, based on the betweenness centrality of nodes (BC), were significantly different only between pre-D and post-D (p = 0.009, χ2 = 6.63), but not between controls and pre-D, as well as between controls and post-D (p > 0.125, χ2 < 2.34). The hubs in the θ-network (BC) of the pre-D were distributed in the right hemisphere. While the post-D hubs were distributed in the left hemisphere. However, the hubs of the typical readers were symmetrically distributed posteriorly in both hemispheres compared to the dyslexic subgroups and overlapped with the hubs of the dyslexics. For the normolexics, the main hubs (BC) were located at the medial frontal cortex (MFC; Fz covers BA8—intermediate frontal, including frontal eye fields; [86,88]), left IFG (F7), anterior part of the left inferior temporal gyrus (ATG; FT9: BA20, [86]; BA38—temporal pole, [88]; areas TE/AIT, [87]), left PSTCG (C3), posterior part of the left ITG (P7: BA37/19—lateral occipitotemporal gyrus, adjacent to posterior fusiform/lingual cortex V5/V3; [87]), bilateral MOG (P08: BA19/18, ventral visual cortices V3v/V2; O1: BA19, visual cortex V3, [87]), a part of the cuneus of the occipital lobe (Oz: BA18, cuneus, V2; Figure 1B, 1st graph). For the pre-D, the hubs were in MFC (Fz), left ATG (FT9), and left MTG (T7), right PRECG (C2), right MOG (P08), a part of the cuneus of the occipital lobe (Oz). The hubs in the θ-frequency graph (BC) of the dyslexics after training, were distributed in the right IFG (F8), the right ATG (FT10), and in the left hemisphere at PSTCG (C3), MTG (T7), ITG (P7), a part of the cuneus of the occipital lobe (Oz; Figure 1B, 3rd graph).
In the β1-frequency network, based on the strength of nodes, the hub distributions were significantly different, only between pre-D and post-D (p = 0.004, χ2 = 7.91), but not between controls and pre-D, as well as between controls and post-D (p > 0.081, χ2 < 3.02). The differences in the two dyslexic groups’ networks were due to the hub distribution in the β1-network of the post-D was in the left brain hemisphere, whereas the hubs of the pre-D were distributed in the right hemisphere, while the controls—in both hemispheres. For the controls in the β1-network, the main hubs were distributed in the right hemisphere at PRECG (C2), PSTCG (C6), SPL (CP2), and IPL (CP4). The main hubs for the pre-D were in the PRECG (Cz: paracentral lobe; [88]), left PSTCG (C3) and in the right hemispheric SPL (CP2), IPL (CP4: BA40/123—subareas PFt/PFm, [87]; P4: BA39/40/7- angular/supramarginal gyri/precuneus; PGp/PGa/IPS/7P, [87]; LIP, [43]), superior occipital gyrus (SOG, PO4: BA19/18/39—[86]; dorsal visual cortex, parieto-occipital sulcus POs, an area in the angular gyrus, [86]; pIPS/V3A/V7/POs (dorsomedial parieto-occipital visual areas V6 and V6A), the ventral part of the posterior intraparietal sulcus, including the dorsal retinotopically defined V3A/V7, [87]; Figure 1C). The hubs for post-D were distributed on the bilateral MFC (Fz), right PSTCG (C6), and in the left hemisphere—the PSTCG (C3), SPL (CP1), IPL (CP3), SOG (PO3: BA19/18/39/7; [86]; pIPS/V3A/POs, Figure 1C, 3rd graph).
The hub distributions in the graphs of the γ2-frequency network (strength of nodes, Str) were significantly different between the controls and the pre-D (p = 0.0006, χ2 = 11.73), as well as between pre-D and post-D (p = 6.12 × 10⁻⁵, χ2 = 16.06). The difference in the hub distributions was due to the median of the distribution of the pre-D and controls was in the left hemisphere, while for the post-D—in the midline of the hemispheres. There was no difference in the distributions between the controls and post-D (p = 0.613, χ2 = 0.25). For controls, the main hubs were located in left ATG (FT9), bilateral PRECG (Cz, C1-2), left PSTCG (C3) (Figure 1D, 1st graph). For the pre-D, the hubs were in the left-hemispheric MFG (F3: BA8), IFG (F7), ATG (FT9), PSTCG (C3), and the right-hemispheric PRECG (Cz, C2), SPL (CP2). For the post-D, the hubs were distributed in the bilateral MFG (FC3), the bilateral PRECG (Cz, C1-2), and the left ATG (FT9) (Figure 1D, 3rd graph).
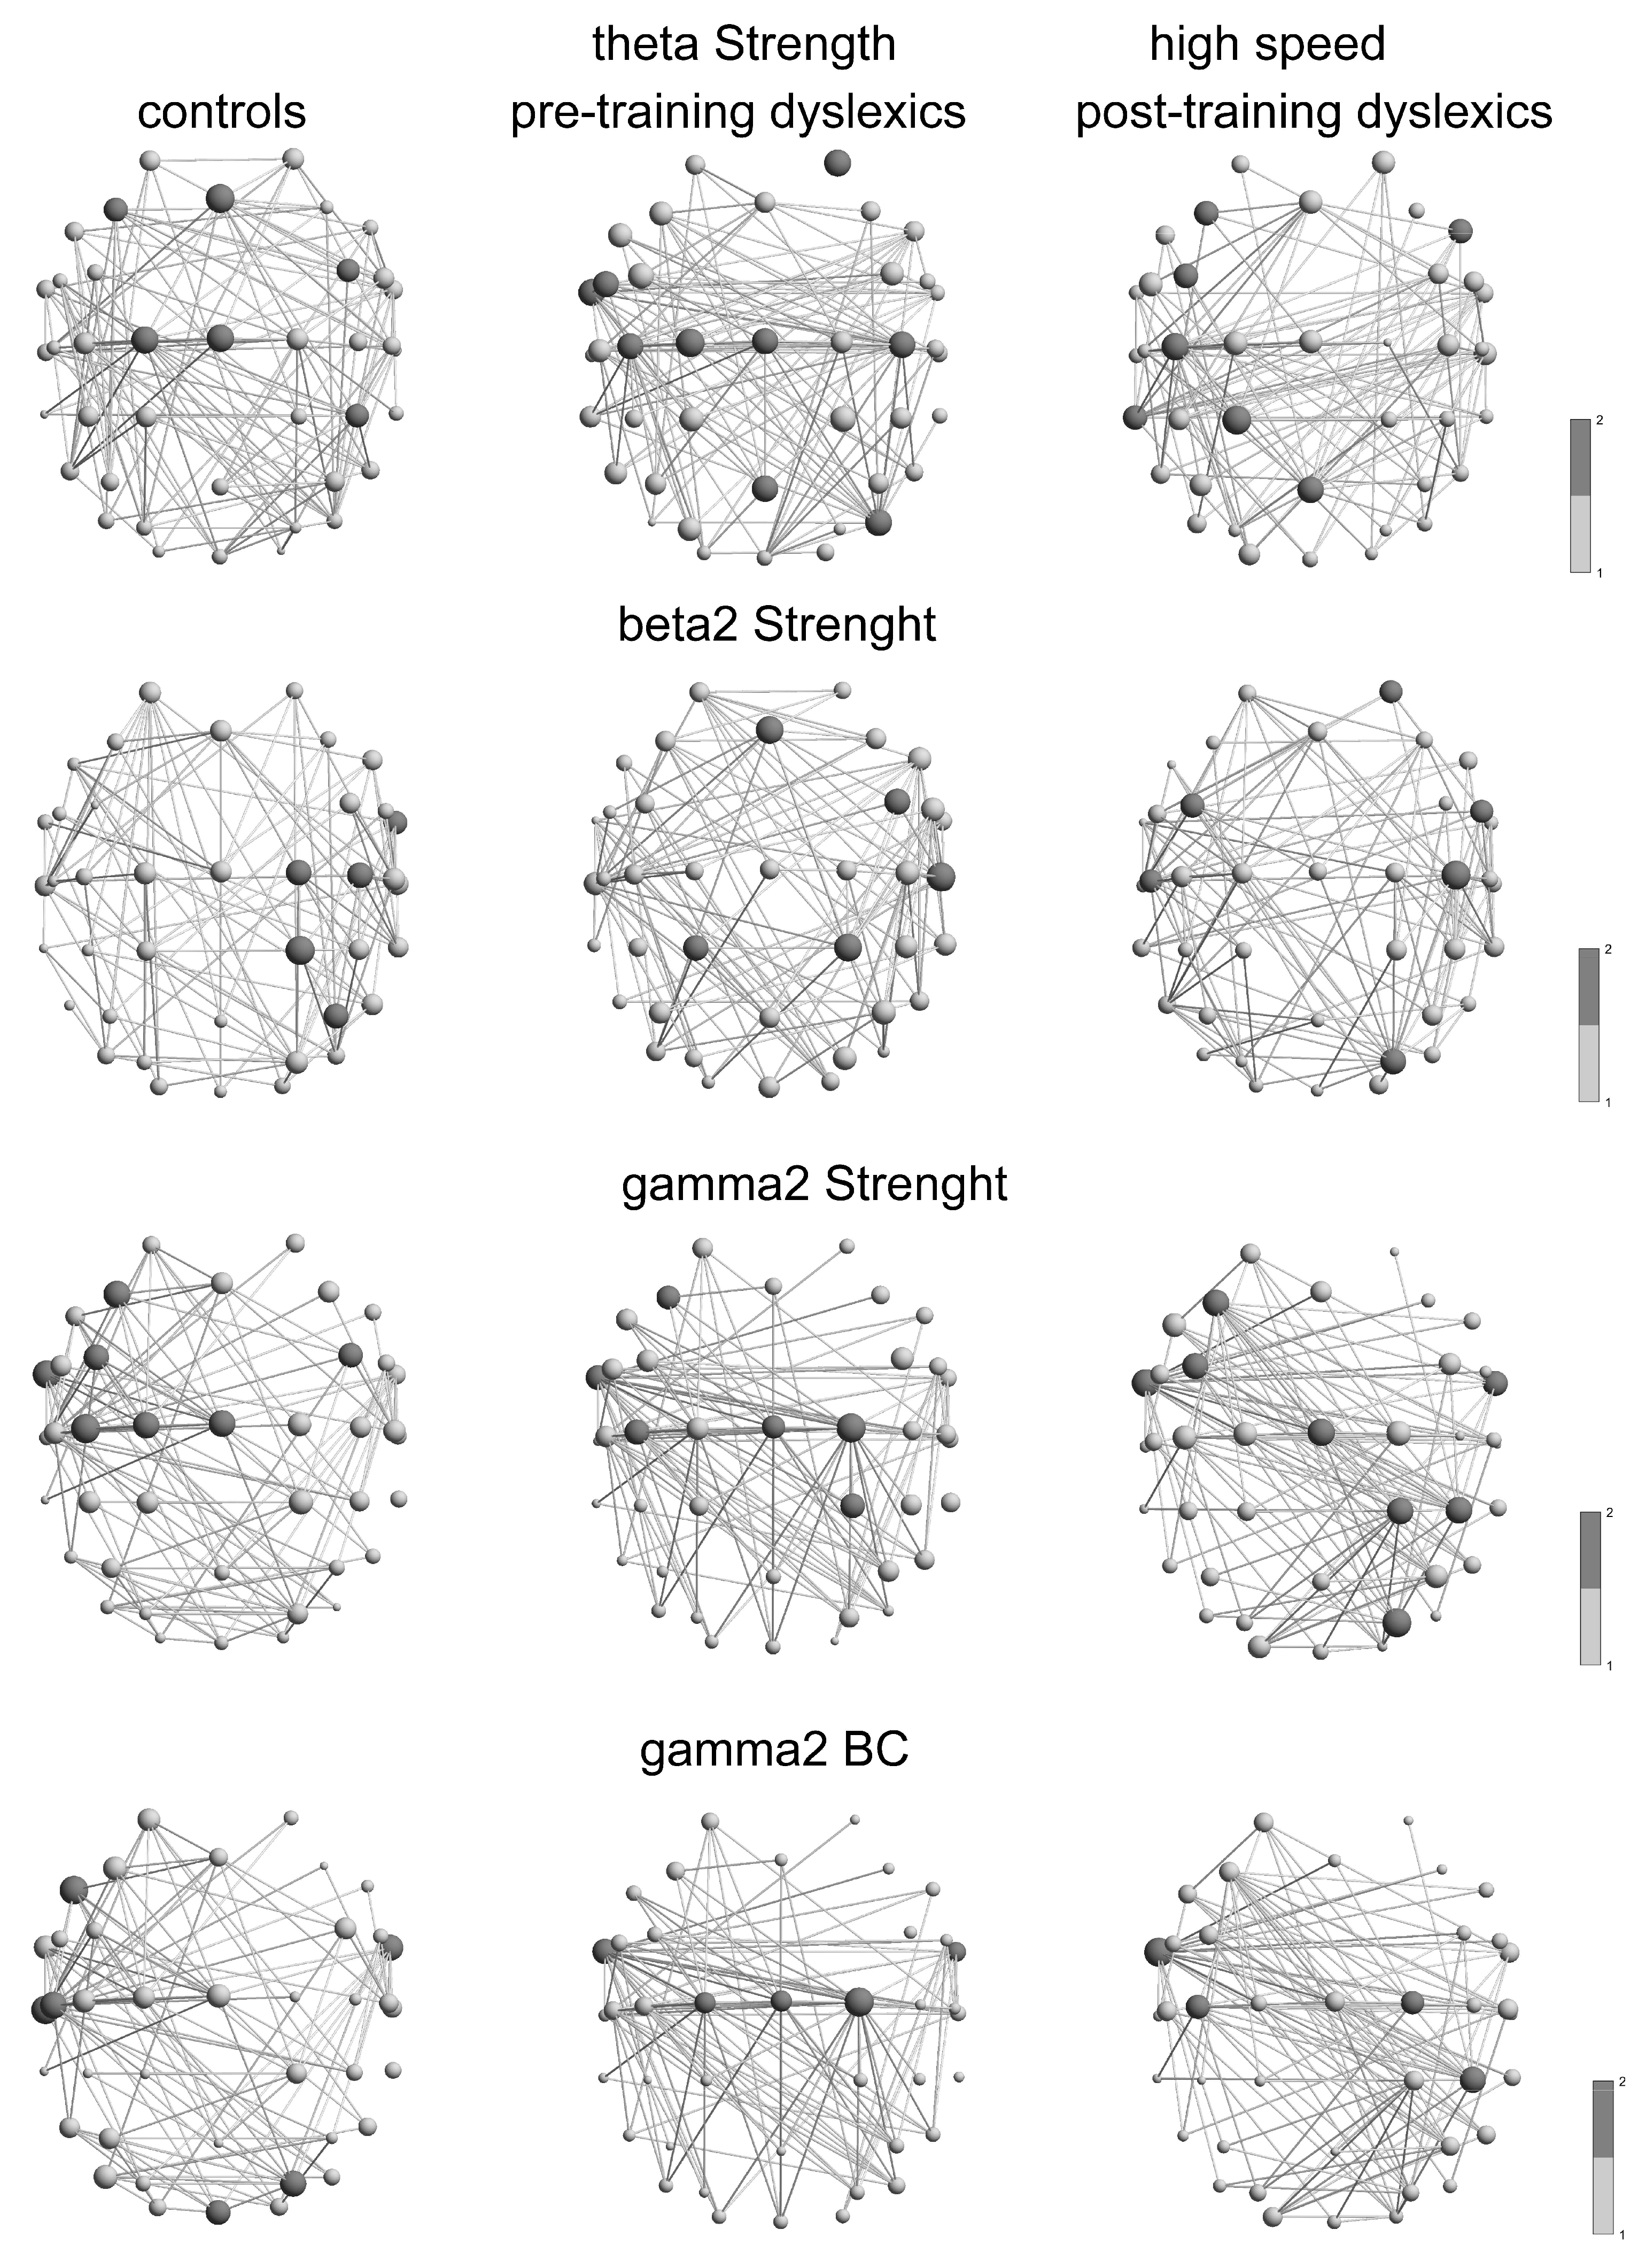
3.3.2. Hub Distributions at High-Speed Contrast
The hub distributions in the θ-frequency network (strength) were significantly different between controls and pre-training dyslexics (p = 0.01, χ2 = 6.33), as well as between the pre-D and post-D (p = 0.002, χ2 = 9.47). There was no significant difference in the distributions between the controls and the post-D (p = 0.636, χ2 = 0.22; Table A3), where the hub distribution of the pre-training dyslexics was in the left hemisphere. The main hubs for the controls were at the bilateral MFG (Fz, F3: BA8), right MFG (FC4), bilateral PRECG (Cz, C1), right IPL (CP4) (Figure 2A, 1st graph). For pre-D, the hubs were distributed on the right superior frontal cortex (SFC: AF4: BA9-Dorsolateral prefrontal cortex, DLFC), the left IFG (FC5), the left ATG (FT9), the bilateral PSTCG (C3-4), the bilateral PRECG (Cz, C1), the bilateral SPL (Pz: BA7, precuneus, 7P; [87]), the right MOG (P08) (Figure 2A, 2nd graph). For post-D, the main hubs were at the left MFG (F3, FC3), the right IFG (F8), the left MTG (TP7), the left PSTCG (C3), the left SPL (CP1), bilateral SPL (Pz) (Figure 2A, 3rd graph).
In the β2-frequency network (strength), the hub distributions were differed between controls and pre-D group (p = 0.025, χ2 = 5.02), because the hubs of the pre-D were more distributed in the right hemisphere than at the controls. For controls, the main hubs were in the right hemisphere at the ATG (FT10), PRECG (C2), PSTCG (C4), SPL (CP2), IPL (P4) (Figure 2B, 1st graph). For pre-D, the main hubs were distributed through the bilateral MFG (Fz), the right MFG (FC4), the right PSTCG (C6), the bilateral SPL (CP1-2) (Figure 2B, 2nd graph). The hub distributions were significantly different between the controls and the post-D (p = 0.004, χ2 = 8.16). The hubs of the post-D were in the right hemisphere at SFC (AF4), IFG (FC6), and the SOG (PO4), while in the left hemisphere at MFG (FC3) and the bilateral PSTCG (C4, C5) (Figure 2B, 3rd graph). Both dyslexic groups had insignificantly different distributions (p = 0.427, χ2 = 0.630).
In the γ2-frequency network (strength), significant differences in the hub distributions were found between the controls and the pre-D (p = 4.8 × 10⁻⁶, χ2 = 20.8), as well as between pre-D and post-D (p = 2.3 × 10⁻⁶, χ2 = 22.36), due to more distributed hubs in the left hemisphere of the controls than in the pre-D. The hubs of the control group were at the bilateral MFG (F3, FC3-4), bilateral PRECG (Cz, C1), and in the left hemisphere at the ATG (FT9), PSTCG (C3) (Figure 2C, 1st graph). For pre-D, the hubs were distributed in the left hemisphere at MFG (F3), ATG (FT9), PSTCG (C3), bilaterally at the PRECG (Cz, C2), and the right SPL (CP2) (Figure 2C, 2nd graph). The hubs for post-D encompassed the left MFG (F3, FC3), the bilateral ITG (FT9-10), bilateral PRECG (Cz), and in the right hemisphere—the SPL (CP2), IPL (CP4), SOG (PO4) (Figure 2C, 3rd graph). There was no significant difference in the distributions between the controls and post-D (p = 0.866, χ2 = 0.02).
In the γ2-frequency network (BC), the hub distributions were significantly different only, between the pre-D and the post-D (p = 0.0009, χ2 = 10.99), due to more distributed hubs in the left hemisphere of the pre-D, and more distributed hubs in the right hemisphere of the post-D. The main hubs for pre-D were in the bilateral ATG (FT9-10), bilateral PRECG (Cz, C1-2) (Figure 2D, 2nd graph), while for post-D—in the left hemisphere at ATG (FT9), PSTCG (C3), and in the right hemisphere at PRECG (C2), IPL (CP4) (Figure 2D, 3rd graph). There was no significant difference in the distributions between the controls and pre-D (p = 0.186, χ2 = 1.74), as well as between the controls and post-D (p = 0.039, χ2 = 4.21), due to hubs in both hemispheres of the controls. The main hubs of the controls were distributed in the left hemisphere at the IFG (F7), PSTCG (C5), MTG (T7), and in the right hemisphere at the ATG (FT10), SOG (PO4), a part of the cuneus of the occipital lobe (Oz; Figure 2D, 1st graph).
4. Discussion
4.1. Global Network Measures
The networks with a relatively high ϕ were guided by a low Cobs and low Lobs (big ΔC and short ΔL) at θ, α, and γ1-frequency, while the network with relatively moderate ϕ was driven by an equally contributing moderate Cobs and Lobs (moderate ΔC, moderate ΔL) in the β-network. The networks are rewired, when the lowest values of ϕ at β-frequency networks in the controls and post-D, than in the pre-D, represented larger deviations from the respective null models for Cobs and Lobs. It was most expressed in the post-D group. The controls and the post-D in the β-network had nodes with a moderate Lobs and moderate locally significant Cobs between the nodes in both speed contrasts. Therefore the network integration and segregation had an equal contribution for low/high-speed contrasts in these groups but with less segregation in the post-D than the controls due to lack locally of significant clustering between the nodes for β1-frequency range at low-speed condition, but with a more segregated network than before training.
The groups’ graphs exhibited different small-world properties. The networks in the controls had a similarly relatively low ϕ at α and β frequencies. The networks in the dyslexics before training had high ϕ at low-frequency networks, which gradually decreased through the middle frequencies, and passed into networks again with relatively high ϕ at γ1 frequencies. In the low-speed contrast, the lower values of ϕ of brain networks in the controls than other groups represented larger ΔC and ΔL from the respective null models for Cobs and Lobs for θ, α, and γ1-frequencies, in which the networks are rewired. While at β (both speed contrasts) and γ1-frequency range, the post-D expressed lower ϕ comparing with other groups, where its network was rewired. The rewiring of the neural network suggests that the low-frequency transitions in theta/beta frequencies reset the neural activity occurring at γ frequencies as for selective attention [89], while the rewire at the high-frequency transitions in β/γ1 frequencies might be a more general process across other modalities. The visual stimuli might expose changes in visuospatial attention on a neural level of visual areas, which sampling rate for visual search is in the range of low γ frequencies and not the much slower δ/θ rate that shows no deficit [13,58,85]. The controls and the post-D in γ1-frequency range had moderately integrated and segregated networks for a low-speed condition and more segregated in both groups than the pre-D. In γ1-frequency band, the post-D compared to pre-D network structure with increasingly ϕ became less integrated and more segregated, driven by a large ΔC and low ΔL for the low-speed discrimination, and with the significantly higher change in the ΔC for the high-speed contrast.
Only, the visual processing speed, i.e., the component of visual attention capacity, affects the reading speed [58,90], is determined by the γ-frequency oscillations, whose range is the essential rate-limiting step in reading [13]. The visual attention span influences reading performance [91]. Generally, the sampling rate, used for reading, is selected for visual search and this range is itself under certain constraints in the processes of information integration and segregation. The main deficiencies in dyslexia may be impaired γ1 frequency sampling, affecting visual motion processing, (hence reading, [58]), and/or deceleration at this rate. The change in the frequency synchronized oscillations may affect the modulation efficiency of the motion-sensitive areas by the top-down feedback. Facilitations of sensory signals, arriving in sensory-sensitive areas, at which frequency alterations would lead to a mismatch with the resonant frequencies in the primary visual area. These frequency changes might lead to poorer neuronal oscillations in dyslexics at the speed-motion processing. There may also be some slowing down of the sampling rate, which was better after training. The consequences would be a slowdown by reducing speed due to slow sampling range and faster by overloading the working memory capacity due to fast frequency sampling range and time, needed for high-speed processing. If the attention spotlight spans more globally the flow at a time in each γ-cycle, the speed processing may be slower. The sensory inputs get parsed at a rate of 4 Hz [92], which is in the theta frequency range that has been involved in the network differences between dyslexics and controls at the slow-speed flow discrimination. Essential for decoding of information processing in the flow parsing was the identification of speeds, which for most readers occurred at β2-γ1 (20–30 Hz, 30–48 Hz) rates. This process can determine the frequency of saccades. The decreasing attention at the preferred γ frequency will limit in time of eye fixation when the speeds that can be sequentially identified can trigger the efferent oculomotor signals at the θ frequency. The critical parsing for speed recognition may be limited to the γ1 range. Low-frequency oscillations have been reported in brain areas related to sustained visual attention [93] and modulation of visual awareness in different time scales. Neural oscillations, ranging from the δ to α frequency range at visual awareness, are linked to cognitive processes, [94]. Hence, the most optimal rates of perceptual and cognitive systems in the child depend on the temporal characteristics related to speed identification but do not necessarily determine the processing of speed motion in the visual system.
4.2. Local Network Measures
The neural network covered from the occipital, temporal, and parietal to the frontal cortex, spanning regions in the lateral occipital (LOR), parieto-occipital (V6), superior temporal (the middle temporal cortex V5/MT+), IPS, lateral part of the intraparietal LIP, V3A/V7, and the superior frontal (SFS) sulci in both brain hemispheres. The low-speed discrimination (θStr,BC) resulted in significant nodes at the cuneus bilaterally at the controls and with a focus on the left cuneus in the post-D, located slightly dorsal to the focus in the primary visual cortex, as well as at the supplementary motor cortex (SMA). Also, the low-speed discrimination yielded significant nodes in the left medial frontal cortex and the right visual area V5/MT+ and MST+ of the controls, as well as the left occipitotemporal cortex in both control and post-D groups. An extensive visual network included early visual areas, MT/V5+, V3A, sensory-motor cortices, as well as inferior frontal regions (IFG) at the left hemisphere for the controls and the right one for the post-D. In the θ-frequency network, the viewing of uniformly low-speed radial textured pattern to almost static flow cue identified nodes at areas MT/V5+, V3A, bilateral cuneus, several regions along with the dorsal extent of the IPS and bilateral nodes of two parietal motion-responsive regions for the controls and post-D, which were significant only in the right hemisphere for the trained dyslexics. The low-speed stimuli recruit θ frequency modulation at occipital and motion-responsive regions MT/V5+, MT/MST, and less at the posterior parietal and occipitotemporal regions of pre-D (θBC). Increasingly nodes in post-D (θ, β2, γ2 Str) at the high-speed discrimination appeared in the frontal cortex than other groups. One site was located in the medial frontal gyrus, one in the middle frontal gyrus. The region along the right dorsal IPS exhibited significant nodes in post-D than pre-D (β2, γ2 Str, high-speed contrast).
At β1 frequency range, the nodes in areas, activated by attention to speed as a right dorsal V3, appeared within the more difficult condition (at low-speed contrast) before training and in the left hemisphere after training. Regions that hubs were observed at the more difficult contrast were localized in the left superior frontal and IFG, the precuneus, left inferior parietal lobule, left post-central, right superior temporal gyri, right temporal, medial temporal lobes bilaterally for the controls, in the controversial hemisphere at the frontal areas for post-D (θStr). For low-speed conditions (θBC), the nodes indicated that the effects of attention to speed were in V3v/V4v, V3d, and V3A/V7 for the controls and post-D, where the V4 was not active in either hemisphere in the pre-D at any frequency range. In addition to V3 bilaterally, right V3A/V7, and left V3v/V4v, the hub was localized adjacent to the left fusiform gyrus for the controls and the post-D (θBC), in the right frontal cortex as well as in the left post-central gyrus for the post-D (θStr,BC), was not present in the pre-D. The MT/V5+ was more active during the slow-speed contrast than in the high-speed for the controls and post-D, and was not present in the pre-D. Only the precuneus (7P) was active for the high-speed contrast in the dyslexics before and after training. There were more hubs at V3A in high-speed contrast than in slow-speed for controls and post-D for all frequency ranges, while it was present in the pre-D only at the low-speed discrimination (β1). Increasing the speed contrast moderately affected V3d, but engaged several non-visual, mostly frontal regions for the controls (θ, low-speed; γ2 high-speed) and the post-D (β2, γ2, high-speed contrast). The oscillation activity of the right dorsolateral and ventrolateral prefrontal cortices increased at the high-speed contrast in both dyslexic groups. The low-speed contrast increased the frequency oscillations of the right middle frontal focus for the post-D and left middle frontal focus for the controls.
Decreased accuracy in the more difficult contrast caused increased node’ number in frontal regions, including a right IFG, a right prefrontal cortices in the post-D due to an increase in the executive activity or attention [95]. With increasing task difficulty, deactivations were observed mostly in left-sided parietal areas in pre-D but increased in the right hemisphere (θStr,BC). These regions did not show a trend of deactivation during high-speed contrast for pre-D compared to the low-speed contrast. The increases in difficulty enhanced the attention effect in the dorsal V3, which is important for all groups. However, the stronger responses in the controls and the post-D could be due to V4 involvement during fine discrimination compared to coarse speed discrimination [96]. Together with the selective response in V5/MT+ (θ-frequency range) for the controls and post-D to the low-speed motion contrast, nodes were observed in the left-side superior and lateral parietal cortices, SMA, and the lateral occipital region as well for the pre-D and post-D groups (β1). The area POs/V6 responded more to complex visual stimulation in the high-speed contrast for the post-D at β2 and γ2-frequencies.
The motion regions in the lateral occipital sulcus (LOs), V3A/V7, MT, POs/V6, and regions in the LIP [97], at the end of the posterior part of the Sylvian fissure, superior frontal sulcus, involve in the flow parsing mechanism due to extracting information for object-motion from motion on the retina by taking out the optic flow components [43]. The images of an object move across the retina during the head movement in synchrony with the head [98]. The children perceived the optic flow cue, almost like a fixed on the screen, as static and the high-speed contrast flow as shifting out the screen. The perception of flow-motion is not simply the result of the motion of the image on the retina or the screen but must be comprehended information for the subject motion. An area, adjacent to the anterior part of the precuneus and the portion of the SPL (IPS/7P, [99]) was involved in the right hemisphere for the controls at the high-speed contrast (β2Str) and the low-speed contrast for the pre-D (β1Str), while only the precuneus was involved for the dyslexic groups at the high-speed contrast (θStr). The cortex between areas V3, the adjacent to the anterior part of the precuneus and the posterior part of the SPL, occupying the anterior bank of POs, with the ventral region on borderline of an area with an occipital pattern and a dorsal part on borderline of an area with a parietal pattern, corresponding to V6Av and V6Ad [100]. The motion area POs/V6 responds to a unidirectional movement [50], coding the motion together with MT, and is sensitive to the flow field [50,101]. It is sensitive to optic flow patterns combined with different, but near-field stimuli cue [102], and only this area among the other motion areas prefer complex visual motion [43]. The area POs/V6 of the post-D (β2, γ2) responded more to the high-speed than to the low-speed flow contrast (β1). At the low-speed (θStr,BC) and high-speed contrasts (γ2Str), only the controls showed hubs in the left hemisphere at the motor area, the overlapped part of the superior frontal gyrus which lies inferior to the motion-sensitive pre-supplementary motor area [43].
The visual flow motion cues stimulated the vestibular cortex, distributed across multiple anatomical structures across the parietal cortex with a boundary between the supramarginal and angular gyri (SMG, AG), strongly connected with the temporal-parietal junction involved the SMG and the STS [103]. Also, along another area, corresponding of the lateral end of the central sulcus and together with the superior temporal cortex was stimulated by visual low-speed flow cue in the right hemisphere for the controls and post-D (θStr, β1Str) and showed strong connections in both hemispheres to the Heschl’s gyrus, precuneus, IPS, parietal cortex, anterior temporal cortex (ATL), and the IFG. These nodes were located in the left hemisphere for pre-training children with dyslexia (θStr,BC, low-speed flow). The high-speed flow involved hubs in STS and Heschl’s gyrus at the left hemisphere of the control at γ2, the post-D at θ and β2-frequencies, and the right hemisphere of the pre-D at the β2.
The motion-sensitive area, located on the LOs is part of the kinetic occipital region [104], overlaps the dorsal area V3 [105]. This area responded significantly to the low-speed flow than to the high-speed flow in both controls and post-D (θ). The motion-sensitive MT+ complex (MT and MST areas) between the inferior temporal and the middle temporal sulci [43] is involved in ego-motion perception [47]. Areas V3A/V7 (low-speed: pre-D, β1right, post-D, β1left; high-speed: post-D, β2right, and controls, γ2right hemisphere) in the ventral part of the posterior IPS likely correspond to the dorsal V3A [43], and posteriorly/laterally to the POs/V6, respond to the flow field stimulation [47,106,107], other type global motions and reconstruction of form from motion [108].
The motion-sensitive region VIP, located along the horizontal segment of the IPS to the ventral part of the IPS and anteriorly to V3A [109] responded more to the low-speed contrast for the controls and post-D (θleft for both groups; β1left for post-D, β1right for controls) than to the high-speed contrast (θright for controls, and γ2right for post-D). While for the pre-D, VIP responded only to the low-speed contrast (β1-frequency in the right hemisphere). The area LIP (BA7/5) in the dorsal part of the IPS connects the horizontal segment and posterior part of IPS, anteriorly to V3A. For the control and pre-D groups, the LIP responded more to the low-speed contrast (pre-D: right-side θ, β1, γ2; controls: θ, β1) than to the high-speed (pre-D: β2both-sides, γ2right; controls: β2right), while for the post-D—more to the high-speed (θleft, γ2right) than to the low-speed contrast (β1left). The region in the superior frontal sulcus (SFS), partially overlaps the superior part of the frontal eye fields (FEF), is responded more to the high-speed than to low-speed contrast for the controls and post-D in θStr, while for the pre-D was involved in both speed-contrasts in the higher frequency range (γ2, low-speed; β2, high-speed). There were nodes adjacent to regions V6, superior parietal lobule (SPL), precuneus, motor area, regions in LOs, LIP, SFS, VIP, V3A/V7, and MT+ that were selected at least one of the speed-motion conditions. The other nodes included areas that were found in specific frequency networks V6+, MT/MST+, SPL, precuneus. Some of these areas may reveal object-motion (MT) from self-induced motion (SFS) during the optical flow cue or both self-motion and object-motion (V6, VIP, LIP, MST+, V3A). These areas were induced by the flow stimulus [43], whereas some of them perceived complex visual stimulation (MST+, V3A).
The motor area is responsible for the head and body movements in space [110], for the self-motion perception, the integration of motion information from visual and vestibular senses [110], and visuospatial attention [111]. The region LOR in LOs, sensitive to a motion of radially moving stimuli [50], is part of the kinetic occipital region [104]. The nodes were observed at this region of the controls and post-D, which discriminated the difference between the two slow-speed motions of the image on the screen, probably due to the self-motion preference of this region as well. The precuneus frequently associates the motion network [112] to egomotion [51], responding to self-motion more than object-motion [43]. The area, adjacent to the anterior precuneus and the portion of the SPL, integrates visual self-motion signals with locomotion movements [43]. The activity of LIP and SFS/FEF, part of the dorsal attention network, is mainly eye-movement/attention-related [97,109,113,114], and differently, modulate at various motion conditions [115]. The motion-sensitive areas in lateral and medial temporoparietal regions, responding to self-motion (LOR), object-motion (MT), and both motions (V6+, V3A, and VIP) are joined in the network of the flow-parsing mechanism, distinguishing the different optic flow’s components [116]. This network provides an internal visual field presentation as interprets correctly the motion and provides a stable perception of the sensory changes induced by the eye and self-movements [52]. The flow parsing-related regions integrated the early visual areas and higher-order regions with different functional properties in the visual motion processing, ego-motion processing with relation to object-motion [44,45]. Independently of actual eye movements [117], the parietal eye fields (PEFs) are involved in the shift of spatial attention even with eye movement constraints [118], as these movements cannot completely be ruled out in motion conditions.
The modulations of early visual areas mediate by synchronized neuronal top-down oscillations [118,119] from the posterior parietal cortex (PPC) with a frequency of 25–45 Hz [120] and those from the prefrontal cortex to the PPC with a frequency range of 22–34 Hz [121]. Top-down oscillations from the PPC to MT and further to V1 [13], which participate in serial visual search, can also be used for speed discrimination as well as for reading [58]. In the low γ range, discrete information from a single object can be identified and processed concurrently in the ventral stream for perceptually binding with a flow cue. Spatial attention in a serial search, directed by FEF with the frontoparietal synchrony, serially activates LIP during object locations and produces each oscillatory γ cycle in LIP, emphasizing one of the locations in the visual field. The shifts of the covert attention were observed through the β2 oscillations in the FEF-PEF at the dyslexics before training (high-speed condition). After training, the frontoparietal network is trained to make a similar serial but spatially sequential switching of top-down focal attention through β1-network (low-speed condition). For the low-speed discrimination, the sampling bandwidth is limited to the frequencies in the range of β1, thus, the parsing flow at the lower frequency range prevents from overloaded the subsequent cognitive processing at the post-D. For top-down modulation, frequencies in the β2-γ1 range (25–45 Hz) are used at the early visual areas and the parietal cortex [120]. It is assumed that flow parsing and visual search depend on oscillations that mediate significant cortical interactions and are locked into a narrow frequency range of the β2 range of the neural synchrony that carries out these interactions. The physiological reasons due to these frequency oscillations are in this relatively narrow range [122] are to facilitate the synchrony within the areas and between the areas [123,124]. In high-speed discrimination, the neuronal oscillations for top-down processing are in the β2-γ2 range, which resonates best with all neuronal circuits that have fast integration times (15, 50 ms). While synchrony within the visual areas may be driven by higher γ frequencies [125], the synchronization between the LIP and the visual areas feedback is slower in the β1-frequency range at the children with dyslexia (low-speed condition). At the controls (high-speed contrast), but not in the pre-D, the feedback from areas MT/MST to the visual areas is mediated by the top-down γ2 frequency network, in which the neural circuitries with resonance properties are embedded. The basic deficit in dyslexics may be either impairment of the gamma sampling or its amplitude, affecting the visual search of flow parsing. A change in amplitude/frequency of the high-frequency oscillations could affect the modulation efficiency of the primary visual area by the top-down feedback. These changes revealed disability in the γ frequencies in the visual areas of dyslexics at the high-speed discrimination.
4.3. Local FEF-PEF Network Measures
The stimulus direction triggered the reflexive saccades and elicited activation of the FEF (BA6/8), supplementary eye field SEF (dorsal medial frontal lobe, rostral supplementary motor area, the premotor cortex, BA6), PEF (BA 39/40), and additionally the dorsolateral prefrontal cortex (DLPFC; BA9 and BA46) by triggered voluntary saccades [126,127]. The FEF, along with the posterior temporoparietal areas, controls pursuit eye movements (PEMs) [128]. The SEF involves in motor programs immediately before the execution of the motor sequence, comprised several successive saccades combined with a body movement. While a more anterior region of SEF is included during the visual sequence of stimuli [126]. The DLPFC is involved in the inhibition of saccades, decisional processes, and short-term spatial memory [126]. DLPFC controls memory-guided saccades when spatial memory is involved during the delay period [126,129].
Nodes at the left FEF and PEF were found in the control (θ, both contrasts) and post-D groups (β1, low-speed; γ2, high-speed condition). However, there were no nodes in the PEF of the pre-D group in contrast with compensatory nodes in FEFs (θ, γ2, low-speed contrast), SEF, and concomitant relative hyperactivity in the dorsolateral prefrontal cortex (θ, high-speed contrast). An imbalance between FEF and PEF (a node only in the PEF) was also observed in the β1-frequency network of the pre-D for low-speed discrimination, which reflected reorganization of functional connectivity. The relation of dopaminergic network reorganization with functional plasticity within the oculomotor network takes advantage of the well-known circuitry in the FEFs (BA6/8) [126] and the PEFs (in BA39/40). The children with dyslexia have shown shifts of FEF vs. PEF nodes in β1-frequency network or imbalance of their node’s distribution in the oculomotor system. This coupled reorganization at a functional level could be related to the basal ganglia with privileged input to FEFs, facilitating or inhibiting the saccade’s executions [129]. The saccades and pursuit eye movements elucidate complex neuropsychological processes related to the processes of attention, spatial memory, motivation, and decision. The dorsolateral prefrontal cortex controls decisional processes [126] for the children with dyslexia at the high-speed discrimination (θ for pre-D; β2 for post-D), governed oculomotor behavior, guided the pursuit eye’s movement control, and unwanted reflexive saccade inhibition. The role of PEF in visual-spatial integration and attention is guided only by β1-frequency networks for the dyslexics before and after training at the low-speed discrimination and for the post-D at high-speed condition by γ-frequencies. The FEF also controls optokinetic nystagmus [130]. The involvement of FEF in the pursuit eye’s movement may be accompanied by the deactivation of areas responsible for the vestibular control [131]. At the brain level, the interactions between the visual and vestibular systems that support the self-motion perception may be reciprocally inhibited. Hyper-activation of FEF was observed for the pre-D (high-speed condition). The control of DLPFC for inhibiting improperly directed saccades to the stimuli probably has not been very effective for a long time at [126] the pre-D during the high-speed discrimination. The activation in the FEF but not in the PEF, confirm that intentional saccades have an early preparation but not the latter only for the pre-training dyslexics (θ, γ2, low-speed; θ, β2, γ2, high-speed contrast). The DLPFC may inhibit the reflexive saccades without involving other cortical areas [132] at the pre-D (high-speed contrast) due to direct involvement of the superior colliculus via a prefrontal-collicular tract [133].
The activation of the PEF is related to visual-spatial integration of the information [134] at the anterior portion of the IPS (limited medially by the SMG, BA40), involved more in eye-hand coordination [135,136,137], and at the posterior part of the SPL involved in attentional processes [136,137,138,139]. The nodes over these areas suggest better eye-hand coordination and attention for the controls and post-training dyslexics. Visual information from the occipital lobe passes over the parietal lobe through the attentional areas in the posterior SPL, the PEF, and the IPL (SMG or AG), which have specific roles in attentional control [126]. The SMG (BA40) is involved during saccades [113] and the AG (BA39)—during reflexive saccades [140]. The parietal-FEF projections are mainly involved in visual fixation [141]. The nodes over the PEF (or an adjacent area), which controlled visuospatial integration were more expressed in the post-D and controls. Therefore, at a delayed response, the transfer of visual information from the PEF to FEF is to accomplish the active fixations at the controls and from the intraparietal areas to the DLPFC is to memorize the short-term spatial events at the post-D. The DLPFC governs decisional processes of oculomotor behavior. It is related to inhibition of reflexive saccades controlled by the PEF or facilitating the triggering of anticipatory saccades controlled by the FEF [126]. There were no nodes at DLPFC for the control group. Probably, the superior colliculus directly exerts the inhibition of reflexive saccades [126]. The pursuit eye movements are controlled by the posterior hemispheric areas, closed to the AG at the temporal-parietal-occipital junction, but also by the FEF [126]. The generators of pursuit eye movements were expressed for the controls and post-training dyslexics but less expressed for the pre-D group.
4.4. Constraints
The juxtaposing of the brain network to the lattice and random models is of particular importance for statistical comparisons of the brain networks. For the brain networks, the validation of some significantly differing measures depends mainly on the metrics of the null models. The metrics of the models are related to the tested hypothesis. The distribution of the degree/power of the real network is widely used in the null models. In different categories (edge level and spectral graph, nodal level, and global level), graph measures of brain networks are statistically compared between healthy and patient groups. The presented metrics, in this study, described integration/segregation and hubness of brain networks. However, in neuroscience, other network metrics could reveal no obvious network differences. This is often an empirical choice. The choice of these measures should be guided by the pathophysiology of the main question in the neuroscience study. The provocation is to apply many metrics that can depict the differences in the graph without missing any information. Some graphical algorithms useful for detecting uncaptured metrics are still limited to graph analysis called non-directed. Broader algorithms with directed/causal functional networks need to be developed.
5. Conclusions
Medial superior temporal area (MST), considered part of the parietal stream, encoded visual-spatial orientation with a direct projection to VIP, area on the lateral part of the IPS. Area VIP was involved in directional and speed selectivity of expansion optic flow (controls, θ low-speed flows). The inferior parietal lobule is involved to distinguish radial optic flow direction (expansion from the center to periphery), which was not existing in either MST or SPL (BA7). Like MST, IPL responded to the speed discrimination. The optic flow selectivity and speed dependence interact at a slow-speed contrast of at expanded optic flows. Unlike MST, the superior temporal cortex STC prefers radial expansion, but not the direction of motion. STC received projections from area MST and SPL. The dorso-caudal part of the SPL (BA5/7), as a subdivision of the somatosensory cortex, sends a direct input to the premotor cortex. The SPL is associated with visual stimuli and participates in the integration of visual-motor signals. Information about the heading movement can be provided from MST and VIP, sensitive to the focus of expansion with respect to the fovea [142]. The motor cortex is one of the optic flow areas and showed a bias for expansion flow for all groups and contrasts. The parietal-frontal circuit is involved in specific sensorimotor transformations. Various other signals are incorporated to successively integrate somatosensory, visual, proprioceptive, and motor eye position information to produce a final motor output. The MT/V5 analyzes the speed and motion direction in the central visual field for the controls and post-D group at low-speed-contrast. While for the high-speed contrast, POs/V6 finds out self-motion across the whole visual field. The periphery of the flow is more emphasized in POs/V6 at low-speed-contrast in β1-network of the pre-D group but not at the high-speed contrast. This supports the hypothesis for the disability of POs/V6 to view the whole visual field. Therefore, the dorsal stream comprises upwards the parietal lobe over the hierarchies from V1 to POs/V6 along with the V1, V3A, MT+, SPL/7A, FEF further down in lateral IPS, does not include POs/V6, MT/MST, and the prefrontal language brain areas (Broca area) of pre-training dyslexics at the high-speed contrast and V5/MT+ at both conditions. The MT+ also includes the medial temporal gyrus (BA21), associated with accessing word meaning while reading. The disability of occipitotemporal gyrus, adjacent to posterior fusiform area and area V4 of the pre-D was also found for the low-speed contrast in the ventral stream at the sequence VI, V2, V3, V4, inferior temporal cortex. The ventral stream starts with simpler features posteriorly in the posterior inferior temporal cortex (including fusiform cortex), sensitive to orientation-selective within a form, and motion direction, object recognition, visual attention, and visual language perception. Then, the ventral stream includes areas with the increased complexity of processing at the anterior temporal cortex to carry out flow recognition, and asymmetrically, tending to the left hemisphere for the other control and post-training groups. Disability in the integration of both dorsal and ventral stream information into motion processes was found at the areas, limited medially by the SMG (BA40), within the anterior part of the IPS, these areas transfer the information between the perceptive and motor systems to control the arm and eye movements in pre-D at the high-speed flow.
A deficit in the orienting of spatial attention at developmental dyslexia is involved in visual hemineglect due to a disorder of the right posterior temporoparietal cortex, usually in the superior temporal region [143] or in the temporoparietal junction (IPL; [144]). Along with deficits in parietal and prefrontal areas, involved in rapid auditory and phonological processing, impairments in the temporoparietal and dorsolateral prefrontal areas are included, engaged in directing and sustaining visual attention. The disruptions of pathways connecting different brain structures as well as deficits in motor and oculomotor coordination coexist with the dysfunctions in the posterior temporoparietal and the prefrontal cortex. That supports the suggestion of developmental dyslexia as a deficit of an extended cortical network [58], which dysfunctions were compensated in the dyslexics after visual training [145,146,147].
Author Contributions
J.D. was responsible for conceiving and designing this study. J.D. was in charge of the surveys and the data acquisition. T.T. designed the computer’ paradigm and analyzed the data. T.T. and J.D. conceived the statistical analysis, wrote and revised the manuscript. J.D. was responsible for the study concept, manuscript preparation, manuscript authorization, obtaining funding support. All authors have read and agreed to the published version of the manuscript.
Funding
This research was funded by the National Science Fund of the Ministry of Education and Science, grant number DN05/14-2016.
Data Availability Statement
The data are not publicly available due to restrictions apply to the availability of these data.
Acknowledgments
The authors would like to express their gratitude to J. Lalova and A. Kalonkina for administering and scoring the psychological tests.
Conflicts of Interest
The authors declare no conflict of interest.
Appendix A
Figure A1.
Electrode positions according to 10/20 (blue color) and 10/10 (white) international systems.
Figure A1.
Electrode positions according to 10/20 (blue color) and 10/10 (white) international systems.


Table A1.
Psychological results of the groups in standard scores.
| 1. DDE-2 Test | Dyslexics mean ± s.d | Controls mean ± s.d |
| 1.1. Word reading | ||
| Accuracy time | 90.6 ± 4.5 91.7 ± 4.8 | 106 ± 5.58 132 ± 0.76 |
| 1.2. Pseudo-word reading | ||
| Accuracy time | 88.3 ± 4.4 96.7 ± 4.1 | 102 ± 4.65 118 ± 0.68 |
| 1.3. Homonyms Accuracy | 98.5 ± 2.4 | 112 ± 4.82 |
| 1.4. Spelling Accuracy | 112 ± 4.45 | 112 ± 1.82 |
| 1.5. Word writing Accuracy | 85.7 ± 4.4 | 115 ± 6.49 |
| 1.6. Pseudo-word writing Accuracy | 91.9 ± 3.9 | 104 ± 4.25 |
| 1.7. Dictation Accuracy | 89.5 ± 3.4 | 112 ± 4.82 |
| 2. Psychometric tests | Dyslexics mean ± s.d | Control mean ± s.d |
| 2.1. Dictation | ||
| Correct sentences | 10.94 ± 4.51 | 21.00 ± 5.85 |
| 2.2. Text reading | ||
| Correct answers | 119.75 ± 7.88 | 129.41 ± 3.43 |
| time (s) | 191.56 ± 149.55 | 104.77 ± 29.00 |
| 2.3. Phological task Without the first sound | ||
| Correct | 5.52 ± 2.04 | 9.20 ± 1.87 |
| time (s) | 62.5 ± 29.4 | 34.86 ± 10.57 |
| 2.4. Phological task Without the last syllable | ||
| Correct answers | 6.15 ± 2.38 | 8.05 ± 2.08 |
| time | 64.84 ± 30.5 | 37.50 ± 8.81 |
| 3. Girolami-Bolinier | ||
| Correct answers | 50.9 ± 9.2 | |
| 4. Raven test | >98 | >98 |
Data are expressed as the mean ± SD. Forty-six children: 25 children with dyslexia (10 boys and 15 girls, age 8.76 ± 0.53 years) and 21 normal children (11 boys and 10 girls, age 8.8 ± 0.36 years) from a second grade of four primary schools located in the urban community of middle-level socio-economic status in Sofia, Bulgaria. The study was conducted in the schools. The children had a normal or corrected-to-normal vision after an examination by an ophthalmologist. All participants in the study spoke Bulgarian as their first language and were right-handed.
Table A2.
Statistics of local graph SWP metrics (strength: Str; betweenness centrality: BC) of functional brain networks of control and dyslexics groups during slow speed of the radial optic flow presentation for frequency: δ, θ, α, β1, β, γ1, γ2 Hz.
Table A2.
Statistics of local graph SWP metrics (strength: Str; betweenness centrality: BC) of functional brain networks of control and dyslexics groups during slow speed of the radial optic flow presentation for frequency: δ, θ, α, β1, β, γ1, γ2 Hz.
| Frequency/Metric | Control | Pre-Dys | Post-Dys | Con/Pre-Dys | Con/Post-Dys | Pre-/Post-Dys | ||||
|---|---|---|---|---|---|---|---|---|---|---|
| hubs | hubs | hubs | p | χ2 | p | χ2 | p | χ2 | ||
| δ | Str | FT9, C3, C5, Pz, P08, O2 | FC3-4, F4, C4, C5, T7, CP2, CP3, PO7 | AF3, F7, FC5, FT10, T7, C3, CP1 | 0.410 | 0.67 | 0.496 | 0.46 | 0.957 | 0.002 |
| BC | F7, FT9, C3, C5, P3 | F7, FC3, FT9-10, C3, T7, PO7 | FC5, C1, T7, AF4, FT10, O2 | 0.726 | 0.12 | 0.466 | 0.53 | 0.648 | 0.20 | |
| θ | Str | FC3, C2, C3, Cz, CP2, CP3, TP8 | C1-2, C3, C5, CP2, Oz | F8, C3, T7, TP7, C6, CP3, O1 | 0.022 | 5.19 | 0.640 | 0.21 | 0.015 | 5.88 |
| BC | Fz, F7, FT9, C3, P7, P08, O1, Oz | Fz, FT9, T7, C2, P08, Oz | F8, FT10, C3, T7, P7, Oz | 0.223 | 1.48 | 0.125 | 2.34 | 0.009 | 6.63 | |
| α | Str | Fz, Cz, Pz, CP3, PO7, PO4 | Fz, Pz, P08, P3, FT10, C4, P8 | Fz, Cz, AF4, CP4, P4, P08 | 0.229 | 1.44 | 0.371 | 0.79 | 0.060 | 3.53 |
| BC | Fz, Cz, P08, T7, TP7, PO4, O2 | FT9, Fz, Pz, P08, T7 FT10, P8 | FT9, Cz, P08, PO3 P4, P8 | 0.188 | 1.73 | 0.834 | 0.04 | 0.359 | 0.83 | |
| β1 | Str | C2, C6, CP2, CP4 | C3, Cz, CP2, CP4, P4, PO4 | Fz, C3, C6, CP1, CP3, PO3 | 0.081 | 3.02 | 0.257 | 1.28 | 0.004 | 7.91 |
| BC | T7, C2, CP2, P8, PO8 | FT9-10, C3, C5, Cz, PO4, P08, O2 | Fz, FT10, T7, C2, C6, CP3, PO3, P8, O1 | 0.131 | 2.27 | 0.447 | 0.57 | 0.028 | 4.79 | |
| β2 | Str | AF3-4, Fz, FC4, CP2, CP3-4, P4 | FC6, C2, C4, C6, CP2, CP4, PO4 | AF3, FC4, C4, C6, CP2, CP4, P4 | 0.378 | 0.77 | 0.398 | 0.71 | 0.906 | 0.01 |
| BC | AF3-4, Fz, TP7, C2, C6, CP2, CP4, P3-4, PO4 | AF3, Fz, FT10, C4, CP4, PO4, PO7 | AF3, Fz, F8, P8, PO4 | 0.233 | 1.41 | 0.209 | 1.57 | 0.802 | 0.06 | |
| γ1 | Str | C2, C4, C6, CP2, CP4, P4 | AF4, F4, FC4, C4, C6, CP2, CP4, P4, P8 | AF3, CP1, C4, C6, CP2, P4 | 0.310 | 1.03 | 0.431 | 0.61 | 0.877 | 0.02 |
| BC | T7, C2, C6, T8, P4 | FT9, T7, C2, CP2, P8 | AF3-4, FC6, C1, CP1, T7, C4, C6,CP2, TP8 | 0.970 | 0.001 | 0.971 | 0.001 | 0.987 | 0.0002 | |
| γ2 | Str | FT9, C1-2, Cz, C3 | F3, F7, FT9, Cz, C2, C3, CP2 | FC3, FT9, C1-2, Cz | 0.0006 | 11.73 | 0.613 | 0.25 | 6.12 × 10⁻⁵ | 16.06 |
| BC | FT9-10, C3, C5, T8, CP2, PO4 | FT9, C2 | FT9, F8, C2, C4, PO4, P8 | 0.330 | 0.947 | 0.831 | 0.04 | 0.256 | 1.28 | |
Table A3.
Statistical comparisons of local graph SWP metrics (strength: Str; betweenness centrality: BC) of functional brain networks of control and dyslexics groups during high speed of the radial optic flow presentation for frequency: δ, θ, α, β1, β2, γ1, γ2 Hz.
Table A3.
Statistical comparisons of local graph SWP metrics (strength: Str; betweenness centrality: BC) of functional brain networks of control and dyslexics groups during high speed of the radial optic flow presentation for frequency: δ, θ, α, β1, β2, γ1, γ2 Hz.
| Frequency/Metric | Control | Pre-Dys | Post-Dys | Con/Pre-Dys | Con/Post-Dys | Pre-/Post-Dys | ||||
|---|---|---|---|---|---|---|---|---|---|---|
| hubs | hubs | hubs | p | χ2 | p | χ2 | p | χ2 | ||
| δ | Str | AF3, FT9-10, CP1, T8, P8, O2 | Fz, F8, FC6, CP2, CP4, P4 | FT9, C1, Pz, CP3, AF4, FC6, C2 | 0.278 | 1.17 | 0.337 | 0.91 | 0.969 | 0.001 |
| BC | F3, F8, C1, Cz | FT9, F8, C1, P07-08, T7, PO3, CP2, O1 | FT9-10, F8, C5 | 0.090 | 2.86 | 0.607 | 0.26 | 0.220 | 1.50 | |
| θ | Str | F3, Fz, FC4, C1, Cz, CP4 | AF4, FC5, FT9, C3-4, C1, Cz, P08, Pz | F3, FC3, F8, TP7, C3, CP1, Pz | 0.011 | 6.33 | 0.636 | 0.22 | 0.002 | 9.47 |
| BC | F3, FT10, Fz, C1-2, P08 | FT9-10, F8, C3-4, C5, P08, Oz | Fz, FT10, C3, CP1, TP7, T8, Pz | 0.226 | 1.46 | 0.813 | 0.05 | 0.306 | 1.04 | |
| α | Str | Cz, C4, CP2, Pz, P4, PO4 | AF4, C5-6, C4, P8 | Fz, FT10, C3, C5, C1, Pz, T7, TP7 | 0.907 | 0.01 | 0.365 | 0.81 | 0.256 | 1.28 |
| BC | AF3, C3, Fz, C1, Cz, P08, T7, PO4 | AF4, Fz, P08, C6, Oz | Fz, FT10, T7, TP7 | 0.044 | 4.05 | 0.056 | 3.65 | 0.929 | 0.007 | |
| β1 | Str | FC3, C2, C3-4, FC4, C6, CP2, CP4, Pz, P4 | C3, C5, FC6, FT10, C2, T8, CP2, P4 | Fz, C1, CP1-2, P4 | 0.878 | 0.02 | 0.549 | 0.35 | 0.494 | 0.466 |
| BC | F7, FC3, C3, Fz, P08, C6, PO4 | FT10, C2, C3, C5, P7 | FT9, Fz, C1, T7, PO4, P08, O2 | 0.850 | 0.03 | 0.935 | 0.01 | 0.671 | 0.179 | |
| β2 | Str | FT10, C2, C4, CP2, P4 | Fz, FC4, C6, CP1-2 | AF4, FC3, FC6, C5, C4, PO4 | 0.025 | 5.02 | 0.004 | 8.16 | 0.427 | 0.630 |
| BC | AF3, FT10, T8, P08, PO4 | AF3, F3, C3, Fz, T7, F8, FC6, CP2 | C5, P7, C4, PO4 | 0.394 | 0.72 | 0.243 | 1.36 | 0.729 | 0.119 | |
| γ1 | Str | AF4, FT10, C4, C6, CP2, CP4 | C3-4, FC4,C6, CP2, CP4, TP8, PO4 | C3, C1, C6, CP2, P4 | 0.491 | 0.47 | 0.693 | 0.15 | 0.772 | 0.083 |
| BC | AF4, FT10, C5, CP2, P7 | AF3, C2, T8, TP8, PO4, P08, O1 | AF3-4, FC4, C1, T7-8, C6, P08 | 0.432 | 0.61 | 0.814 | 0.05 | 0.566 | 0.329 | |
| γ2 | Str | F3, FC3-4, FT9, C1, C3, Cz | F3, FT9, C2, C3, Cz, CP2 | F3, FC3, FT9-10, Cz, CP2, CP4, PO4 | 4.8 × 10⁻⁶ | 20.89 | 0.866 | 0.02 | 2.3 × 10⁻⁶ | 22.36 |
| BC | F7, FT10, C5, T7, PO4, Oz | FT9-10, C1-2, Cz | FT9, C2, C3, CP4 | 0.186 | 1.74 | 0.039 | 4.21 | 0.0009 | 10.99 | |
References
- American Psychiatric Association. Diagnostic and Statistical Manual of Mental Disorders, 5th ed.; American Psychiatric Association Publishing: Washington, DC, USA, 2013. [Google Scholar]
- Livingstone, M.S.; Rosen, G.D.; Drislane, F.W.; Galaburda, A.M. Physiological and anatomical evidence for a magnocellular defect in developmental dyslexia. Proc. Natl. Acad. Sci. USA 1991, 88, 7943–7947. [Google Scholar] [CrossRef] [Green Version]
- Archer, K.; Pammer, K.; Vidyasagar, T.R. A temporal sampling basis for visual processing in developmental dyslexia. Front. Hum. Neurosci. 2020, 14, 213. [Google Scholar] [CrossRef] [PubMed]
- Kristen, P. Temporal sampling in vision and the implications for dyslexia. Front. Hum. Neurosci. 2013, 7, 933. [Google Scholar]
- Rima, S.; Schmid, M.C. V1-bypassing thalamo-cortical visual circuits in blindsight and developmental dyslexia. Curr. Opin. Physiol. 2020, 16, 14–20. [Google Scholar] [CrossRef]
- Demb, J.B.; Boynton, G.M.; Best, M.; Heeger, D.J. Psychophysical evidence for a magnocellular pathway deficit in dyslexia. Vis. Res. 1998, 38, 1555–1559. [Google Scholar] [CrossRef] [Green Version]
- Ramus, F.; Rosen, S.; Dakin, S.C.; Day, B.L.; Castellote, J.M.; White, S.; Frit, U. Theories of developmental dyslexia: Insights from a multiple case study of dyslexic adults. Brain 2003, 126, 841–865. [Google Scholar] [CrossRef] [PubMed] [Green Version]
- Rima, S.; Kerbyson, G.; Jones, E.; Schmid, M.C. Advantage of detecting visual events in the right hemifield is affected by reading skill. Vis. Res. 2020, 169, 41–48. [Google Scholar] [CrossRef]
- Wilmer, J.B.; Richardson, A.J.; Chen, Y.; Stein J., F. Two visual motion processing deficits in developmental dyslexia associated with different reading skills deficits. J. Cogn. Neurosci. 2004, 16, 528–540. [Google Scholar] [CrossRef] [PubMed]
- Stein, J. Dyslexia: The role of vision and visual attention. Curr. Dev. Disord. Rep. 2014, 1, 267–280. [Google Scholar] [CrossRef] [Green Version]
- Vidyasagar T, R.; Pammer, K. Impaired visual search in dyslexia relates to the role of the magnocellular pathway in attention. Neuroreport 1999, 10, 1283–1287. [Google Scholar] [CrossRef]
- Iles, J.; Walsh, V.; Richardson, A. Visual search performance in dyslexia. Dyslexia 2000, 6, 163–177. [Google Scholar] [CrossRef]
- Vidyasagar, T.R. Reading into neuronal oscillations in the visual system: Implications for developmental dyslexia. Front. Hum. Neurosci. 2013, 7, 811. [Google Scholar] [CrossRef] [Green Version]
- Brannan, J.R.; Williams, M.C. Allocation of visual attention in good and poor readers. Percept. Psychophys. 1987, 41, 23–28. [Google Scholar] [CrossRef] [Green Version]
- Geiger, G.; Lettvin, J.Y.; Fahle, M. Dyslexic children learn a new visual strategy for reading: A controlled experiment. Vis. Res. 1994, 34, 1223–1233. [Google Scholar] [CrossRef]
- Richards, G.P.; Samuels, S.J.; Turnure, J.E.; Ysseldyke, J.E. Sustained and selective attention in children with learning disabilities. J. Learn. Disabil. 1990, 23, 129–136. [Google Scholar] [CrossRef]
- Casco, C.; Tressoldi, P.; Dellantonio, A. Visual selective attention and reading efficiency are related in children. Cortex 1998, 34, 531–546. [Google Scholar] [CrossRef]
- Facoetti, A.; Paganoni, P.; Turatto, M.; Marzola, V.; Mascetti, G.G. Visuospatial Attention in developmental dyslexia. Cortex 2000, 36, 109–123. [Google Scholar] [CrossRef]
- Lachmann, T.; Schmitt, A.; Braet, W.; van Leeuwen, C. Letters in the forest: Global precedence TEMPeffect disappears for letters but not for non-letters under reading-like conditions. Front. Psychol. 2014, 5, 705. [Google Scholar] [CrossRef] [Green Version]
- Lachmann, T.; van Leeuwen, C. Reading as functional coordination: Not recycling but a novel synthesis. Front. Psychol. 2014, 5, 1046. [Google Scholar] [CrossRef] [Green Version]
- Förster, J.; Dannenberg, L. GLOMOsys: A systems account of global versus local processing. Psychol. Inq. 2010, 21, 175–197. [Google Scholar] [CrossRef]
- Von Karolyi, C. Visual-spatial strength in dyslexia: Rapid discrimination of impossible figures. J. Learn. Disabil. 2001, 34, 380–391. [Google Scholar] [CrossRef]
- Shany, M.; Breznitz, Z. Rate- and accuracy-disabled subtype profiles among adults with dyslexia in the Hebrew orthography. Dev. Neuropsychol. 2011, 36, 889–913. [Google Scholar] [CrossRef]
- Glodstein-Marcusohn, Y.; Glodfarb, L.; Shany, M. Global and Local Visual Processing in Rate/Accuracy Subtypes of Dyslexia. Front. Psychol. 2020, 11, 828. [Google Scholar]
- Higuchi, H.; Iwaki, S.; Uno, A. Altered visual character and object recognition in Japanese-speaking adolescents with developmental dyslexia. Neurosci. Lett. 2020, 723, 134841. [Google Scholar] [CrossRef] [PubMed]
- Ebrahimi, L.; Pouretemad, H.; Khatibi, A.; Stein, J. Magnocellular based visual motion training improves reading in Persian. Sci. Rep. 2019, 9, 1142. [Google Scholar] [CrossRef] [PubMed]
- Chouake, T.; Levy, T.; Javitt, D.C.; Lavidor, M. Magnocellular training improves visual word recognition. Front. Hum. Neurosci. 2012, 6, 14. [Google Scholar] [CrossRef] [PubMed] [Green Version]
- Lawton, T. Improving dorsal stream function in dyslexics by training figure/ground motion discrimination improves attention, reading fluency, and working memory. Front. Hum. Neurosci. 2016, 10, 397. [Google Scholar] [CrossRef] [Green Version]
- Lawton, T.; Shelley-Tremblay, J. Training on movement figure-ground discrimination remediates low-level visual timing deficits in the dorsal stream, improving high-level cognitive functioning, including attention, reading fluency, and working memory. Front. Hum. Neurosci. 2017, 11, 236. [Google Scholar] [CrossRef] [Green Version]
- Magosso, E.; Cuppini, C.; Bertini, C. Audiovisual rehabilitation in hemianopia: A model-based theoretical investigation. Front. Hum. Neurosci. 2017, 11, 113. [Google Scholar] [CrossRef] [Green Version]
- Cuppini, C.; Ursino, M.; Magosso, E.; Ross, L.A.; Foxe, J.J.; Molholm, S. A computational analysis of neural mechanisms underlying the maturation of multisensory speech integration in neurotypical children and those on the autism spectrum. Front. Hum. Neurosci. 2017, 11, 518. [Google Scholar] [CrossRef] [Green Version]
- Dekker, T.M.; Ban, H.; van der Velde, B.; Sereno, M.I.; Welchman, A.E.; Nardini, M. Late development of cue integration is linked to sensory fusion in cortex. Curr. Biol. 2015, 25, 2856–2861. [Google Scholar] [CrossRef] [PubMed] [Green Version]
- Ursino, M.; Cuppini, C.; Magosso, E. A neural network for learning the meaning of objects and words from a featural representation. Neural Netw. 2015, 63, 234–253. [Google Scholar] [CrossRef] [PubMed]
- Culham, J.; He, S.; Dukelow, S.; Verstraten, F.A. Visual motion and the human brain: What has neuroimaging told us? Acta Psychol. 2001, 107, 69–94. [Google Scholar] [CrossRef]
- Braddick, O.J.; O’Brien, J.M.; Wattam-Bell, J.; Atkinson, J.; Hartley, T.; Turner, R. Brain areas sensitive to coherent visual motion. Perception 2001, 30, 61–72. [Google Scholar] [CrossRef] [PubMed]
- Murakami, I.; Cavanagh, P. Visual jitter: Evidence for visual-motion-based compensation of retinal slip due to small eye movements. Vis. Res. 2001, 41, 173–186. [Google Scholar] [CrossRef] [Green Version]
- Demb, J.B.; Boynton, G.M.; Heeger, D.J. Functional magnetic resonance imaging of early visual pathways in dyslexia. J. Neurosci. 1998, 18, 6939–6951. [Google Scholar] [CrossRef] [PubMed]
- Greenlee, M.W.; Lang, H.-J.; Mergner, T.; Seeger, W. Visual short-term memory of stimulus velocity in patients with unilateral posterior brain damage. J. Neurosci. 1995, 15, 2287–2300. [Google Scholar] [CrossRef]
- Vaina, L.M. Selective impairment of visual motion interpretation following lesions of the right occipito-parietal area in humans. Biol. Cybern. 1989, 61, 347–359. [Google Scholar] [CrossRef]
- Corbetta, M.F.; Miezin, M.; Dobmeyer, S.; Shulman, G.L.; Petersen, S.E. Selective and divided attention during visual discriminations of shape, color, and speed: Functional anatomy by positron emission tomography. J. Neurosci. 1991, 11, 2383–2402. [Google Scholar] [CrossRef] [PubMed]
- Morrone, M.C.; Tosetti, M.; Montanaro, D.; Fiorentini, A.; Cioni, G.; Burr, D.C. A cortical area that responds specifically to optic flow, revealed by fMRI. Nat. Neurosci. 2000, 3, 1322–1328. [Google Scholar] [CrossRef]
- Sunaert, S.; Van Hecke, P.; Marchal, G.; Orban, G.A. Attention to speed of motion, speed discrimination, and task difficulty: An fMRI study. NeuroImage 2000, 11, 612–623. [Google Scholar] [CrossRef] [Green Version]
- Pitzalis, S.; Serra, C.; Sulpizio, V.; Committeri, G.; de Pasquale, F.; Fattori, P.; Galletti, C.; Sepe, R.; Galati, G. Neural bases of self- and object-motion in a naturalistic vision. Hum. Brain Mapp. 2020, 41, 1084–1111. [Google Scholar] [CrossRef] [Green Version]
- Warren, P.A.; Rushton, S.K. Optic flow processing for the assessment of object movement during ego movement. Curr. Biol. 2009, 19, 1555–1560. [Google Scholar] [CrossRef]
- Warren, P.A.; Rushton, S.K. Perception of scene-relative object movement: Optic flow parsing and the contribution of monocular depth cues. Vis. Res. 2009, 49, 1406–1419. [Google Scholar] [CrossRef]
- Tootell, R.B.; Reppas, J.B.; Kwong, K.K.; Malach, R.; Born, R.T.; Brady, T.J.; Rosen, B.R.; Belliveau, J.W. Functional analysis of human MT and related visual cortical areas using magnetic resonance imaging. J. Neurosci. 1995, 15, 3215–3230. [Google Scholar] [CrossRef]
- Pitzalis, S.; Sdoia, S.; Bultrini, A.; Committeri, G.; Di Russo, F.; Fattori, P.; Galati, G. Selectivity to translational egomotion in human brain motion areas. PLoS ONE 2013, 8, e60241. [Google Scholar] [CrossRef] [Green Version]
- Sereno, M.I.; Huang, R.S. A human parietal face area contains aligned head-centered visual and tactile maps. Nat. Neurosci. 2006, 9, 1337–1343. [Google Scholar] [CrossRef] [PubMed]
- Cardin, V.; Smith, A.T. Sensitivity of human visual and vestibular cortical regions to egomotion-compatible visual stimulation. Cereb. Cortex 2010, 20, 1964–1973. [Google Scholar] [CrossRef] [PubMed] [Green Version]
- Pitzalis, S.; Sereno, M.I.; Committeri, G.; Fattori, P.; Galati, G.; Patria, F.; Galletti, C. Human V6: The medial motion area. Cereb. Cortex 2010, 20, 411–424. [Google Scholar] [CrossRef] [PubMed] [Green Version]
- Serra, C.; Galletti, C.; Di Marco, S.; Fattori, P.; Galati, G.; Sulpizio, V.; Pitzalis, S. Egomotion-related visual areas respond to active leg movements. Hum. Brain Mapp. 2019, 40, 3174–3191. [Google Scholar] [CrossRef] [Green Version]
- Galletti, C.; Fattori, P. Neuronal mechanisms for detection of motion in the field of view. Neuropsychologia 2003, 41, 1717–1727. [Google Scholar] [CrossRef]
- Fischer, E.; Bülthoff, H.H.; Logothetis, N.K.; Bartels, A. Visual motion responses in the posterior cingulate sulcus: A comparison to V5/MT and MST. Cereb. Cortex 2012, 22, 865–876. [Google Scholar] [CrossRef]
- De Jong, B.M.; Shipp, S.; Skidmore, B.; Frackowiak, R.S.J.; Zeki, S. The cerebral activity related to the visual perception of forward motion in depth. Brain 1994, 117, 1039–1054. [Google Scholar] [CrossRef] [Green Version]
- Vilhelmsen, K.; van der Weel, F.R.R.; van der Weer, A.L.H. A high-density EEG study of differences between three high speeds of simulated forward motion from optic flow in adult participants. Front. Syst. Neurosci. 2015, 9, 146. [Google Scholar] [CrossRef] [Green Version]
- Wandell, B.A.; Winawer, J. Imaging retinotopic maps in the human brain. Vis. Res. 2011, 51, 718–737. [Google Scholar] [CrossRef] [PubMed] [Green Version]
- Bremmer, F.; Schlack, A.; Shah, N.J.; Zafiris, O.; Kubischik, M.; Hoffmann, K.P.; Fink, G.R. Polymodal motion processing in posterior parietal and premotor cortex. Neuron 2001, 29, 287–296. [Google Scholar] [CrossRef]
- Taskov, T.; Dushanova, J. Reading-network in developmental dyslexia before and after visual training. Symmetry 2020, 12, 1842. [Google Scholar] [CrossRef]
- Raichev, P.; Geleva, T.; Valcheva, M.; Rasheva, M.; Raicheva, M. Chapter: Protokol za nevrologichno I nevropsihologichno izslenvane na detsa sas spetsifichni obuchitelni zatrudneniya. In Protocol on Neurological and Neuropsychological Studies of Children with Specific Learning Disabilities. Integrated Learning and Resource Teacher; Evgenieva, E., Ed.; Publishing House “Dr. Ivan Bogorov”: Sofia, Bulgaria, 2005; pp. 82–105. (In Bulgarian) [Google Scholar]
- Matanova, V.; Todorova, E. DDE-2 Testova bateriya za otsenka na disleksiya na razvitieto—Balgarska adaptatsiya. In DDE-2 Test. Battery for Evaluation of Dyslexia of Development; Sartori, G., Remo, J., Tressoldi, P.E., Matanova, V., Todorova, E., Kolev, M., Eds.; OS Bulgaria Ltd.: Sofia, Bulgaria; Available online: https://www.giuntipsy.bg/bg/prod-19-testova-bateriq-za-ocenka-na-disleksiq-na-razvitieto.htm (accessed on 1 October 2013). (In Bulgarian)
- Sartori, G.; Remo, J.; Tressoldi, P.E. Updated and revised edition for the evaluation of dyslexia. In DDE-2, Battery for the Developmental Dyslexia and Evolutionary Disorders-2, 1995; Giunti, O.S.: Florence, Italy, 2007. [Google Scholar]
- Kalonkina, A.; Lalova, Y. Normative indicators for the test battery for a written speech assessment. In Logopedical Diagnostics (30-38); Tyubele, S., Iossifova, R., Eds.; Rommel Publishing House: Sofia, Bulgaria, 2016. [Google Scholar]
- Raven, J.; Raven, J.C.; Court, J.H. Manual for Raven’s Progressive Matrices and Vocabulary Scales. Section 2: The Coloured Progressive Matrices; Oxford Psychologists Press: Oxford, UK, 1998. [Google Scholar]
- Girolami-Boulinier, A. Contrôle des Aptitudes à la Lecture et àl’Ecriture (CALE); CALE: Paris, Masson, 1985. (In French) [Google Scholar]
- Yakimova, R. Narusheniya na Pismenata rech. Abnormalities of Written Speech; Rommel Publishing House: Sofia, Bulgaria, 2004. (In Bulgarian) [Google Scholar]
- Sun, D.; Roth, S.; Black, M.J. A quantitative analysis of current practices in optical flow estimation and the principles behind them. Int. J. Comput. Vis. 2014, 106, 115–137. [Google Scholar] [CrossRef] [Green Version]
- Sun, D.; Roth, S.; Black, M.J. Secrets of optical flow estimation and their principles. In Proceedings of the 2010 IEEE Computer Society Conference on Computer Vision and Pattern Recognition, San Francisco, CA, USA, 13–18 June 2010; pp. 2432–2439. [Google Scholar]
- Eden, G.; Van Meter, J.; Rumsey, J.; Maisog, J.M.; Woods, R.P.; Zeffiro, T.A. Abnormal processing of visual motion in dyslexia revealed by functional brain imaging. Nature 1996, 382, 66–69. [Google Scholar] [CrossRef]
- Joshi, M.R.; Falkenberg, H.K. Development of radial optic flow pattern sensitivity at different speeds. Vis. Res. 2015, 110, 68–75. [Google Scholar] [CrossRef] [Green Version]
- Dushanova, J.; Christov, M. Auditory event-related brain potentials for an early discrimination between normal and pathological brain aging. Neural Reg. Res. 2013, 8, 1390–1399. [Google Scholar]
- Stam, C.J.; Nolte, G.; Daffertshofer, A. Phase lag index: Assessment of functional connectivity from multi channel EEG and MEG with diminished bias from common sources. Hum. Brain Mapp. 2007, 28, 1178–1193. [Google Scholar] [CrossRef]
- Vinck, M.; Oostenveld, R.; vanWingerden, M.; Battaglia, F.; Pennartz, C.M.A. An improved index of phase-synchronization for electrophysiological data in the presence of volume-conduction, noise and sample-size bias. NeuroImage 2011, 55, 1548–1565. [Google Scholar] [CrossRef] [PubMed]
- Bullmore, E.; Sporns, O. Complex brain networks: Graph theoretical analysis of structural and functional systems. Nat. Rev. Neurosci. 2009, 10, 186–198. [Google Scholar] [CrossRef]
- Rubinov, M.; Sporns, O. Complex network measures of brain connectivity: Uses and interpretations. NeuroImage 2010, 52, 1059–1069. [Google Scholar] [CrossRef] [PubMed]
- Cohen, J.R.; D’Esposito, M. The segregation and integration of distinct brain networks and their relationship to cognition. J. Neurosci. 2016, 36, 12083–12094. [Google Scholar] [CrossRef] [Green Version]
- Onnela, J.P.; Saramäki, J.; Kertész, J.; Kaski, K. Intensity and coherence of motifs in weighted complex networks. Phys. Rev. E 2005, 71, 065103. [Google Scholar] [CrossRef] [PubMed] [Green Version]
- Boccaletti, S.; Latora, V.; Moreno, Y.; Chavez, M.; Hwanga, D.U. Complex networks: Structure and dynamics. Phys. Rep. 2006, 424, 175–308. [Google Scholar] [CrossRef]
- Stam, C.J.; van Straaten, E.C. The organization of physiological brain networks. Clin. Neurophysiol. 2012, 123, 1067–1087. [Google Scholar] [CrossRef] [PubMed]
- Muldoon, S.F.; Bridgeford, E.W.; Bassett, D.S. Small-world propensity and weighted brain networks. Sci. Rep. 2016, 6, 22057. [Google Scholar] [CrossRef] [PubMed]
- Bassett, D.S.; Nelson, B.G.; Mueller, B.A.; Camchong, J.; Lim, K.O. Altered resting state complexity in schizophrenia. NeuroImage 2012, 59, 2196–2207. [Google Scholar] [CrossRef] [PubMed] [Green Version]
- Maris, E.; Oostenveld, R. Nonparametric statistical testing of EEG-and MEG-data. J. Neurosci. Methods 2007, 164, 177–190. [Google Scholar] [CrossRef]
- Mason, D.M.; Newton, M.A. A Rank Statistics Approach to the Consistency of a General Bootstrap. Ann. Statist. 1992, 20, 1611–1624. [Google Scholar] [CrossRef]
- Xia, M.; Wang, J.; He, Y. BrainNet Viewer: A network visualization tool for human brain connectomics. PLoS ONE 2013, 8, e68910. [Google Scholar] [CrossRef] [PubMed] [Green Version]
- Annett, M. A classification of hand preference by association analysis. Br. J. Psychol. 1970, 61, 303–321. [Google Scholar] [CrossRef]
- Dushanova, J.; Lalova, Y.; Kalonkina, A.; Tsokov, S. Speech-Brain Frequency Entrainment of Dyslexia with and without Phonological Deficits. Brain Sci. 2020, 10, 920. [Google Scholar] [CrossRef]
- Koessler, L.; Maillard, L.; Benhadid, A.; Vignal, J.P.; Felblinger, J.; Vespignani, H.; Braun, M. Automated cortical projection of EEG sensors: Anatomical correlation via the international 10-10 system. NeuroImage 2009, 46, 64–72. [Google Scholar] [CrossRef] [PubMed]
- Hülsmann, E.R.M. Traveling cortical netwaves compose a mindstream. bioRxiv 2020, 1–25, Preprint. [Google Scholar]
- Giacometti, P.; Perdue, K.L.; Diamond, S.G. Algorithm to find high density EEG scalp coordinates and analysis of their correspondence to structural and functional regions of the brain. J. Neurosci. Methods 2014, 229, 84–96. [Google Scholar] [CrossRef] [PubMed] [Green Version]
- Schroeder, C.E.; Lakatos, P. The gamma oscillation: Master or slave? Brain Topogr. 2009, 22, 24–26. [Google Scholar] [CrossRef]
- Lobier, M.; Dubois, M.; Valdois, S. The role of cisual processing speed in reading speed development. PLoS ONE 2013, 8, e58097. [Google Scholar] [CrossRef] [Green Version]
- Bosse, M.L.; Tainturier, M.J.; Vadois, S. Developmental dyslexia: The visual attention span deficit hypothesis. Cognition 2007, 104, 198–230. [Google Scholar] [CrossRef] [Green Version]
- Rayner, K. Eye movements in reading and information processing: 20 years of research. Psychol. Bull. 1998, 124, 372–422. [Google Scholar] [CrossRef] [PubMed]
- Busch, N.A.; Van Rullen, R. Spontaneous EEG scillations reveal periodic sampling of visual attention. Proc. Natl. Acad. Sci. USA 2010, 107, 16048–16053. [Google Scholar] [CrossRef] [PubMed] [Green Version]
- Mathewson, K.E.; Prudhomme, C.; Fabiani, M.; Back, D.M.; Lleras, A.; Gratton, G. Making waves in the stream of consciousness: Entraining oscillations in EEG alpha and fluctuations in visual awareness with rhythmic visual stimulation. J. Cogn. Neurosci. 2012, 24, 2321–2333. [Google Scholar] [CrossRef] [PubMed]
- Carlson, S.; Martinkauppi, S.; Rama, P.; Salli, E.; Korvenoja, A.; Aronen, H.J. Distribution of cortical activation during visuospatial n-back tasks as revealed by functional magnetic resonance imaging. Cereb Cortex 1998, 8, 743–752. [Google Scholar] [CrossRef]
- Spitzer, H.; Desimone, R.; Moran, J. Increased attention enhances both behavioral and neuronal performance. Science 1988, 240, 338–340. [Google Scholar] [CrossRef] [Green Version]
- Schluppeck, D.; Curtis, C.E.; Glimcher, P.W.; Heeger, D.J. Sustained activity in topographic areas of human posterior parietal cortex during memory-guided saccades. J. Neurosci. 2006, 26, 5098–5108. [Google Scholar] [CrossRef] [Green Version]
- Koenderink, J.J.; Physics, P. Optic flow. Vis. Res. 2001, 26, 161–179. [Google Scholar] [CrossRef]
- Pandya, D.N.; Seltzer, B. Intrinsic connections and architectonics of posterior parietal cortex in the rhesus monkey. J. Comp. Neurol. 1986, 204, 196–210. [Google Scholar] [CrossRef]
- Luppino, G.; Hamed, S.B.; Gamberini, M.; Matelli, M.; Galletti, C. Occipital (V6) and parietal (V6A) areas in the anterior wall of the parieto-occipital sulcus of the macaque: A cytoarchitectonic study. Eur. J. Neurosci. 2005, 21, 3056–3076. [Google Scholar] [CrossRef]
- Cardin, V.; Hemsworth, L.; Smith, A.T. Adaptation to heading direction dissociates the roles of human MST and V6 in the processing of optic flow. J. Neurophysiol. 2012, 108, 794–801. [Google Scholar] [CrossRef]
- Quinlan, D.J.; Culham, J.C. fMRI reveals a preference for near viewing in the human parieto-occipital cortex. NeuroImage 2007, 36, 167–187. [Google Scholar] [CrossRef]
- Frank, S.M.; Greenlee, M.W. The parieto-insular vestibular cortex in humans: More than a single area? J. Neurophysiol. 2018, 120, 1438–1450. [Google Scholar] [CrossRef] [PubMed] [Green Version]
- Van Oostende, S.; Sunaert, S.; Van Hecke, P.; Marchal, G.; Orban, G.A. The kinetic occipital (KO) region in man: An fMRI study. Cereb. Cortex 1997, 7, 690–701. [Google Scholar] [CrossRef] [Green Version]
- Sereno, M.I.; Dale, A.M.; Reppas, J.B.; Kwong, K.K.; Belliveau, J.W.; Brady, T.J.; Rosen, B.R.; Tootell, R.B.H. Borders of multiple visual areas in humans revealed by functional magnetic resonance imaging. Science 1995, 268, 889–893. [Google Scholar] [CrossRef] [PubMed] [Green Version]
- Arnoldussen, D.M.; Goossens, J.; van den Berg, A.V. Adjacent visual representations of self-motion in different reference frames. Proc. Natl. Acad. Sci. USA 2011, 108, 11668–11673. [Google Scholar] [CrossRef] [Green Version]
- Helfrich, R.F.; Becker, H.G.; Haarmeier, T. Processing of coherent visual motion in topographically organized visual areas in human cerebral cortex. Brain Topogr. 2013, 26, 247–263. [Google Scholar] [CrossRef] [PubMed]
- Orban, G.A.; Sunaert, S.; Todd, J.T.; Van Hecke, P.; Marchal, G. Human cortical regions involved in extracting depth from motion. Neuron 1999, 24, 929–940. [Google Scholar] [CrossRef] [Green Version]
- Sereno, M.I.; Pitzalis, S.; Martinez, A. Mapping of contralateral space in retinotopic coordinates by a parietal cortical area in humans. Science 2001, 294, 1350–1354. [Google Scholar] [CrossRef] [Green Version]
- Frank, S.M.; Wirth, A.M.; Greenlee, M.W. Visual-vestibular processing in the human Sylvian fissure. J. Neurophysiol. 2016, 116, 263–271. [Google Scholar] [CrossRef] [Green Version]
- Gitelman, D.R.; Nobre, A.C.; Parrish, T.B.; LaBar, K.S.; Kim, Y.-H.; Meyer, J.R.; Mesulam, M.-M. A large-scale distributed network for covert spatial attention: Further anatomical delineation based on stringent behavioral and cognitive controls. Brain 1999, 122, 1093–1106. [Google Scholar] [CrossRef] [Green Version]
- Greenlee, M.W.; Frank, S.M.; Kaliuzhna, M.; Blanke, O.; Bremmer, F.; Churan, J.; Cuturi, L.F.; MacNeilage, P.R.; Smith, A.T. Multisensory integration in self motion perception. Multisens. Res. 2016, 29, 525–556. [Google Scholar] [CrossRef] [Green Version]
- Perry, R.J.; Zeki, S. The neurology of saccades and covert shifts in spatial attention. Brain 2000, 123, 2273–2288. [Google Scholar] [CrossRef] [PubMed] [Green Version]
- Astafiev, S.V.; Shulman, G.L.; Stanley, C.M.; Snyder, A.Z.; Van Essen, D.C.; Corbetta, M. Functional organization of human intraparietal and frontal cortex for attending, looking, and pointing. J. Neurosci. 2003, 23, 4689–4699. [Google Scholar] [CrossRef] [Green Version]
- Huang, R.S.; Chen, C.F.; Sereno, M.I. Neural substrates underlying the passive observation and active control of translational egomotion. J. Neurosci. 2015, 35, 4258–4267. [Google Scholar] [CrossRef] [PubMed] [Green Version]
- Colby, C.L.; Duhamel, J.R.; Goldberg, M.E. Ventral intraparietal area of the macaque: Anatomic location and visual response properties. J. Neurophysiol. 1993, 69, 902–914. [Google Scholar] [CrossRef] [PubMed]
- Bisley, J.W.; Goldberg, M.E. Neuronal activity in the lateral intraparietal area and spatial attention. Science 2003, 299, 81–86. [Google Scholar] [CrossRef] [PubMed] [Green Version]
- Field, D.T.; Wilkie, R.M.; Wann, J.P. Neural systems in the visual control of steering. J. Neurosci. 2007, 27, 8002–8010. [Google Scholar] [CrossRef] [PubMed]
- Fries, P. A mechanism for cognitive dynamics: Neuronal communication through neuronal coherence. Trends Cogn. Sci. 2005, 9, 474–480. [Google Scholar] [CrossRef]
- Saalmann, Y.B.; Pigarev, I.N.; Vidyasagar, T.R. Neural mechanisms of visual attention: How top-down feedback highlights relevant locations. Science 2007, 316, 1612–1615. [Google Scholar] [CrossRef]
- Buschman, T.J.; Miller, E.K. Top-down and bottom-up control of attention in the prefrontal and posterior parietal cortices. Science 2007, 315, 1860–1862. [Google Scholar] [CrossRef] [PubMed] [Green Version]
- Buzsáki, G. Rhythms of the Brain; Oxford University Press: New York, NY, USA, 2006. [Google Scholar]
- Hutcheon, B.; Yarom, Y. Resonance, oscillation and the intrinsic frequency preference of neurons. Trends Neurosci. 2000, 23, 216–222. [Google Scholar] [CrossRef]
- Economo, M.N.; White, J.A. Membrane properties and the balance between excitation and inhibition control gamma-frequency oscillations arising from feedback inhibition. PLoS Comput. Biol. 2012, 8, e1002354. [Google Scholar] [CrossRef] [PubMed] [Green Version]
- Eckhorn, R.; Bauer, R.; Jordan, W.; Brosch, M.; Kruse, W.; Munk, M.; Reitboeck, H.J. Coherent oscillations: A mechanism feature linking in the visual cortex. Multiple electrode and correlation analyses in the cat. Biol. Cybern. 1988, 60, 121–130. [Google Scholar] [CrossRef]
- Pierrot-Deseilligny, C.; Milea, D.; Müri, R.M. Eye movement control by the cerebral cortex. Curr. Opin. Neurol. 2004, 17, 17–25. [Google Scholar] [CrossRef]
- Grosbras, M.H.; Lobel, E.; Van de Moortele, P.F.; LeBihan, D.; Berthoz, A. An anatomical landmark for the supplementary eye fields in human revealed with functional magnetic resonance imaging. Cereb. Cortex 1999, 9, 705–711. [Google Scholar] [CrossRef] [Green Version]
- Rosano, C.; Krisky, C.M.; Welling, J.S.; Eddy, W.F.; Lun, A.B.; Thulborn, K.R.; Sweeney, J.A. Pursuit and saccadic eye movement subregions in human frontal eye field: A high-resolution fMRI investigation. Cereb. Cortex 2002, 12, 107–115. [Google Scholar] [CrossRef] [Green Version]
- Müri, R.M.; Iba-Zizen, M.T.; Derosier, C.; Cabanis, E.A.; Pierrot-Deseillign, C. Location of the human posterior eye field with functional magnetic resonance imaging. J. Neurol. Neurosurg. Psychiatry 1996, 60, 445–448. [Google Scholar] [CrossRef] [PubMed] [Green Version]
- Dieterich, M.; Bucher, S.F.; Seelos, K.C.; Brandt, T. Horizontal or vertical optokinetic stimulation activates visual motion-sensitive, ocular motor and vestibular cortex areas with right hemispheric dominance. An fMRI study. Brain 1998, 121, 1479–1495. [Google Scholar] [CrossRef] [Green Version]
- Dieterich, M.; Bense, S.; Stephan, T.; Yousry, T.A.; Brandt, T. FMRI signal increases and decreases in cortical areas during small-field optokinetic stimulation and central fixation. Exp. Brain Res. 2003, 148, 117–127. [Google Scholar] [CrossRef] [PubMed]
- Pierrot-Deseilligny, C.; Rivaud, S.; Gaymard, B.; Agid, Y. Cortical control of reflexive visually guided saccades. Brain 1991, 114, 1473–1485. [Google Scholar] [CrossRef] [PubMed]
- Rivaud, S.; Müri, R.M.; Gaymard, B.; Vermersch, A.I.; Pierrot-Deseilligny, C. Eye movement disorders after frontal eye field lesions in humans. Exp. Brain Res. 1994, 102, 110–120. [Google Scholar] [CrossRef] [PubMed]
- Gaymard, B.; François, C.; Ploner, C.J.; Condy, C.; Rivaud-Péchoux, S. A direct prefrontotectal tract against distractibility in the human brain. Ann. Neurol. 2003, 53, 542–545. [Google Scholar] [CrossRef]
- Brotchie, P.R.; Lee, M.B.; Chen, D.Y.; Lourensz, M.; Jackson, G.; Bradley, W.G., Jr. Head position modulates activity in the human parietal eye fields. NeuroImage 2003, 18, 178–184. [Google Scholar] [CrossRef]
- Kawashima, R.; Naitoh, E.; Matsumara, M.; Ono, S.; Satoh, K.; Gotoh, R.; Koyama, M.; Inoue, K.; Yoshioka, S.; Fukuda, H. Topographic representation in human intraparietal sulcus of reaching and saccade. NeuroReport 1996, 7, 1253–1256. [Google Scholar] [CrossRef]
- Simon, O.; Mangin, J.F.; Cohen, L.; Bihan, D.L.; Dehaene, S. Topographical layout of hand, eye, calculation and language-related areas in the human parietal lobe. Neuron 2002, 33, 475–487. [Google Scholar] [CrossRef] [Green Version]
- De Souza, J.F.X.; Dukelow, S.P.; Gati, J.S.; Menon, R.S.; Andersen, R.A.; Vilis, T. Eye position signal modulates a human parietal pointing region during memory-guided movements. J. Neurosci. 2000, 20, 5835–5840. [Google Scholar] [CrossRef] [Green Version]
- Macaluso, E.; Driver, J.; Frith, C.D. Multimodal spatial representations engaged in human parietal cortex during both saccadic and manual spatial orienting. Curr. Biol. 2003, 13, 990–999. [Google Scholar] [CrossRef] [Green Version]
- Yantis, S.; Schwarzbach, J.; Serences, J.T.; Carlson, R.L.; Steinmetz, M.A.; Pekar, J.J.; Courtney, S.M. Transient neural activity in human parietal cortex during spatial attention shifts. Nat. Neurosci. 2002, 5, 995–1002. [Google Scholar] [CrossRef]
- Mort, D.J.; Perry, R.J.; Mannan, S.K.; Kmannan, S.; Hodgson, T.L.; Anderson, E.; Quest, R.; McRobbie, D.; McBride, A.; Husain, M.; et al. Differential cortical activation during voluntary and reflexive saccades in man. NeuroImage 2003, 18, 231–246. [Google Scholar] [CrossRef]
- Raffi, M.; Carrozzini, C.; Maioli, M.G.; Squatrito, S. Multimodal representation of optic flow in area PEc of macaque monkey. Neuroscience 2010, 171, 1241–1255. [Google Scholar] [CrossRef]
- Pisella, L.; Berberovic, N.; Mattingley, J.B. Impaired working memory for location but not for colour or shape in visual neglect: A comparison of parietal and non-parietal lesions. Cortex 2004, 40, 379–390. [Google Scholar] [CrossRef]
- Vallar, G.; Perani, D. The anatomy of unilateral neglect after right-hemisphere stroke lesions. A clinical/CT-scan correlation study in man. Neuropsychologia 1986, 24, 609–622. [Google Scholar] [CrossRef]
- Saleh, R.; Alias, N.A. Learner Needs Analysis for Mobile Learning Comic Application among Dyslexic Children. Int. J. Educ. Inf. Technol. 2012, 6, 185–192. [Google Scholar]
- Rahman, F.A.; Mokhtar, F.; Alias, N.A.; Saleh, R. Multimedia Elements as Instructions for Dyslexic Children. Int. J. Educ. Inf. Technol. 2012, 6, 193–200. [Google Scholar]
- Pistoia, M.; Pinnelli, S.; Borrelli, G. Use of a robotic platform in dyslexia-affected pupils: The ROBIN project experience. Int. J. Educ. Inf. Technol. 2015, 9, 46–49. [Google Scholar]
Figure 1.
The graphs of significantly different frequency networks at the low-speed condition. The nodes covered the EEG sensors. The hubs are the nodes with black color. The links are the most important links: (A, 1st graph) Hubs (strength) in the θ-network at the slow-speed condition of controls: FC3, C2, C3, Cz, CP2, CP3, TP8; (A, 2nd graph) of pre-D: C1-2, C3, C5, CP2, Oz; (A, 3rd graph) of post-D: F8, C3, T7, TP7, C6, CP3, O1; (B, 1st graph) Hubs (BC) in the θ-network of controls: Fz, F7, FT9, C3, P7, P08, O1, Oz; (B, 2nd graph) of pre-D: Fz, FT9, T7, C2, P08, Oz; (B, 3rd graph) of post-D: F8, FT10, C3, T7, P7, Oz. (C, 1st graph) Hubs (str) in the β1-network of controls: C2, C6, CP2, CP4; (C, 2nd graph) of pre-D: C3, Cz, CP2, CP4, P4, PO4; (C, 3rd graph) of post-D: Fz, C3, C6, CP1, CP3, PO3. (D, 1st graph) Hubs (Str) in the γ2-network of controls: FT9, C1-2, Cz, C3; (D, 2nd graph) of pre-D: F3, F7, FT9, C2, C3, Cz, CP2; (D, 3rd graph) of post-D: FC3, FT9, C1-2, Cz.

Figure 2.
The graphs of significantly different frequency networks at the high-speed condition. (A, 1st graph) Hubs (strength) in the θ-network of controls: F3, Fz, FC4, C1, Cz, CP4; (A, 2nd graph) θ-network of pre-D: AF4, FC5, FT9, C3-4, C1, Cz, Pz, P08; (A, 3rd graph) θ-network of post-D: F3, FC3, F8, TP7, C3, CP1,Pz; (B, 1st graph) Hubs (strength) in the β2-network of controls: FT10, C2, C4, CP2, P4; (B, 2nd graph) β2-network of pre-D: Fz, FC4, C6, CP1-2; (B, 3rd graph) β2-network of post-D: AF4, FC3, FC6, C5, C4, PO4. (C, 1st graph) Hubs (strength) in the γ2-network of controls: F3, FC3-4, FT9, C1, C3, Cz; (C, 2nd graph) γ2-network of pre-D: F3, FT9, C2, C3, Cz, CP2; (C, 3rd graph) γ2-network of post-D: F3, FC3, FT9-10, Cz, CP2, CP4, PO4. (D, 1st graph) Hubs (BC) in the γ2-network for controls: F7, C5, T7, FT10, PO4, Oz; (D, 2nd graph) of pre-D: FT9-10, C1-2, Cz; (D, 3rd graph) γ2-network of post-D: FT9, C2, C3, CP4.

Table 1.
Statistical comparisons of the behavioral parameters.
| Success/RT | Con | Pre-D | Post-D | Con/Pre-D | Con/Post-D | Pre-/Post-D | |||
|---|---|---|---|---|---|---|---|---|---|
| (%), (s) | mean ± s.e. | mean ± s.e. | mean ± s.e. | p | χ2 | p | χ2 | p | χ2 |
| 1. slow | 72.5 ± 3.1 | 60.8 ± 3.9 | 75.3 ± 5.6 | 0.02 | 5.83 | 0.94 | 0.004 | 0.01 | 6.07 |
| RT | 1.14 ± 0.023 | 1.56 ± 0.05 | 1.64 ± 0.05 | <0.0001 | 41.38 | <0.001 | 34.4 | 0.441 | 0.59 |
| 2. fast | 76.3 ± 2.9 | 61 ± 3.84 | 78.3 ± 2.8 | 0.0004 | 16.32 | 0.74 | 0.05 | 0.0001 | 19.02 |
| RT | 1.13 ± 0.024 | 1.44 ± 0.03 | 1.66 ± 0.08 | 0.004 | 7.90 | <0.001 | 19.8 | <0.0001 | 21.44 |
Table 2.
Statistics of the global metrics (mean ± s.e.; ϕ; ΔC; ΔL) of the brain networks of the groups (Con, pre-D, post-D) during the slow-speed contrast of the radial flow for frequency bands: δ, θ, α, β1, β2, γ1, γ2 Hz.
Table 2.
Statistics of the global metrics (mean ± s.e.; ϕ; ΔC; ΔL) of the brain networks of the groups (Con, pre-D, post-D) during the slow-speed contrast of the radial flow for frequency bands: δ, θ, α, β1, β2, γ1, γ2 Hz.
| Frequency/Metric | Con | Pre-D | Post-D | Con/Pre-D | Con/Post-D | Pre-/Post-D | ||||
|---|---|---|---|---|---|---|---|---|---|---|
| p | χ2 | p | χ2 | p | χ2 | |||||
| δ | ϕ | 0.583 ± 0.016 | 0.611 ± 0.014 | 0.590 ± 0.018 | 0.191 | 1.70 | 0.529 | 0.39 | 0.440 | 0.59 |
| ΔC | 0.497 ± 0.031 | 0.413 ± 0.025 | 0.473 ± 0.034 | 0.039 | 4.22 | 0.459 | 0.54 | 0.292 | 1.11 | |
| ΔL | 0.234 ± 0.020 | 0.273 ± 0.019 | 0.264 ± 0.017 | 0.257 | 1.27 | 0.096 | 2.76 | 0.523 | 0.40 | |
| θ | ϕ | 0.506 ± 0.011 | 0.540 ± 0.010 | 0.514 ± 0.013 | 0.035 | 4.40 | 0.858 | 0.03 | 0.081 | 3.03 |
| ΔC | 0.667 ± 0.019 | 0.594 ± 0.017 | 0.660 ± 0.021 | 0.008 | 7.03 | 0.793 | 0.06 | 0.020 | 5.40 | |
| ΔL | 0.141 ± 0.008 | 0.185 ± 0.011 | 0.145 ± 0.008 | 0.003 | 8.48 | 0.464 | 0.53 | 0.048 | 3.89 | |
| α | ϕ | 0.478 ± 0.009 | 0.512 ± 0.008 | 0.510 ± 0.011 | 0.006 | 7.34 | 0.039 | 4.21 | 0.751 | 0.10 |
| ΔC | 0.724 ± 0.014 | 0.653 ± 0.014 | 0.670 ± 0.019 | 0.0009 | 11.00 | 0.043 | 4.05 | 0.352 | 0.86 | |
| ΔL | 0.106 ± 0.005 | 0.136 ± 0.010 | 0.115 ± 0.006 | 0.276 | 1.18 | 0.302 | 1.06 | 0.961 | 0.002 | |
| β1 | ϕ | 0.460 ± 0.008 | 0.497 ± 0.008 | 0.435 ± 0.008 | 0.010 | 6.57 | 0.020 | 5.33 | 6.65 × 10⁻⁶ | 20.29 |
| ΔC | 0.755 ± 0.012 | 0.690 ± 0.014 | 0.789 ± 0.014 | 0.007 | 7.18 | 0.017 | 5.68 | 3.18 × 10⁻⁶ | 21.71 | |
| ΔL | 0.077 ± 0.004 | 0.102 ± 0.006 | 0.064 ± 0.006 | 0.024 | 5.09 | 0.006 | 7.47 | 4.96 × 10⁻⁶ | 20.85 | |
| β2 | ϕ | 0.447 ± 0.007 | 0.494 ± 0.007 | 0.434 ± 0.007 | 2.02 × 10⁻⁵ | 18.17 | 0.310 | 1.02 | 4.96 × 10⁻⁷ | 25.28 |
| ΔC | 0.775 ± 0.011 | 0.694 ± 0.012 | 0.794 ± 0.011 | 4.06 × 10⁻⁵ | 21.23 | 0.291 | 1.11 | 7.95 × 10⁻⁸ | 28.81 | |
| ΔL | 0.067 ± 0.004 | 0.100 ± 0.007 | 0.059 ± 0.004 | 0.008 | 6.82 | 0.278 | 1.17 | 0.0002 | 13.55 | |
| γ1 | ϕ | 0.479 ± 0.008 | 0.540 ± 0.009 | 0.481 ± 0.009 | 1.13 × 10⁻⁵ | 19.27 | 0.927 | 0.008 | 5.45 × 10⁻⁵ | 16.28 |
| ΔC | 0.721 ± 0.013 | 0.618 ± 0.014 | 0.721 ± 0.015 | 4.44 × 10⁻⁶ | 21.06 | 0.963 | 0.002 | 1. 2 × 10⁻⁵ | 19.16 | |
| ΔL | 0.104 ± 0.006 | 0.136 ± 0.007 | 0.093 ± 0.005 | 0.006 | 7.45 | 0.377 | 0.77 | 0.0004 | 12.34 | |
| γ2 | ϕ | 0.484 ± 0.013 | 0.475 ± 0.011 | 0.484 ± 0.012 | 0.262 | 1.25 | 0.951 | 0.003 | 0.242 | 1.36 |
| ΔC | 0.432 ± 0.024 | 0.488 ± 0.022 | 0.476 ± 0.027 | 0.066 | 3.36 | 0.178 | 1.81 | 0.643 | 0.21 | |
| ΔL | 0.442 ± 0.026 | 0.385 ± 0.021 | 0.406 ± 0.024 | 0.061 | 3.50 | 0.660 | 0.192 | 0.173 | 1.84 | |
Table 3.
Statistics of the global metrics (mean ± s.e.) of the brain networks of the groups during high-speed contrast of the radial flow for frequency bands: δ, θ, α, β1, β2, γ1, γ2 Hz.
Table 3.
Statistics of the global metrics (mean ± s.e.) of the brain networks of the groups during high-speed contrast of the radial flow for frequency bands: δ, θ, α, β1, β2, γ1, γ2 Hz.
| Frequency/Metric | Con | Pre-D | Post-D | Con/Pre-D | Con/Post-D | Pre-/Post-D | ||||
|---|---|---|---|---|---|---|---|---|---|---|
| p | χ2 | p | χ2 | p | χ2 | |||||
| δ | ϕ | 0.625 ± 0.020 | 0.653 ± 0.015 | 0.647 ± 0.019 | 0.631 | 0.23 | 0.656 | 0.19 | 0.293 | 1.10 |
| ΔC | 0.389 ± 0.045 | 0.415 ± 0.026 | 0.383 ± 0.034 | 0.576 | 0.31 | 0.958 | 0.002 | 0.462 | 0.54 | |
| ΔL | 0.273 ± 0.021 | 0.267 ± 0.019 | 0.258 ± 0.020 | 0.294 | 1.09 | 0.381 | 0.76 | 0.652 | 0.20 | |
| θ | ϕ | 0.517 ± 0.014 | 0.538 ± 0.011 | 0.522 ± 0.013 | 0.181 | 1.78 | 0.758 | 0.09 | 0.294 | 1.09 |
| ΔC | 0.653 ± 0.023 | 0.614 ± 0.018 | 0.646 ± 0.021 | 0.163 | 1.93 | 0.778 | 0.07 | 0.251 | 1.31 | |
| ΔL | 0.137 ± 0.011 | 0.161 ± 0.009 | 0.148 ± 0.009 | 0.049 | 3.84 | 0.334 | 0.93 | 0.440 | 0.59 | |
| α | ϕ | 0.509 ± 0.009 | 0.534 ± 0.010 | 0.462 ± 0.010 | 0.145 | 2.11 | 0.0006 | 11.57 | 2.24 × 10⁻⁶ | 22.37 |
| ΔC | 0.670 ± 0.016 | 0.635 ± 0.015 | 0.746 ± 0.015 | 0.153 | 2.03 | 0.0007 | 11.35 | 1.90 × 10⁻⁶ | 22.68 | |
| ΔL | 0.126 ± 0.008 | 0.130 ± 0.006 | 0.103 ± 0.006 | 0.421 | 0.64 | 0.060 | 3.51 | 0.002 | 9.34 | |
| β1 | ϕ | 0.487 ± 0.010 | 0.492 ± 0.009 | 0.446 ± 0.007 | 0.912 | 0.01 | 0.005 | 7.75 | 0.003 | 8.43 |
| ΔC | 0.712 ± 0.016 | 0.701 ± 0.014 | 0.773 ± 0.012 | 0.897 | 0.02 | 0.004 | 8.09 | 0.002 | 9.42 | |
| ΔL | 0.089 ± 0.006 | 0.091 ± 0.006 | 0.075 ± 0.005 | 0.987 | 0.0002 | 0.294 | 1.09 | 0.223 | 1.48 | |
| β2 | ϕ | 0.455 ± 0.009 | 0.498 ± 0.009 | 0.438 ± 0.009 | 0.003 | 8.65 | 0.110 | 2.55 | 9.42 × 10⁻⁷ | 24.04 |
| ΔC | 0.762 ± 0.014 | 0.689 ± 0.015 | 0.791 ± 0.013 | 0.002 | 8.94 | 0.09 | 2.77 | 5.74 × 10⁻⁷ | 24.99 | |
| ΔL | 0.071 ± 0.005 | 0.089 ± 0.007 | 0.056 ± 0.003 | 0.155 | 2.02 | 0.152 | 2.04 | 0.003 | 8.46 | |
| γ1 | ϕ | 0.512 ± 0.009 | 0.532 ± 0.010 | 0.491 ± 0.009 | 0.373 | 0.79 | 0.099 | 2.71 | 0.011 | 6.43 |
| ΔC | 0.672 ± 0.015 | 0.623 ± 0.017 | 0.704 ± 0.015 | 0.242 | 1.36 | 0.078 | 3.08 | 0.003 | 8.46 | |
| ΔL | 0.117 ± 0.006 | 0.133 ± 0.010 | 0.103 ± 0.006 | 0.801 | 0.06 | 0.032 | 4.56 | 0.087 | 2.92 | |
| γ2 | ϕ | 0.492 ± 0.012 | 0.484 ± 0.012 | 0.502 ± 0.012 | 0.525 | 0.40 | 0.673 | 0.177 | 0.253 | 1.30 |
| ΔC | 0.399 ± 0.024 | 0.462 ± 0.026 | 0.479 ± 0.025 | 0.105 | 2.62 | 0.021 | 5.25 | 0.778 | 0.07 | |
| ΔL | 0.453 ± 0.026 | 0.392 ± 0.023 | 0.374 ± 0.023 | 0.131 | 2.26 | 0.075 | 3.16 | 0.850 | 0.03 | |
Publisher’s Note: MDPI stays neutral with regard to jurisdictional claims in published maps and institutional affiliations. |
© 2021 by the authors. Licensee MDPI, Basel, Switzerland. This article is an open access article distributed under the terms and conditions of the Creative Commons Attribution (CC BY) license (https://creativecommons.org/licenses/by/4.0/).
Share and Cite
MDPI and ACS Style
Taskov, T.; Dushanova, J. Functional Connectivity in Developmental Dyslexia during Speed Discrimination. Symmetry 2021, 13, 749. https://0-doi-org.brum.beds.ac.uk/10.3390/sym13050749
AMA Style
Taskov T, Dushanova J. Functional Connectivity in Developmental Dyslexia during Speed Discrimination. Symmetry. 2021; 13(5):749. https://0-doi-org.brum.beds.ac.uk/10.3390/sym13050749
Chicago/Turabian StyleTaskov, Tihomir, and Juliana Dushanova. 2021. "Functional Connectivity in Developmental Dyslexia during Speed Discrimination" Symmetry 13, no. 5: 749. https://0-doi-org.brum.beds.ac.uk/10.3390/sym13050749
Note that from the first issue of 2016, this journal uses article numbers instead of page numbers. See further details here.