
Pseudo-Laminarization of Mixed Microbubble Water and Complex Fluids in Capillary Flows


1
Graduate School of Science and Technology, Niigata University, Niigata 950-2181, Japan
2
Faculty of Engineering, Institute of Science and Technology, Niigata University, Niigata 950-2181, Japan
3
Center for Transdisciplinary Research, Institute for Research Promotion, Niigata University, Niigata 950-2181, Japan
*
Author to whom correspondence should be addressed.
†
These authors contributed equally to this work.
Symmetry 2021, 13(7), 1141; https://0-doi-org.brum.beds.ac.uk/10.3390/sym13071141
Submission received: 28 May 2021
/
Revised: 22 June 2021
/
Accepted: 23 June 2021
/
Published: 25 June 2021
(This article belongs to the Special Issue Symmetry in Fluid Flow II)
Abstract
:Symmetry in fluid flow is determined by external factors such as magnetic or electric fields. Owing to the electrical properties of fluids, liquids containing fine bubble or ionic surfactant molecules differ from the normal fluid flow. Therefore, the pressure drop and frictional coefficient in a pipe are measured and estimated for water alone, for mixed microbubble water (MB), and for complex fluids (anionic surfactant solution and polymer solution) in capillary flow with constant flow rate. For water alone, good agreement is obtained between the experimental and theoretical values for laminar Hagen–Poiseuille flow and the Blasius expression in turbulent flow. For the MB, pseudo-laminarization is suggested up to a Reynolds number of . Both the anionic surfactant solution and the polymer solution exhibit the same tendency as that of the MB. In explaining these behaviors, elasticity and electrical interaction are discussed, and electrical interaction on the capillary wall is strongly suggested to be a contributing factor. Additionally, surface tension is investigated and supports the discussion.
1. Introduction
Active matter is a general term for non-equilibrium systems consisting of elements that move spontaneously and is known as the collective movement of birds and fish and the underwater movement of microorganisms. Active matter has been actively studied in a crossover manner between physics, chemistry, biology, and other fields [1]. It has been pointed out that there is an antisymmetric viscosity even in fluids containing micromachines that break the time reversal symmetry [2]. In these studies, the effects of magnetic and electric fields have been reported [3]. On the other hand, fine bubbles or ionic surfactant molecules in liquids are charged electrically. Therefore, phenomena different from normal fluids could occur. Recently, many studies involving microbubbles (average particle diameter less than 100 ) have attracted attention. For example, microbubbles have been applied to aquaculture and growth promotion in fisheries and agriculture [4,5,6]; they have been used to improve water quality (purification effect) in environmental and civil engineering [7,8,9,10]; and they have been used for cleaning [11,12,13], sterilization [14,15,16], and drag reduction [17,18,19,20,21] in industrial applications. Kodama et al. developed a technology to reduce frictional resistance by injecting air bubbles into the wall of a ship [17], but they used millimeter-sized bubbles. Serizawa et al. reported that mixed microbubble water (hereinafter referred to simply as MB) in a vertical pipe exhibited pressure loss in the turbulent region (Reynolds number ) that was reduced by several percent [18]. They measured the frictional coefficient of MB in a vertical pipe and found pseudo-laminarization that almost coincided with the theoretical value for laminar flow, that is,
up to . However, the mechanism for that pseudo-laminarization by microbubbles was unclear. In the above studies, the characteristic length was measured in millimeters. These findings were a very useful in fluid transport. On the other hand, it was possible to fabricate micro-sized flow fields with high accuracy due to MEMS technology. However, there is limited knowledge on fluid transport in small-sized flow fields (≤1.0 ). Meanwhile, Ushida et al. reported pseudo-laminarization by adding micellar solutions and dilute polymer solutions [22,23], and they reported that the rheological properties (first normal stress differences) exhibited pseudo-laminarization. However, pseudo-laminarization by microbubble mixtures without rheological properties must be considered from a different perspective. In the present study, water alone, MB, a surfactant solution, and a polymer solution flowed through narrow tubes with inner diameters of 110–750 , and the pressure drop was measured to estimate the frictional coefficient at constant flow rate. The purpose of this study is to clarify the mechanism of pseudo-laminarization by microbubbles.
2. Test Fluids
In this study, four types of test fluids were used: deionized water (electric conductivity = 0.055 ; hereinafter referred to simply as water) produced using a distillation apparatus (RFD240NC; ADVANTEC Co., Ltd., Japan), MB, an anionic surfactant solution (sodium dodecyl sulfate, hereinafter referred to simply as SDS; molecular weight = 288; Wako Pure Chemical Industries, Ltd., Japan), and a polymer solution (polyacrylamide, hereinafter referred to simply as PAA; molecular weight = ; Wako Pure Chemical Industries, Ltd.). The void fraction is very important for MB, so it was measured after 5 min of operation of the commercial microbubble generator (OM1-C200; Aura Tech Co., Ltd., Japan) under the following procedure. Microbubbles were generated in 5.0 of water in a glass beaker, and the resulting MB was then left at room temperature (22 C for 60 ); the apparent void fraction, calculated from the decrease in volume, was 0.16 ± 0.1% (number of trials = 10). Moreover, in a previous study, we showed the lifetime of microbubbles [24]. In the case of the present MB, the particle diameter decreased gradually with elapsed time from an initial mean diameter of 42 , and self-collapse was confirmed. It could also be seen that self-collapse occurred within a net time of 130 . The SDS and PAA were used in the concentrations of 1.0 and 0.10 wt%, respectively. With a concentration (1.0 wt%) greater than the critical micelle concentration (CMC = 0.12 wt%), the SDS formed spherical micelles in water.
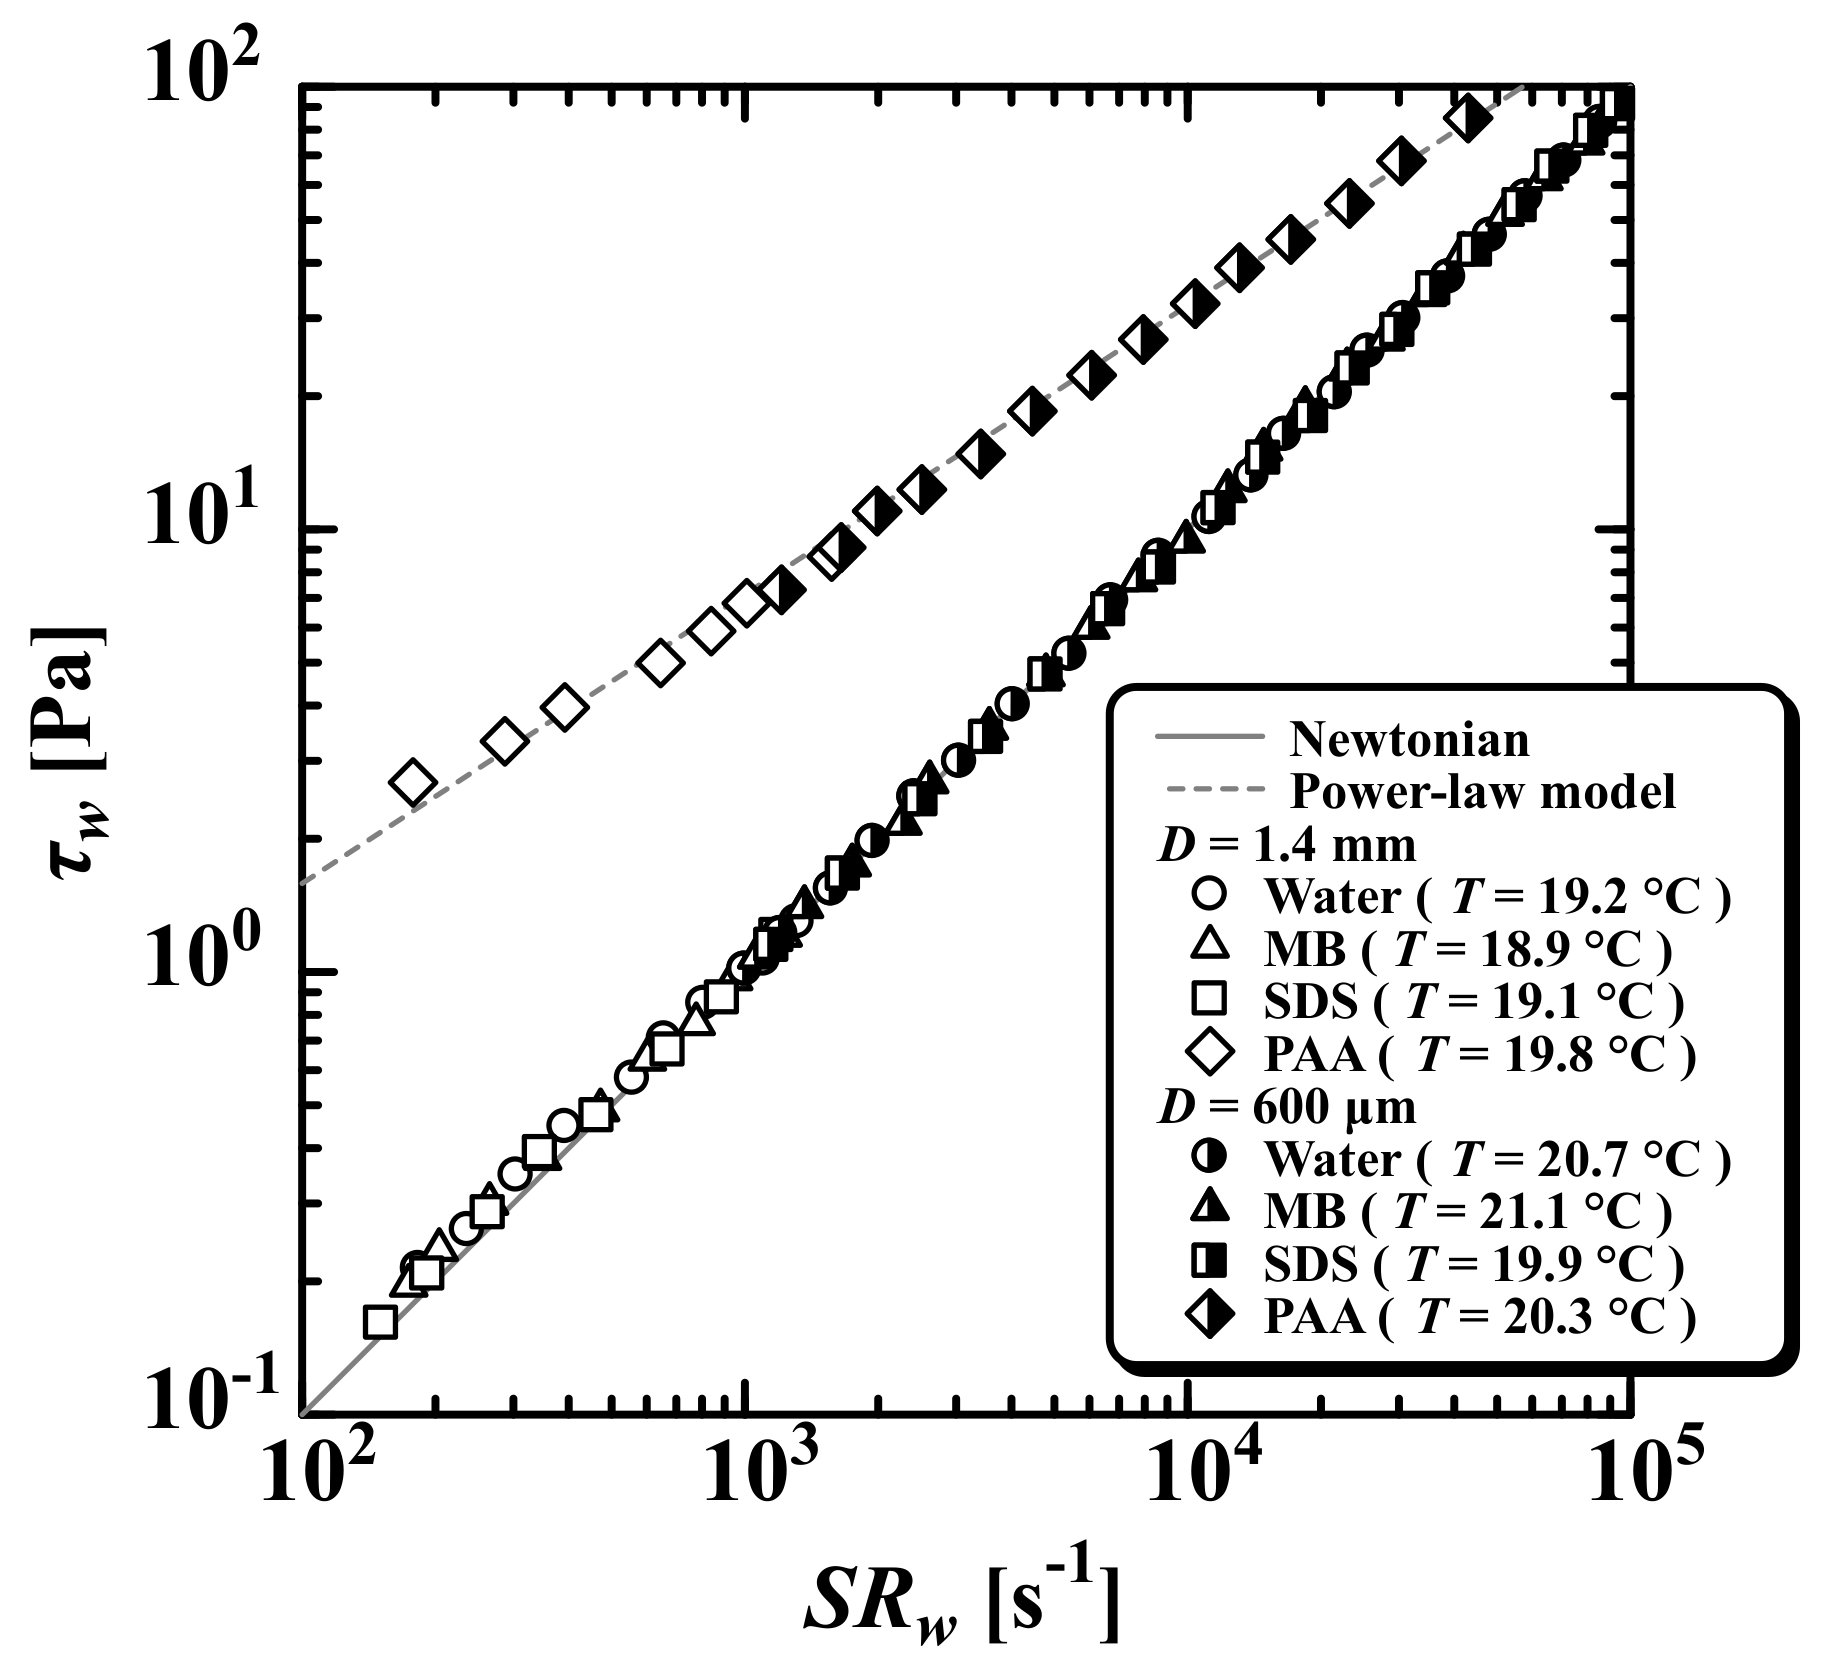
Figure 1 shows the relationship (log-log plot) between the wall shear stress and the wall shear rate of the test fluids measured by a capillary-type viscosity meter with an inner diameter of or 600 . The viscosity of MB and SDS agreed with that of water alone (), and the density for water () was used to summarize the experimental results. The experimental results did not vary for the density of the test fluids. We checked in pre-experiments. By contrast, the PAA exhibited non-Newtonian viscosity, and the power-law model
was used to evaluate the non-Newtonian viscosity, where the constant factor and power-law index of the PAA were and , respectively [25]. Although the PAA exhibited non-Newtonian viscosity, zero-shear viscosity was not obtained for limitation of the syringe pump.
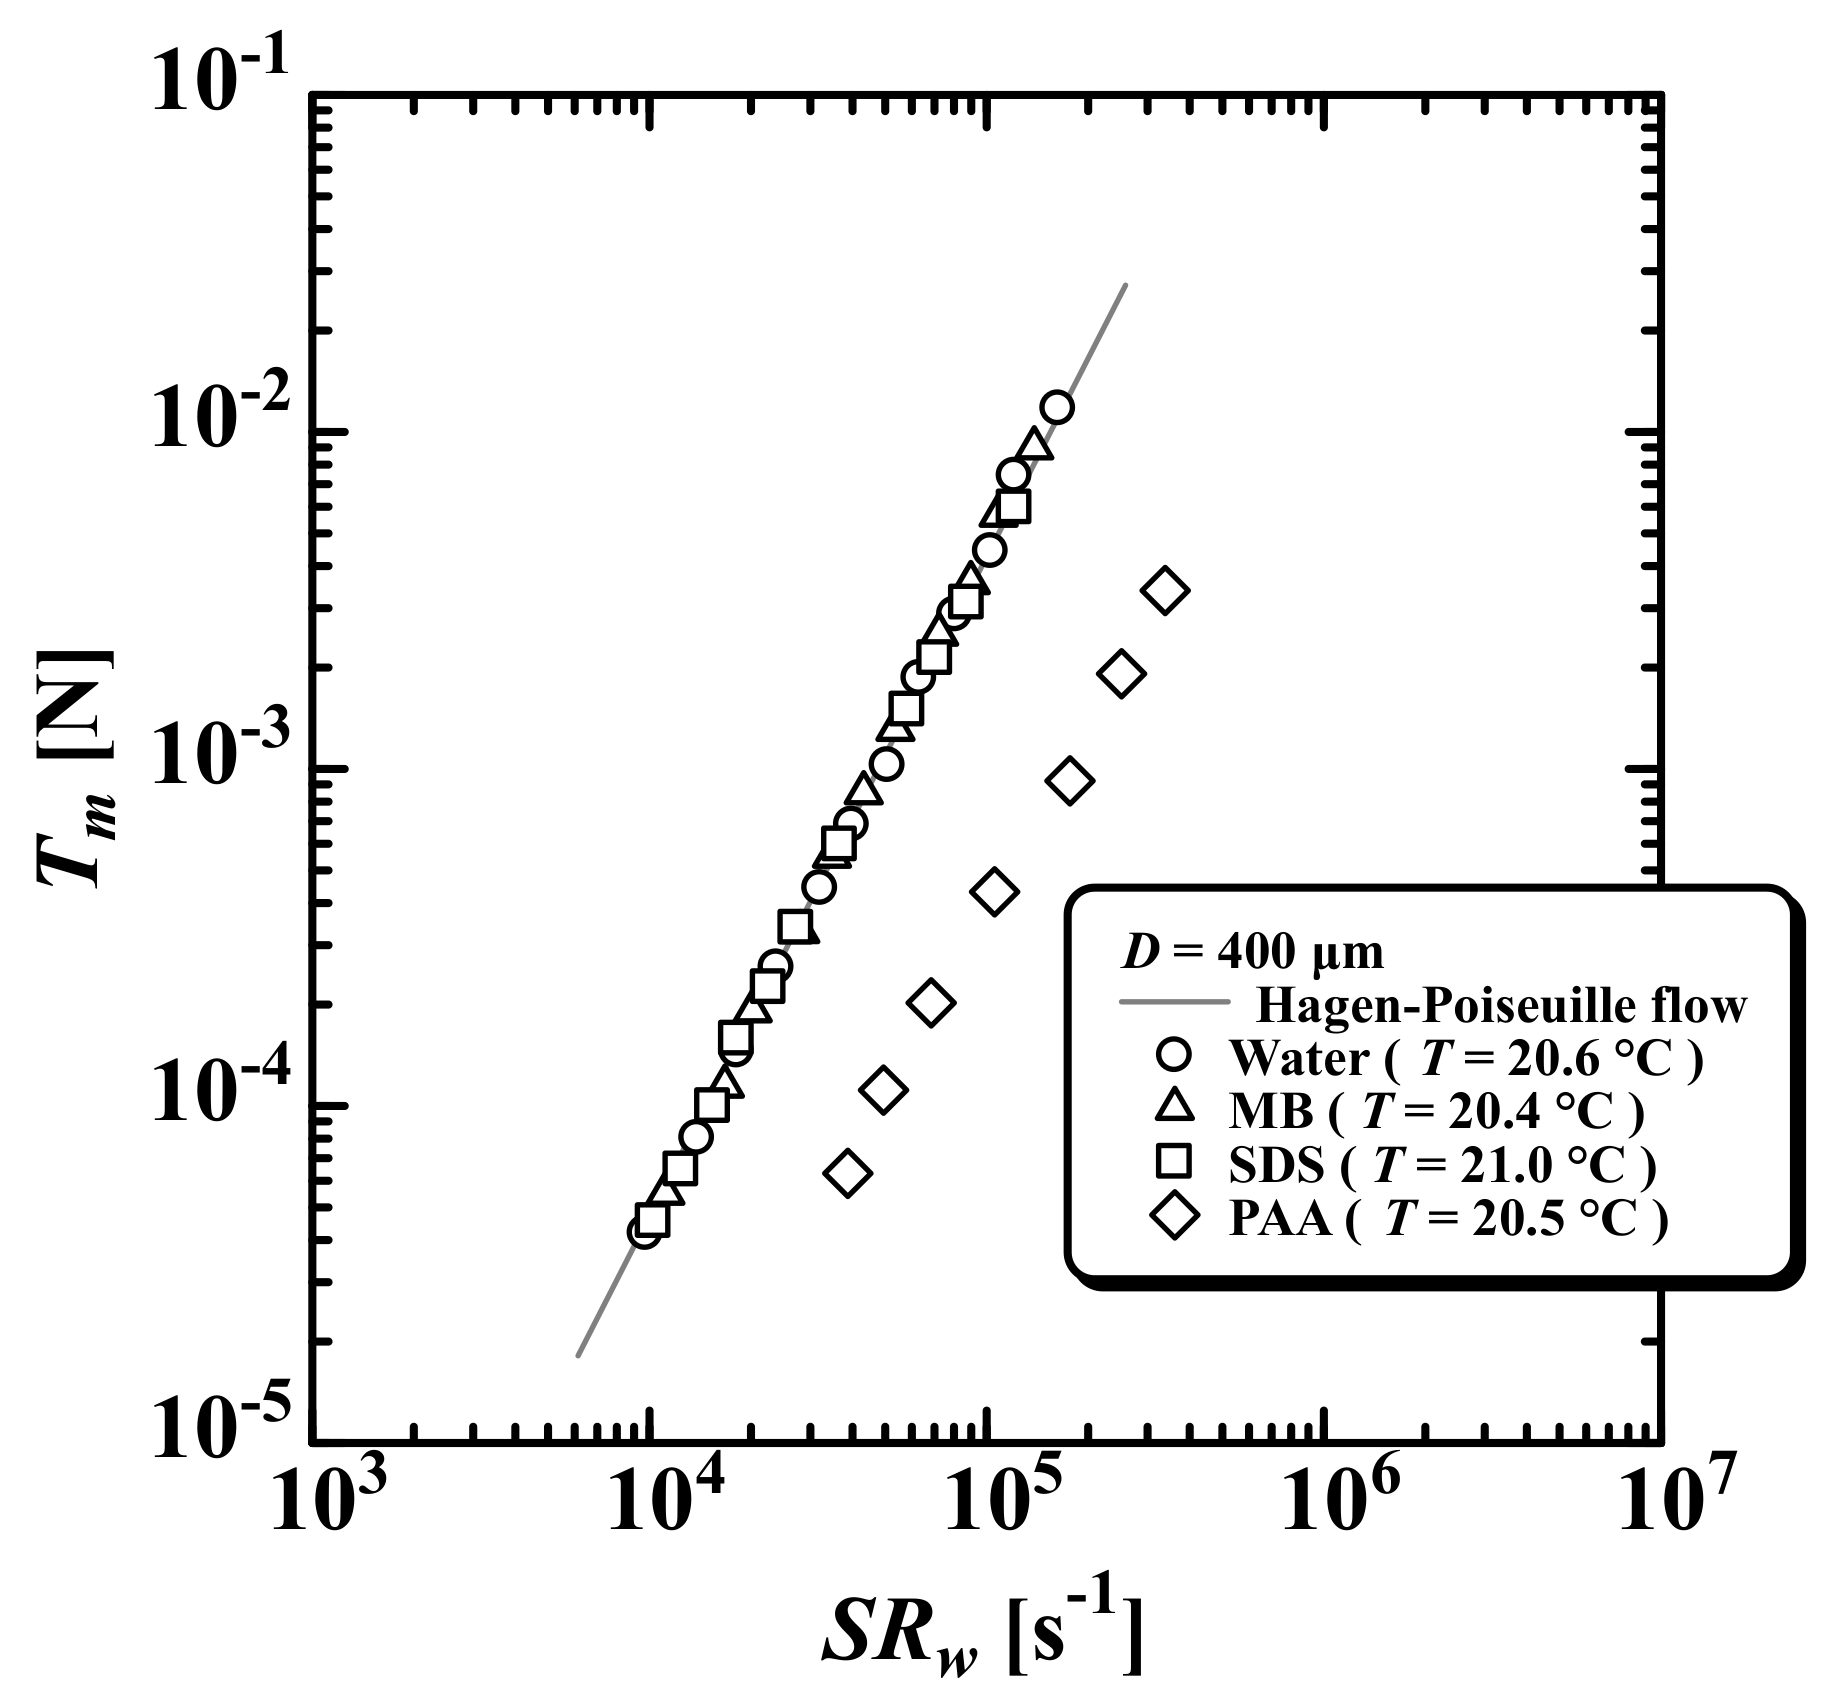
Next, the viscoelastic properties of the test fluids were measured as rheological properties by the jet thrust method [26,27,28]. Figure 2 shows the jet thrust plotted against the wall shear rate (log-log plot) measured using a capillary with an inner diameter of . The solid line is the prediction for Hagen–Poiseuille flow, i.e.,
where is the density, Q is the flow rate, and V is the mean velocity passing through the capillary. Good agreement was obtained between the experimental results for water alone and the predictions. The values for MB and SDS were almost the same as those for water alone, while those for PAA were approximate 50% lower, with this being due to the PAA having viscoelastic propertie. All measurements were performed at room temperature T.
3. Experimental Setup
3.1. Experimental Apparatus
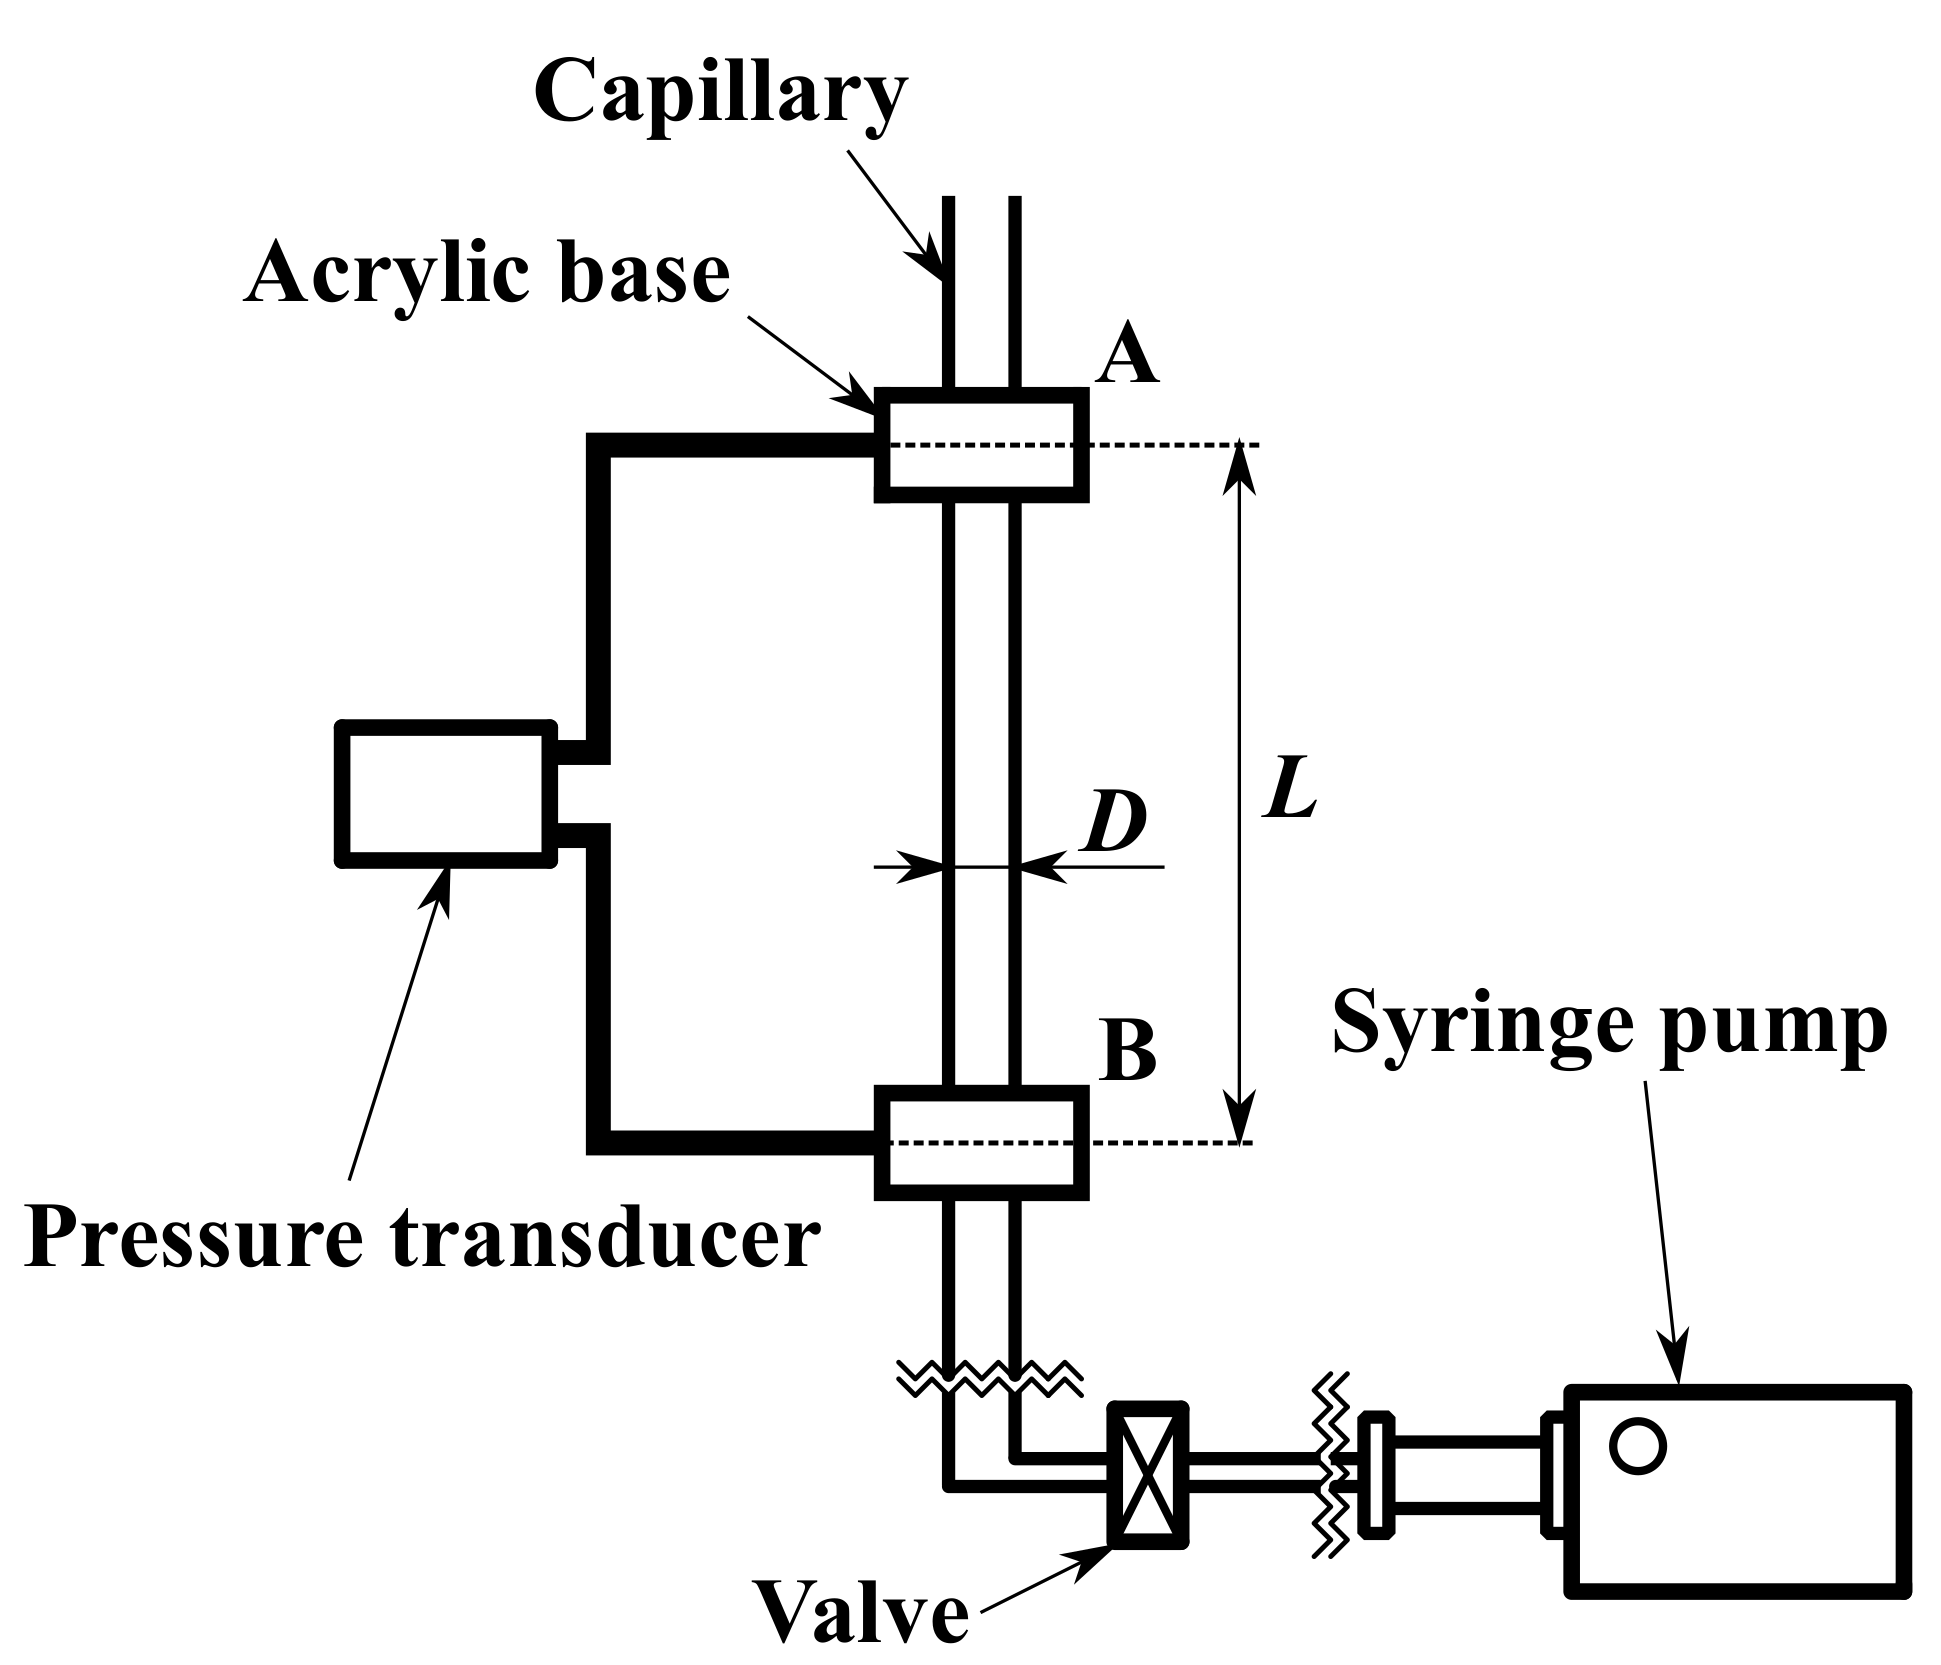
Figure 3 shows the experimental apparatus used to measure the pressure drop at constant flow rate. The test fluids were transported at constant flow rate Q using a syringe pump (JP-H1 and JP-H5; Furue Science Co., Ltd., Japan), and the differential pressure between sections A and B in Figure 3 was measured as the pressure drop using a pressure transducer (SDP-12; Tsukasa Sokken Co., Ltd., Japan).
3.2. Capillaries
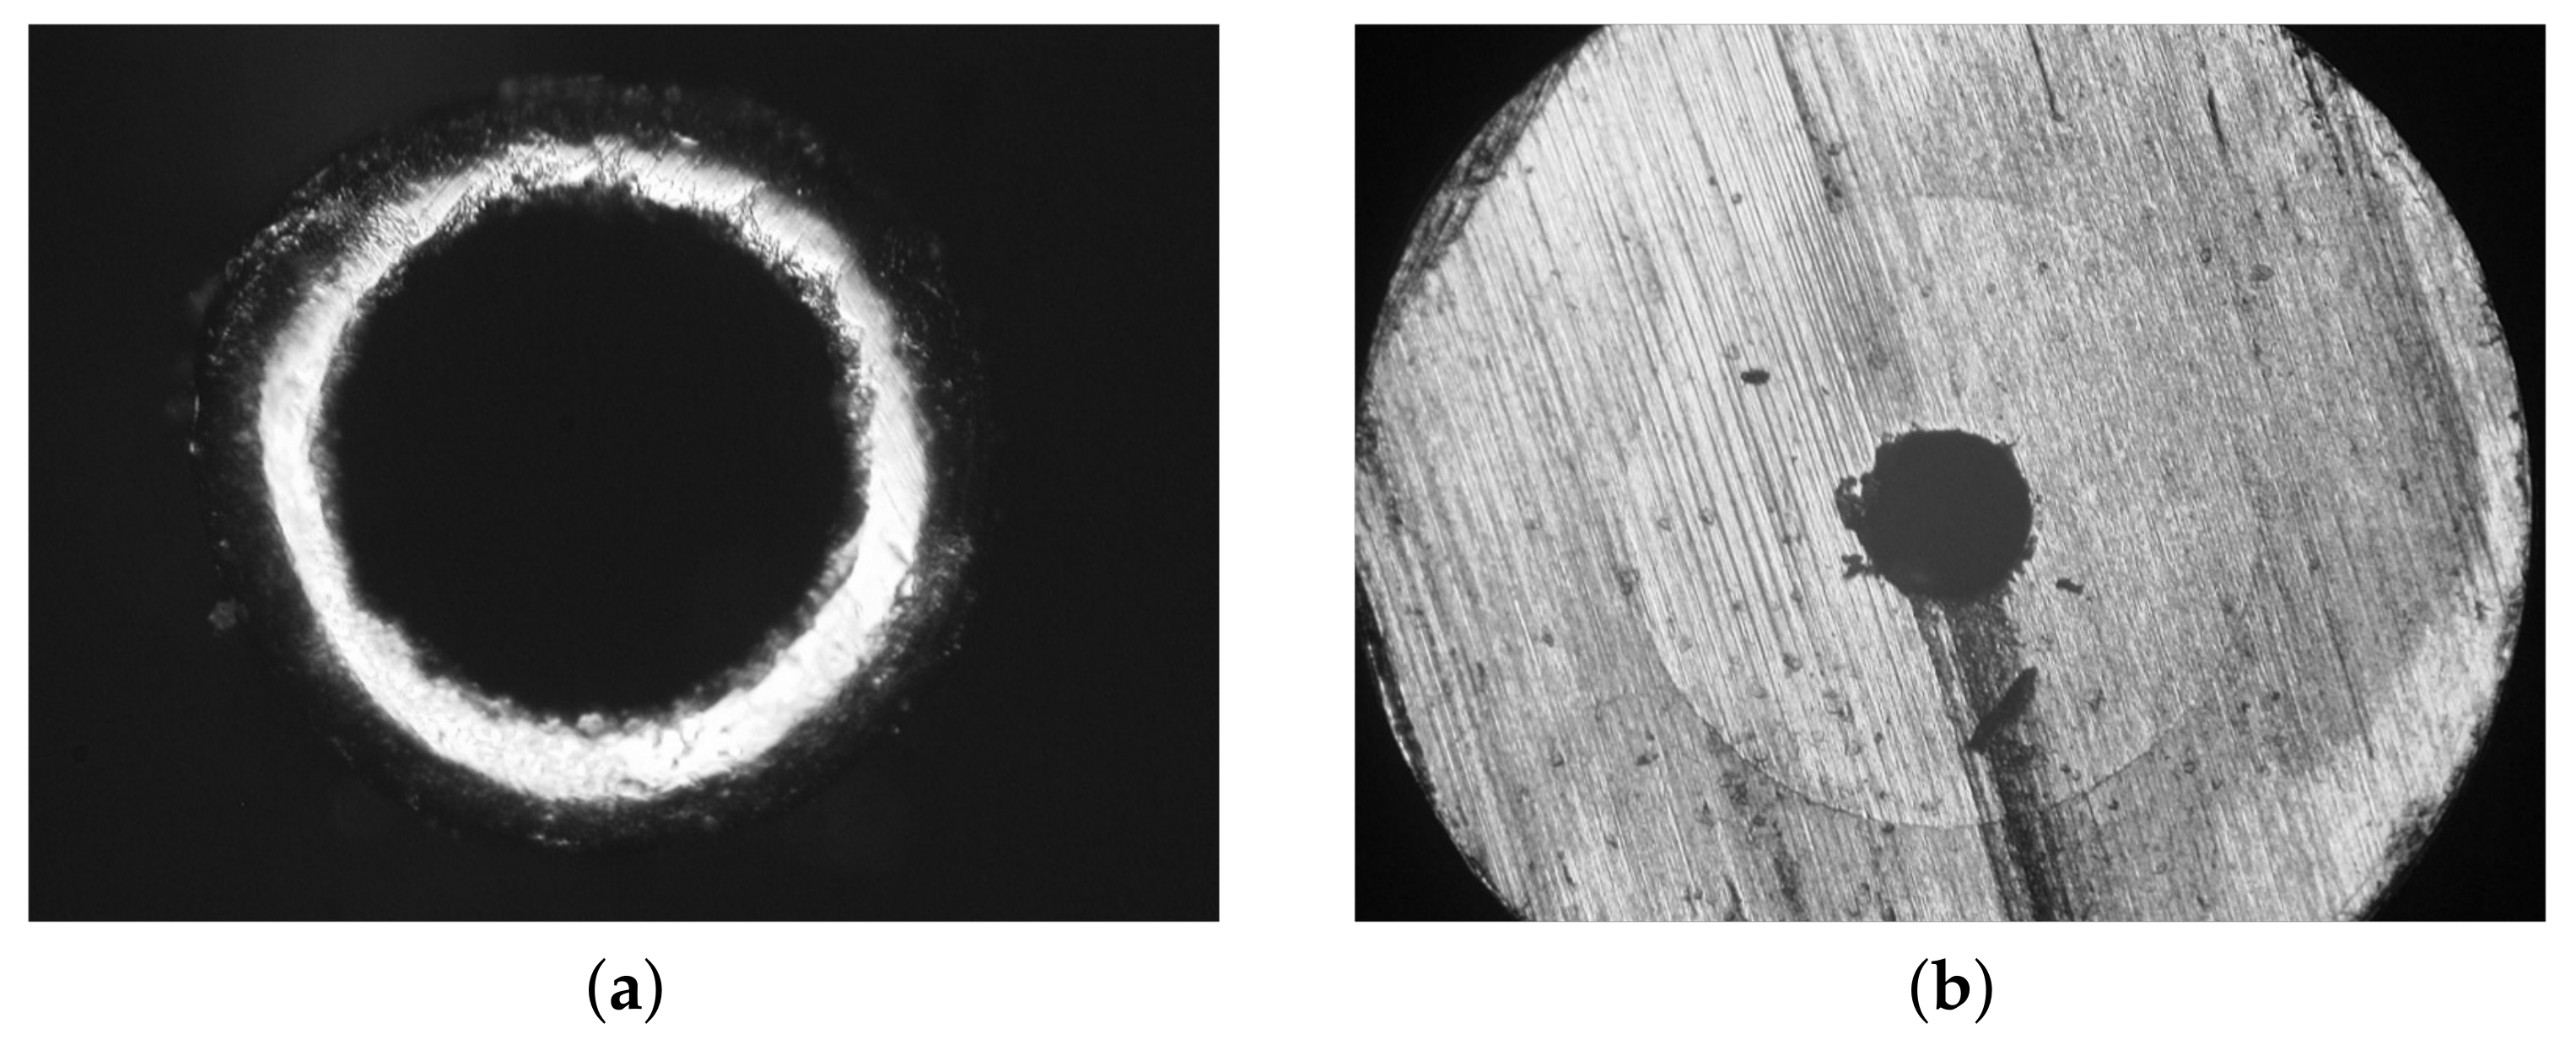
Three capillaries (SUS304) were used. The inner diameters were D = 750 (length L = 230 ), 490 (L = 120 ), and 110 (L = 80 ), where L is the distance between sections A and B in Figure 3. Figure 4 shows cross-sectional views of the capillaries with D = 750 (Figure 4a) and 110 (Figure 4b), taken with a commercial microscope (VH-8000; KEYENCE, Japan). The shape is complicated and not perfectly circular, and the inner diameter was measured by approximating a circle.
4. Experimental Results
4.1. Frictional Coefficient and Reynolds Number
In the experiment, the pressure drop was measured and the frictional coefficient was used to organize the experimental results, where is given by
Due to their Newtonian viscosity , the Reynolds number for water alone, MB, and SDS was obtained using
However, the PAA could not be defined in the same way as water alone because it exhibited non-Newtonian viscosity (power-law model). Therefore, the generalized Reynolds number
reported by Harris [29] was used instead.
4.2. Relationship between Frictional Coefficient and Reynolds Number
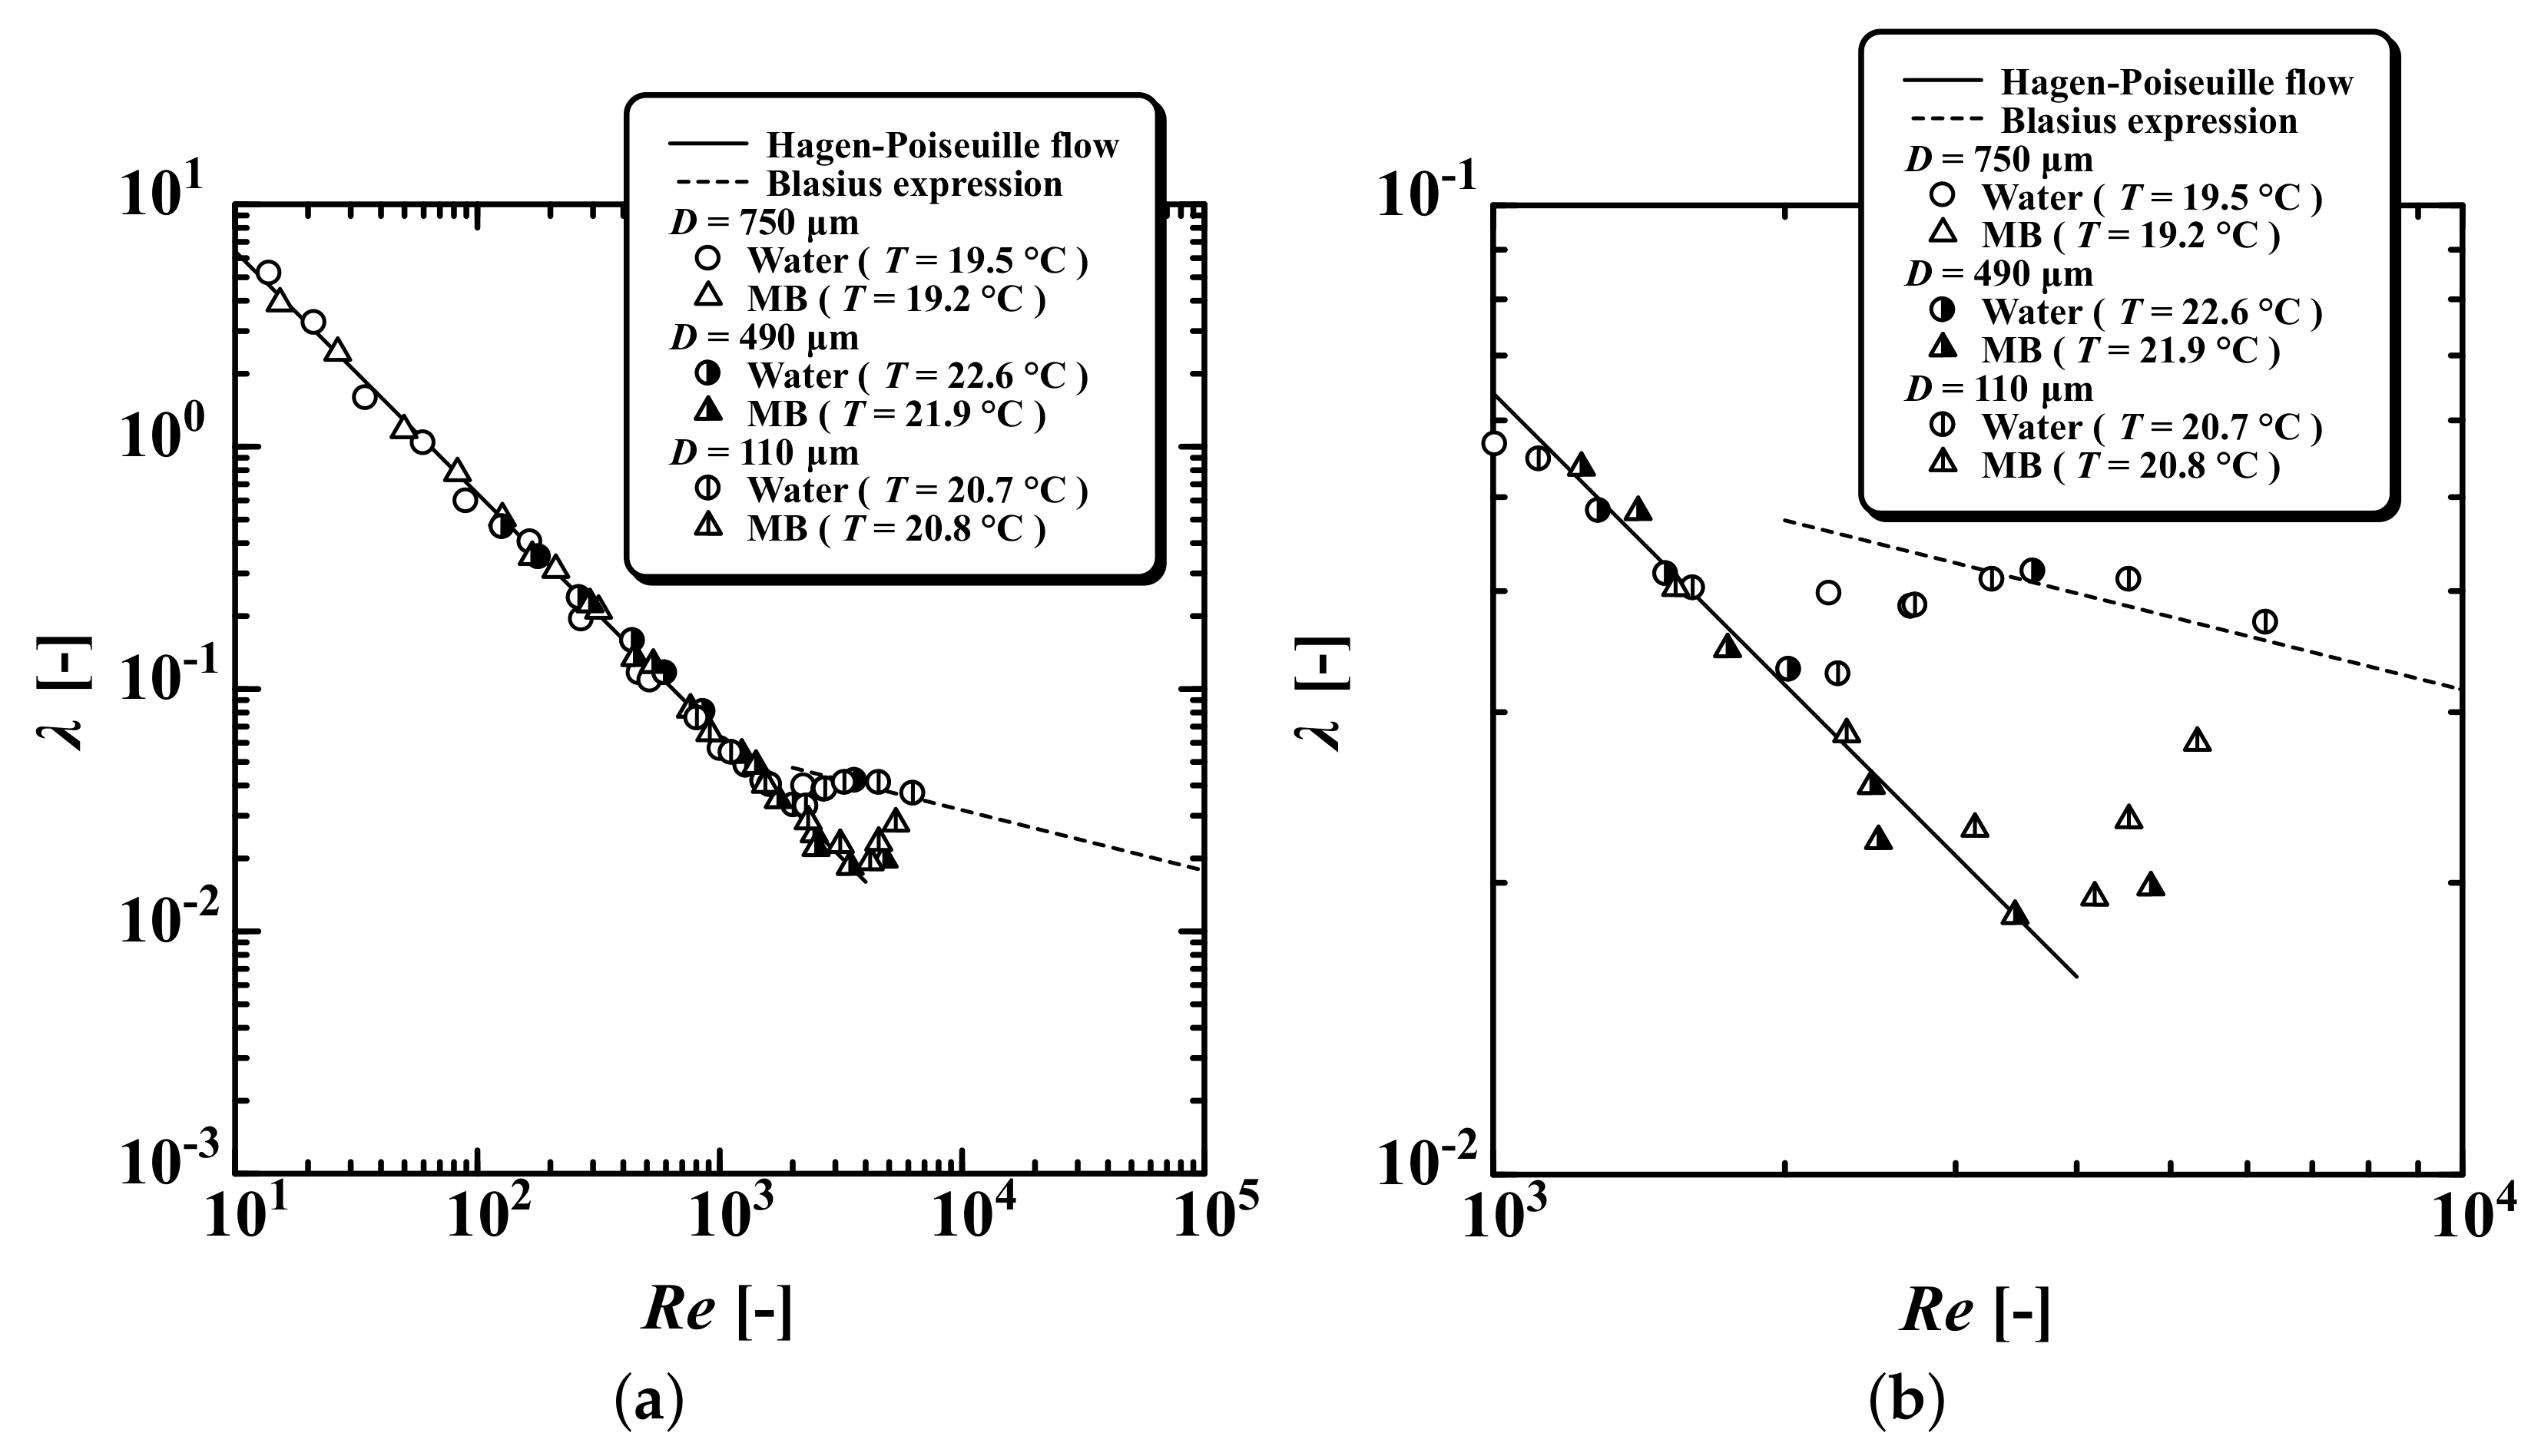
Figure 5 shows the experimental results for water alone and MB, where the vertical axis corresponds to the frictional coefficient and the horizontal axis corresponds to either the Reynolds number or the generalized Reynolds number . For water alone and MB, was consistent with that of laminar flow () and with the Blasius expression
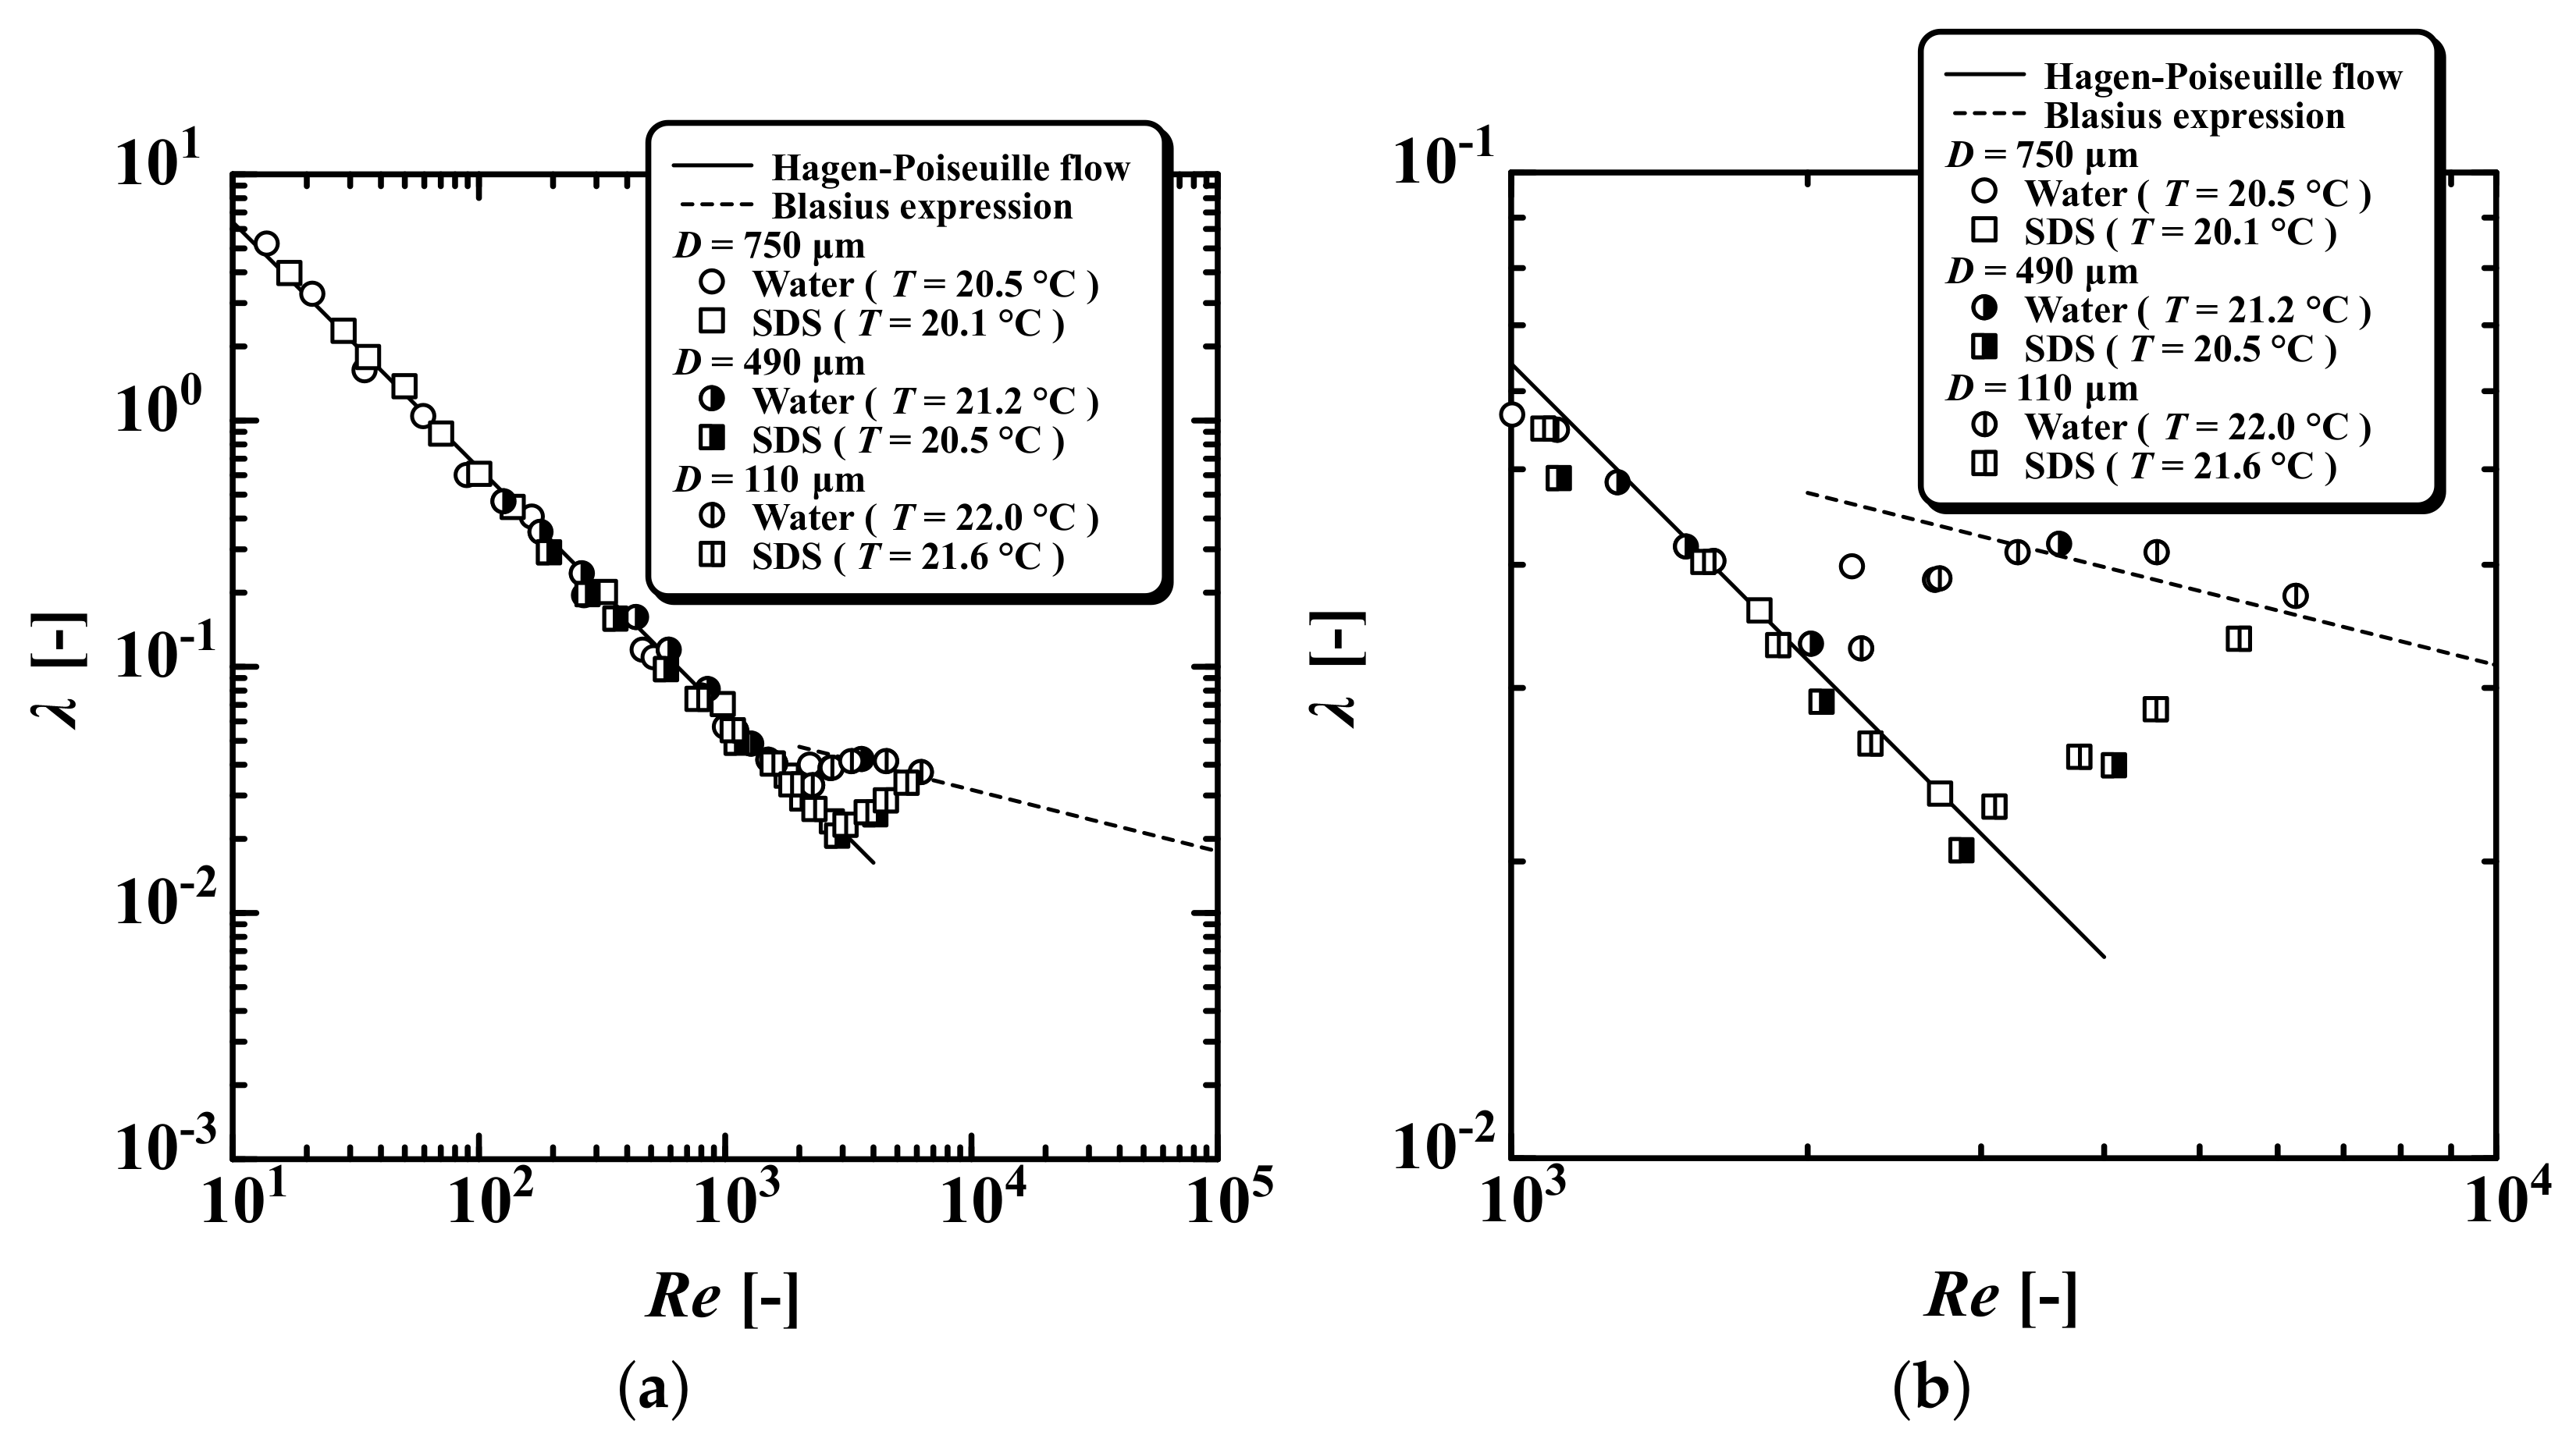
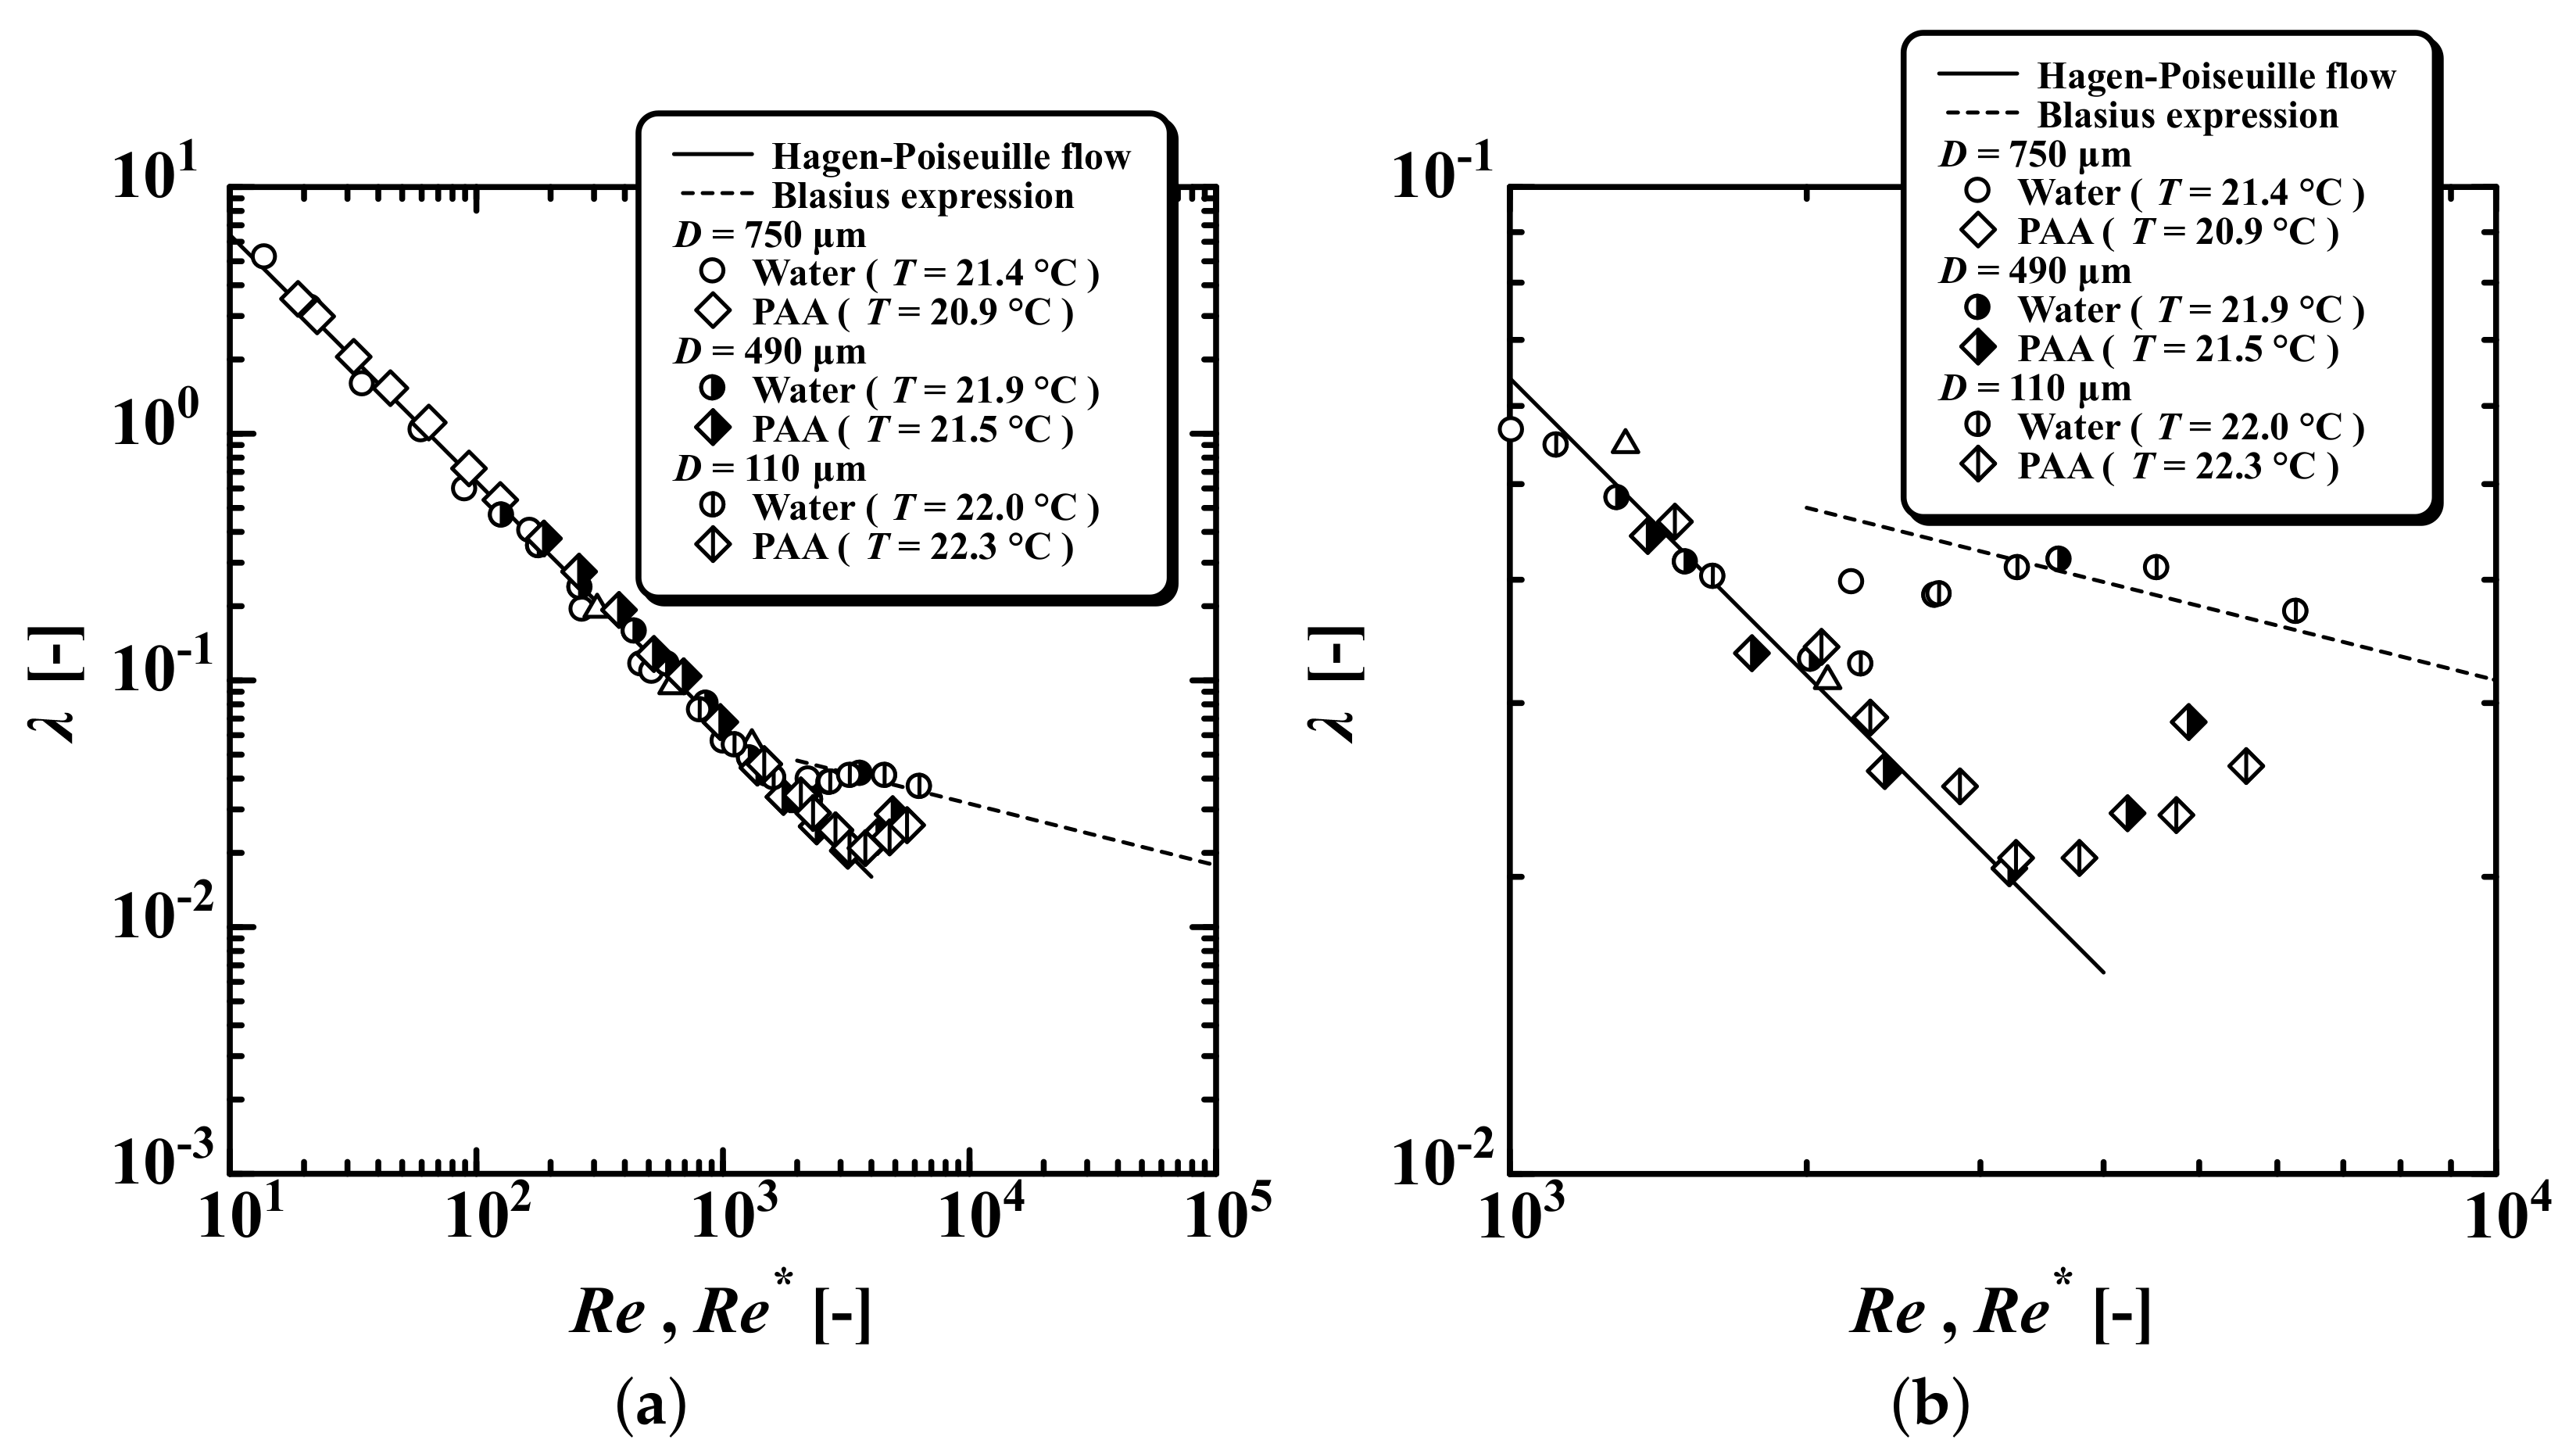
in the turbulent flow region () after the transition region (). The critical Reynolds numbers were () and (). The MB exhibited () and (). Figure 6 and Figure 7 show the experimental results for SDS and PAA, respectively, which also showed pseudo-laminarization with (), remaining in the laminar state up to between approximately and . For SDS, the critical Reynolds numbers were () and (). For PAA, the critical Reynolds numbers were () and (). For , laminar flow persisted up to the limit of the syringe pump for all test fluids. Moreover, it was confirmed that pseudo-laminarization occurred regardless of whether the inner diameter or 490 was used in the experiment.
5. Discussion
In this study, it was confirmed that the pseudo-laminarization reported previously [18] occurred when microbubbles were used. This mechanism is discussed together with the experimental results for the PAA and SDS.
5.1. Elastic Properties
For the PAA, pseudo-laminarization was obtained (Figure 7), and it exhibited the elastic properties shown in Figure 2. Meanwhile, Hasegawa et al. reported the possibility of elasticity in water passing through micro-orifices [30,31,32], but the resultant pressure drops for water alone, MB, and SDS agreed with the predictions for laminar flow (Equation (1)) and turbulent flow (Equation (7)). Furthermore, it was clear that these test fluids could not exhibit elasticity (Figure 2).
5.2. Electric Interaction
In the case of SDS, pseudo-laminarization was observed up to , which was the same as that for MB. The surfactant SDS with a molecular weight of 288 did not show elasticity in the jet thrust measurement. SDS is an anionic surfactant, which means that it becomes anionic in aqueous solution and forms aggregated spherical micelles above a critical micelle concentration (0.12 wt%) [33,34,35]. This is a major difference from water alone. Moreover, it could be considered a factor in the occurrence of pseudo-laminarization. We discuss SDS and MB in terms of electrical interaction. It is well known that a metallic wall in water forms an electric double layer because of its zeta potential [36,37,38], and because SDS has negatively charged spherical micelles, they were attracted to the positively charged electric double layer. Thus, the number of spherical micelles near the wall was expected to be larger than that of the bulk. In this condition, the interfacial tension between the wall and the SDS was expected to be much lower than that in water because of the enhanced wettability caused by the surfactant. Meanwhile, it is known that microbubbles are also negatively charged in water [39,40,41]. In the same way, it could be assumed that the microbubbles were attracted to the electric double layer and gathered near the wall.
5.3. Interface between Solid and Liquid
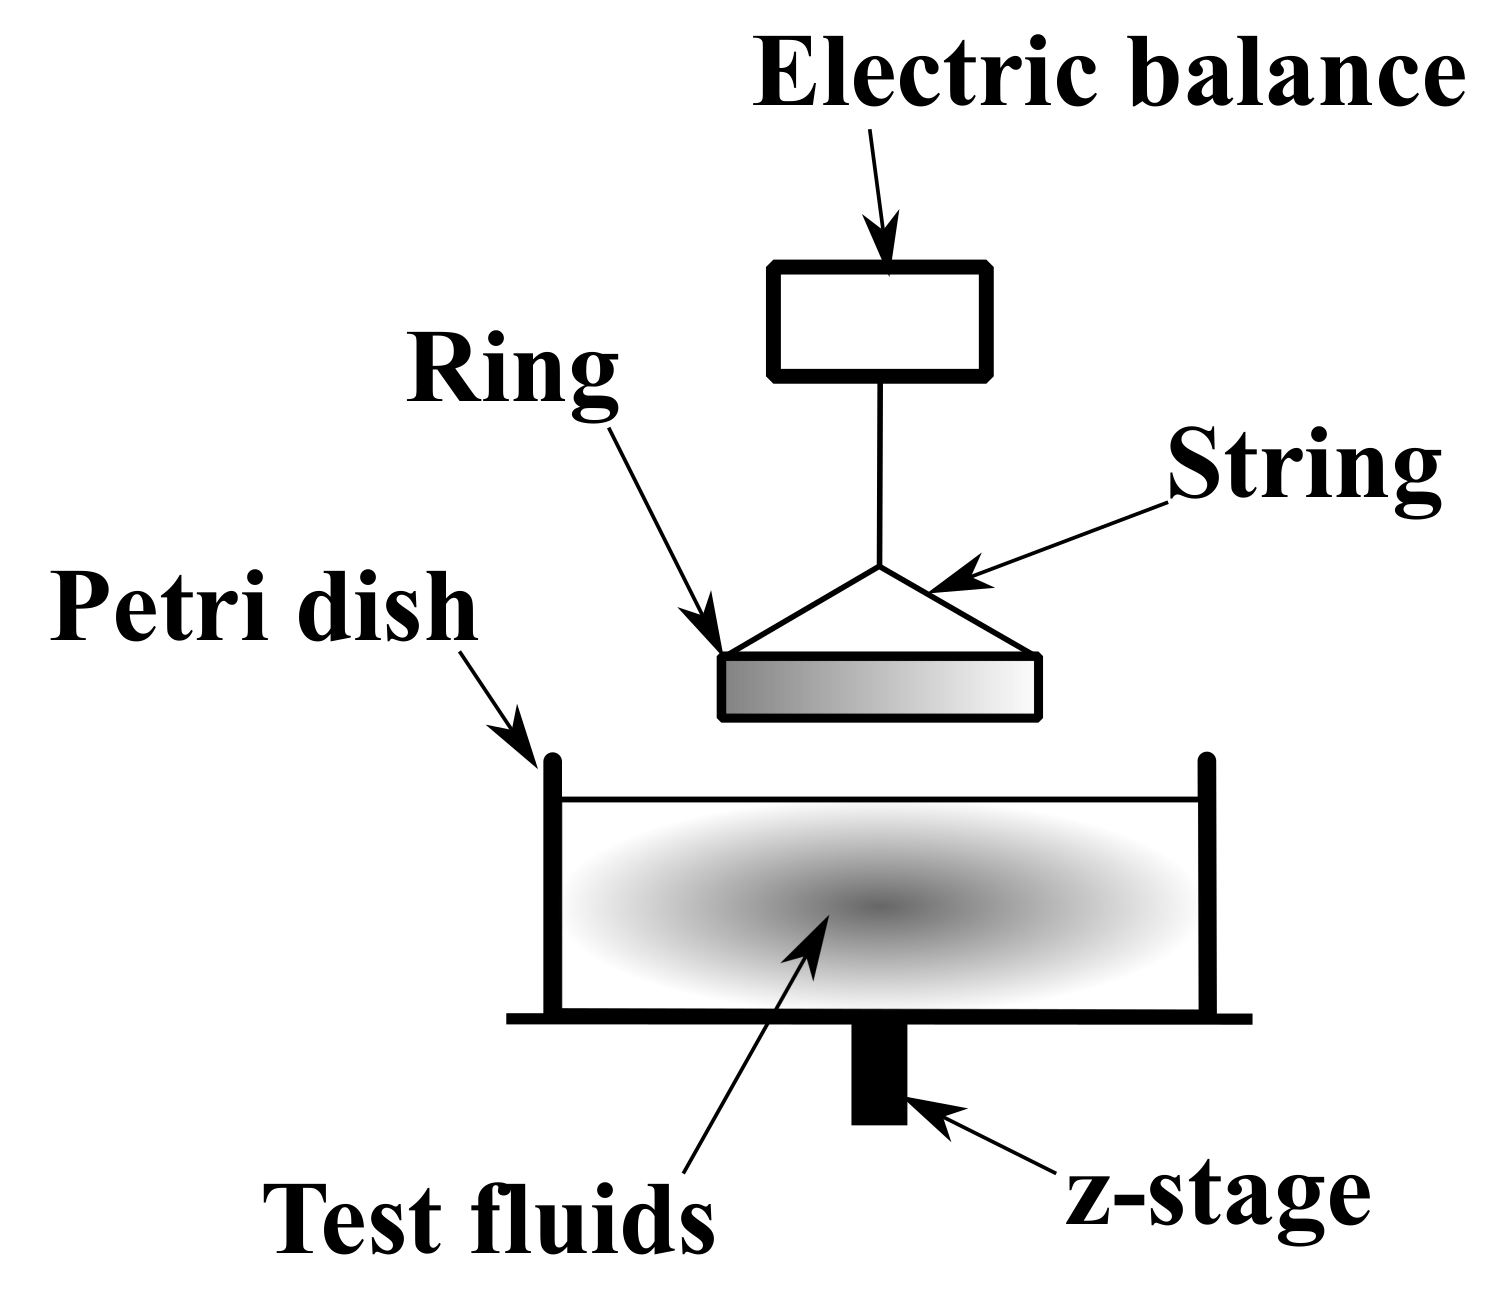
In Section 5.2, we discussed the possibility that the interfacial tension between the wall and the test fluids decreased because of electric interaction. This was verified by measuring the surface tension using the du Noüy method [42], and Figure 8 shows an overview of the experimental apparatus. A circular ring connected to an electronic balance (GR-200; A&D Co., Ltd., Japan) was lowered via a string, and the ring was gradually pulled away from being in contact with the test fluid. A Petri dish filled with the test fluid was placed on the z-axis stage, which was then raised to bring the ring into contact with the surface. At this time, the scale value of the z-axis was read. As the stage was lowered gradually, the liquid attached to the lower end of the ring was gradually stretched and eventually broke, whereupon the maximum value of the electronic balance and the scale value of the z-axis were recorded. If we consider the balance of forces, the force acting on the liquid in contact with the ring and being pulled up is equal to the force due to its own weight (gravity) and the surface tension , giving
where is the outer diameter of the ring (=15.5 ), is the inner diameter (=15.0 ), and g is the acceleration due to gravity (). The values of were 50.9 ± 1.2 (MB), 36.3 ± 0.9 (SDS), and 59.8 ± 2.8 (PAA). Considering that the value of for water is 71.6 ± 0.7 , the surface tension of the MB and SDS was reduced by approximately 30% and 49%, respectively.
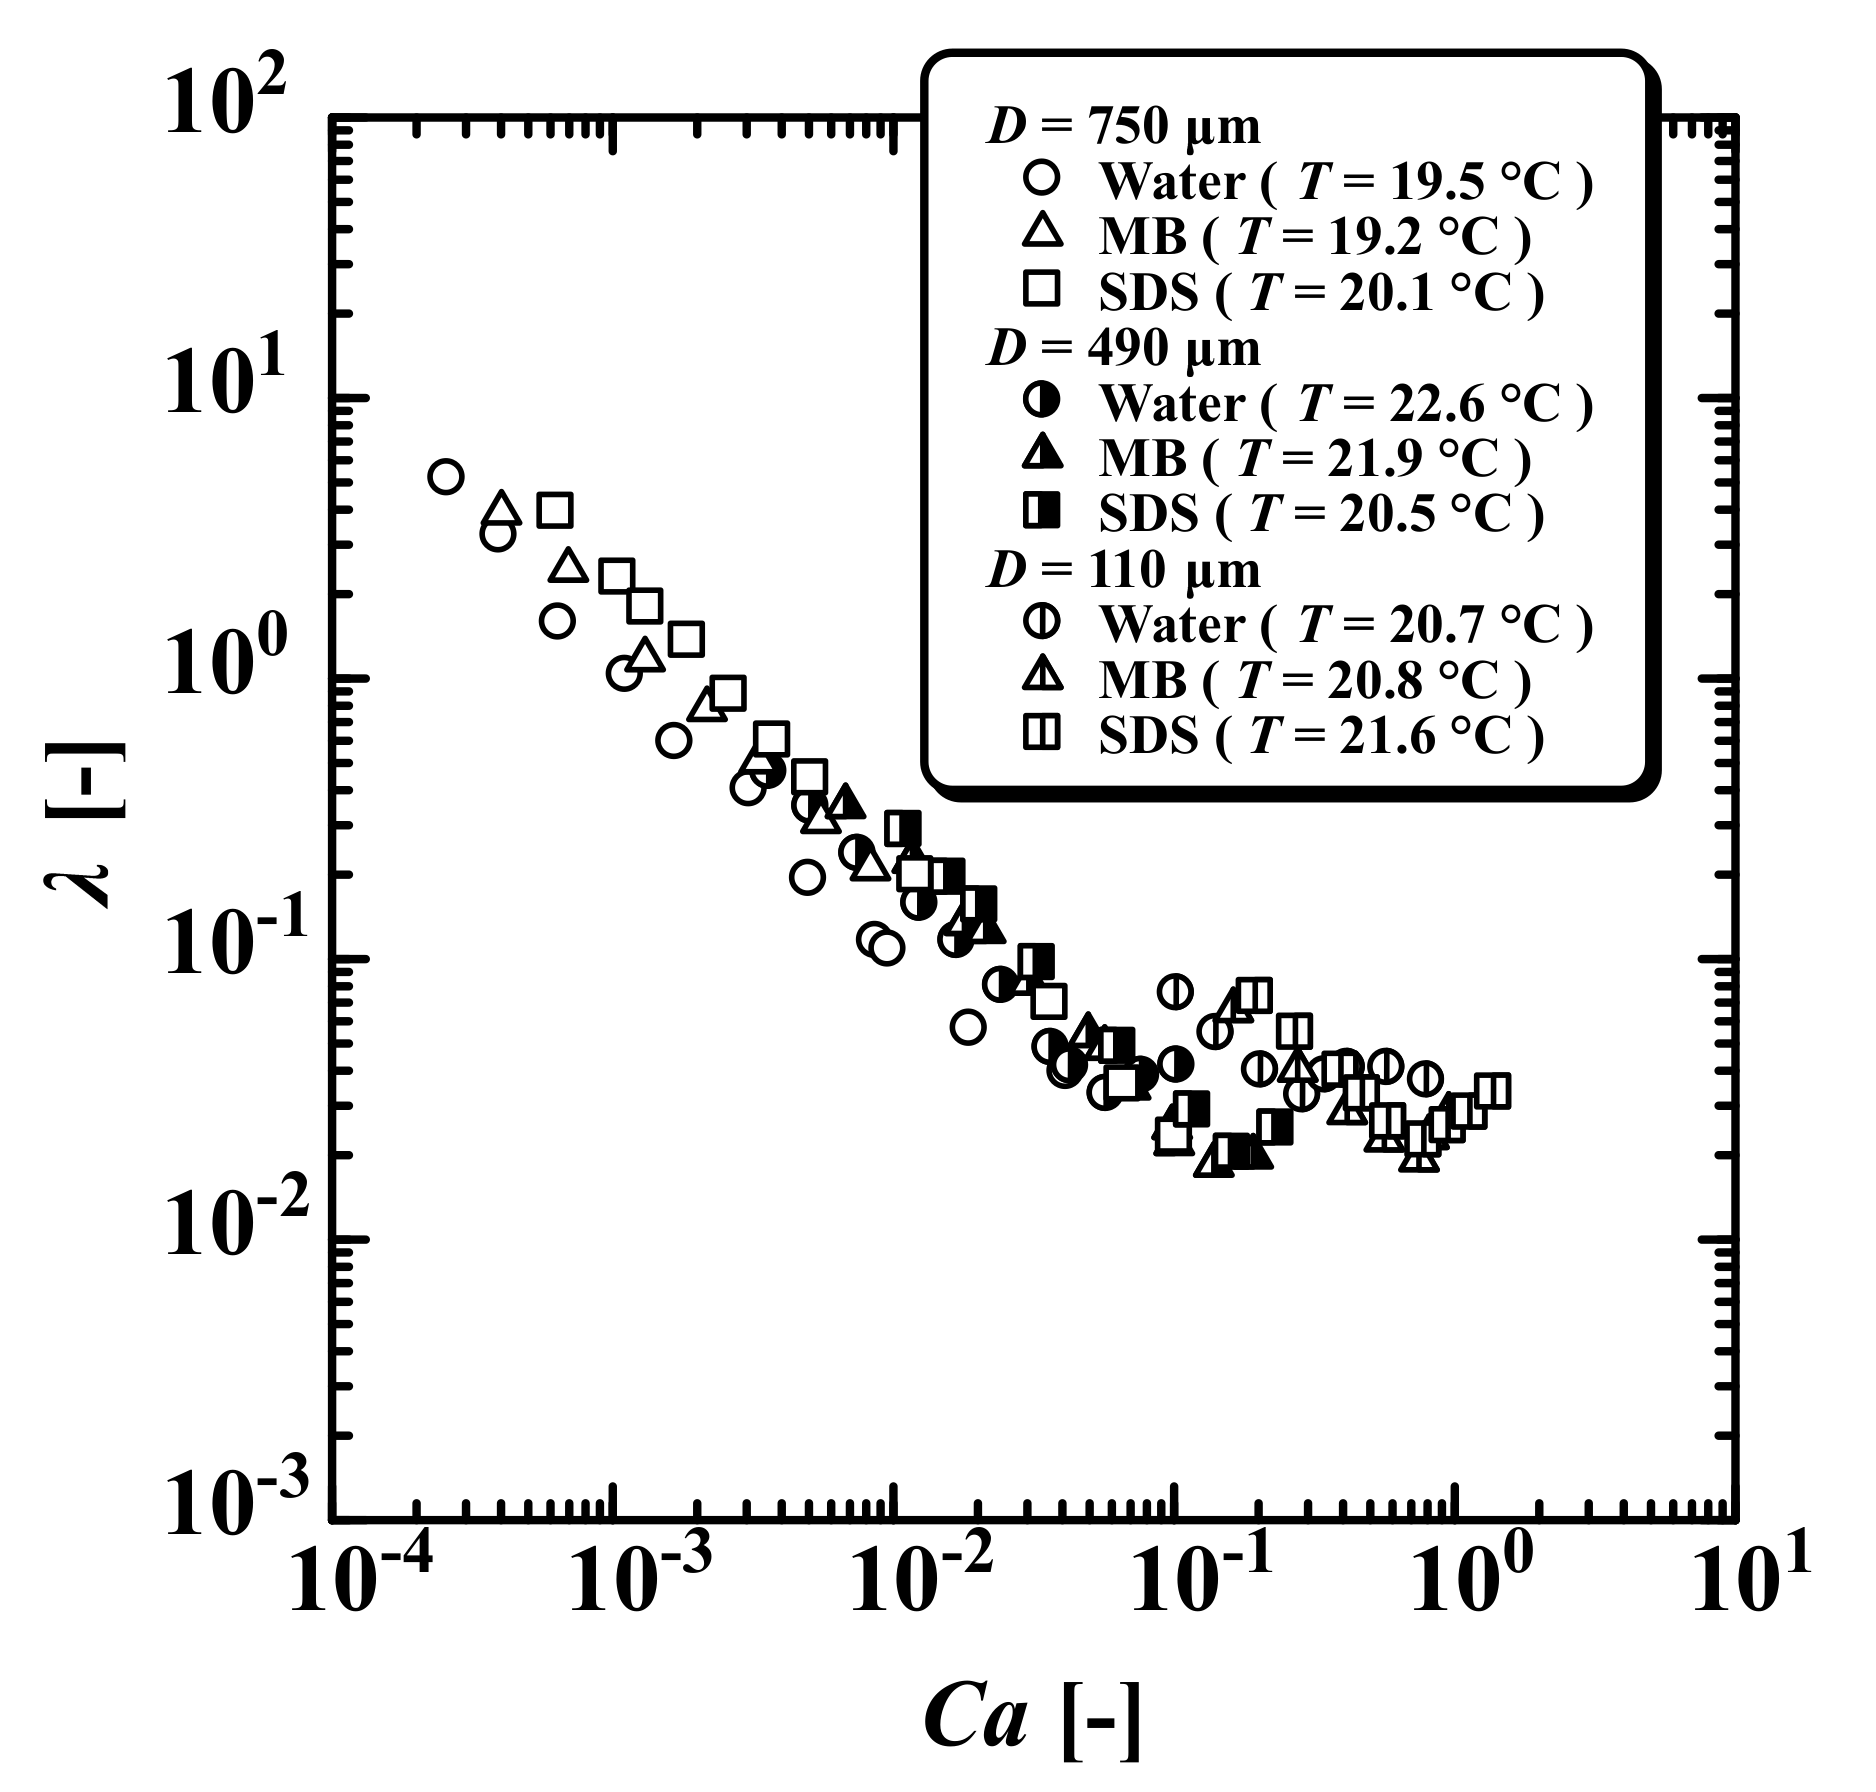
At this point, it could be suitable to base the discussion on the solid–liquid interface. Figure 9 shows the frictional coefficient plotted against the capillary number
which is defined as the ratio between the force based on viscosity and that based surface tension. Figure 9 shows the critical capillary number at which the transition began. For D = 490 , is (water), (MB), and (SDS). For D = 110 , is (water), (MB), and (SDS). It was found that and the flow field was strongly influenced by the interface.
5.4. Summary of Discussion
The above discussion is summarized here. Ushida et al. measured the frictional loss of ultra-fine bubble (averaged particle diameter = 110 ) passing through micro-orifices and reported that no drag reduction occurred at the characteristic length used in their experiment [43]. It was also reported that the surface tension of ultra-fine bubble was reduced by approximately 15% [44]. The pseudo-laminarization of the PAA with a 17% decrease in surface tension could be considered to exhibit elasticity rather than a decrease in surface tension. For the pseudo-laminarization of the MB and SDS, the absence of elasticity could be confirmed by jet thrust (Figure 2). As SDS contains negatively charged spherical micelles and the microbubbles of MB are also negatively charged [45], it was thought that their electrical interaction with the electric double layer near the wall lowered the surface tension. Thus, the number of spherical micelles were higher in SDS and MB than in the bulk.
6. Conclusions
In this study, the flow properties of water alone, mixed microbubble water, anionic surfactant solution, and polymer solution were investigated in capillaries with inner diameters of 750, 490, and 110 . For water alone, the frictional coefficient agreed with the laminar flow and the Blasius expression. For mixed microbubble water, the same tendency was obtained, but laminar flow persisted up to a Reynolds number of approximately . The anionic surfactant solution and polymer solution exhibited the same results as those of the mixed microbubble water. Thus, pseudo-laminarization of mixed microbubble water and complex fluids was obtained. When discussing the mechanism, it was considered that the pseudo-laminarization of the polymer solution was caused by elasticity whereas that of the microbubble water and the anionic surfactant solution was caused by the solid–liquid interface due to electrical interaction.
Author Contributions
All authors contributed equally to this work. Furthermore, All authors have read and agreed to the published version of the manuscript.
Funding
This research was funded by JSPS KAKENHI No. 19K04191.
Institutional Review Board Statement
Not applicable.
Informed Consent Statement
Not applicable.
Data Availability Statement
Not applicable.
Acknowledgments
This study was partially supported by JSPS KAKENHI No. 19K04191. We thank Ryuichi Kayaba for technical assistance in carrying out the experiments. We are also grateful to the editors and anonymous reviewers for helping improve the manuscript considerably.
Conflicts of Interest
The authors declare no conflicts of interest.
Nomenclature
| : capillary number |
| : critical capillary number |
| D: inner diameter (mm, ) |
| K: constant factor () |
| L: length between two pressure holes (mm) |
| n: power-law index |
| Q: flow rate () |
| : Reynolds number |
| : generalized Reynolds number |
| : critical Reynolds number |
| : wall shear rate () |
| T: temperature (C) |
| : jet thrust (N) |
| V: mean velocity passing through a capillary (m/s) |
| : pressure drop (Pa) |
| : frictional coefficient of pipe |
| : Newtonian viscosity () |
| : density () |
| : static surface tension (mN/m) |
| : wall shear stress (Pa) |
References
- Banerjee, D.; Souslov, A.; Abanov, A.G.; Vitelli, V. Odd viscosity in chiral active fluids. Nat. Commun. 2017, 8, 1–12. [Google Scholar] [CrossRef] [PubMed]
- Hosaka, Y.; Komura, S.; Andelman, D. Nonreciprocal response of a two-dimensional fluid with odd viscosity. Phys. Rev. E 2021, 103, 042610. [Google Scholar] [CrossRef] [PubMed]
- Zhao, J.; Jian, Y. Effect of odd viscosity on the stability of a falling thin film in presence of electromagnetic field. Fluid Dynamics Research 2021, 53, 015510. [Google Scholar] [CrossRef]
- Endo, A.; Srithongouthai, S.; Nashiki, H.; Teshiba, I.; Iwasaki, T.; Hama, D.; Tsutsumi, H. DO-increasing effects of a microscopic bubble generating system in a fish farm. Mar. Pollut. Bull. 2008, 57, 78–85. [Google Scholar] [CrossRef]
- Yun, S.; Giri, S.S.; Kim, H.J.; Kim, S.G.; Kim, S.W.; Kang, J.W.; Han, S.J.; Kwon, J.; Oh, W.T.; Chi, C.; et al. Enhanced bath immersion vaccination through microbubble treatment in the cyprinid loach. Fish Shellfish. Immunol. 2019, 91, 12–18. [Google Scholar] [CrossRef]
- Shin, L.Y.; Ganesan, P.; Varman, M.; Hamad, F.A.; Krishnasamy, S. Effects of microbubble aeration on water quality and growth performance of Litopenaeus vannamei in biofloc system. Aquac. Eng. 2021, 93, 102159. [Google Scholar]
- Agarwal, A.; Ng, W.J.; Liu, Y. Principle and applications of microbubble and nanobubble technology for water treatment. Chemosphere 2011, 84, 1175–1180. [Google Scholar] [CrossRef]
- Kaushik, G.; Chel, A. Microbubble technology: Emerging field for water treatment. Bubble Sci. Eng. Technol. 2014, 5, 33–38. [Google Scholar] [CrossRef]
- Gao, Y.; Duan, Y.; Fan, W.; Guo, T.; Huo, M.; Yang, W.; Zhu, S.; An, W. Intensifying ozonation treatment of municipal secondary effluent using a combination of microbubbles and ultraviolet irradiation. Environ. Sci. Pollut. Res. 2019, 26, 21915–21924. [Google Scholar] [CrossRef]
- Tanaka, S.; Kobayashi, H.; Ohuchi, S.; Terasaka, K.; Fujioka, S. Destabilization of ultrafine bubbles in water using indirect ultrasonic irradiation. Ultrason. Sonochem. 2021, 71, 105366. [Google Scholar] [CrossRef]
- Ushida, A.; Hasegawa, T.; Amaki, K.; Narumi, T. Effect of microbubble mixtures on the washing rate of surfactant solutions in a swirling flow and an alternating flow. Tenside Surfactants Deterg. 2013, 50, 332–338. [Google Scholar] [CrossRef]
- Tano, Y.; Iizuka, A.; Shibata, E.; Nakamura, T. Physical washing method for the removal of press oil using the high-speed movement of microbubbles under ultrasonic irradiation. Ind. Eng. Chem. Res. 2013, 52, 15658–15663. [Google Scholar] [CrossRef]
- Iizuka, A.; Iwata, W.; Shibata, E.; Nakamura, T. Physical washing method for press oil removal from side surfaces using microbubbles under ultrasonic irradiation. Ind. Eng. Chem. Res. 2016, 55, 10782–10787. [Google Scholar] [CrossRef]
- Xu, Q.; Nakajima, M.; Ichikawa, S.; Nakamura, N.; Shiina, T. A comparative study of microbubble generation by mechanical agitation and sonication. Innov. Food Sci. Emerg. Technol. 2008, 9, 489–494. [Google Scholar] [CrossRef]
- Wang, J.; Abe, A. Experimental verification of shock sterilization for marine Vibrio sp. using microbubbles interacting with underwater shock waves. J. Mar. Sci. Technol. 2016, 21, 679–688. [Google Scholar] [CrossRef]
- Ikeura, H.; Goto, T.; Tamaki, M. Effects of adding a chelator after ozone microbubble generation on nutrient composition, medium sterility, and plant growth. Water Air Soil Pollut. 2018, 229, 1–14. [Google Scholar] [CrossRef]
- Kodama, Y.; Kakugawa, A.; Takahashi, T.; Kawashima, H. Experimental study on microbubbles and their applicability to ships for skin friction reduction. Int. J. Heat Fluid Flow 2000, 21, 582–588. [Google Scholar] [CrossRef]
- Serizawa, A.; Inui, T.; Yahiro, T.; Kawara, Z. Pseudo-laminarization of micro-bubble containing milky bubbly flow in a pipe. Multiph. Sci. Technol. 2005, 17, 79–101. [Google Scholar] [CrossRef]
- Ferrante, A.; Elghobashi, S. Reynolds number effect on drag reduction in a microbubble-laden spatially developing turbulent boundary layer. J. Fluid Mech. 2005, 543, 93–106. [Google Scholar] [CrossRef]
- Shen, X.; Ceccio, S.L.; Perlin, M. Influence of bubble size on micro-bubble drag reduction. Exp. Fluids 2006, 41, 415–424. [Google Scholar] [CrossRef]
- Jacob, B.; Olivieri, A.; Miozzi, M.; Campana, E.F.; Piva, R. Drag reduction by microbubbles in a turbulent boundary layer. Phys. Fluids 2010, 22, 115104. [Google Scholar] [CrossRef]
- Ushida, A.; Ichijo, A.; Sato, T.; Hasegawa, T.; Narumi, T. Pseudo-laminarization effect of several types of surfactant solutions in small-sized pipe flows. Acta Mech. 2016, 227, 2061–2074. [Google Scholar] [CrossRef]
- Ushida, A.; Ogawa, S.; Narumi, T.; Sato, T.; Hasegawa, T. Pseudo-laminarization effect of dilute and ultra-dilute polymer solutions on flows in narrow pipes. Exp. Therm. Fluid Sci. 2018, 99, 233–241. [Google Scholar] [CrossRef]
- Kobayashi, T.; Ushida, A.; Kourakata, I.; Seto, K.; Hiwatashi, T.; Sato, T.; Narumi, T. Washing effect of microbubble mixture on the soiled model attached on a metal surface. Jpn. J. Multiph. Flow 2020, 34, 254–263. [Google Scholar] [CrossRef]
- Canneyt, K.V.; Verdonck, P. Mechanics of Biofluids in Living Body; Comprehensive Biomedical Physics; Brahme, A., Ed.; Elsevier: Amsterdam, The Netherlands, 2014; pp. 39–53. [Google Scholar]
- Hasegawa, T.; Asama, H.; Narumi, T. A simple method for measuring elastic stresses by jet thrust and some characteristics of tube flows. Nihon Reoroji Gakkaishi 2003, 31, 243–252. [Google Scholar] [CrossRef]
- Ushida, A.; Hasegawa, T.; Kawami, M.; Uchiyama, H.; Narumi, T.; Kayaba, R. Flow properties of microbubble/polyethylene glycol mixtures passing through orifices and slits. Nihon Reoroji Gakkaishi 2012, 40, 61–68. [Google Scholar] [CrossRef]
- Ushida, A.; Narumi, T.; Amaki, K.; Sato, T.; Hasegawa, T. Anomalous flow properties of spherical micelle surfactant solutions passing through small-sized slits. Int. J. Heat Fluid Flow 2016, 61, 562–574. [Google Scholar] [CrossRef]
- Harris, J. A note on the generalized Reynolds number in non-Newtonian flow. Br. J. Appl. Phys. 1963, 14, 817–818. [Google Scholar] [CrossRef]
- Hasegawa, T.; Ushida, A.; Narumi, T. Huge reduction in pressure drop of water, glycerol/water mixture, and aqueous solution of polyethylene oxide in high speed flows through micro-orifices. Phys. Fluids 2009, 21, 052002. [Google Scholar] [CrossRef]
- Hasegawa, T.; Ushida, A.; Narumi, T. A simple expression for pressure drops of water and other low molecular liquids in the flow through micro-orifices. Phys. Fluids 2015, 27, 122001. [Google Scholar] [CrossRef]
- Hasegawa, T.; Ushida, A.; Narumi, T.; Goda, M. Is the water flow more or less than that predicted by the Navier-Stokes equation in micro-orifices? Phys. Fluids 2016, 28, 092005. [Google Scholar] [CrossRef]
- Shweitzer, B.; Zanette, D.; Itri, R. Bovine serum albumin (BSA) plays a role in the size of SDS micelle-like aggregates at the saturation binding: The ionic strength effect. J. Colloid Interface Sci. 2004, 277, 285–291. [Google Scholar] [CrossRef]
- Yoshii, N.; Okazaki, S. A molecular dynamics study of structural stability of spherical SDS micelle as a function of its size. Chem. Phys. Lett. 2006, 425, 58–61. [Google Scholar] [CrossRef]
- Yoshii, N.; Iwahashi, K.; Okazaki, S. A molecular dynamics study of free energy of micelle formation for sodium dodecyl sulfate in water and its size distribution. J. Chem. Phys. 2006, 124, 184901. [Google Scholar] [CrossRef]
- Sprycha, R. Electrical double layer at alumina/electrolyte interface: I. Surface charge and zeta potential. J. Colloid Interface Sci. 1989, 127, 1–11. [Google Scholar] [CrossRef]
- Attard, P. Recent advances in the electric double layer in colloid science. Curr. Opin. Colloid Interface Sci. 2001, 6, 366–371. [Google Scholar] [CrossRef]
- Joly, L.; Ybert, C.; Trizac, E.; Bocquet, L. Hydrodynamics within the electric double layer on slipping surfaces. Phys. Rev. Lett. 2004, 93, 257805. [Google Scholar] [CrossRef]
- Takahashi, M. ζ potential of microbubbles in aqueous solutions: Electrical properties of the gas-water interface. J. Phys. Chem. B 2005, 109, 21858–21864. [Google Scholar] [CrossRef]
- Hasegawa, H.; Nagasaka, Y.; Kataoka, H. Electrical potential of microbubble generated by shear flow in pipe with slits. Fluid Dyn. Res. 2008, 40, 554–564. [Google Scholar] [CrossRef]
- Takahashi, M.; Chiba, K.; Li, P. Free-radical generation from collapsing microbubbles in the absence of a dynamic stimulus. J. Phys. Chem. B 2007, 111, 1343–1347. [Google Scholar] [CrossRef]
- Lunkenheimer, K.; Wantke, K.D. Determination of the surface tension of surfactant solutions applying the method of Lecomte du Noüy (ring tensiometer). Colloid Polym. Sci. 1981, 259, 354–366. [Google Scholar] [CrossRef]
- Ushida, A.; Hasegawa, T.; Nakajima, T.; Uchiyama, H.; Narumi, T. Drag reduction effect of nanobubble mixture flows through micro-orifices and capillaries. Exp. Therm. Fluid Sci. 2012, 39, 54–59. [Google Scholar] [CrossRef]
- Ushida, A.; Hasegawa, T.; Narumi, T.; Nakajima, T. Flow properties of nanobubble mixtures passing through micro-orifices. Int. J. Heat Fluid Flow 2013, 40, 106–115. [Google Scholar] [CrossRef]
- Yasui, K.; Tuziuti, T.; Kanematsu, W.; Kato, K. Dynamic equilibrium model for a bulk nanobubble and a microbubble partly covered with hydrophobic material. Langmuir 2016, 32, 11101–11110. [Google Scholar] [CrossRef]
Figure 1.
Relationship between wall shear stress and wall shear rate of all test fluids using capillary-type viscosity meter with inner diameter or 600 . Water alone, mixed microbubble water (MB), and anionic surfactant solution (SDS) exhibited Newtonian viscosity (). On the other hand, only polymer solution (PAA) exhibited non-Newtonian viscosity (power-law model; constant factor and power-law index ).

Figure 2.
Jet thrust plotted against wall shear rate of test fluids. Only polyacrylamide (PAA) exhibited elastic properties because of reducing jet thrust.
Figure 2.
Jet thrust plotted against wall shear rate of test fluids. Only polyacrylamide (PAA) exhibited elastic properties because of reducing jet thrust.

Figure 3.
Schematic of experimental apparatus for measuring pressure drop at constant flow rate.

Figure 4.
Photographs of the inner diameter for (a) 750 and (b) 110 .

Figure 5.
Experimental results for water alone and mixed microbubble water (MB) for frictional coefficient plotted against Reynolds number : (a) all data; (b) . The critical Reynolds number of water alone is () and (). Moreover, the of MB is () and ().
Figure 5.
Experimental results for water alone and mixed microbubble water (MB) for frictional coefficient plotted against Reynolds number : (a) all data; (b) . The critical Reynolds number of water alone is () and (). Moreover, the of MB is () and ().

Figure 6.
Experimental results for water alone and anionic surfactant solution (SDS) for frictional coefficient as a function of Reynolds number : (a) all data; (b) . The critical Reynolds number of SDS is () and ().
Figure 6.
Experimental results for water alone and anionic surfactant solution (SDS) for frictional coefficient as a function of Reynolds number : (a) all data; (b) . The critical Reynolds number of SDS is () and ().

Figure 7.
Experimental results for water alone and PAA for frictional coefficient versus Reynolds number or generalized Reynolds number : (a) all data; (b) . The critical Reynolds number of PAA is () and ().
Figure 7.
Experimental results for water alone and PAA for frictional coefficient versus Reynolds number or generalized Reynolds number : (a) all data; (b) . The critical Reynolds number of PAA is () and ().

Figure 8.
Schematic of experimental apparatus for measuring interfacial tension (du Noüy method).

Figure 9.
Frictional coefficient against capillary number of water alone, MB, and SDS. For water alone, the critical capillary number is () and (). For MB, the critical capillary number is () and (). For SDS, the critical capillary number is () and ().
Figure 9.
Frictional coefficient against capillary number of water alone, MB, and SDS. For water alone, the critical capillary number is () and (). For MB, the critical capillary number is () and (). For SDS, the critical capillary number is () and ().

Publisher’s Note: MDPI stays neutral with regard to jurisdictional claims in published maps and institutional affiliations. |
© 2021 by the authors. Licensee MDPI, Basel, Switzerland. This article is an open access article distributed under the terms and conditions of the Creative Commons Attribution (CC BY) license (https://creativecommons.org/licenses/by/4.0/).
Share and Cite
MDPI and ACS Style
Kobayashi, T.; Ushida, A.; Sato, T. Pseudo-Laminarization of Mixed Microbubble Water and Complex Fluids in Capillary Flows. Symmetry 2021, 13, 1141. https://0-doi-org.brum.beds.ac.uk/10.3390/sym13071141
AMA Style
Kobayashi T, Ushida A, Sato T. Pseudo-Laminarization of Mixed Microbubble Water and Complex Fluids in Capillary Flows. Symmetry. 2021; 13(7):1141. https://0-doi-org.brum.beds.ac.uk/10.3390/sym13071141
Chicago/Turabian StyleKobayashi, Takaki, Akiomi Ushida, and Taisuke Sato. 2021. "Pseudo-Laminarization of Mixed Microbubble Water and Complex Fluids in Capillary Flows" Symmetry 13, no. 7: 1141. https://0-doi-org.brum.beds.ac.uk/10.3390/sym13071141
Note that from the first issue of 2016, this journal uses article numbers instead of page numbers. See further details here.