
Curvature and Entropy Statistics-Based Blind Multi-Exposure Fusion Image Quality Assessment

1
Faculty of Information Science and Engineering, Ningbo University, Ningbo 315211, China
2
College of Science and Technology, Ningbo University, Ningbo 315211, China
3
Business School, Ningbo University, Ningbo 315211, China
*
Author to whom correspondence should be addressed.
Symmetry 2021, 13(8), 1446; https://0-doi-org.brum.beds.ac.uk/10.3390/sym13081446
Submission received: 28 June 2021
/
Revised: 31 July 2021
/
Accepted: 2 August 2021
/
Published: 6 August 2021
Abstract
:The multi-exposure fusion (MEF) technique provides humans a new opportunity for natural scene representation, and the related quality assessment issues are urgent to be considered for validating the effectiveness of these techniques. In this paper, a curvature and entropy statistics-based blind MEF image quality assessment (CE-BMIQA) method is proposed to perceive the quality degradation objectively. The transformation process from multiple images with different exposure levels to the final MEF image leads to the loss of structure and detail information, so that the related curvature statistics features and entropy statistics features are utilized to portray the above distortion presentation. The former features are extracted from the histogram statistics of surface type map calculated by mean curvature and Gaussian curvature of MEF image. Moreover, contrast energy weighting is attached to consider the contrast variation of the MEF image. The latter features refer to spatial entropy and spectral entropy. All extracted features based on a multi-scale scheme are aggregated by training the quality regression model via random forest. Since the MEF image and its feature representation are spatially symmetric in physics, the final prediction quality is symmetric to and representative of the image distortion. Experimental results on a public MEF image database demonstrate that the proposed CE-BMIQA method achieves more outstanding performance than the state-of-the-art blind image quality assessment ones.
1. Introduction
With the rapid development and popularization of multimedia information technology, high-quality images have become one of the indispensable media contents in our daily lives. Multi-exposure fusion (MEF) can be considered an effective technique to enhance the quality of the image [1]. It provides us a new choice to obtain as much natural scene information on the bright and dark regions as possible [2]. However, the weight assignment processes of MEF algorithms for image fusion will bring about the quality degradation problem that affects the symmetrical perception of the human eyes, especially the structure and detail loss by the underexposure and overexposure [3]. Therefore, it is urgent to design the specific objective quality assessment methods for MEF images. Actually, the performance of any objective quality assessment method is best gauged by its correlation with human subjective opinions of quality. Such human subjective opinions are obtained by conducting the subjective quality assessment. When the opinions are averaged, the mean opinion score (MOS) is obtained, representing the perceptual subjective quality.
Up to now, several studies have been proposed to solve the quality assessment problem for ordinary images. Different image quality assessment (IQA) methods can be divided into three categories: full-reference (FR), reduced-reference (RR), and no-reference/blind (NR) [4]. The FR and RR IQA methods need the pre-defined reference information to make the comparison, while blind IQA (BIQA) methods do not. Since the reference image is difficult to be obtained in real applications, the development of BIQA methods may be more meaningful. Generally, BIQA methods need some quality-sensitive features to learn the quality prediction model. Therefore, the core of designing BIQA methods refers to feature extraction.
Some excellent BIQA methods for ordinary images have been presented via natural scene statistics (NSS) analysis [5,6,7,8,9,10]. For example, one of the famous methods is blind/referenceless image spatial quality evaluator (BRISQUE) [5], which uses scene statistics of locally normalized luminance coefficients to quantify the naturalness loss. The specific features refer to the parameters of NSS models including the empirical distribution of locally normalized luminances and products of locally normalized luminances in the spatial domain. Moreover, Moorthy et al. [6] proposed NSS-based method, dubbed the distortion identification-based image integrity and verity evaluation (DIIVINE) method. It combines the distortion identification with distortion-specific IQA process which mainly extracts the summary statistics based on an NSS wavelet coefficient model. Different from DIIVINE, Saad et al. [7] designed the blind image notator using discrete cosine transform (DCT) statistics (BLINDS-II) method in the DCT domain, and the estimated parameters of the DCT coefficients-based NSS model were utilized to form features for perceptual quality prediction. Li et al. [8] extracted a novel effective structural feature to perceive structural degradation, which utilized the local binary pattern (LBP) to encode the gradient information (GLBP) of images, denoted as the gradient-weighted histogram of GLBP (GWH-GLBP) method. Liu et al. [9] focused on the gradient orientation which has not been deeply explored before, and also deployed a relative gradient magnitude feature accounting for perceptual masking, the method called oriented gradients IQA (OG-IQA). Oszust et al. [10] proposed a hand-crafted blind image assessment measure with local descriptor and derivative filters (SCORER), which emphasized the local features carried by image derivatives of different orders and used for the quality prediction. In addition, Liu et al. [11] constructed the CurveletQA method by utilizing the curvelet transform to extract a set of statistical features, including the coordinates of the maxima of the log-histograms of the curvelet coefficients values, and the energy distributions of both orientation and scale. Gu et al. [12] combined local and global considerations to develop a new NR image quality metric for contrast distortion (NIQMC). The basic principle behind the NIQMC method is that an image with more valuable information has better quality.
However, the above-mentioned BIQA methods are just attempting for quality assessment for ordinary images, which cannot accurately predict the quality of MEF images. Currently, with the emergence of various multi-media forms, the tone-mapped image has also attracted a lot of attention. It is transformed from high dynamic range (HDR) image, which is also a technology for quality enhancement [13]. For tone-mapped images, Gu et al. [14] established a blind tone-mapped quality index (BTMQI) method by analyzing the image information, naturalness, and structure. Kundu et al. [15] extracted the NSS features from spatial domain and HDR-specific gradient features in the gradient domain to design a method called HDR image gradient-based evaluator (HIGRADE). Although the tone-mapped HDR technology has a similar goal with MEF technology, the latter one bypasses the creation process of HDR images. Naturally, the resulting image obtained by the two technologies will present different phenomena.
Overall, the aforementioned methods can accurately evaluate the quality of ordinary and tone-mapped images, while the experimental performances validated on the available MEF database are not always excellent due to the specific distortion that existed in MEF images, such as detail information loss by overexposure and underexposure. It is desirable to propose the IQA methods for MEF images. Currently, there are some FR methods [3,16,17,18,19] for the MEF image. Such as, Ma et al. [3] proposed an FR IQA method based on the structural similarity [20]. Xing et al. [16] designed a method for MEF images by utilizing the contrast structure and contrast saturation. Deng et al. [17] extracted color, structure, and texture-related features for quality regression. Rahman et al. [18] proposed a quality map fusion approach to obtain the true reference of source MEF images for the perceptual quality assessment. Martinez et al. [19] combined multi-scale computation and structural similarities for quality prediction. However, there are almost no specific BIQA methods designed for MEF images.
To propose an appropriate BIQA method for MEF images, how to extract effective feature vectors to distinguish the difference of MEF images with good/poor representations is a rather critical issue. Motivated by these, a curvature and entropy statistics-based blind MEF image quality assessment (CE-BMIQA) method are proposed in this paper, and the main contributions are concluded as follows:
- (1)
- In terms of structure and detail distortion introduced by inappropriate exposure conditions, the histogram statistics features of surface type maps generated from the mean and Gaussian curvature, and entropy statistics features in the spatial and spectral domains are extracted to form the quality-aware feature vectors.
- (2)
- Since the contrast variation is a key factor affecting the quality of the MEF image, contrast energy weights are designed to aggregate the above curvature features. Furthermore, a multi-scale scheme is adopted to perceive the distortion of the image in different resolutions for simulating the multi-channel characteristics in the human visual system.
- (3)
- Considering that it is significant for multimedia applications to bridge the gap between BIQA methods and MEF images, a novel CE-BMIQA method specialized for MEF images is proposed. Experimental results on the available MEF database demonstrate the superiority of the proposed CE-BMIQA method compared with the state-of-the-art BIQA methods.
The remaining of this paper is organized as follows: the proposed CE-BMIQA method is specifically analyzed in Section 2. The experimental results and analysis including database and experimental protocols, performance comparison, impacts of individual feature set and scale number, and computational complexity are provided in Section 3. Further discussion is given in Section 4. Finally, the conclusion is given in Section 5.
2. Proposed CE-BMIQA Method
As the previous introduction mentioned, MEF technology merges a sequence of images with different exposure levels into a MEF image, which can be formulated as
where k is the number of the multi-exposure source images, Xv(r) and ωv(r) represent the luminance value and the weight of the r-th pixel in the v-th exposure image, respectively, I denotes the output MEF image.
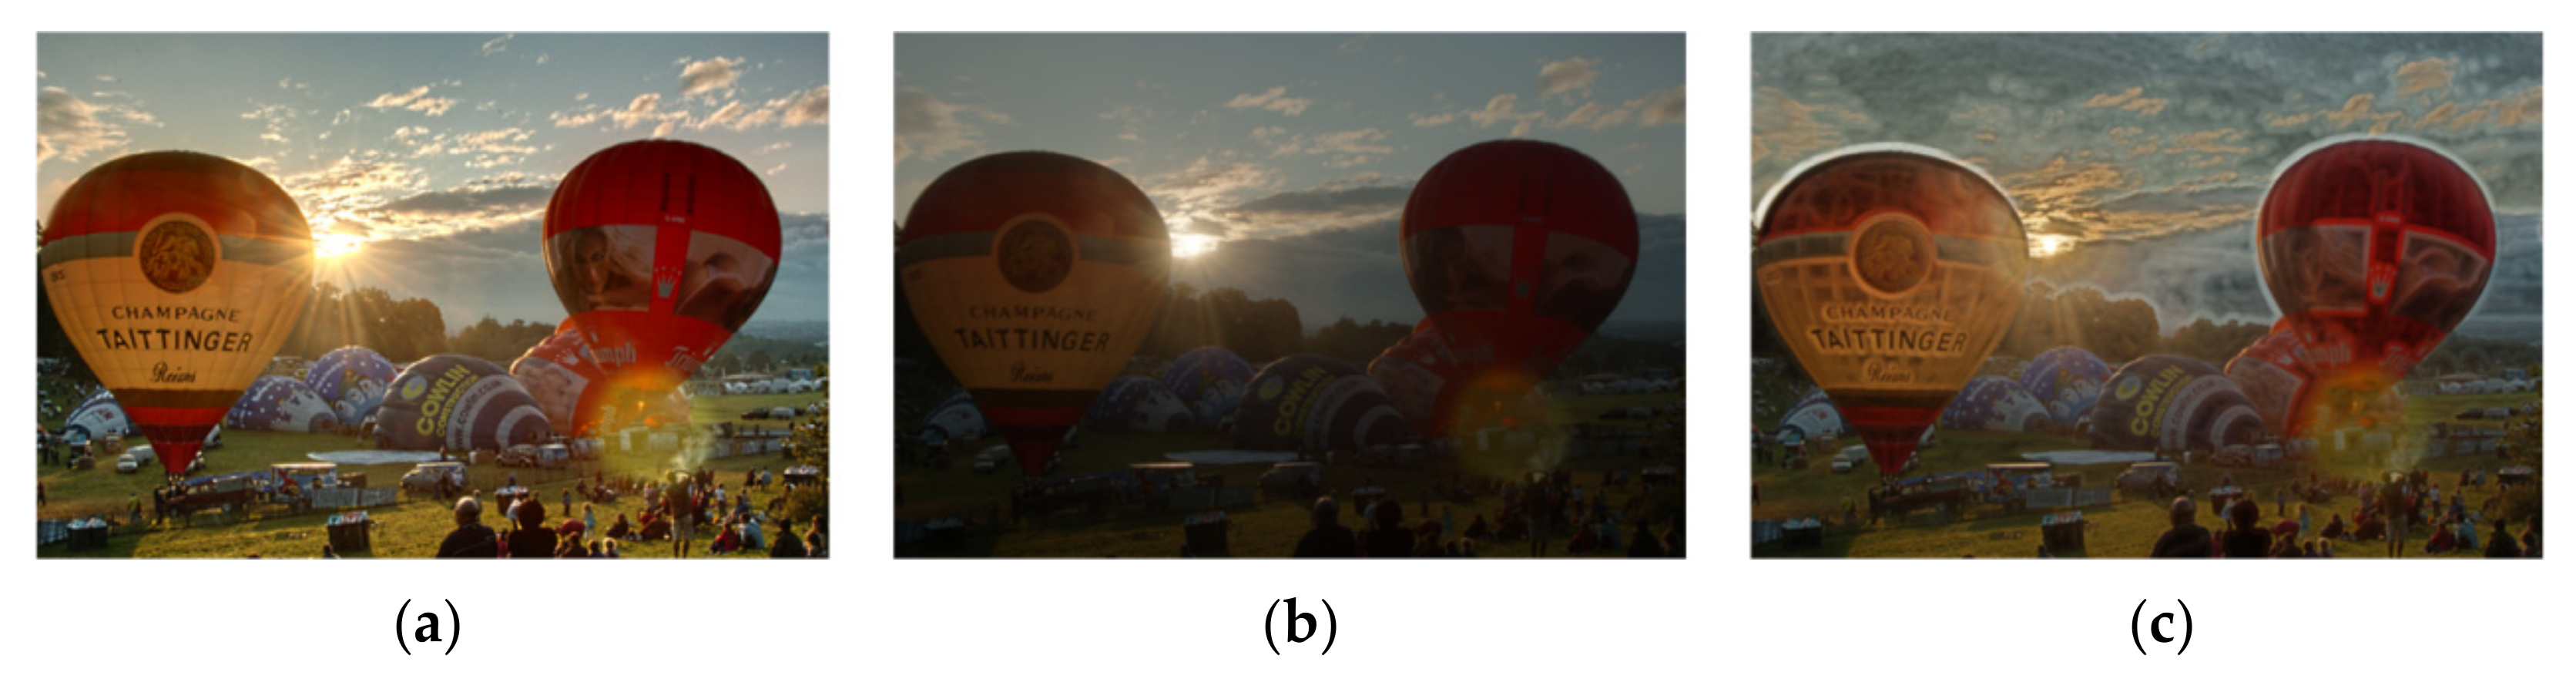
After the weight assignment process, the MEF image is prone to quality degradation in some areas due to the unreasonable distributed weights among source multi-exposure images, which is usually expressed as the structure and information loss by the underexposure and overexposure. Figure 1 depicts three MEF images generated by Li’s algorithm [21], Raman’s algorithm [22], and local energy weighting [23], the corresponding mean opinion score (MOS) values are also provided, where the higher the MOS value, the better the visual quality of the MEF image. From Figure 1, the following observations can be drawn: Figure 1a is the best with its abundant detail information and proper exposure to be full of recognition; Figure 1b has lower brightness due to underexposure condition, and cannot preserve the fine details in—crowd, grass, and balloon areas; Figure 1c yields the annoying and unnatural artifacts near the edges of sky and balloon, which is regarded as a pseudo contour. Moreover, the MOS values of three MEF images are 8.74, 3.17, and 2.70, respectively. Therefore, structure and information preservation directly affect the visual perceptual quality of MEF images. Obviously, the distortion form of the MEF image is symmetric to its final prediction quality.
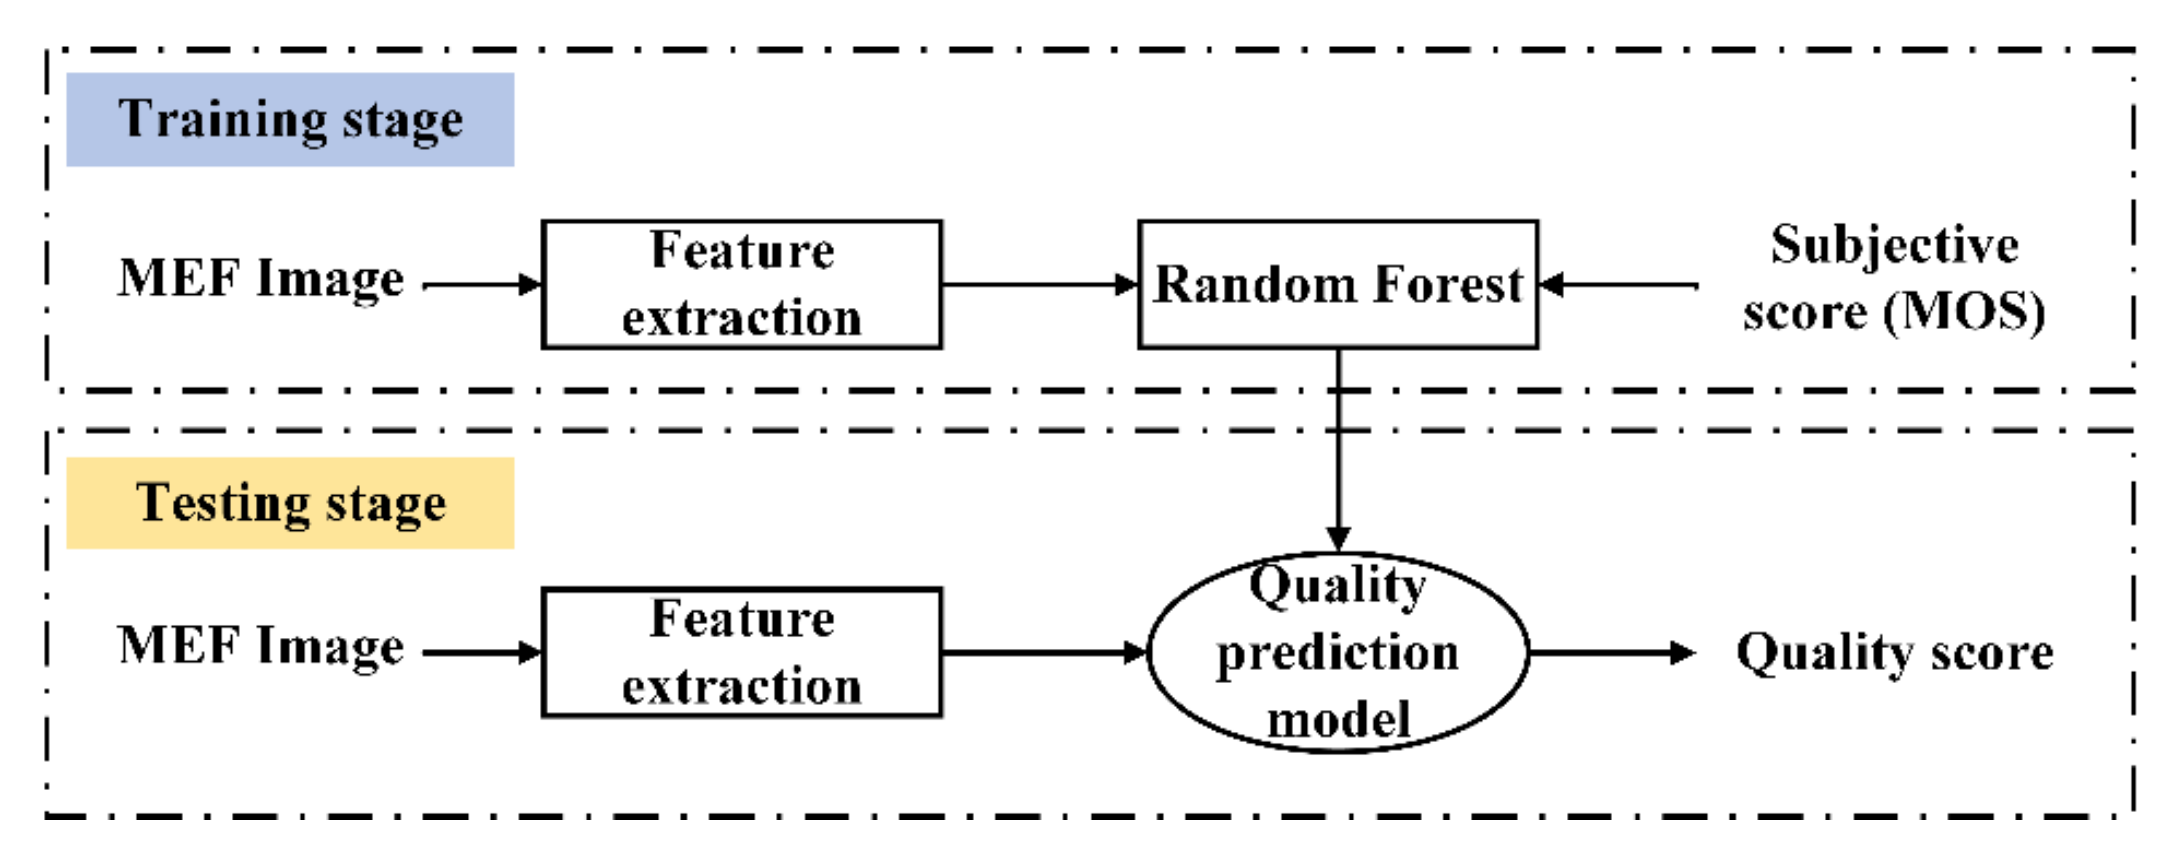
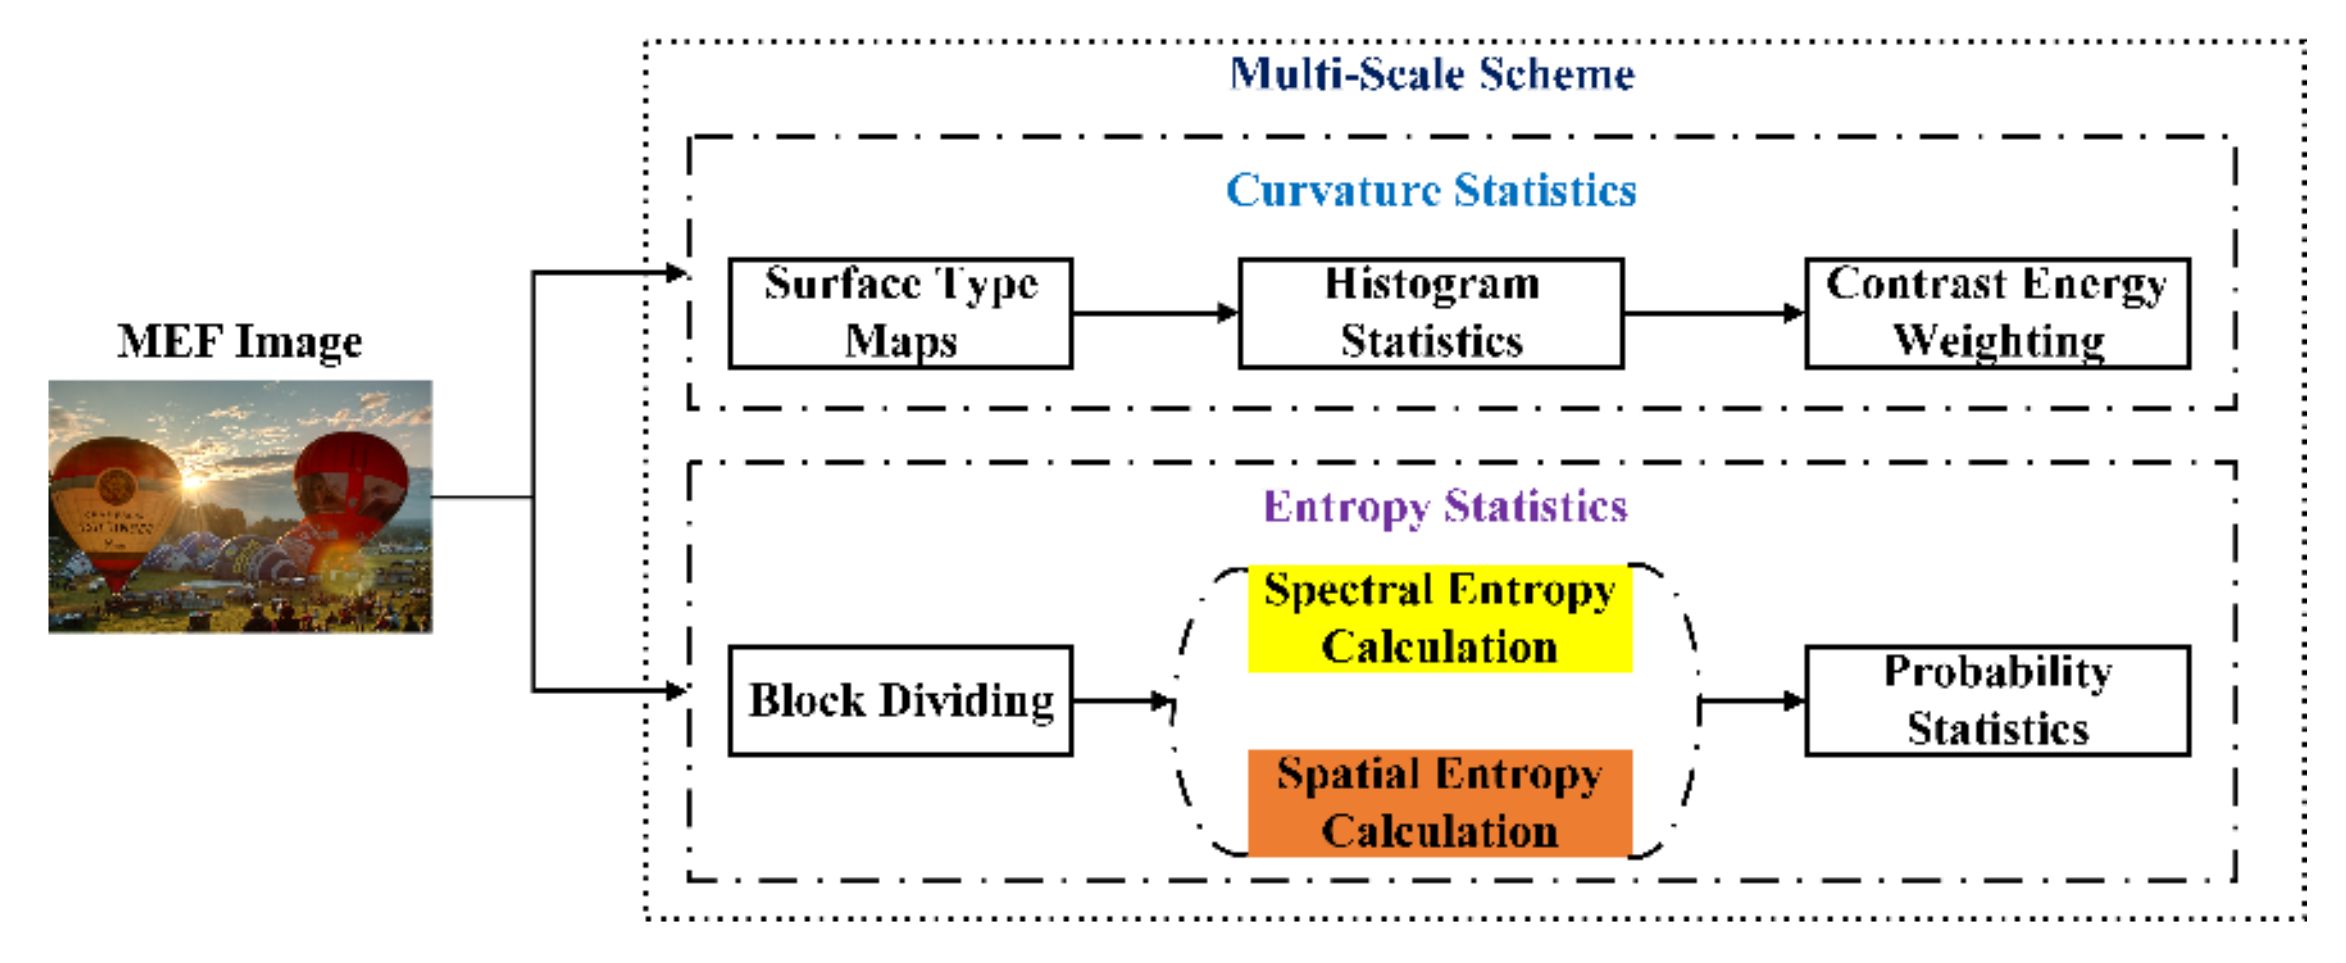
Generally, a BIQA method includes two stages that are training stage and testing stage, the schematic flowchart is shown in Figure 2. The specific conceptual steps are given in Table 1. To meet the quality discriminative requirement, a novel BIQA method for the MEF image is proposed, dubbed as CE-BMIQA, and Figure 3 depicts the feature extraction process of the CE-BMIQA method; refer to Figure 2 and Table 1 for other processes. Specifically, two types of effective features (i.e., the histogram statistics of surface type maps and entropy statistics) are excavated for discriminating the above-described distortion. Then, a feature-weighting approach based on contrast energy is designed to capture the structure loss of image with contrast changes. Finally, all extracted features based on a multi-scale scheme are aggregated to establish the mapping relationship with subjective scores, which is a symmetric process. The detailed implementations of the proposed CE-BMIQA method are given in the following three subsections.
2.1. Curvature Statistics
Generally, a MEF image I(x,y) can be regarded as a product with irregular concave and convex structures, and the points on the image are classified into different types according to their geometric characteristics, which are known as surface types (STs) [24]. Considering STs will change with the introduction of distortion, they are utilized as the basis for the ultimate statistic feature computation to percept structural loss. First, the mean curvature Mc and Gaussian curvature Gc of I(x,y) are calculated to determine the type of each point in the MEF image [25], which is expressed as
where gx and gy are the first-order partial derivatives, and gxx, gyy, and gxy are the second-order partial derivatives, respectively.
To calculate gx, gy, gxx, gyy, and gxy, the MEF image I(x,y) should be smoothed by a binomial filter first. It can be represented as S = ssT, the vector s is expressed as
Then, derivative estimation window masks should be calculated via
where l0, l1, l2 are given by
Finally, gx, gy, gxx, gyy, and gxy can be defined as
where ∗ represents the convolution operation.
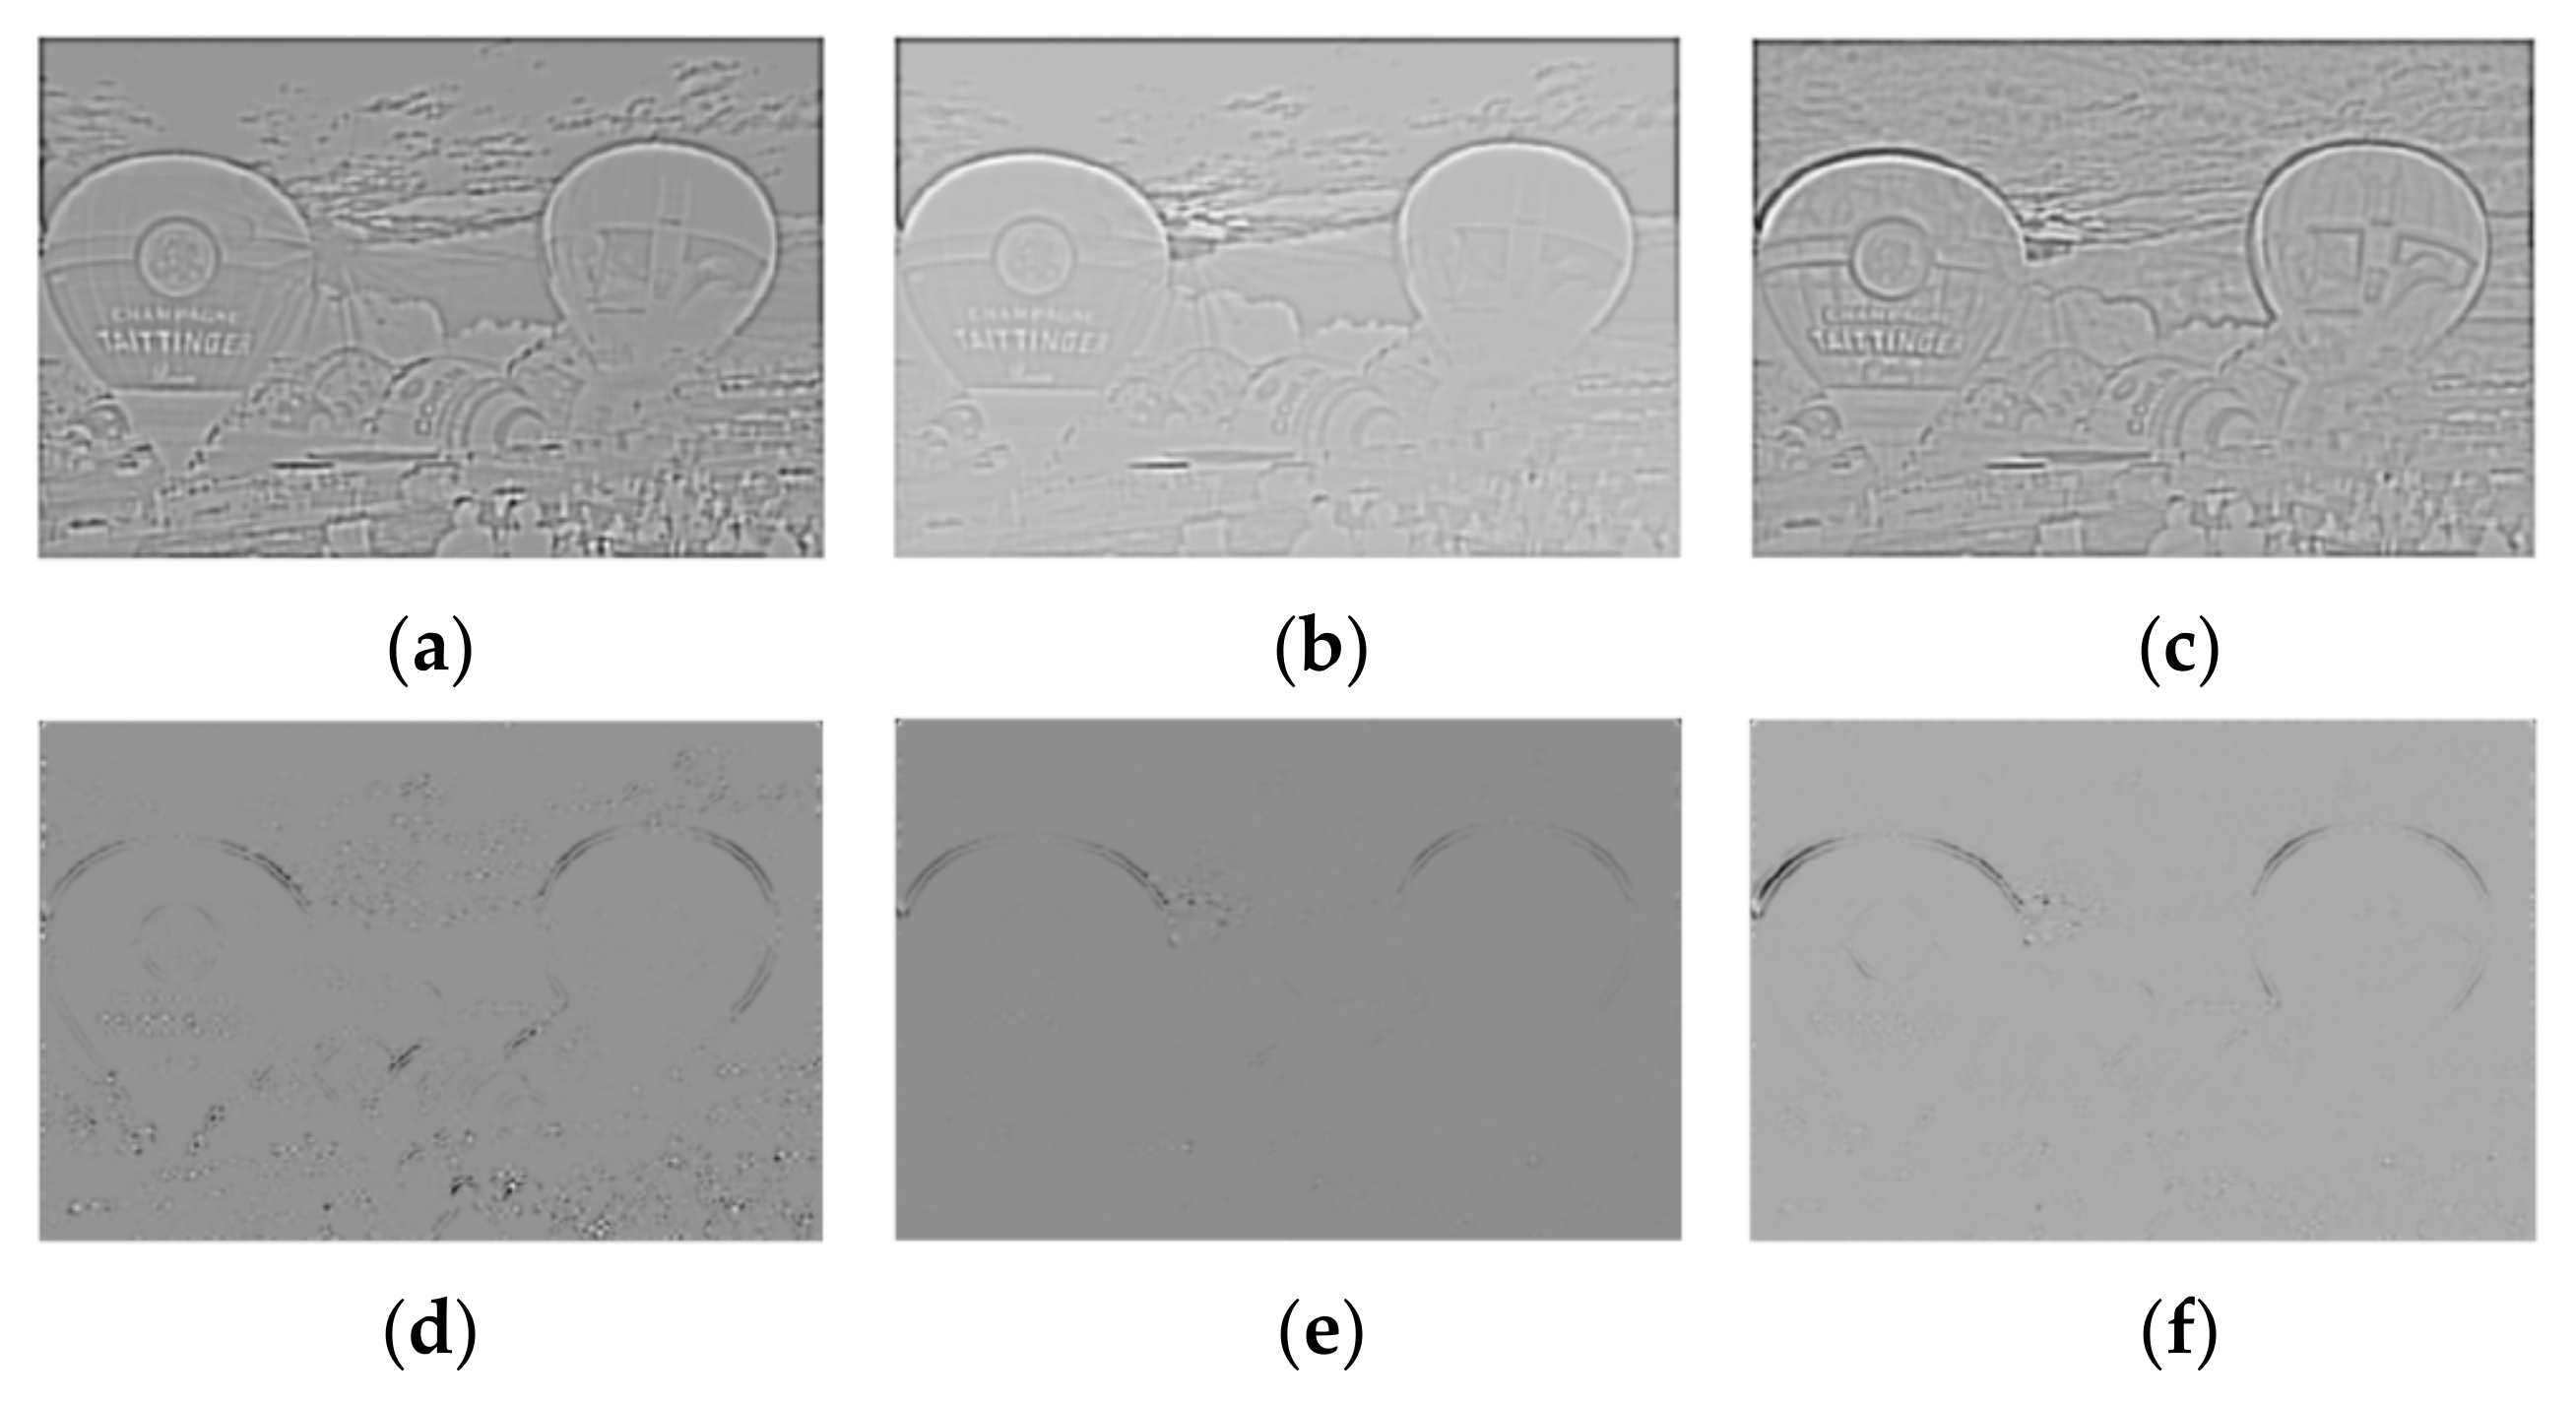
Figure 4 gives three corresponding mean and Gaussian curvature maps of Figure 1, it is pretty obvious that mean curvature maps emphasize more structural details of MEF images compared with Gaussian curvature maps, and they all have distinctive appearances because of the varying distortions.
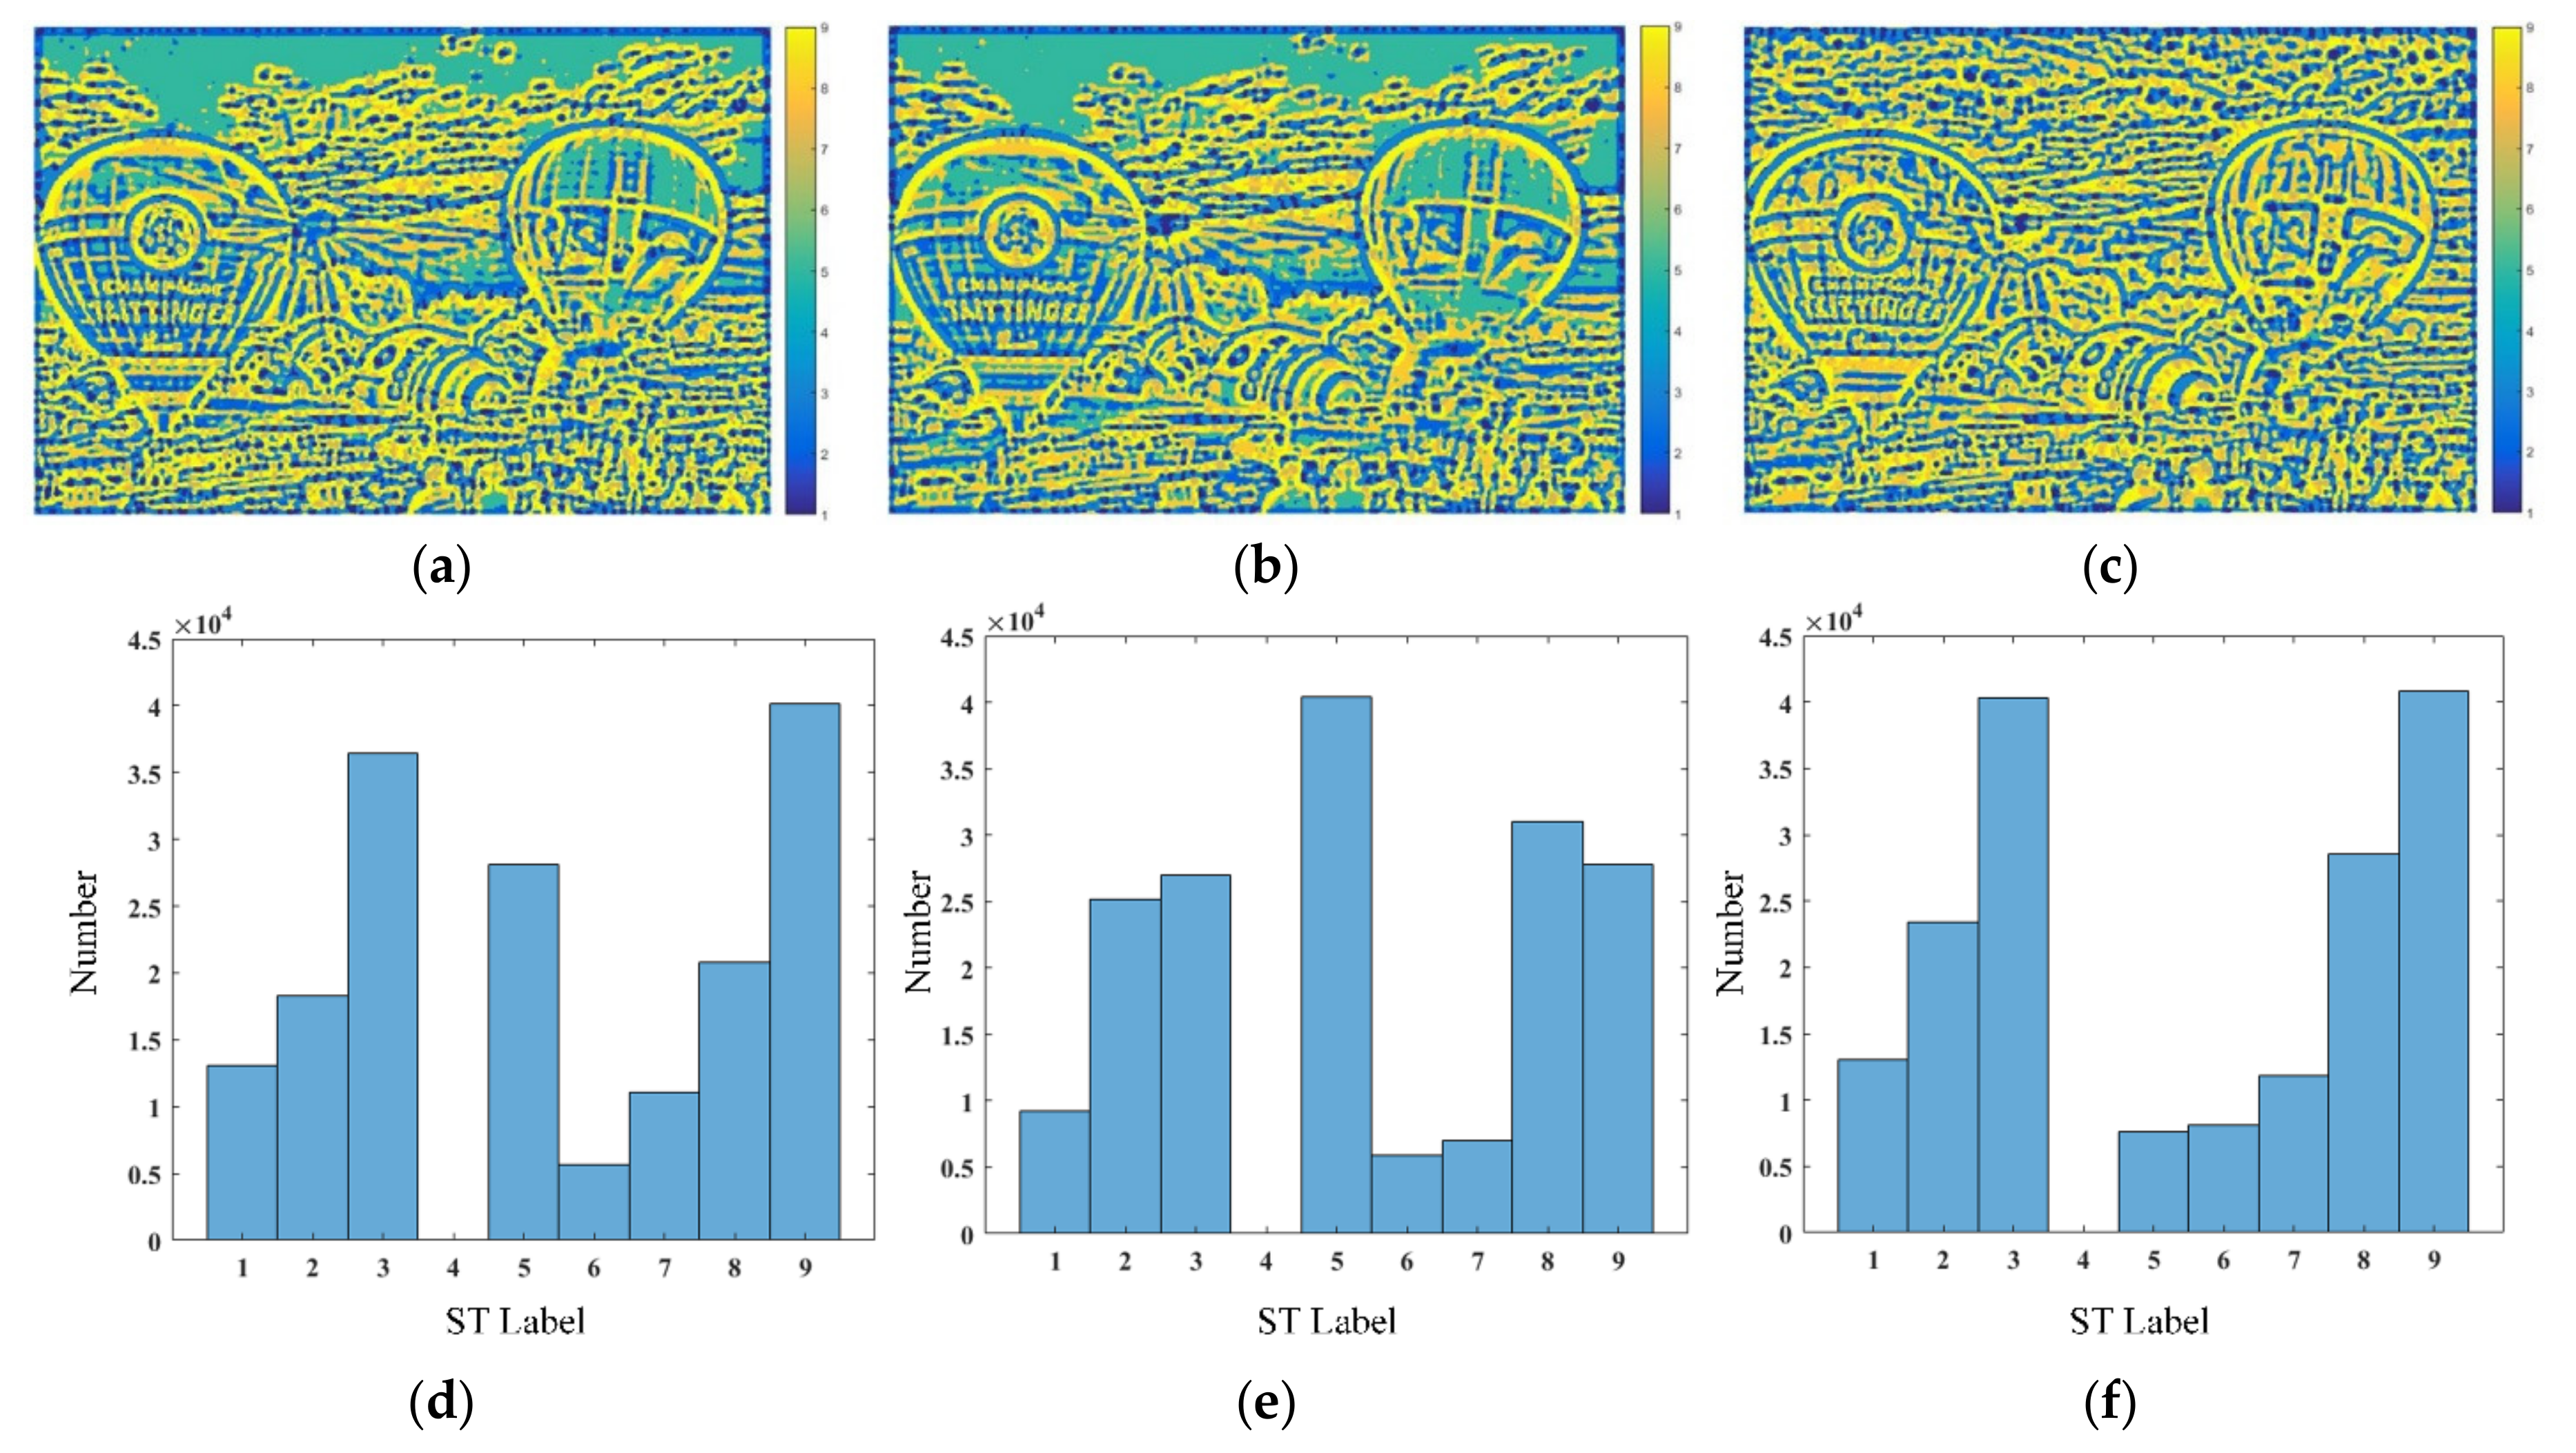
With the above-mentioned procedures, ST maps can be computed by different value combinations of Mc and Gc, while Mc and Gc just determine the graph surface shapes and the convex surface shapes, respectively. In total, there are nine STs obtained from the above curvature assignation process, and their complete definitions are listed in Table 2. From Table 2, it can be observed that each point in the MEF image can be categorized into eight fundamental STs (i.e., Peak, Ridge, Saddle Ridge, Flat, Minimal, Pit, Valley, and Saddle Valley) and one non-shaped ST (defined as “None”) for the combination of Mc = 0 and Gc > 0. Figure 5a–c shows three corresponding ST maps of Figure 1, it can be found that they are sensitive to the existing distortion among three MEF images. Therefore, it can be used as an effective way for distortion identification. To quantify the differences of ST maps clearly, histograms of them are also given in Figure 5d–f, respectively. In Figure 5d–f, the horizontal axis represents the ST label, and the vertical axis represents the number of each label. From them, corresponding STs histogram statistics will undergo variation greatly when MEF images are destroyed by complex distortion with different intensities.
Moreover, contrast variation of MEF image is also a key factor for affecting its visual quality. To simultaneously capture the structural details caused by contrast changes, a novel contrast energy weighted STs histogram statistic method is presented, which can be expressed as
where N is the number of pixels in a MEF image, j is the index of possible STs, and WC is the contrast energy map predicting local contrast [26], which is defined as:
where dv and dh are vertical and horizontal second derivatives of Gaussian function, respectively, o is the contrast gain, γ is the maximum value of φ(I), I represents the MEF image, and μ is the noise threshold. Note that the parameters o and μ in the Equation (10) are set according to the recommendations given in [26].
Finally, as the special case (i.e., ST = 4) is invalid, the 8-dimensional curvature statistics feature set is obtained and denoted as F1.
2.2. Entropy Statistic
As can be found from Figure 1, the amount of information contained in each MEF image is usually impaired to different degrees due to underexposure and overexposure, and it can be measured by the entropy, where information loss of image will cause a low entropy value. The entropy values of MEF images in Figure 1 are 7.6106, 7.2598, 6.8534, respectively. Our basic goal is to utilize entropy as statistic properties for distorted MEF images. Obviously, compared with global entropy, local entropy can better discriminate the information distribution in the spatial domain, which just eliminates the impact of special cases that MEF images with the same global entropy may appear distinctly different in visual quality. Since the local entropy is more sensitive to quality degradation, so the entropy of the MEF image block is calculated to analyze the joint distribution of each pixel in the spatial domain, which is defined as:
where n is the value of pixel in each MEF image block, and p(n) is the probability density of pixel value.
In addition, block-based entropy in the spectral domain (i.e., after the discrete cosine transformation (DCT) operation) is also computed by using the function of the probability distribution of DCT coefficients within 8 × 8 blocks. To calculate the spectral entropy, the DCT coefficient matrix C of each block should be obtained and then normalized to produce a probability distribution map, which is expressed as:
where a and b are the integers between 1 and 8, and . Then, the local spectral entropy is defined as:
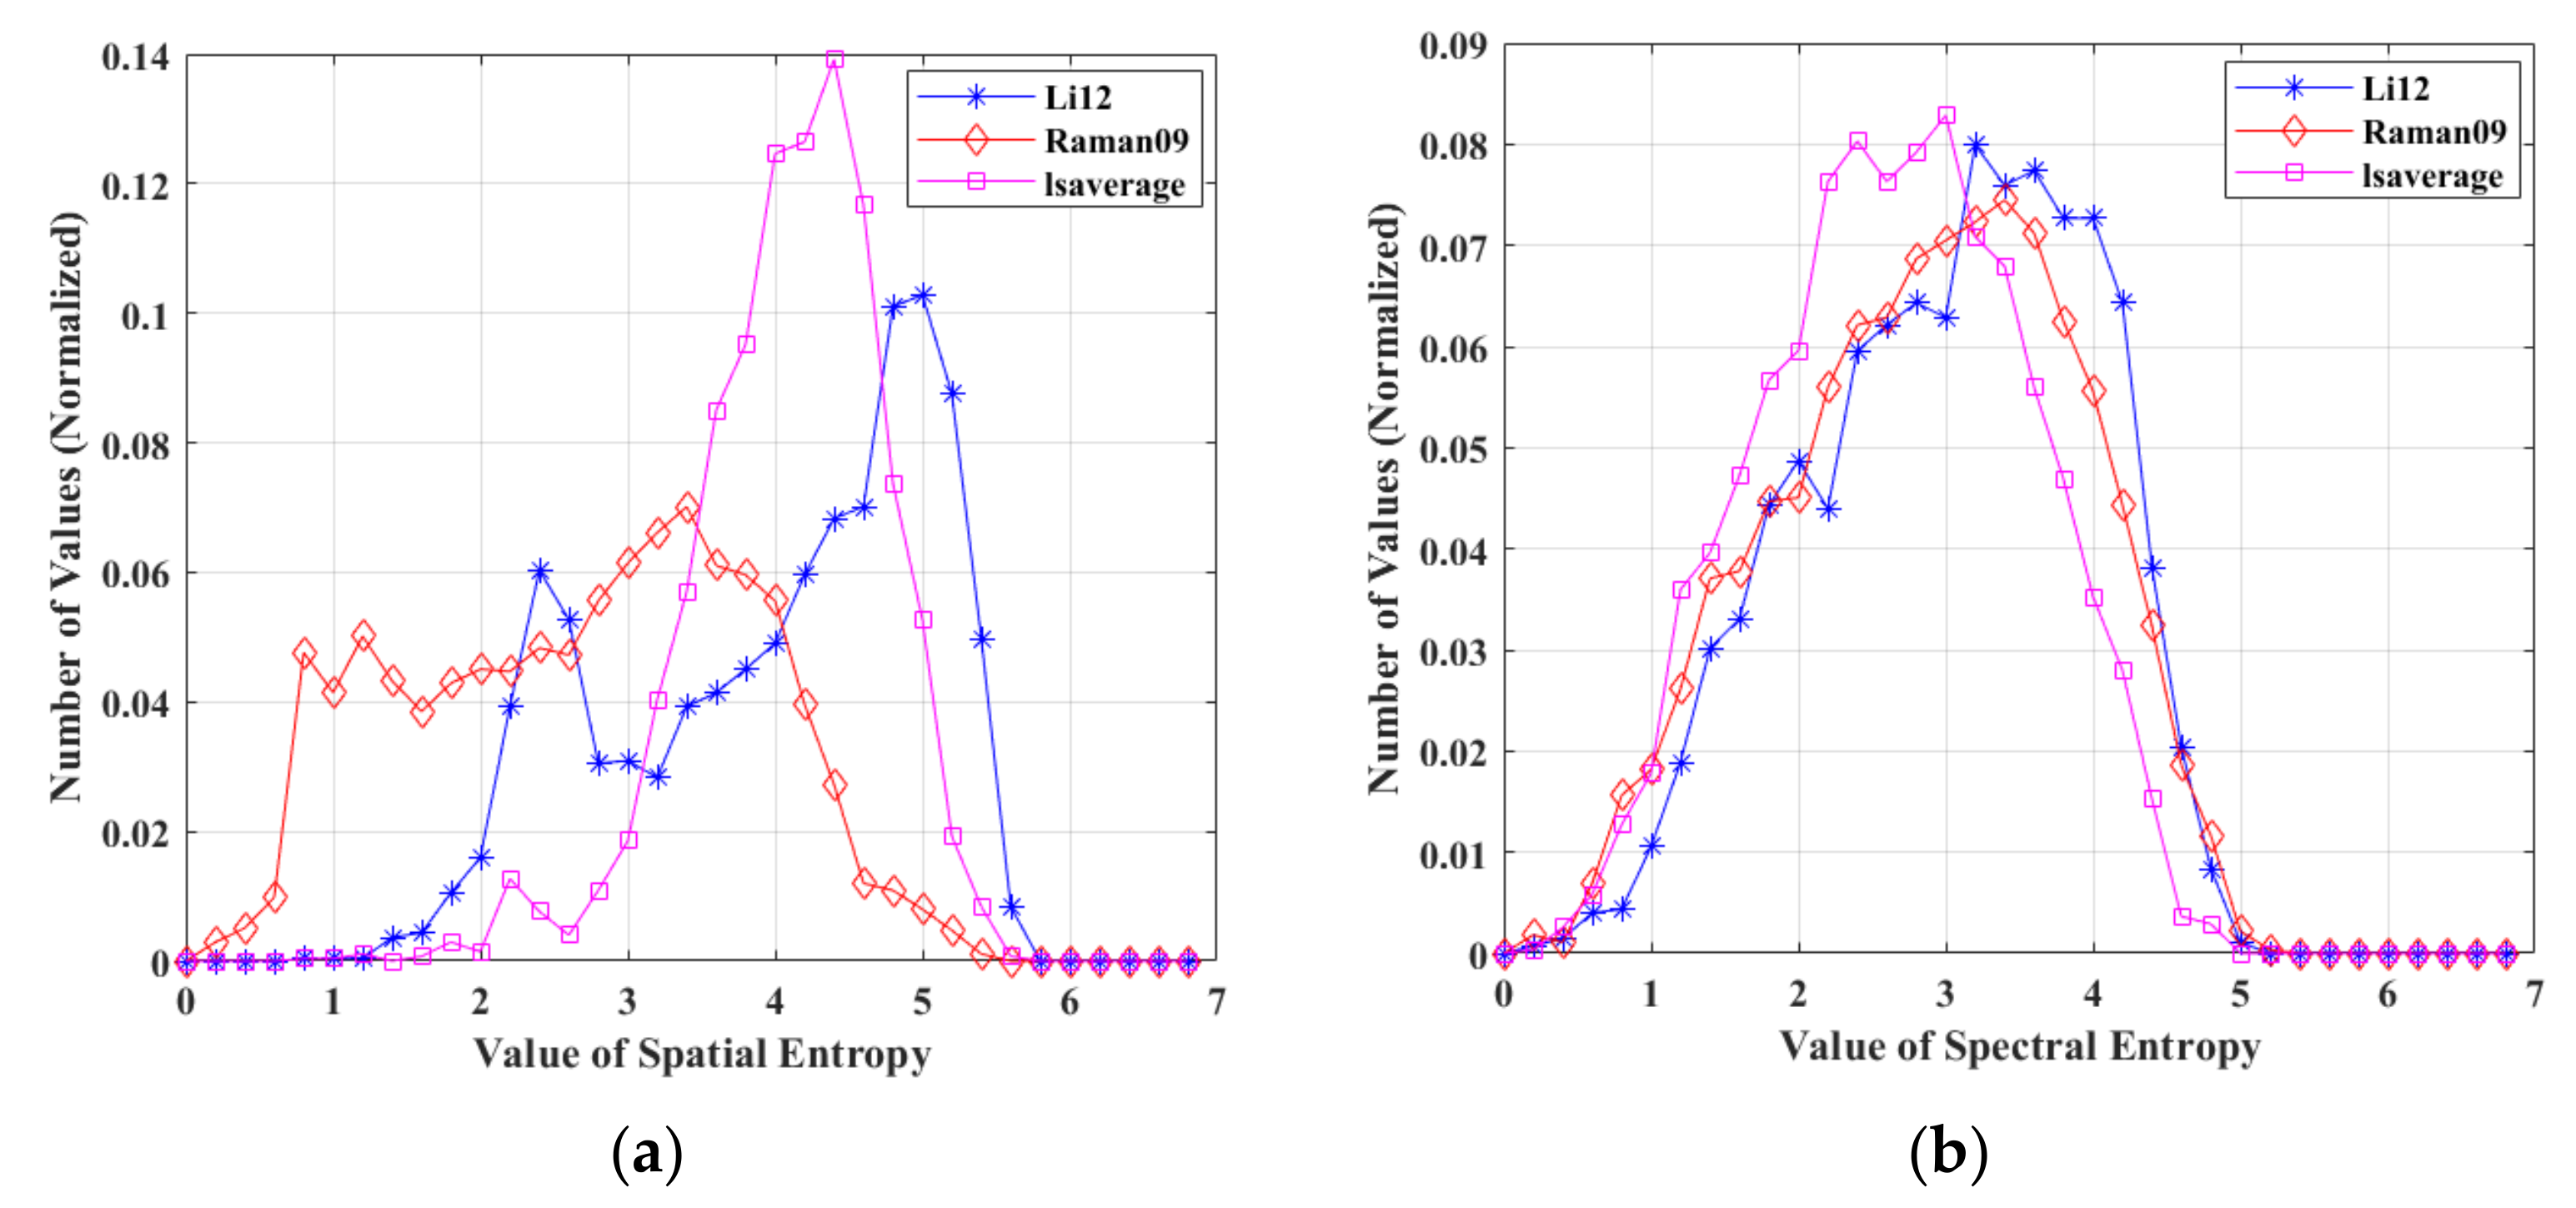
To observe the behavior of spatial and spectral entropy values against diverse distortions produced by different MEF algorithms, the above calculations are conducted on the different MEF images in Figure 1. As shown in Figure 6, different MEF algorithms bring different influences on the spatial and spectral entropy values, especially reflected in the shape of the histogram. Therefore, we use the mean and skew values of spatial and spectral entropy as the 4-dimensional entropy statistics feature set, denoted as F2.
2.3. Quality Regression
By aggregating the curvature and entropy statistics feature sets, a total of 12-dimensional feature vectors can be obtained and denoted as F = {F1, F2}. Moreover, multi-scale space of image can capture the contents from fine level to coarse level, which is inspired by the processing mechanism on the low-level retina of human visual system (HVS). Therefore, the above feature extraction process is carried out on l scales. After feature extraction, random forest (RF) is utilized to map the feature space to quality space, so that the final quality score Q can be computed by:
where fm(·) is the trained function for quality regression, and Fl is the extracted quality-aware feature vector on the l-th scale.
3. Experiment Results and Analysis
In this section, the experimental settings are introduced first, including database, evaluation protocols, and implementation details. Second, the proposed CE-BMIQA method is compared with state-of-the-art BIQA methods to verify its validity. Finally, the impacts of individual feature sets, the number of scales, and computational complexity are analyzed.
3.1. Database and Experimental Protocols
To verify the effectiveness of the proposed CE-BMIQA method, the comparative experiments were conducted on an available MEF subjective assessment database [3,27], which contains 136 MEF images with corresponding MOS values. Specially, all MEF images in the database are derived from 17 source multi-exposure images, and the ones belonging to the same image sequence are generated by 8 MEF algorithms, which include local energy weighted linear combination, global energy weighted linear combination, Raman09 [22], Gu12 [23], ShutaoLi12 [28], ShutaoLi13 [29], Li12 [21], and Mertens07 [30]. More details about this MEF image database are given in Figure 7 and Table 3, including the name, resolution, number, source of image sequences.
To objectively compare the performance of the proposed CE-BMIQA method with state-of-the-art BIQA methods, three commonly used evaluation criteria are utilized to reflect the relationship between the predicted objective quality and human subjective scores [5], i.e., the Pearson correlation coefficient (PLCC), Spearman rank-order correlation coefficient (SROCC), and root mean square error (RMSE). PLCC, SROCC, and RMSE measure the accuracy, monotonicity, and prediction error of BIQA methods, respectively. They are defined as:
where Qm and Zm denote the objective predicted score and subjective score (i.e., MOS) of the m-th MEF image, respectively, while and are the mean values of Qm and Zm, respectively, εm denotes the difference between the ranks of m-th MEF images in the subjective and objective assessments, and U denotes the total number of MEF images.
The optimal evaluation performance should achieve the following results that the absolute values of PLCC and SROCC are closer to 1, RMSE is closer to 0. According to the report from video quality expert group (VQEG) [31], a five-parameter logistic function is applied to make the relationship between subjective and objective quality scores more linear before calculating PLCC and RMSE, which is defined as
where {β1, β2,…, β5} are the fitting parameters determined by minimizing the sum of squared errors between the objective prediction score and MOS.
During the calculation of PLCC and RMSE, Q is replaced by Y(Q).
In terms of the proposed CE-BMIQA method, there are several experimental parameters to be set in the process of feature extraction, i.e., contrast gain o and noise threshold μ in Equation (10), the block size for entropy statistics, and the number of scale l. Specifically, according to the suggestion in [26], the contrast-gain and noise threshold are fixed at 0.1 and 0.2353, respectively. The noise threshold was determined in a separate image set consisting of 1800 images [32]. The block size for entropy statistics follows the conventional block size settings in the DCT process, that is, 8 × 8. However, the number of scale l may affect the performance of the CE-BMIQA method, and it is set as 3 in this experiment. The specific scale selection process is described in the following Section 3.4.
3.2. Performance Comparison
To verify the performance of the proposed CE-BMIQA method, two categories of the state-of-the-art BIQA methods are selected to make a comparison with it on the MEF image database [27]. The first category of BIQA methods is served for ordinary images, including BRISQUE [5], DIIVINE [6], BLINDS-II [7], GWH-GLBP [8], OG-IQA [9], SCORER [10], CurveletQA [11], NIQMC [12], and the second one contains two BIQA methods for tone-mapped images, i.e., BTMQI [14], HIGRADE [15]. Considering that there is no BIQA method specialized for the MEF image up to now, the aforementioned BIQA methods are utilized for performance comparison. To avoid errors, all methods are obtained from the original released code by authors. Moreover, these ten BIQA methods and the proposed method adopt the supervised learning way to predict the quality of MEF image, so the whole benchmark MEF image database is split into training and testing subsets, and 17-fold cross validation is used to evaluate the performance. Specifically, the MEF images belonging to the same scene are taken as units and the entire database is divided into 17 subsets. Subsequently, 16 subsets and the rest subset are used for training and testing, respectively. Finally, the above train-test stage is cycled in turn until all scenes are traversed, so as to obtain the objective predicted scores of each testing subset.
Table 4 and Table 5 list the PLCC and SROCC results of the proposed CE-BMIQA method and the other comparison BIQA methods for each MEF image sequence and whole database, where the best performance is highlighted in bold. Furthermore, the corresponding hit counts of best performance are recorded to better visualize the performance differences among eleven BIQA methods. From Table 4 and Table 5, the following findings can be drawn: (1) in terms of eight BIQA methods (i.e., BRISQUE [5], DIIVINE [6], BLINDS-II [7], GWH-GLBP [8], OG-IQA [9], SCORER [10], CurveletQA [11], NIQMC [12]) for ordinary images, their performances in quality prediction for MEF images are relatively poor, and the overall PLCC and SROCC values are only 0.534 and 0.525 at most, respectively. While GWH-GLBP method has the worst performance among these methods, only 0.163 and 0.113, and it can be regarded as invalid; (2) obviously, the performance of the latter two methods (i.e., BTMQI [14], HIGRADE [15]) for tone-mapped images are slightly better than the former eight methods, especially HIGRADE method. Such performance difference is likely to be attributed to a few similarities between the distortion caused by tone mapping algorithms and MEF algorithms. However, BTMQI and HIGRADE methods still cannot meet the demands for evaluating MEF images accurately without reference images; (3) the proposed CE-BMIQA method achieves 0.640 and 0.610 on PLCC and SROCC, respectively, which outperforms all competing BIQA methods, the reason is that it takes the impact of structural degradation and information loss caused by underexposure and overexposure into account.
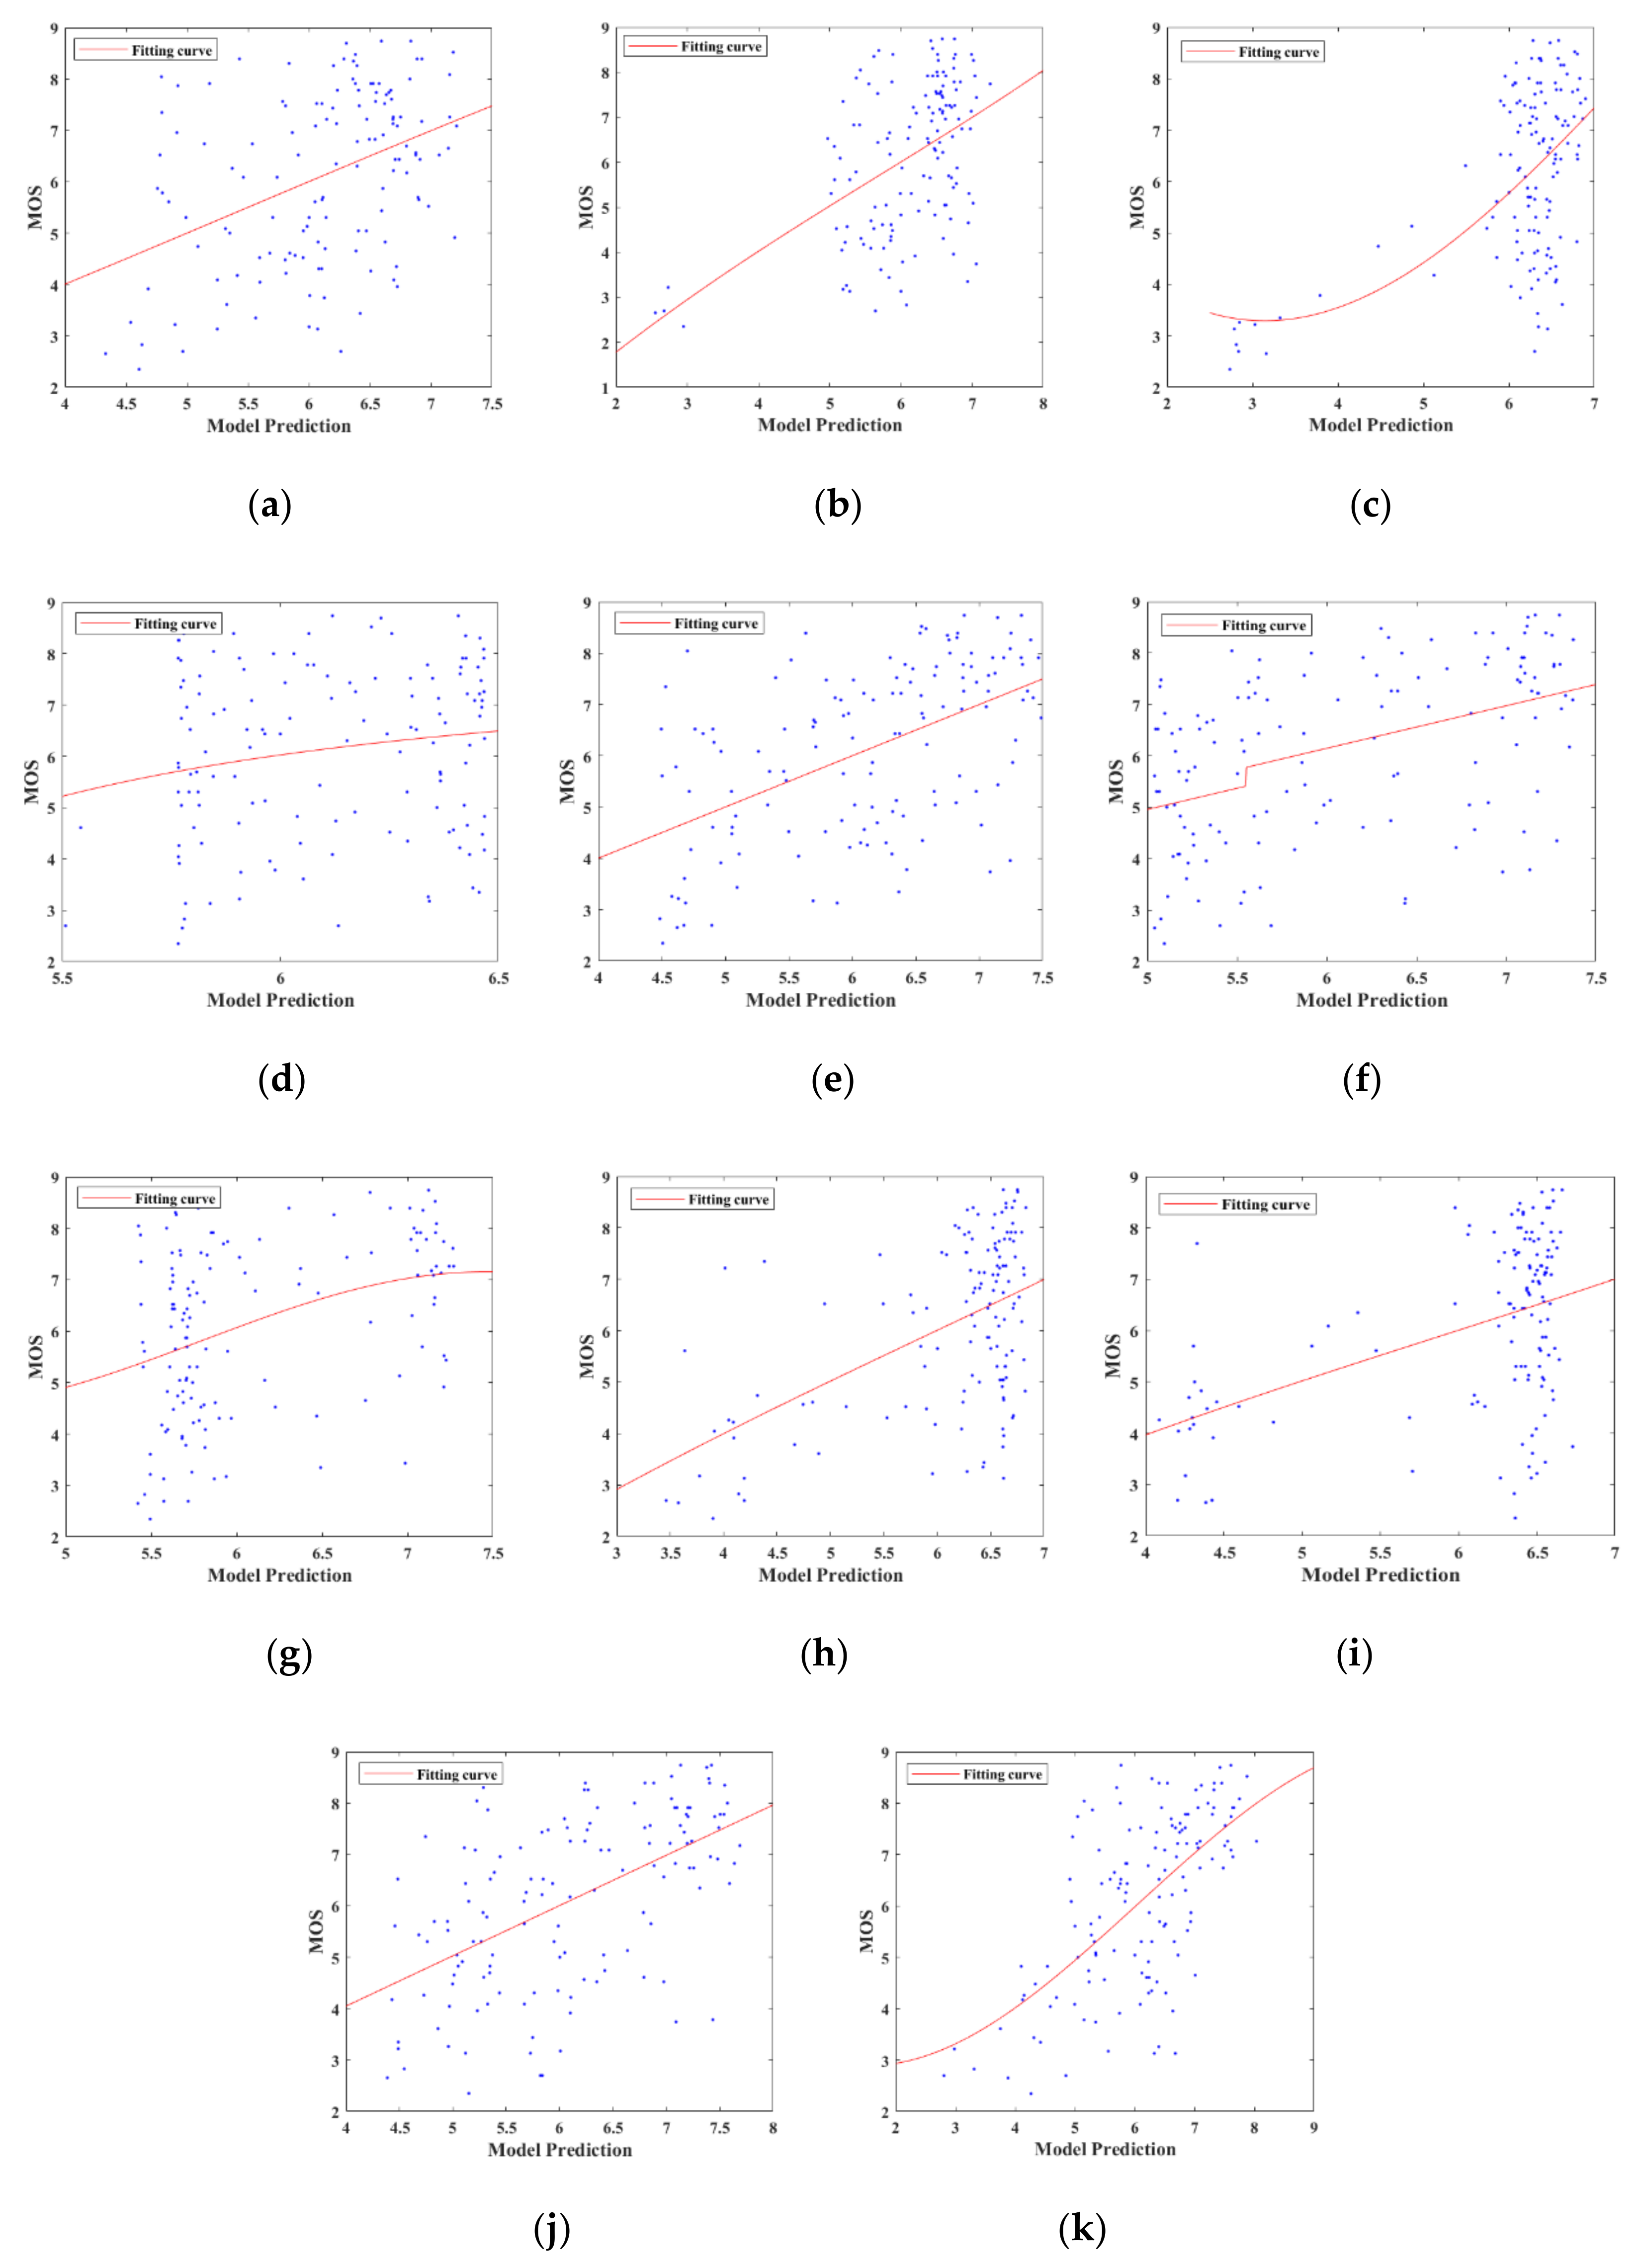
Moreover, the scatter plots between the objective scores and MOS are given on the whole database, as shown in Figure 8. Meanwhile, the logistic function is used to fit these scatter points, and the more points that fall on the fitting curve, the better the performance of BIQA methods. From Figure 8, it can be clearly found that the predicted scores of the proposed CE-BMIQA method have a higher correlation with MOS values compared with the other ten BIQA methods, which further illustrates the superiority of the proposed CE-BMIQA method in predicting the quality of MEF images.
3.3. Impacts of Individual Feature Set
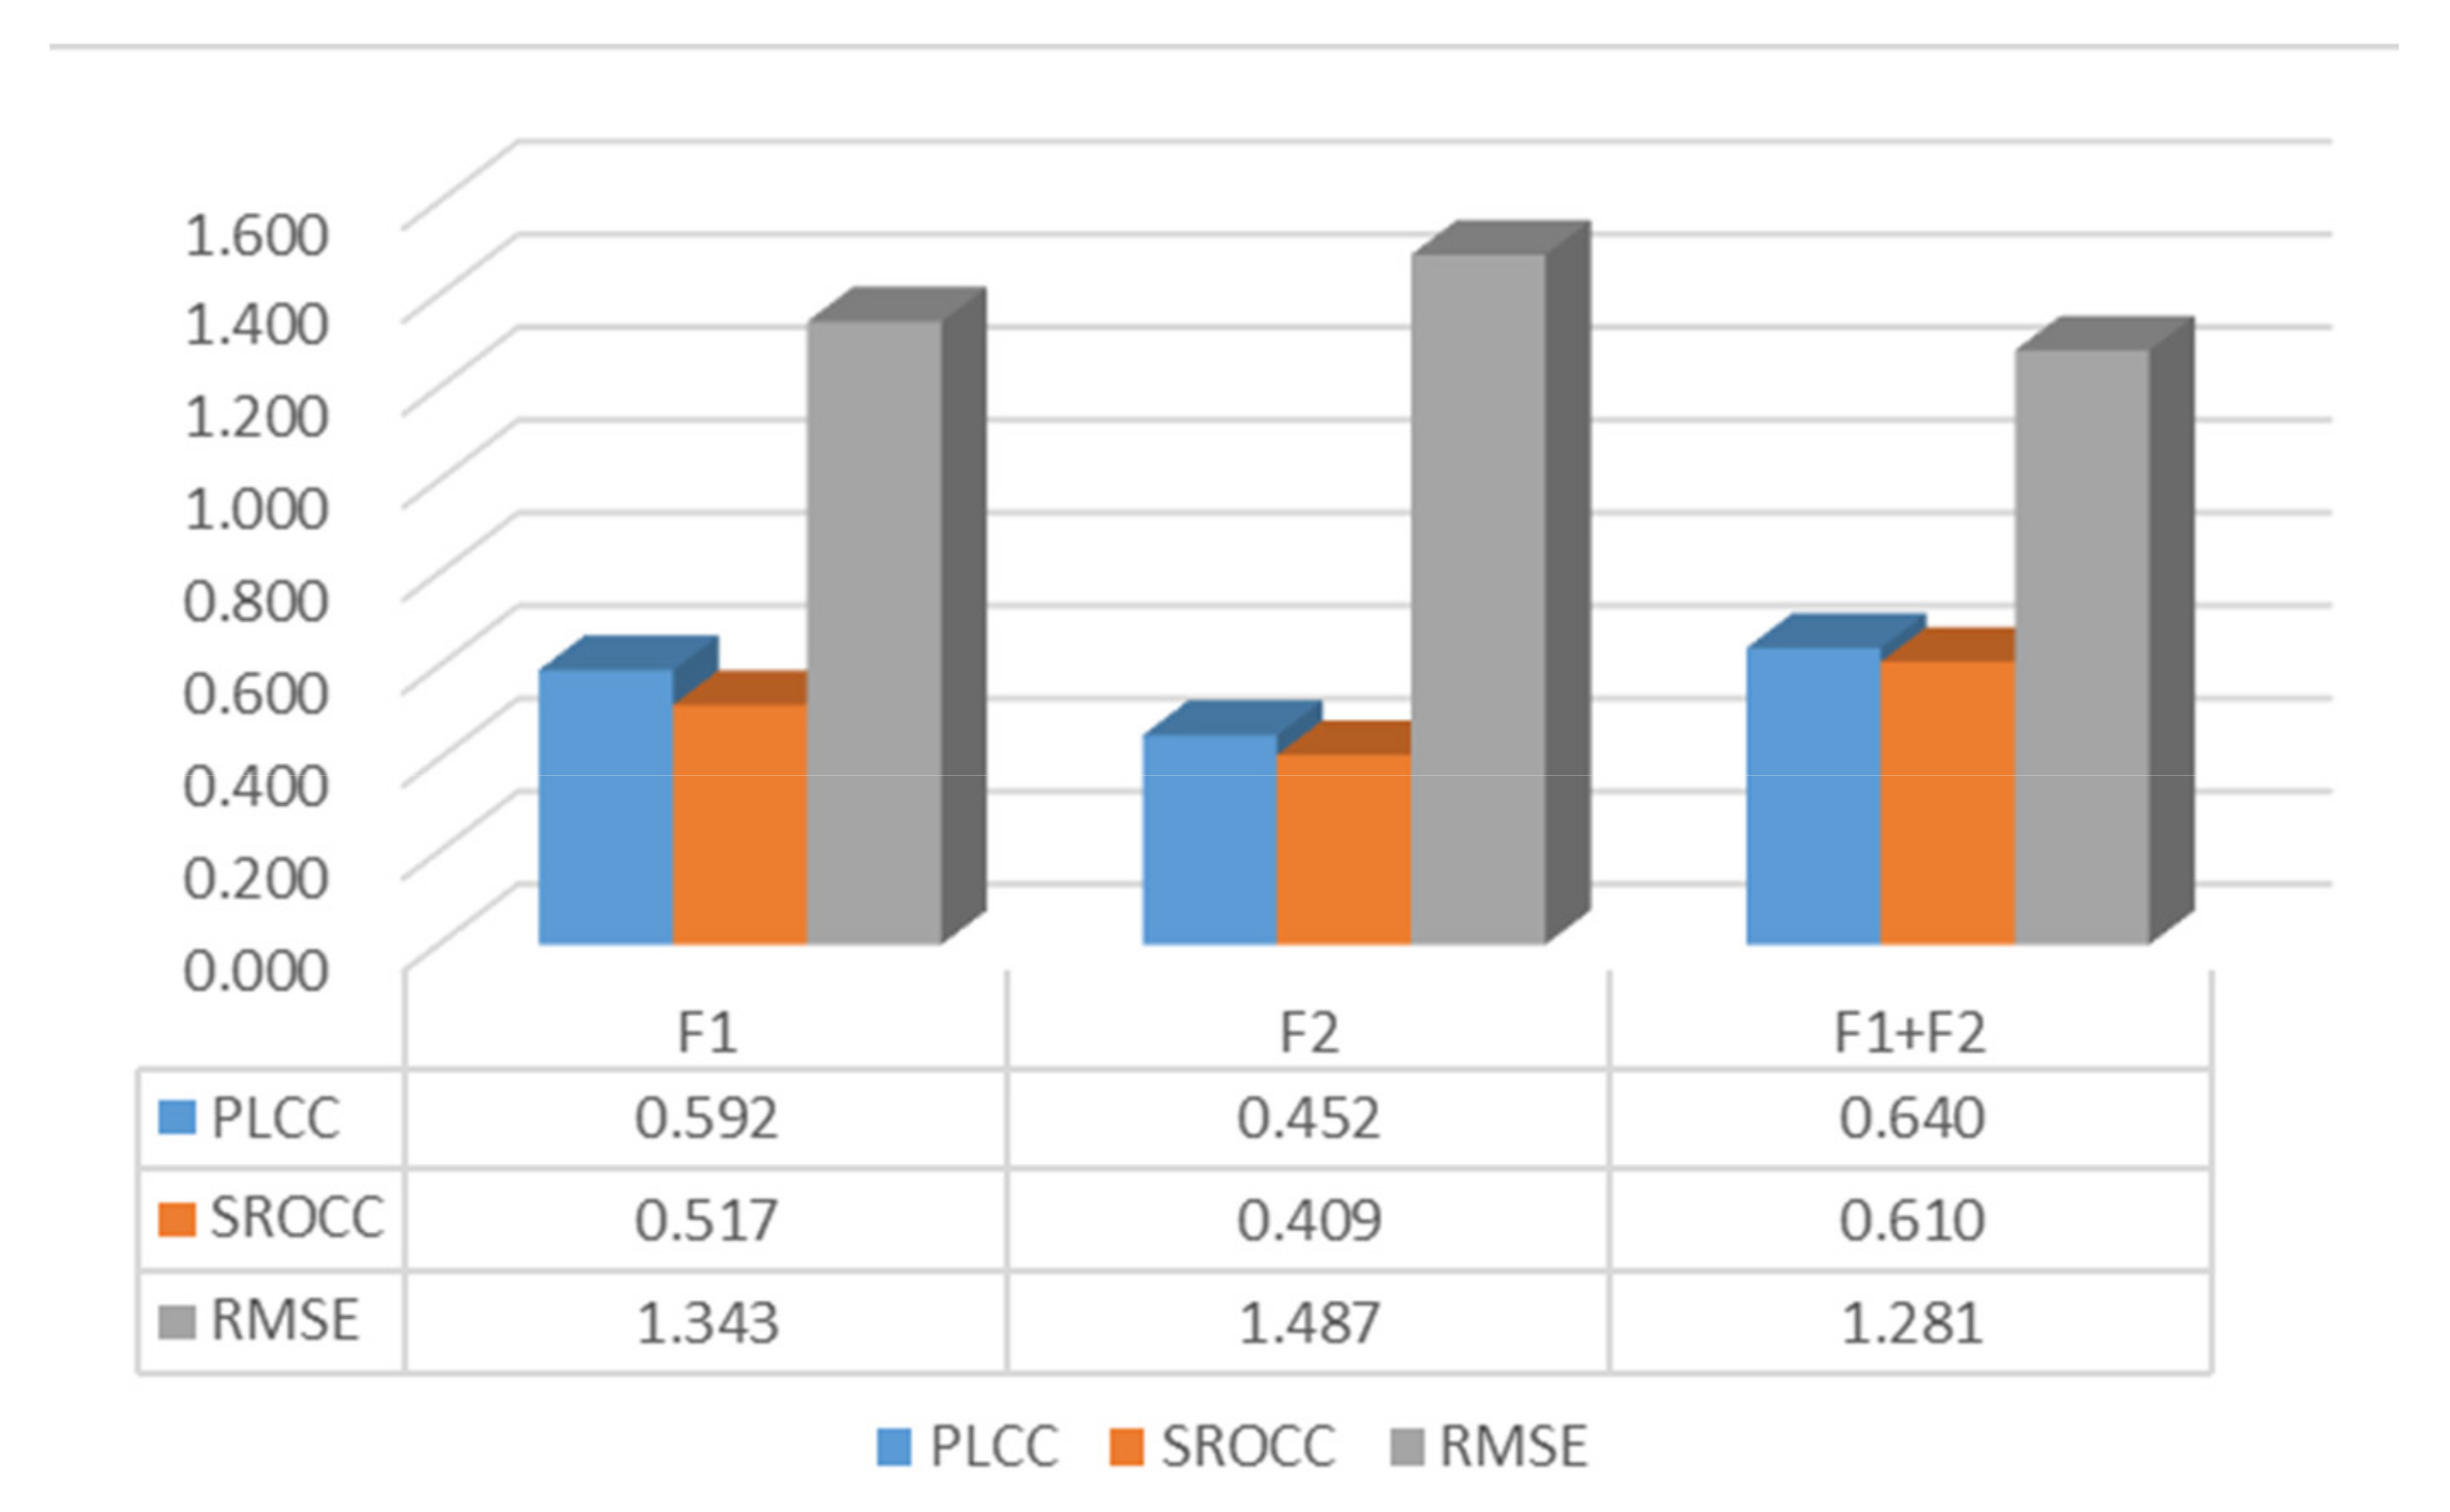
Actually, the proposed CE-BMIQA method has been validated to achieve relatively stable performance since it considers the inherent distortion of MEF images, i.e., structure and information loss caused by underexposure and overexposure. However, the impacts of individual feature set on the final performance are still unclear, thus corresponding evaluation results from two perceptual feature sets (i.e., curvature and entropy statistics) are investigated on the MEF image database [27]. Here, the individual feature sets (i.e., F1 and F2) are used to learn the relevant quality prediction models to validate their significances via three criteria, and the results are reported in Figure 9, where F1 and F2 are the feature sets of curvature statistics and entropy statistics, respectively. From Figure 9, it can be found that F1 makes a great contribution to the final performance, while F2 also plays a significant role in the overall performance improvement. As a result, it seems that F1 is more important than F2, and it can be attributed to that HVS is sensitive to structure degradation with contrast variation. Except for the above observation, it can turn to the best performance result obviously by aggregating the two feature sets, so curvature and entropy statistics features are complementary with each other for distortion estimation.
3.4. Impacts of Scale Number and Computational Complexity
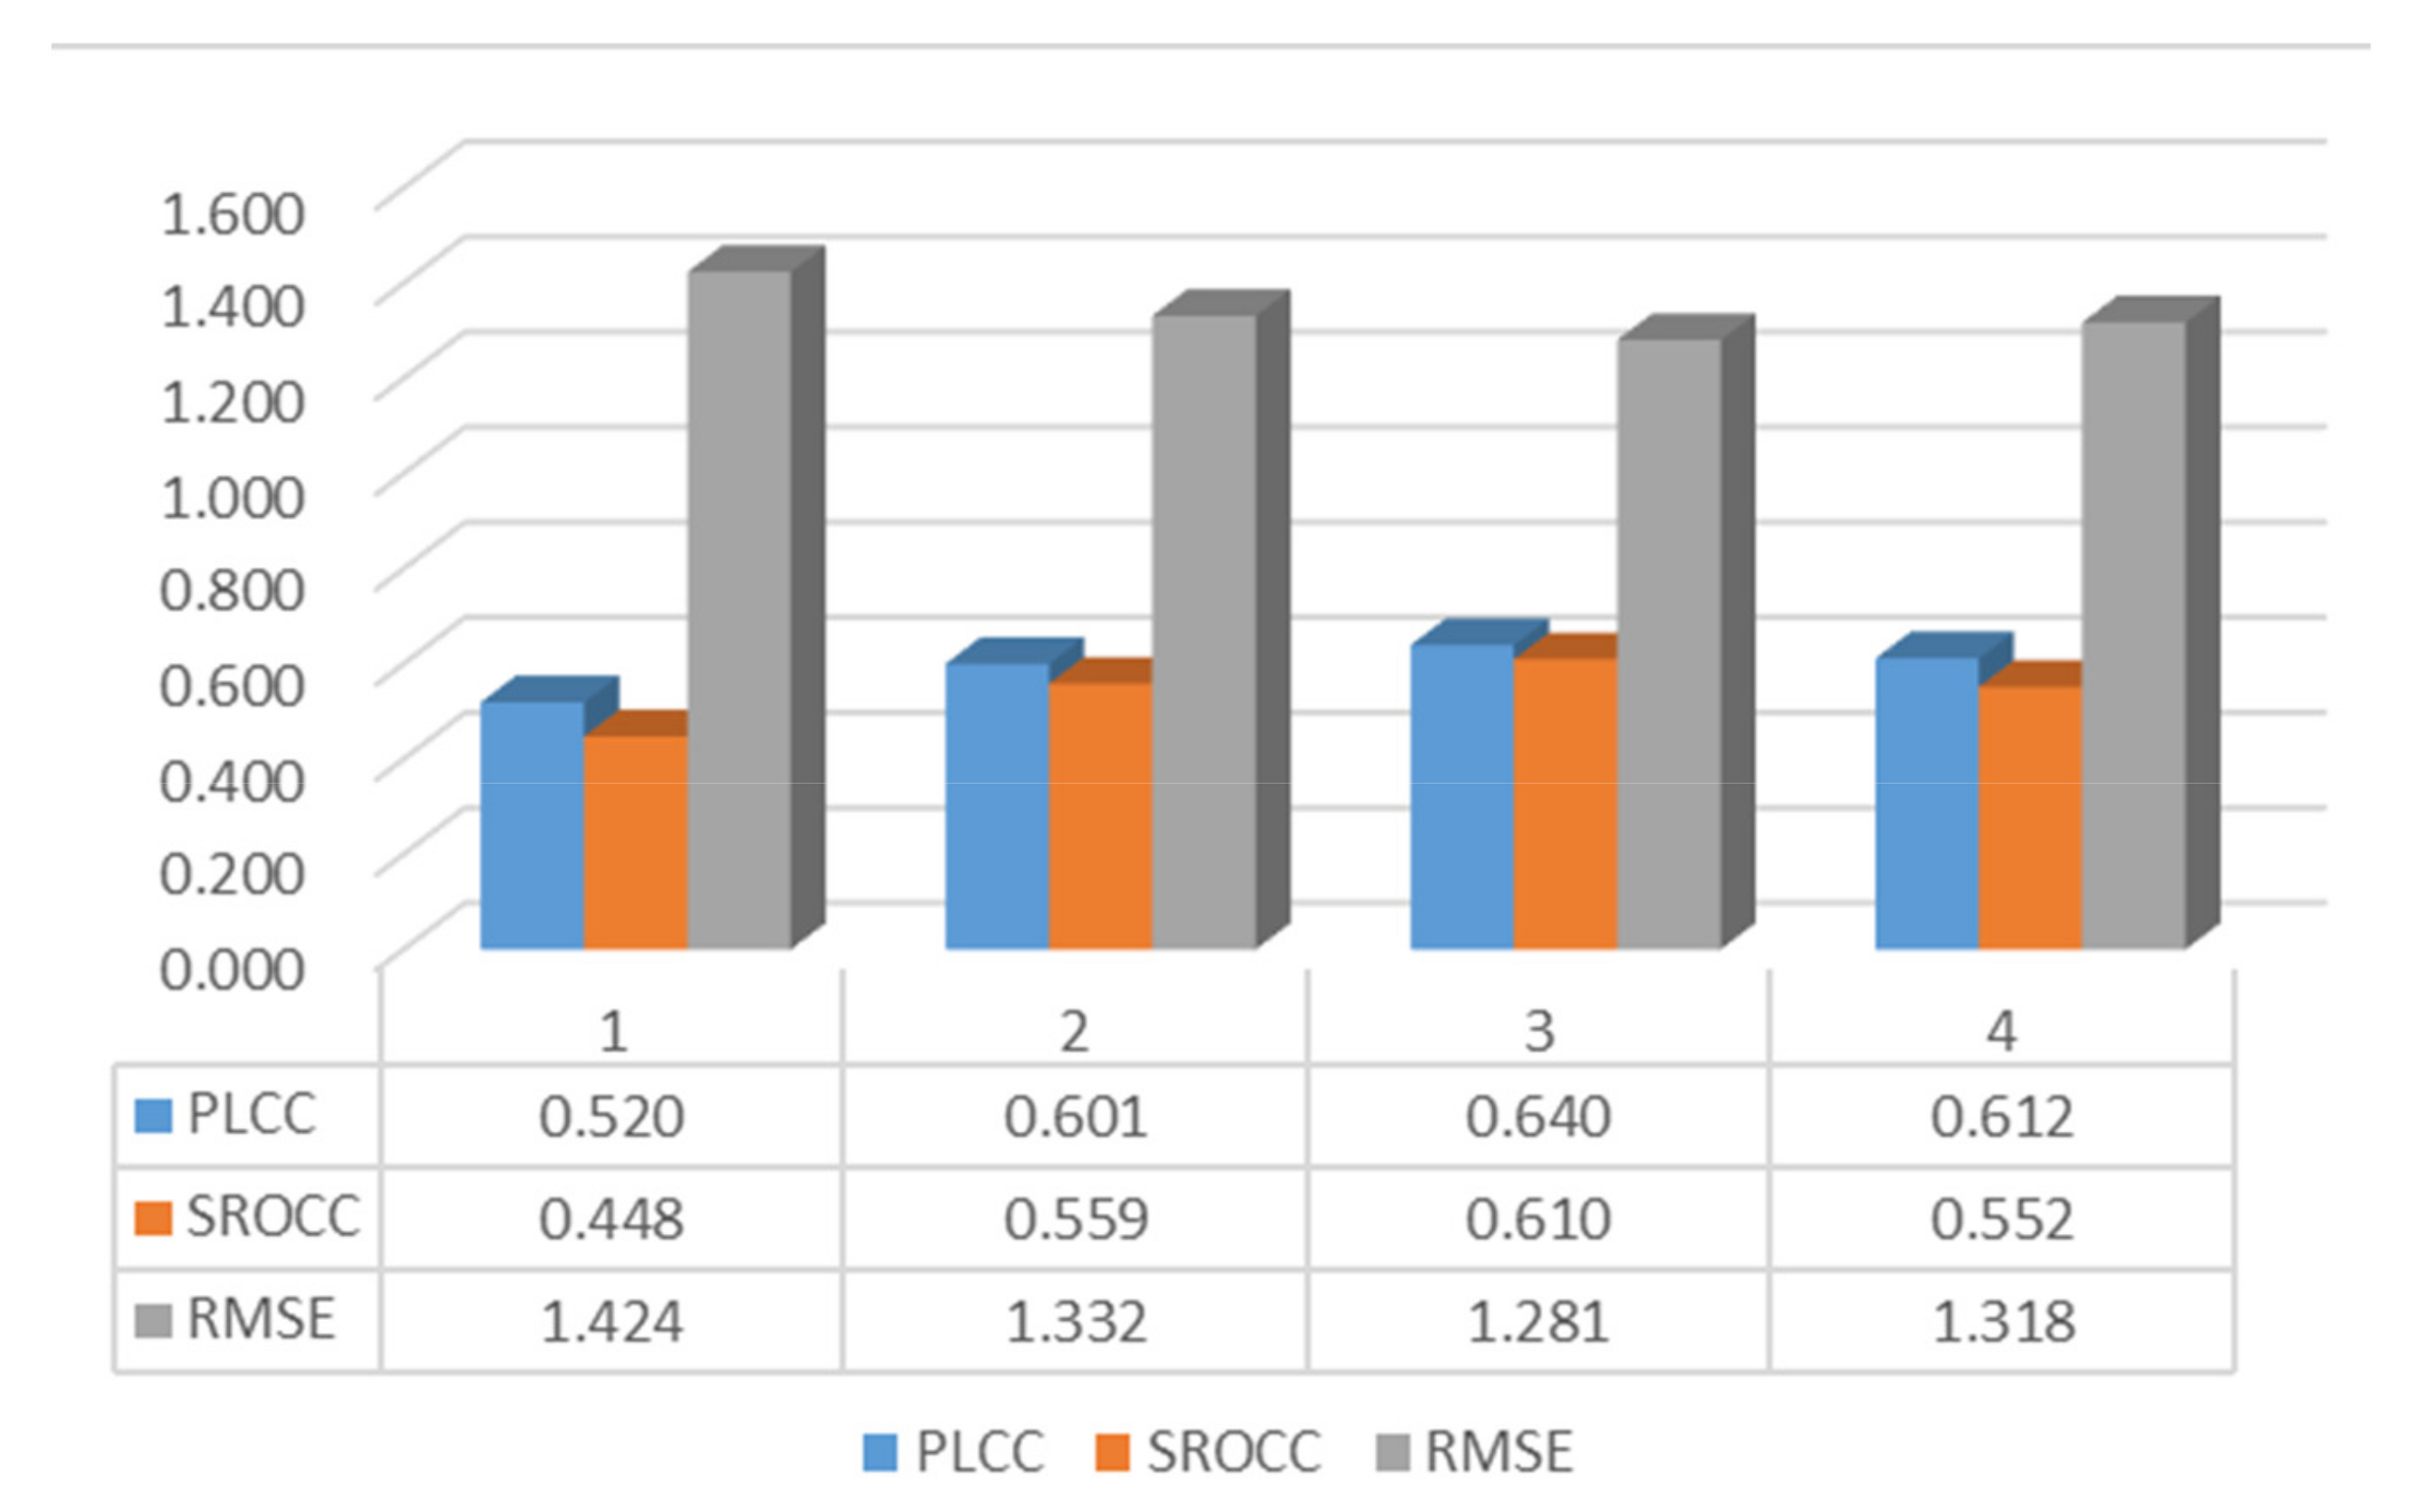
The feature extraction process in the proposed CE-BMIQA method is performed on the multi-scale space, and the scale number l may affect the performance of quality prediction. Therefore, a comparative experiment is designed to select the optimal parameter. Specifically, we assign l = {1, 2, 3, 4} and calculate three evaluation criteria (i.e., PLCC, SROCC, and RMSE) on the MEF database [27] for each possible case, respectively, and the results are showed in Figure 10. Obviously, it reaches the optimal performance when l is 3, so the scale number is set as 3 to ensure the accuracy and robustness of the proposed CE-BMIQA method.
To compare the computational complexity of the proposed CE-BMIQA method with other BIQA methods, their mean running times for 136 MEF images are reported with different resolutions on a computer with 1.80GHz Intel Core i7-8565U CPU, 8GB RAM, and NVIDIA MX 150. All BIQA methods are implemented on MATLAB 2017b (produced by the company of MathWorks, Portola Valley, CA, USA) by using the original codes provided by authors. The running time of each BIQA method is listed in Table 6. From Table 6, it can be observed that although the proposed CE-BMIQA method is in the moderate rank in terms of running time, it is acceptable and adequate for practical applications that need higher precision but are not sensitive to running time.
4. Further Discussion
In this study, a BIQA method for the MEF image has been developed, which is based on curvature and entropy statistics features. Although the proposed CE-BMIQA method has shown better performance than some comparison methods, there still exist some issues to be considered in future work:
- (1)
- The detail loss usually occurs in the overexposure and underexposure regions of MEF images. In general, the degree of detail preservation also varies with different environmental compositions under different exposure conditions. Therefore, accurate segmentation methods for different exposure regions and semantic segmentation methods can be applied to design BIQA methods for MEF images in the future.
- (2)
- Generally, the natural scene is almost colorful and moving in practice. When the quality of the MEF image is not good, the color will inevitably be affected, so color is also one of the factors that need to be considered. In future work, color analysis will be concentrated to develop more valuable BIQA methods for MEF images.
5. Conclusions
In this paper, a curvature and entropy statistics-based blind multi-exposure fusion (MEF) image quality assessment (CE-BMIQA) method is proposed for distinguishing the differences among image fusion algorithms. First, histograms of surface type maps based on mean and Gaussian curvature are calculated to form the curvature statistics feature, so as to identify the structure degradation of MEF images. Moreover, a novel contrast energy weighting approach is presented for capturing the structure loss with contrast variation. Then, the mean and skew of spatial and spectral entropy values for MEF image blocks are implemented as another type of quality-aware features. Finally, a multi-scale scheme is adopted to perceive the distortion of MEF image from the fine level to the coarse level. Experimental results on the benchmark MEF image database demonstrate that the proposed CE-BMIQA method achieves outstanding performance than other comparison methods as a whole.
In addition, the CE-BMIQA method still has different evaluation performances for the visual quality of each individual scene. The main reason is that the content of each scene is different, and some scenes may have fewer over-exposure regions and under-exposure regions. As a result, the distortion perception based on contrast and detail information in the CE-BMIQA method cannot accurately predict their quality. In this case, perhaps more attention should be paid to the color and aesthetic distortion. In future work, we will more comprehensively consider the distortion types of MEF images and integrate more considerations.
Author Contributions
Conceptualization, Z.H.; data curation, L.L.; funding acquisition, Y.S.; methodology, Z.H.; software, Z.H.; supervision, L.L.; validation, Y.S. and C.Z.; writing—original draft, Z.H.; writing—review and editing, C.Z. All authors have read and agreed to the published version of the manuscript.
Funding
This research was funded by Natural science foundation of Zhejiang province, grant number LQ20F010002 and Natural science foundation of Ningbo, grant number 2019A610101.
Data Availability Statement
Not Applicable.
Conflicts of Interest
The authors declare no conflict of interest.
References
- Kinoshita, Y.; Kiya, H. Scene segmentation-based luminance adjustment for multi-exposure image fusion. IEEE Trans. Image Process. 2019, 28, 4101–4116. [Google Scholar] [CrossRef] [Green Version]
- Qi, Y.; Zhou, S.; Zhang, Z.; Luo, S.; Lin, X.; Wang, L.; Qiang, B. Deep unsupervised learning based on color un-referenced loss functions for multi-exposure image fusion. Inf. Fusion 2021, 66, 18–39. [Google Scholar] [CrossRef]
- Ma, K.; Zeng, K.; Wang, Z. Perceptual quality assessment for multi-exposure image fusion. IEEE Trans. Image Process. 2015, 24, 3345–3356. [Google Scholar] [CrossRef]
- Wang, Z.; Bovik, A.C. Reduced and no reference visual quality assessment. IEEE Signal Process. Mag. 2011, 29, 29–40. [Google Scholar] [CrossRef]
- Mittal, A.; Moorthy, A.K.; Bovik, A.C. No-reference image quality assessment in the spatial domain. IEEE Trans. Image Process. 2012, 21, 4695–4708. [Google Scholar] [CrossRef]
- Moorthy, A.K.; Bovik, A.C. Blind image quality assessment: From natural scene statistics to perceptual quality. IEEE Trans. Image Process. 2011, 20, 3350–3364. [Google Scholar] [CrossRef]
- Saad, M.A.; Bovik, A.C.; Charrier, C. Blind image quality assessment: A natural scene statistics approach in the DCT domain. IEEE Trans. Image Process. 2012, 21, 3339–3352. [Google Scholar] [CrossRef]
- Li, Q.; Lin, W.; Fang, Y. No-reference quality assessment for multiply-distorted images in gradient domain. IEEE Signal Process. Lett. 2016, 23, 541–545. [Google Scholar] [CrossRef]
- Liu, L.; Hua, Y.; Zhao, Q.; Huang, H.; Bovik, A.C. Blind image quality assessment by relative gradient statistics and adaboosting neural network. Signal Process. Image Commun. 2016, 40, 1–15. [Google Scholar] [CrossRef]
- Oszust, M. Local feature descriptor and derivative filters for blind image quality assessment. IEEE Signal Process. Lett. 2019, 26, 322–326. [Google Scholar] [CrossRef]
- Liu, L.; Dong, H.; Huang, H.; Bovik, A.C. No-reference image quality assessment in curvelet domain. Signal Process. Image Commun. 2014, 29, 494–505. [Google Scholar] [CrossRef]
- Gu, K.; Lin, W.; Zhai, G.; Yang, X.; Zhang, W.; Chen, C.W. No-reference quality metric of contrast-distorted images based on information maximization. IEEE Trans. Cybern. 2017, 47, 4559–4565. [Google Scholar] [CrossRef]
- Rana, A.; Singh, P.; Valenzise, G.; Dufaux, F.; Komodakis, N.; Smolic, A. Deep tone mapping operator for high dynamic 397 range images. IEEE Trans. Image Process. 2019, 29, 1285–1298. [Google Scholar] [CrossRef] [Green Version]
- Gu, K.; Wang, S.; Zhai, G.; Ma, S.; Yang, X.; Lin, W.; Zhang, W.; Gao, W. Blind quality assessment of tone-mapped images via analysis of information, naturalness, and structure. IEEE Trans. Multimed. 2016, 18, 432–443. [Google Scholar] [CrossRef]
- Kundu, D.; Ghadiyaram, D.; Bovik, A.C.; Evans, B.L. No-reference quality assessment of tone-mapped HDR pictures. IEEE Trans. Image Process. 2017, 26, 2957–2971. [Google Scholar] [CrossRef]
- Xing, L.; Cai, L.; Zeng, H.G.; Chen, J.; Zhu, J.Q.; Hou, J.H. A multi-scale contrast-based image quality assessment model for multi-exposure image fusion. Signal Process. 2018, 145, 233–240. [Google Scholar] [CrossRef]
- Deng, C.W.; Li, Z.; Wang, S.G.; Liu, X.; Dai, J.H. Saturation-based quality assessment for colorful multi-exposure image fusion. Int. J. Adv. Robot. Syst. 2017, 14, 1–15. [Google Scholar] [CrossRef]
- Rahman, H.; Soundararajan, R.; Babu, R.V. Evaluating multiexposure fusion using image information. IEEE Signal Process. Lett. 2017, 24, 1671–1675. [Google Scholar] [CrossRef]
- Martinez, J.; Pistonesi, S.; Maciel, M.C.; Flesia, A.G. Multiscale fidelity measure for image fusion quality assessment. Inf. Fusion 2019, 50, 197–211. [Google Scholar] [CrossRef]
- Wang, Z.; Bovik, A.C.; Sheikh, H.R.; Simoncelli, E.P. Image quality assessment: From error visibility to structural similarity. IEEE Trans. Image Process. 2004, 13, 600–612. [Google Scholar] [CrossRef] [PubMed] [Green Version]
- Li, Z.; Zheng, J.; Rahardja, S. Detail-enhanced exposure fusion. IEEE Trans. Image Process. 2012, 21, 4672–4676. [Google Scholar] [PubMed]
- Raman, S.; Chaudhuri, S. Bilateral filter based compositing for variable exposure photography. In Proceedings of the Eurographics (Short Papers), Munich, Germany, 30 March–3 April 2009; pp. 1–3. [Google Scholar]
- Gu, B.; Li, W.; Wong, J.; Zhu, M.; Wang, M. Gradient field multi-exposure images fusion for high dynamic range image visualization. J. Vis. Commun. Image Represent. 2012, 23, 604–610. [Google Scholar] [CrossRef]
- Besl, P.J.; Jain, R.C. Segmentation through variable-order surface fitting. IEEE Trans. Pattern Anal. Mach. Intell. 1988, 10, 167–192. [Google Scholar] [CrossRef] [Green Version]
- Do Carmo, M.P. Differential Geometry of Curves and Surfaces; Prentice-Hall: Englewood Cliffs, NJ, USA, 1976. [Google Scholar]
- Choi, L.K.; You, J.; Bovik, A.C. Referenceless prediction of perceptual fog density and perceptual image defogging. IEEE Trans. Image Process. 2015, 24, 3888–3901. [Google Scholar] [CrossRef]
- Multi-exposure Fusion Image Database. Available online: http://ivc.uwaterloo.ca/database/MEF/MEFDatabase.php (accessed on 11 July 2015).
- Li, S.; Kang, X. Fast multi-exposure image fusion with median filter and recursive filter. IEEE Trans. Consum. Electron. 2012, 58, 626–632. [Google Scholar] [CrossRef] [Green Version]
- Li, S.; Kang, X.; Hu, J. Image fusion with guided filtering. IEEE Trans. Image Process. 2013, 22, 2864–2875. [Google Scholar] [PubMed]
- Mertens, T.; Kautz, J.; Van Reeth, F. Exposure fusion: A simple and practical alternative to high dynamic range photography. Comput. Graph. Forum 2009, 28, 161–171. [Google Scholar] [CrossRef]
- Antkowiak, J.; Baina, T.J. Final Report from the Video Quality Experts Group on the Validation of Objective Models of Video Quality Assessment; ITU-T Standards Contributions COM: Geneva, Switzerland, 2000. [Google Scholar]
- Groen, I.I.A.; Ghebreab, S.; Prins, H.; Lamme, V.A.F.; Scholte, H.S. From image statistics to scene gist: Evoked neural activity reveals transition from low-level natural image structure to scene category. J. Neurosci. 2013, 33, 18814–18824. [Google Scholar] [CrossRef] [PubMed] [Green Version]
Figure 1.
An example of three MEF images generated by different algorithms. (a) Image generated by Li’s algorithm [21] (MOS = 8.74); (b) image generated by Raman’s algorithm [22] (MOS = 3.17); (c) image generated by local energy weighting [23] (MOS = 2.70).

Figure 2.
The schematic flowchart of MEF BIQA method.

Figure 3.
Feature extraction of the proposed CE-BMIQA method.

Figure 4.
The corresponding mean and Gaussian curvature maps of MEF images in Figure 1. (a–c) The mean curvature maps; (d–f) the Gaussian curvature maps.
Figure 4.
The corresponding mean and Gaussian curvature maps of MEF images in Figure 1. (a–c) The mean curvature maps; (d–f) the Gaussian curvature maps.

Figure 5.
The corresponding STs maps and their histogram statistics in Figure 1. (a–c) The STs maps; (d–f) histogram statistics of STs maps.
Figure 5.
The corresponding STs maps and their histogram statistics in Figure 1. (a–c) The STs maps; (d–f) histogram statistics of STs maps.

Figure 6.
The corresponding histograms of spatial and spectral entropy of different MEF images in Figure 1. (a) Histograms of spatial entropy; (b) histograms of spectral entropy.
Figure 6.
The corresponding histograms of spatial and spectral entropy of different MEF images in Figure 1. (a) Histograms of spatial entropy; (b) histograms of spectral entropy.

Figure 7.
Source image sequences contained in the benchmark MEF database [3,27]. Each image sequence is represented by the fused image with the best quality in the subjective test.

Figure 8.
Scatter plots for the objective predicted scores and MOS values of eleven BIQA methods. (a) BRISQUE [5]; (b) DIIVINE [6]; (c) BLINDS-II [7]; (d) GWH-GLBP [8]; (e) OG-IQA [9]; (f) SCORER [10]; (g) CurveletQA [11]; (h) NIQMC [12]; (i) BTMQI [14]; (j) HIGRADE [15]; (k) CE-BMIQA.

Figure 9.
The performance results of individual feature sets.

Figure 10.
The performance results for different scale numbers.


Table 1.
The conceptual flowchart of the MEF BIQA method.
| No. | Step |
|---|---|
| 1 | Input MEF images |
| 2 | Extract distortion features |
| 3 | Training stage: train a quality prediction model via random forest (which means learning a mapping relationship between feature space and subjective score). Subjective score means mean opinion score (MOS) which is provided in the subjective database. |
| 4 | Testing stage: calculate the objective quality score of a MEF image via the trained quality prediction model |
Table 2.
ST labels obtained by the surface curvature assignation.
| Gc > 0 | Gc = 0 | Gc < 0 | |
|---|---|---|---|
| Mc < 0 | Peak (ST = 1) | Ridge (ST = 2) | Saddle Ridge (ST = 3) |
| Mc = 0 | None (ST = 4) | Flat (ST = 5) | Minimal (ST = 6) |
| Mc > 0 | Pit (ST = 7) | Valley (ST = 8) | Saddle Valley (ST = 9) |
| No. | Source Sequences | Size | Image Source |
|---|---|---|---|
| 1 | Balloons | 339 × 512 × 9 | Erik Reinhard |
| 2 | Belgium house | 512 × 384 × 9 | Dani Lischinski |
| 3 | Lamp1 | 512 × 384 × 15 | Martin Cadik |
| 4 | Candle | 512 × 364 × 10 | HDR Projects |
| 5 | Cave | 512 × 384 × 4 | Bartlomiej Okonek |
| 6 | Chinese garden | 512 × 340 × 3 | Bartlomiej Okonek |
| 7 | Farmhouse | 512 × 341 × 3 | HDR Projects |
| 8 | House | 512 × 340 × 4 | Tom Mertens |
| 9 | Kluki | 512 × 341 × 3 | Bartlomiej Okonek |
| 10 | Lamp2 | 512 × 342 × 6 | HDR Projects |
| 11 | Landscape | 512 × 341 × 3 | HDRsoft |
| 12 | Lighthouse | 512 × 340 × 3 | HDRsoft |
| 13 | Madison capitol | 512 × 384 × 30 | Chaman Singh Verma |
| 14 | Memorial | 341 × 512 × 16 | Paul Debevec |
| 15 | Office | 512 × 340 × 6 | Matlab |
| 16 | Tower | 341 × 512 × 3 | Jacques Joffre |
| 17 | Venice | 512 × 341 × 3 | HDRsoft |
Table 4.
The PLCC results of eleven BIQA methods on each MEF image sequence and the entire database.
Table 4.
The PLCC results of eleven BIQA methods on each MEF image sequence and the entire database.
| No. | Methods | ||||||||||
|---|---|---|---|---|---|---|---|---|---|---|---|
| [5] | [6] | [7] | [8] | [9] | [10] | [11] | [12] | [14] | [15] | Proposed | |
| 1 | 0.916 | 0.829 | 0.774 | 0.886 | 0.945 | 0.921 | 0.672 | 0.823 | 0.883 | 0.934 | 0.578 |
| 2 | 0.877 | 0.840 | 0.703 | 0.718 | 0.799 | 0.891 | 0.851 | 0.110 | 0.677 | 0.983 | 0.851 |
| 3 | 0.886 | 0.751 | 0.848 | 0.844 | 0.791 | 0.763 | 0.817 | 0.941 | 0.341 | 0.895 | 0.923 |
| 4 | 0.825 | 0.884 | 0.876 | 0.275 | 0.548 | 0.779 | 0.043 | 0.760 | 0.974 | 0.412 | 0.880 |
| 5 | 0.130 | 0.496 | 0.658 | 0.796 | 0.619 | 0.788 | 0.191 | 0.233 | 0.522 | 0.466 | 0.538 |
| 6 | 0.008 | 0.137 | 0.344 | 0.231 | 0.898 | 0.349 | 0.644 | 0.593 | 0.086 | 0.835 | 0.995 |
| 7 | 0.729 | 0.548 | 0.460 | 0.223 | 0.923 | 0.832 | 0.856 | 0.767 | 0.841 | 0.710 | 0.848 |
| 8 | 0.662 | 0.760 | 0.556 | 0.725 | 0.591 | 0.891 | 0.983 | 0.841 | 0.890 | 0.968 | 0.967 |
| 9 | 0.792 | 0.763 | 0.850 | 0.628 | 0.803 | 0.793 | 0.406 | −0.321 | −0.120 | 0.861 | 0.882 |
| 10 | 0.718 | 0.831 | 0.902 | 0.405 | 0.781 | 0.651 | 0.897 | 0.643 | 0.543 | 0.962 | 0.045 |
| 11 | 0.816 | 0.770 | 0.862 | 0.276 | 0.778 | 0.581 | 0.588 | 0.457 | 0.667 | 0.942 | 0.948 |
| 12 | 0.937 | 0.904 | 0.871 | 0.781 | 0.938 | 0.685 | 0.994 | 0.894 | 0.647 | 0.805 | 0.995 |
| 13 | 0.642 | 0.727 | 0.516 | 0.676 | 0.758 | 0.701 | 0.939 | 0.597 | 0.750 | 0.746 | 0.941 |
| 14 | 0.667 | 0.682 | 0.955 | 0.828 | 0.461 | 0.816 | −0.935 | 0.826 | 0.475 | 0.783 | 0.978 |
| 15 | 0.856 | 0.821 | 0.856 | 0.703 | 0.834 | 0.712 | 0.868 | 0.884 | 0.025 | 0.901 | 0.923 |
| 16 | 0.761 | 0.901 | 0.526 | 0.636 | 0.935 | 0.595 | 0.699 | 0.532 | 0.666 | 0.501 | 0.705 |
| 17 | 0.990 | 0.423 | 0.852 | 0.914 | 0.840 | 0.709 | 0.866 | 0.549 | 0.240 | 0.736 | 0.837 |
| All | 0.414 | 0.491 | 0.534 | 0.163 | 0.523 | 0.481 | 0.371 | 0.519 | 0.452 | 0.561 | 0.640 |
| Hit Count | 1 | 1 | 0 | 1 | 2 | 0 | 1 | 1 | 1 | 2 | 8 |
Table 5.
The SROCC results of eleven BIQA methods on each MEF image sequence and the entire database.
Table 5.
The SROCC results of eleven BIQA methods on each MEF image sequence and the entire database.
| No. | Methods | ||||||||||
|---|---|---|---|---|---|---|---|---|---|---|---|
| [5] | [6] | [7] | [8] | [9] | [10] | [11] | [12] | [14] | [15] | Proposed | |
| 1 | 0.833 | 0.714 | 0.738 | 0.667 | 0.881 | 0.857 | 0.310 | 0.524 | 0.786 | 0.762 | 0.405 |
| 2 | 0.731 | 0.635 | 0.515 | 0.527 | 0.826 | 0.731 | 0.802 | 0.240 | 0.407 | 0.898 | 0.659 |
| 3 | 0.476 | 0.643 | 0.548 | 0.381 | 0.905 | 0.714 | 0.571 | 0.738 | 0.476 | 0.714 | 0.910 |
| 4 | 0 | 0.810 | 0.310 | −0.381 | 0.143 | 0.762 | −0.286 | 0.429 | 0.191 | 0.095 | 0.119 |
| 5 | 0.238 | 0.143 | 0.333 | 0.714 | 0.167 | 0.333 | 0.119 | 0.381 | 0.643 | 0 | 0.578 |
| 6 | 0.191 | 0.214 | 0.310 | 0.286 | 0.595 | 0.191 | 0.333 | 0.381 | 0.143 | 0.857 | 0.976 |
| 7 | 0.595 | 0.548 | 0.191 | −0.095 | 0.786 | 0.595 | 0.810 | 0.286 | 0.524 | 0.714 | 0.667 |
| 8 | 0.500 | 0.524 | 0.476 | 0.643 | 0.524 | 0.762 | 0.905 | 0.786 | 0.738 | 0.786 | 0.905 |
| 9 | 0.405 | 0.738 | 0.786 | 0.310 | 0.714 | 0.810 | 0.357 | 0.333 | 0 | 0.738 | 0.833 |
| 10 | 0.714 | 0.643 | 0.786 | −0.262 | −0.143 | 0.548 | 0.786 | 0.429 | 0.429 | 0.786 | 0.095 |
| 11 | 0.191 | 0.667 | 0.881 | 0.167 | 0.643 | 0.738 | 0.119 | −0.357 | −0.595 | 0.810 | 0.883 |
| 12 | 0.810 | 0.912 | 0.191 | 0.381 | 0.810 | 0.810 | 0.905 | 0.095 | −0.571 | 0.786 | 0.929 |
| 13 | 0.595 | 0.691 | 0.357 | 0.143 | 0.643 | 0.619 | 0.905 | 0.190 | 0.595 | 0.762 | 0.786 |
| 14 | 0.095 | 0.476 | 0.714 | −0.071 | 0.167 | 0.762 | 0.905 | 0.595 | 0.405 | 0.786 | 0.833 |
| 15 | 0.711 | 0.615 | 0.783 | 0.530 | 0.651 | 0.783 | 0.566 | 0.783 | −0.205 | 0.843 | 0.964 |
| 16 | 0.286 | 0.833 | 0.405 | −0.524 | 0.929 | 0.738 | 0.071 | 0.192 | 0.619 | 0.691 | 0.738 |
| 17 | 0.252 | −0.192 | 0.719 | 0.683 | 0.276 | 0.671 | 0.742 | 0.275 | 0.108 | 0.743 | 0.635 |
| All | 0.380 | 0.403 | 0.346 | 0.113 | 0.525 | 0.494 | 0.337 | 0.404 | 0.343 | 0.566 | 0.610 |
| Hit Count | 0 | 1 | 1 | 1 | 2 | 0 | 5 | 0 | 0 | 3 | 8 |
Table 6.
Comparison of running time of the proposed CE-BMIQA method versus other ones.
| Metrics | BRISQUE | DIIVINE | BLINDS-II | GWH-GLBP | OG-IQA | SCORER |
| Time (sec.) | 0.041 | 6.602 | 14.736 | 0.058 | 0.031 | 0.588 |
| Metrics | CurveletQA | NIQMC | BTMQI | HIGRADE | Proposed | |
| Time (sec.) | 2.5141 | 1.9241 | 0.076 | 0.260 | 0.480 |
Publisher’s Note: MDPI stays neutral with regard to jurisdictional claims in published maps and institutional affiliations. |
© 2021 by the authors. Licensee MDPI, Basel, Switzerland. This article is an open access article distributed under the terms and conditions of the Creative Commons Attribution (CC BY) license (https://creativecommons.org/licenses/by/4.0/).
Share and Cite
MDPI and ACS Style
He, Z.; Song, Y.; Zhong, C.; Li, L. Curvature and Entropy Statistics-Based Blind Multi-Exposure Fusion Image Quality Assessment. Symmetry 2021, 13, 1446. https://0-doi-org.brum.beds.ac.uk/10.3390/sym13081446
AMA Style
He Z, Song Y, Zhong C, Li L. Curvature and Entropy Statistics-Based Blind Multi-Exposure Fusion Image Quality Assessment. Symmetry. 2021; 13(8):1446. https://0-doi-org.brum.beds.ac.uk/10.3390/sym13081446
Chicago/Turabian StyleHe, Zhouyan, Yang Song, Caiming Zhong, and Li Li. 2021. "Curvature and Entropy Statistics-Based Blind Multi-Exposure Fusion Image Quality Assessment" Symmetry 13, no. 8: 1446. https://0-doi-org.brum.beds.ac.uk/10.3390/sym13081446
Note that from the first issue of 2016, this journal uses article numbers instead of page numbers. See further details here.