
The Uncertain Network DEA Model for Two-Stage System with Additive Relationship


1
Department of International Trade and Economy, Ocean University of China, Qingdao 266100, China
2
Marine Development Studies Institute, Ocean University of China, Qingdao 266100, China
*
Author to whom correspondence should be addressed.
†
These authors contributed equally to this work.
Symmetry 2021, 13(10), 1893; https://0-doi-org.brum.beds.ac.uk/10.3390/sym13101893
Submission received: 25 August 2021
/
Revised: 24 September 2021
/
Accepted: 2 October 2021
/
Published: 7 October 2021
(This article belongs to the Special Issue Fuzzy Set Theory and Uncertainty Theory)
Abstract
:When decision making units (DMUs) have internal structures with imprecise inputs and outputs, uncertain network data envelopment analysis (UNDEA) is appropriate to deal with the efficiency evaluation of these DMUs. However, a deep insight into clarifying the power’s differences between the internal structures of DMUs is a deficiency in the current UNDEA model. To address this issue, in this paper, we propose a new UNDEA model by differentiating the power asymmetry of each sub-stage with assumption of a two-stage system and demonstrate an additive relationship between stage 1 and stage 2 of each DMU. Moreover, the equivalent form and its proof of the new model are also presented for accurate calculation. Finally, a numerical example reflecting three different additive relationships between two sub-stages of DMUs is given to illustrate the results of evaluation.
1. Introduction
One of the main goals of economy and production management is to measure the efficiency of a decision making unit (DMU). Data envelopment analysis (DEA), first put forward by Charnes et al. [1], has become a prevailing method to evaluate the relative efficiencies of DMUs with multiple inputs and multiple outputs. Afterward, numerous DEA models were expanded to comprehensively estimate the efficiencies of DMUs, involving the BCC model [2] by examining scale efficiencies of DMUs, additive or Pareto–Koopmans (PK) model [3] by considering the influence of slacks on the efficiencies of DMUs, cross-efficiency DEA model [4] by evaluating the peer efficiencies of DMUs, superefficiency DEA model [5] by ranking the efficiencies of DMUs, slacks-based measure (SBM) model [6] by studying the excessive inputs or insufficient outputs of DMUs, and so on.
However, in many practical issues, the precise data of some inputs and outputs in DMUs are not easily observed, such as carbon emissions and customer satisfaction, due to technical or economic causes. In this situation, it is typical to invite some domain experts to estimate these quantities based on their knowledge or preference. Due to the conservativeness of human beings [7], the distribution functions of these data are obviously not close enough to the real frequencies of these quantities. Hence, Liu [8] proposes uncertainty theory to deal with the uncertainty of human subjective estimation by defining the concept of uncertain variable. By regarding some inputs and outputs as uncertain variables, many scholars have put forward a series of uncertain data envelopment analysis (UDEA) models, including Wen et al. [9], Lio and Liu [10], and Jiang et al. [11].
Among these UDEA models, some scholars paid more attention to the kind of DMUs with internal structures in order to identify the root causes of the inefficiency. For instance, Jiang et al. [12] first proposed an UNDEA model with an assumption that DMUs are network structure systems composed of two sub-stages in a series relationship. Subsequently, Pourmahmoud and Bagheri [13] presented a linear UNDEA model for a two-stage system. Ghaffari-Hadigheh and Lio [14] raised an UNDEA model with mixed structure of DMUs, in which the whole stage was composed of several sub-stages coexisting in both series and parallel relationships.
Nevertheless, the previous UNDEA models put less effort on recognizing the differences between sub-stages within the system, e.g., power asymmetry, which is quite common in reality. Power is the ability to influence the behavior of another in a supply chain [15]. For example, in a global retail supply chain with Walmart as the core enterprise, it is obvious that Walmart’s power in this chain is much larger than that of other upstream and downstream firms [16]. When evaluating the efficiency of such kind of supply chains, we may get the wrong outcomes if we fail to reflect the power asymmetry correctly. Therefore, the main aims of this paper are as follows. First, we assume that a DMU is a two-stage network system with a series relationship. Second, we attempt to assign different weights to different stages to describe the power asymmetry inside the system and set the sum of the weights to be equal to 1. Finally, by regarding all inputs and outputs as uncertain variables, we thereby propose a new UNDEA model for a two-stage system with an additive relationship.
The remainder of this article is set as below. In the Section 2, we carry out a comprehensive literature review. In the Section 3, we introduce some basic knowledge of uncertainty theory. In the Section 4, we propose an UNDEA model for a two-stage system with additive relationship and prove its equivalent form. In the Section 5, we provide a numerical example to test this model and give three different cases with different additive relationships of the two sub-stages. The last section is the conclusion.
2. Literature Review
The NDEA model was originally proposed by Färe and Grosskopf [17] to evaluate the efficiency of DMUs with network structures. Subsequently, scholars put forward a number of NDEA models. In 2004, Chen and Zhu [18] put forward an NDEA model for a two-stage system in which the two sub-stages are connected in series. Then, a NDEA model with a parallel system was proposed by Kao and Huang [19], and it explained what the parallel system was using the example of a university that had multiple departments. In 2009, Yu and Fan [20] presented a NDEA model to evaluate the efficiency of DMUs with mixed structures.
In addition, some researchers applied existing NDEA models to solve real-life problems. Wang et al. [21] evaluated the impact of information technology on 22 banks, where the system is divided into funds collection stage and investment stage. Subsequently, Kao and Hwang [22] presented a NDEA model for two-stage system with production relationship that estimated the efficiency of premium acquisitions and profit generation for 24 non-life insurance companies in Taiwan, China. Moreover, a NDEA model for two-stage with the parallel system was proposed by Park et al. [23] to evaluate the operational capacity of nine container terminals in Busan port by dividing the whole stage into loading–discharging (L&D) and delivery–receiving (D&R) stages.
These NDEA models above are typically used to evaluate DMUs with the precise data of inputs and outputs. However, some data of inputs and outputs in DMUs are often imprecise, such as customer satisfaction and social welfare, in practical application. To deal with the problem of inaccurate data, some NDEA models have been presented. In 2017, Bayati and Sadjadi [24] used a robust NDEA model to evaluate the efficiency of 16 Iranian regional electricity power networks. Afterward, Liu [25] proposed a fuzzy NDEA model for two-stage system, where the data of inputs and outputs were treated as fuzzy numbers. In 2007, Liu [7] put forward uncertainty theory, which treated imprecise inputs and outputs as uncertain variables. Based on this, Jiang et al. [12] first proposed an UNDEA model for a two-stage system. Subsequently, Ghaffari-Hadigheh and Lio [14] raised an UNDEA model with mixed structure of DMUs.
The above studies illustrate the urgency and rationality of using UNDEA models to evaluate the efficiency of DMUs with imprecise inputs and outputs. Therefore, this paper develops an UNDEA model for a two-stage system by applying uncertainty theory to deal with the power asymmetry within the system.
3. Preliminaries
Uncertainty theory was initially introduced and established by Liu [7] in 2007. The uncertain measure M was defined by the following four axioms [8,26]:
Axiom 1
(Normality Axiom [8]). for the universal set .
Axiom 2
(Duality Axiom [8]). for any event .
Axiom 3
Axiom 4
(Product Axiom [26]). The product uncertain measure M in uncertainty spaces is an uncertain measure satisfying
where are arbitrarily chosen events from for , respectively.
The uncertain variable [8] is defined as a measurable function from an uncertainty space. For any real number x, the uncertainty distribution (Liu [9]) of an uncertain variable is defined in the following way:
A linear uncertainty distribution labeled with is defined by Liu [27] as follows:
Its inverse uncertain distribution [27], denoted as , can be expressed as follows:
Theorem 1
(Liu [27]). Assume are independent uncertain variables with regular uncertainty distributions respectively. When is strictly increasing with respect to and strictly decreasing with respect to , then an inverse uncertainty distribution of is
If has an uncertainty distribution [27], the expected value of the uncertain variable can be expressed as follows:
Theorem 2
(Liu and Ha [28]). Suppose are independent uncertain variables with regular uncertainty distributions , respectively. When is strictly increasing with respect to and strictly decreasing with respect to , then the expected value of is
4. The UNDEA Model for Two-Stage System with Additive Relationship
When DMUs with some inputs and outputs are not easily obtained in practice, e.g., customer satisfaction and social welfare, we can invite some domain experts to estimate these quantities and then treat them as uncertain variables according to uncertainty theory [8].
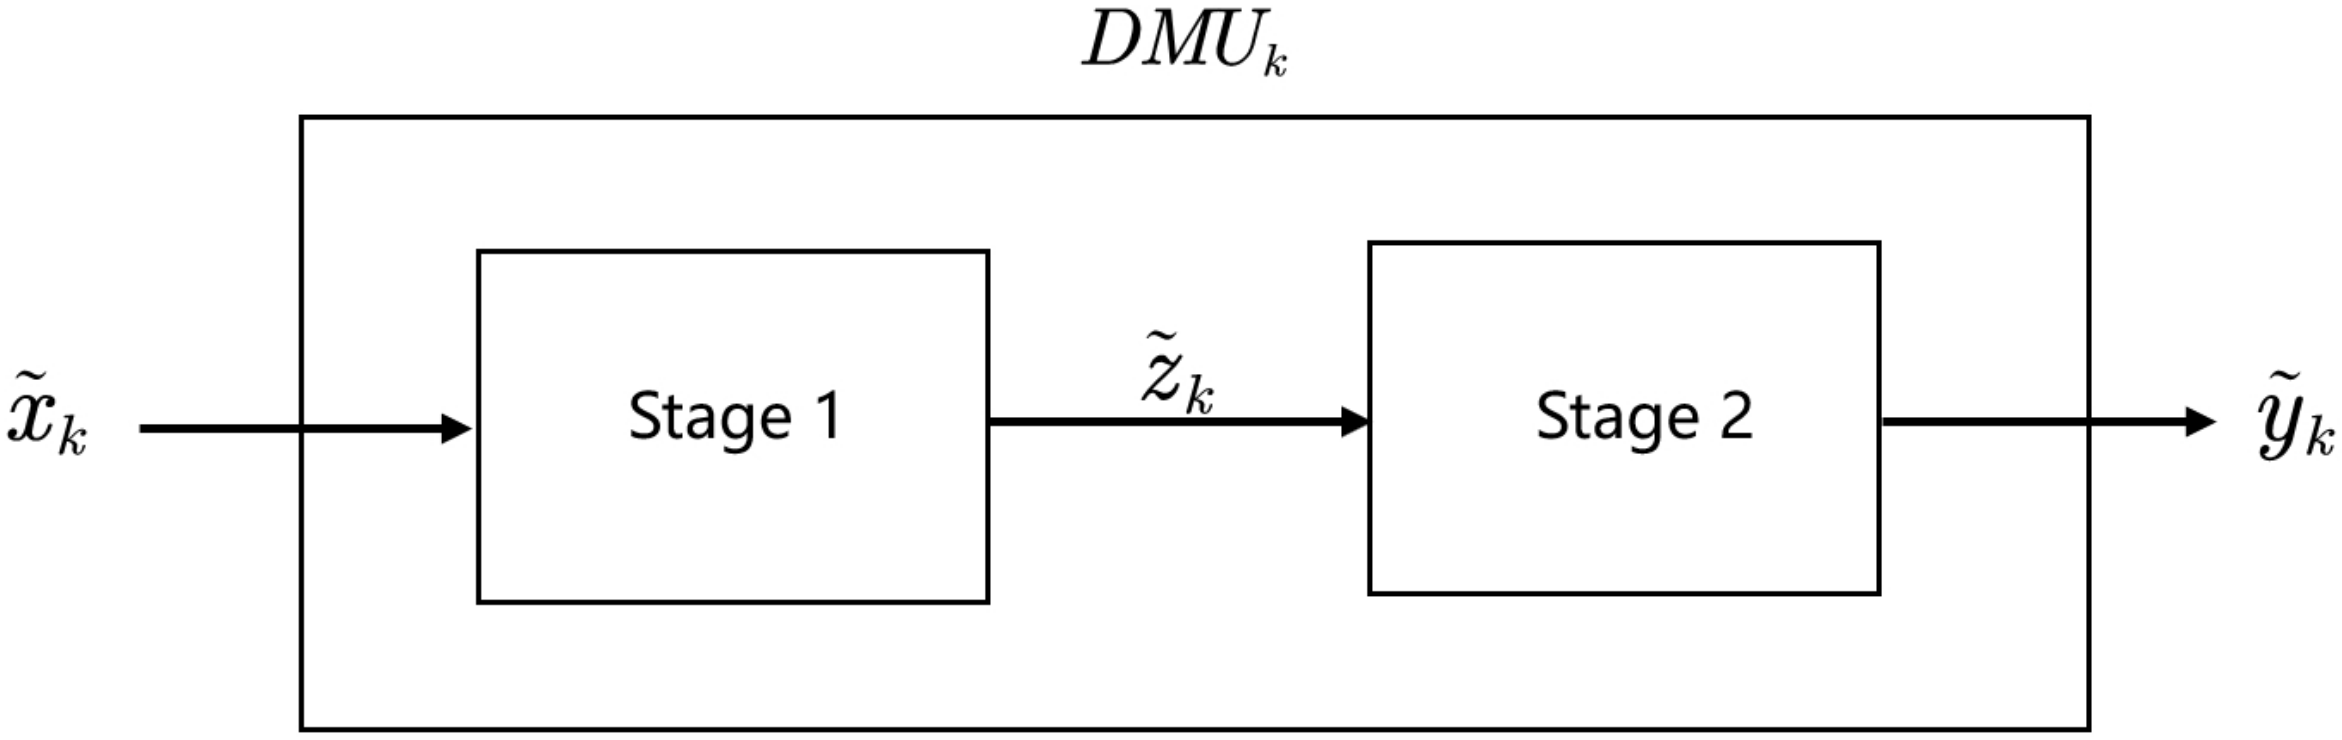
Suppose the number of DMUs is j. For each k with , the kth DMU consists of two sub-stages, i.e., stage 1 and stage 2, as shown in Figure 1. In stage 1, it consumes uncertain input vector to produce uncertain output vector , denoted as uncertain intermediate vector. And is also used as uncertain input vector in stage 2 to produce uncertain output vector .
For DMU, assuming the power of each sub-stage is different to some extent, we artificially assign w and w to each sub-stage to indicate the power asymmetry of the two-stage system. Then, we define the efficiency of the whole stage (), which is equal to a weighted sum of the efficiencies of stage 1 () and that of stage 2 (), i.e.,
where w and w are user-specified and non-negative weight factors, and w+w=1.
In addition, for each stage of DMU, we assign that the expected ratio of weighted uncertain outputs to weighted uncertain inputs is always less than or equal to unity, as shown in Formulae (2) and (3), for stage 1 and stage 2, respectively:
where , and are non-negative weight vectors of , and , respectively.
According to Formulae (1)–(3), since w+w=1, the efficiency of the whole stage for DMU is always less than or equal to unity as follows:
The target DMU is regarded to be efficient in the whole stage if a set favorable weights (, , ) can be found such that the efficiency of the whole stage for DMU reaches up to 1, i.e.,
subject to constraints (2) and (3). To prove if DMU is efficient or not in the whole stage, we could propose the following UNDEA model,
where , and are non-negative weight vectors, and , and are uncertain input vectors, uncertain intermediate vectors, and uncertain output vectors of DMU, , respectively.
Definition 1
(Efficiency of the whole stage). DMU is identified as efficient in the whole stage if the optimal value of (4) reaches up to 1.
Along with obtaining of DMU, we can also calculate the efficiencies of stage 1 and stage 2 by putting a set of favorable weights (, , ) of DMU into Formulae (2) and (3), shown as follows:
Definition 2
(Efficiency of stage 1). DMU is identified as efficient in stage 1 if the optimal value of (5) reaches up to 1.
Definition 3
(Efficiency of stage 2). DMU is identified as efficient in stage 2 if the optimal value of (6) reaches up to 1.
Based on model (4), Formulae (5) and (6), we can obtain the efficiencies of the whole stage, stage 1 and stage 2, respectively. For calculation, the equivalent form of model (4) is given as follows:
Theorem 3.
Let uncertain variables , and be independent with uncertainty distributions and , k=1,…, j, respectively. Then, the new UNDEA model (4) is equivalent to the following form,
where and are the uncertainty distributions of , and , respectively.
Proof.
According to Theorem 1, we can infer that for each k, the inverse uncertainty distribution of ()/() is
From Theorem 2, the equivalent form of stage 1 is as follows:
Similarly, the equivalent form of stage 2 is shown below:
Therefore, according to Formulae (9) and (10), the equivalent form of the whole stage is as follows:
The proof is completed. □
5. Numerical Example
With the purpose of testifying this new UNDEA model, we present a numerical example of ten DMUs to examine the efficiencies of the whole stage and two sub-stages. Suppose that each DMU has two uncertain outputs, two uncertain intermediates, and two uncertain inputs. All uncertain variables are set to linear uncertainty distributions, denoted as . In Table 1, the initial data of these ten DMUs are given.
Based on the data in Table 1, we can obtain the efficiency of the whole stage for each DMU by counting the optimal value of model (4). Additionally, we can also obtain a set of favorable weights (, , ) of each DMU according to the results of model (4), and then substitute them into Formulae (5) and (6) to obtain the optimal values of stage 1 () and stage 2 () for each DMU. In addition, since w and w represent the power asymmetry of each stage, we design three different cases by assigning different values to and to examine our model, and the outcomes are shown in Table 2, Table 3 and Table 4.
The first case is designed that the power of stage 1 is the same as that of stage 2, and the values of both and are equal to 0.5. The results are shown in Table 2.
According to the results of Table 2, it is clear that the efficiency of the whole stage for DMU reaches 1, which means that DMU is efficient in the whole stage. Meanwhile, the efficiencies of both stage 1 and stage 2 for DMU are also 1. However, although the efficiencies of the whole stage for some DMUs do not reach 1, the efficiencies of some sub-stage do. For example, the efficiencies of stage 1 for DMU and DMU reach 1, but the efficiencies of stage 2 for both two DMUs do not, while in the case of DMU and DMU, the efficiencies of stage 2 do but that of stage 1 not. Therefore, it is obvious that the root cause for making DMU and DMU inefficient is the inefficient stage 2, and the inefficiencies of DMU and DMU are caused by stage 1.
The second case is designed that the power of stage 1 is greater than that of stage 2 with and . The results are shown in Table 3.
Comparing the results of Table 2 and Table 3, it is interesting to notice that the efficiencies of these ten DMUs change to different weight assignment of each stage. Take DMU as an example. In stage 2, DMU is efficient in case 1 but inefficient in case 2. The efficiency of the whole stage for DMU is also reduced. It proves that power asymmetry of each stage will lead to different results of efficiency evaluation of not only in the whole stage but also in sub-stages.
The third case is designed oppositely with and . The results are shown in Table 4.
Contrasting to the results of Table 3 and Table 4, we get the similar conclusion as above. The efficiencies of each stage change when the power of each sub-stage changes. Take DMU as an example. In stage 1, DMU is efficient in case 2 but inefficient in case 3. While in stage 2, DMU is efficient in case 3 but inefficient in case 2. The efficiency of the whole stage for DMU is also different. Obviously, the results shown in Table 2, Table 3 and Table 4 demonstrate that the identification of power asymmetry to each stage is crucial to the correct efficiency evaluation of DMUs.
6. Conclusions
Efficiency assessment has always been critical for decision makers. The UDEA model is a method to evaluate the efficiency of DMUs with imprecise inputs and outputs data by applying the uncertainty theory. When DMUs have complex internal structures, we consider evaluating them with the UNDEA model. In this paper, we assume that each sub-stage of DMUs may have different power in each internal stage, and hence proposes a new UNDEA model for two-stage system with additive relationship. The two-stage structure is a fundamental structure that can be easily extended into a three-stage structure or multiple-stage structure. Afterward, a numerical example by considering three different cases with different power to the two sub-stages is given to illustrate the practicability of the new model.
The main findings of this article are as follows. First, an UNDEA model for two-stage system with additive relationship is constructed in this paper. The power asymmetry of the sub-stages within the system is solved by assigning different weight to each sub-stage. Second, this paper fits three cases and demonstrates that the efficiency of DMUs is different for the whole stage, stage 1 and stage 2 with different weight assignments for each stage, which also justifies the rationality of the model.
The UNDEA model presented in this paper is applied to evaluate the efficiency of DMUs that contain two sub-stages, and it can be used to solve more complex problems, such as three or even multiple stages. Furthermore, the UNDEA model can be made use of evaluating the performance of the marine circular economy, where the whole stage is composed of two sub-stages: economic production stage and environmental treatment stage.
In addition, the weights of and in this paper are based on numerical simulations. In the future, we can collect the data of and through relevant surveys, or we can obtain the corresponding values according to decision makers or experts.
Author Contributions
Methodology and model, B.J.; data curation and analysis, C.Y.; writing—original draft preparation, B.J. and C.Y.; writing—review and editing, B.J. and J.L. All authors have read and agreed to the published version of the manuscript.
Funding
This research was funded by the National Natural Science Foundation of China Grant No.61873329 and Research Program of Natural Science Foundation of Shandong Province Grant No.ZR2020MG044.
Data Availability Statement
Data are contained within the article.
Conflicts of Interest
The authors declare no conflict of interest.
References
- Charnes, A.; Cooper, W.W.; Rhodes, E. Measuring the efficiency of decision making units. Eur. J. Oper. Res. 1979, 2, 429–444. [Google Scholar] [CrossRef]
- Banker, R.D.; Charnes, A.; Cooper, W.W. Some models for estimating technical and scale efficiencies in data envelopment analysis. Manag. Sci. 1984, 30, 1078–1092. [Google Scholar] [CrossRef] [Green Version]
- Charnes, A.; Cooper, W.W.; Golany, B.; Seiford, L.; Stutz, J. Foundations of data envelopment analysis for Pareto-Koopmans efficient empirical production functions. J. Econom. 1985, 30, 91–107. [Google Scholar] [CrossRef]
- Sexton, T.R.; Silkman, R.H.; Hogan, A.J. Data envelopment analysis: Critique and extensions. New. Dir. Eval. 1986, 32, 73–105. [Google Scholar] [CrossRef]
- Andersen, P.; Petersen, N.C. A procedure for ranking efficient units in data envelopment analysis. Manag. Sci. 1986, 39, 1261–1264. [Google Scholar] [CrossRef]
- Tone, K. A slacks-based measure of efficiency in data envelopment analysis. Eur. J. Oper. Res. 2002, 143, 32–41. [Google Scholar] [CrossRef] [Green Version]
- Liu, B. Uncertainty Theory, 4th ed.; Springer: Berlin, Germany, 2015; ISBN 978-3-662-44353-8. [Google Scholar]
- Liu, B. Uncertainty Theory, 2nd ed.; Springer: Berlin, Germany, 2007; ISBN 978-3-540-73164-1. [Google Scholar]
- Wen, M. Uncertain Data Envelopment Analysis; Springer: Berlin, Germany, 2015; ISBN 978-3-662-43801-5. [Google Scholar]
- Lio, W.; Liu, B. Uncertain data envelopment analysis with imprecisely observed inputs and outputs. Fuzzy Optim. Decis. Mak. 2018, 17, 357–373. [Google Scholar] [CrossRef]
- Jiang, B.; Lio, W.C.; Li, J. An uncertain DEA model for scale efficiency evaluation. IEEE Trans. Fuzzy Syst. 2019, 27, 1616–1624. [Google Scholar] [CrossRef]
- Jiang, B.; Chen, H.; Li, J.; Lio, W. The uncertain two-stage network dea models. Soft Comput. 2020, 10, 421–429. [Google Scholar] [CrossRef]
- Pourmahmoud, J.; Bagheri, N. Providing an uncertain model for evaluating the performance of a basic two-stage system. Soft Comput. 2020, 25, 4739–4748. [Google Scholar] [CrossRef]
- Ghaffari-Hadigheh, A.; Lio, W. Network data envelopment analysis in uncertain environment. Comput. Ind. Eng. 2020, 148, 106657. [Google Scholar] [CrossRef]
- Emerson, R.M. Power dependence relations. Am. Sociol. Rev. 1962, 27, 31–41. [Google Scholar] [CrossRef] [Green Version]
- Mottner, S.; Smith, S. Wal-mart: Supplier performance and market power. J. Bus. Res. 2009, 62, 535–541. [Google Scholar] [CrossRef]
- Färe, R.; Grosskopf, S. Intertemporal Production Frontiers: With Dynamic DEA; Springer: Dordrecht, The Netherlands, 1996; ISBN 978-94-009-1816-0. [Google Scholar]
- Chen, Y.; Zhu, J. Measuring information technology’s indirect impact on firm performance. Inf. Manag. 2004, 5, 9–22. [Google Scholar] [CrossRef]
- Kao, C.; Hwang, S.N. Efficiency measurement for network systems: IT impact on firm performance. North-Holland. Decis. Support Syst. 2010, 48, 437–446. [Google Scholar] [CrossRef]
- Yu, M.M.; Fan, C.K. Measuring the performance of multimode bus transit: A mixed structure network DEA model. Transp. Res. Pt. e-Logist. Transp. Rev. 2009, 45, 501–515. [Google Scholar] [CrossRef]
- Wang, C.H.; Gopal, R.D.; Zionts, S. Use of data envelopment analysis in assessing information technology impact on firm performance. Ann. Oper. Res. 1997, 73, 191–213. [Google Scholar] [CrossRef]
- Kao, C.; Hwang, S.N. Efficiency decomposition in two-stage data envelopment analysis: An application to non-life insurance companies in Taiwan. Eur. J. Oper. Res. 2006, 185, 418–429. [Google Scholar] [CrossRef]
- Park, J.; Lee, B.K.; Low, J.M.W. A two-stage parallel network DEA model for analyzing the operational capability of container terminals. Marit. Policy Manag. 2020. [Google Scholar] [CrossRef]
- Bayati, M.F.; Sadjadi, S.J. Robust network data envelopment analysis approach to evaluate the efficiency of regional electricity power networks under uncertainty. PLoS ONE 2017, 12, e0184103. [Google Scholar] [CrossRef] [Green Version]
- Liu, S.T. Restricting weight flexibility in fuzzy two-stage DEA. Comput. Ind. Eng. 2014, 74, 149–160. [Google Scholar] [CrossRef]
- Liu, B. Some Research Problems in Uncertainty Theory. Available online: https://www.researchgate.net/publication/228666965 (accessed on 11 June 2021).
- Liu, B. Uncertainty Theory; Springer: Berlin, Germany, 2010; ISBN 978-3-642-13958-1. [Google Scholar]
- Liu, Y.H.; Ha, M.H. Expected Value of Function of Uncertain Variables. Available online: https://www.researchgate.net/publication/237076924 (accessed on 11 June 2021).
Figure 1.
DMU with two-stage network system.


Table 1.
Ten DMUs with two uncertain outputs, two uncertain intermediates, and two uncertain inputs.
Table 1.
Ten DMUs with two uncertain outputs, two uncertain intermediates, and two uncertain inputs.
| DMU | Uncertain | Uncertain | Uncertain | Uncertain | Uncertain | Uncertain |
|---|---|---|---|---|---|---|
| Output 1 | Output 2 | Intermediate 1 | Intermediate 2 | Input 1 | Input 2 | |
| 1 | ||||||
| 2 | ||||||
| 3 | ||||||
| 4 | ||||||
| 5 | ||||||
| 6 | ||||||
| 7 | ||||||
| 8 | ||||||
| 9 | ||||||
| 10 |
Table 2.
The efficiency results of ten DMUs with .
| DMU | (The Whole Stage) | (Stage 1) | (Stage 2) |
|---|---|---|---|
| 1 | 1.0000 | 1.0000 | 1.0000 |
| 2 | 0.5537 | 0.3135 | 0.7938 |
| 3 | 0.7333 | 0.4668 | 1.0000 |
| 4 | 0.7857 | 1.0000 | 0.5710 |
| 5 | 0.8408 | 1.0000 | 0.6813 |
| 6 | 0.6012 | 0.3450 | 0.8570 |
| 7 | 0.4065 | 0.1607 | 0.6527 |
| 8 | 0.5556 | 0.2389 | 0.8709 |
| 9 | 0.6105 | 0.2209 | 1.0000 |
| 10 | 0.6065 | 0.5315 | 0.6808 |
Table 3.
The efficiency results of ten DMUs with and .
| DMU | (The Whole Stage) | (Stage 1) | (Stage 2) |
|---|---|---|---|
| 1 | 1.0000 | 1.0000 | 1.0000 |
| 2 | 0.4587 | 0.3756 | 0.6523 |
| 3 | 0.6283 | 0.5060 | 0.9141 |
| 4 | 0.8714 | 1.0000 | 0.5716 |
| 5 | 0.9045 | 1.0000 | 0.6818 |
| 6 | 0.4987 | 0.3451 | 0.8568 |
| 7 | 0.3082 | 0.1607 | 0.6527 |
| 8 | 0.4290 | 0.2390 | 0.8707 |
| 9 | 0.4642 | 0.2642 | 0.9307 |
| 10 | 0.5765 | 0.5319 | 0.6808 |
Table 4.
The efficiency results of ten DMUs with and .
| DMU | (The Whole Stage) | (Stage 1) | (Stage 2) |
|---|---|---|---|
| 1 | 1.0000 | 1.0000 | 1.0000 |
| 2 | 0.6638 | 0.2650 | 0.8348 |
| 3 | 0.8400 | 0.4666 | 1.0000 |
| 4 | 0.8270 | 0.4234 | 1.0000 |
| 5 | 0.7771 | 1.0000 | 0.6815 |
| 6 | 0.7037 | 0.3450 | 0.8573 |
| 7 | 0.5048 | 0.1607 | 0.6528 |
| 8 | 0.6822 | 0.2392 | 0.8707 |
| 9 | 0.7663 | 0.2209 | 1.0000 |
| 10 | 0.6366 | 0.5317 | 0.6808 |
Publisher’s Note: MDPI stays neutral with regard to jurisdictional claims in published maps and institutional affiliations. |
© 2021 by the authors. Licensee MDPI, Basel, Switzerland. This article is an open access article distributed under the terms and conditions of the Creative Commons Attribution (CC BY) license (https://creativecommons.org/licenses/by/4.0/).
Share and Cite
MDPI and ACS Style
Jiang, B.; Yang, C.; Li, J. The Uncertain Network DEA Model for Two-Stage System with Additive Relationship. Symmetry 2021, 13, 1893. https://0-doi-org.brum.beds.ac.uk/10.3390/sym13101893
AMA Style
Jiang B, Yang C, Li J. The Uncertain Network DEA Model for Two-Stage System with Additive Relationship. Symmetry. 2021; 13(10):1893. https://0-doi-org.brum.beds.ac.uk/10.3390/sym13101893
Chicago/Turabian StyleJiang, Bao, Chen Yang, and Jian Li. 2021. "The Uncertain Network DEA Model for Two-Stage System with Additive Relationship" Symmetry 13, no. 10: 1893. https://0-doi-org.brum.beds.ac.uk/10.3390/sym13101893
Note that from the first issue of 2016, this journal uses article numbers instead of page numbers. See further details here.