
Determining the Tiers of a Supply Chain Using Machine Learning Algorithms


Department of Business Administration, Gwangju University, 277 Hyodeok-ro, Nam-gu, Gwangju 61743, Korea
Symmetry 2021, 13(10), 1934; https://0-doi-org.brum.beds.ac.uk/10.3390/sym13101934
Submission received: 17 September 2021
/
Revised: 28 September 2021
/
Accepted: 12 October 2021
/
Published: 14 October 2021
(This article belongs to the Special Issue Simulation and Modelling in Natural Sciences, Economics, Biomedicine and Engineering II)
Abstract
:Companies in the same supply chain influence each other, so sharing information enables more efficient supply chain management. An efficient supply chain must have a symmetry of information between participating entities, but in reality, the information is asymmetric, causing problems. The sustainability of the supply chain continues to be threatened because companies are reluctant to disclose information to others. If companies participating in the supply chain do not disclose accurate information, the next best way to improve the sustainability of the supply chain is to use data from the supply chain to determine each enterprise’s information. This study takes data from the supply chain and then uses machine learning algorithms to find which enterprise the data refer to when new data from unknown sources arise. The machine learning algorithms used are logistic regression, random forest, naive Bayes, decision tree, support vector machine, k-nearest neighbor, and multi-layer perceptron. Indicators for evaluating the performance of multi-class classification machine learning methods are accuracy, confusion matrix, precision, recall, and F1-score. The experimental results showed that LR and MLP accurately predicted companies (tiers), but NB, DT, RF, SVM, and K-NN did not accurately predict companies. In addition, the performance similarity of machine learning algorithms through experiments was classified into LR and MLP groups, NB and DT groups, and RF, SVM, and K-NN groups.
1. Introduction
Because various companies participate in the supply chain and the environments of these companies are different, complex and diverse situations occur in the supply chain. Although there are many ways to alleviate problems such as the bullwhip effect occurring in the supply chain, the most representative method is to activate information sharing among companies participating in the supply chain [1]. Information sharing in the supply chain is very important, and information sharing between companies and information sharing with customers has a positive relationship with the performance of the supply chain [2]. Supply chain practice and information sharing affect the supply chain management environment, and in particular, the level of information sharing has more influence on supply chain management than supply chain practice [3]. The basic principle of supply chain management is to improve the efficiency of the supply chain by maintaining sustainable relationships between companies, and the quality of information shared between companies has a positive effect on the sustainability of the supply chain regardless of the nationality of the company [4]. In addition, the supply chain model needs to be symmetrically and harmoniously constructed by all participating entities to pursue the overall optimization of the supply chain.
Companies participating in the supply chain also know that sharing information among companies increases the transparency of the supply chain and makes it easier to respond to volatility, but as competition intensifies, information sharing among companies in the supply chain is not smooth.
Therefore, this study intends to cope with the situation when information is not disclosed by utilizing previously disclosed information in case the information is not disclosed due to intensifying competition among companies. One of the ways to prepare for undisclosed situations by using publicly available information in the supply chain is to learn the publicly available information, retain it as knowledge, and use it in an undisclosed situation. One of the methods applicable in this case is machine learning [5].
Machine learning is a sub-class of artificial intelligence, which refers to the broad field of creating intelligent machines, that is based on self-learning algorithms that allow these systems to learn through experience [6,7].
Looking at the studies applying machine learning to the supply chain, Sang [8] explained the genetic algorithm combined with the SVM and the BP neural network to assess the credit risk of the supply chain of the finance industry considering information sharing and proposed that the BP neural network had a better classification accuracy than the SVM. Malviya et al. [9] used machine learning algorithms (artificial neural network, random tree, logistic regression, c5.0, Bayesian network, support vector machine, and discriminant analysis) to solve supply chain shortages or backorder problems, and through the method the back order was predicted and a feasible backorder scenario was presented. Baryannis et al. [10] presented a supply chain risk prediction framework by applying machine learning techniques to supply chain risk management. Abbasi et al. [11] applied machine learning to solve large operational optimization problems in blood supply chain management and also explained that the use of machine learning can improve operational decisions because optimization models are computationally expensive and are thus often impracticable for routine operational decisions in organizations such as nonprofit or small and medium-sized enterprises. Huang and Wang [12] explained that integrating information sharing and learning effects in the supply chain plays an important role in determining the efficiency and benefits of the supply chain. Carbonneau et al. [13] explained that there cannot be full demand information because full collaboration of supply chains is not possible, but demand needs to be predicted. They applied a neural network, recurrent neural network, and support vector machine for demand prediction and suggested that RNN and SVM perform better compared to naïve forecasting, trending, moving average, and linear regression, but the prediction accuracy of regression models is statistically more significant than other techniques.
Studies applying machine learning to supply chains have mainly been applied to supply chain prediction, such as credit risk prediction evaluation of supply chains [8], loss prediction [9], establishment of forecasting framework [10], operational decision making [11], and demand prediction [13].
Additional recent studies related to the supply chain are as follows. Nurhayati and Purnomo [14] explained that the supply chain should be integrated in the direction of mitigating negative influencing factors and utilizing positive influencing factors. Rasmussen et al. [15] used geographic information to optimize the operation and management of enterprises and showed that this method is effective for supply chain logistics of SMEs. Liu and Li [16] used blockchain technology in the supply chain and suggested that blockchain technology can improve the efficiency of the supply chain while securing the reliability of information to correct abnormal data in the supply chain. Loi et al. [17] used an integrated approach including a fuzzy interpretation structure model (FISM), fuzzy cross-impact matrix multiplication applied to classification (FMICMAC) analysis, and fuzzy analytic hierarchy process (FAHP) to the rice supply chain and explained that the logistics activities of the supply chain are improved through their use. Sakai [18] proposed an integrated human management system for the strategic operation of global production to realize “simultaneous start-up and same quality” around the world and proved its efficiency by applying it in the field.
As described above, studies that applied machine learning to the supply chain mainly focused on predicting the supply chain. However, one of the best ways to increase efficiency while eliminating supply chain uncertainty is to share information among companies participating in the supply chain, but companies participating in the supply chain do not want to share it with other companies as competition intensifies. However, in order to achieve the overall optimization of the supply chain, the supply chain manager must find a company (or tier) that is the source of the information generated, even if information is not shared among the companies participating in the supply chain. Therefore, this study applies machine learning and analyzes the results in order to find a company that is the source of information generated in the supply chain. It also assesses whether the algorithms can be distinguished through the results of comparing the performance of the applied machine learning algorithms.
2. Methodology
2.1. Study Area
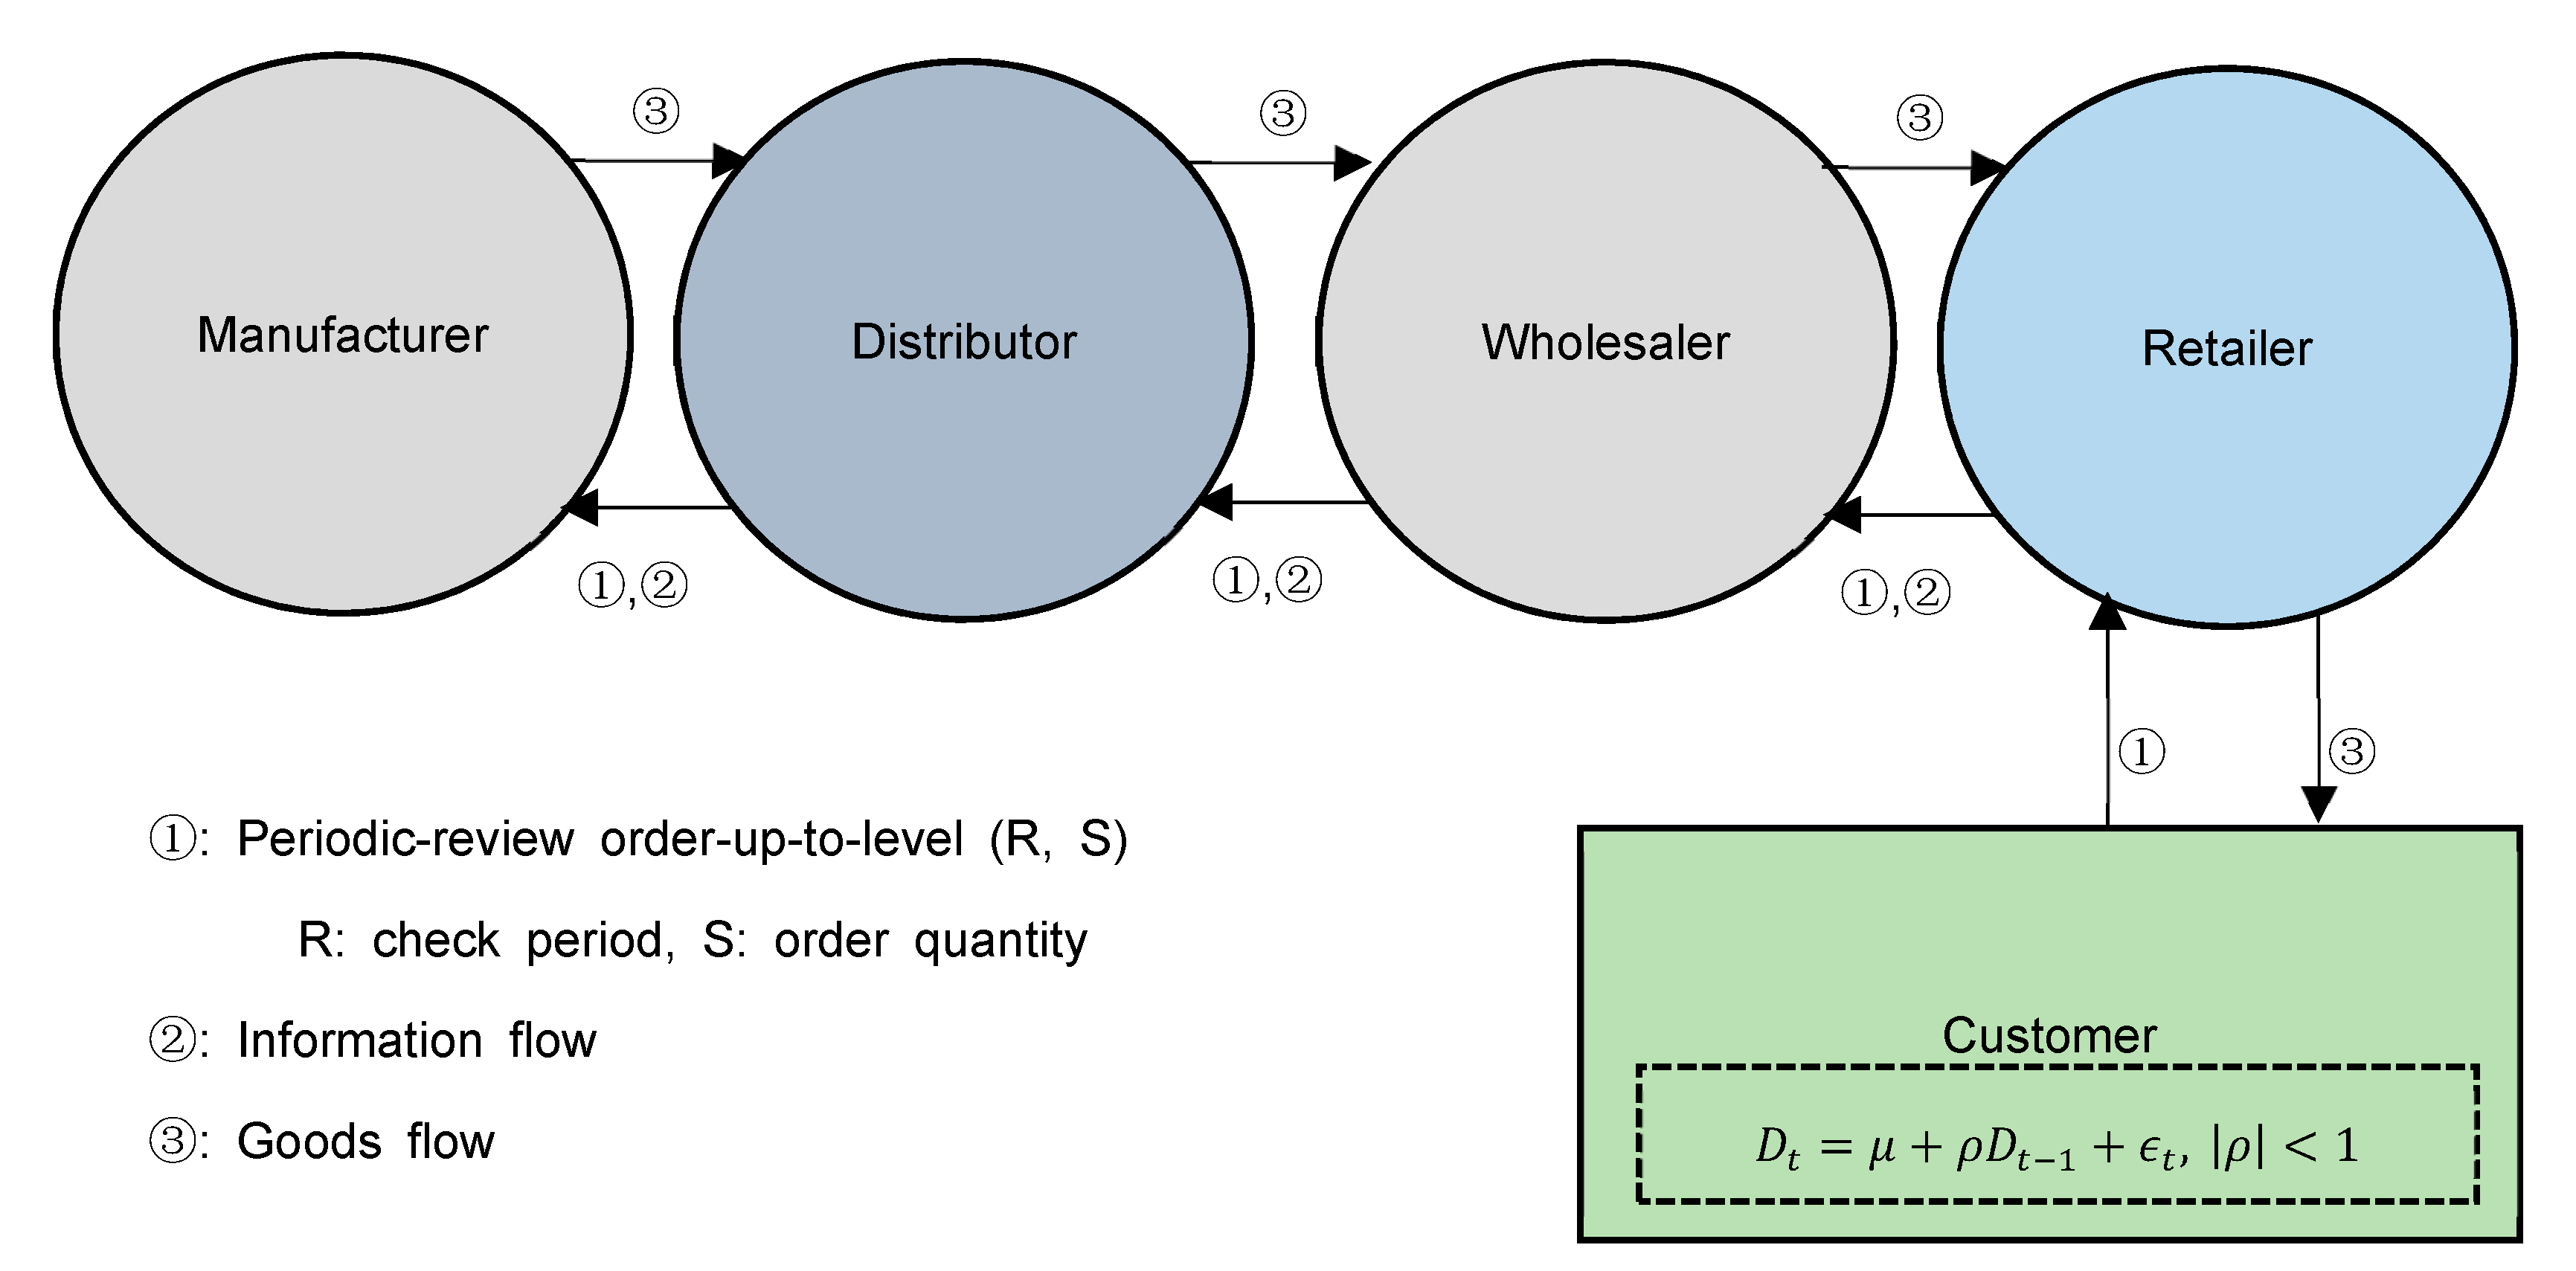
The supply chain model targeted in this study consists of a manufacturer, distributor, wholesaler, and retailer, as shown in Figure 1, and receives orders from the customer.
Customer demand in the supply chain model (Figure 1) assumes stochastic demand instead of deterministic demand considering the realities of the supply chain. Thus, customer demand assumes the AR(1) model, expressed by Equation (1):
is the demand at time t, is a non-negative constant, is an independent and uniformly distributed error term with mean 0 and variance , and is the first-order autocorrelation coefficient. and in Equation (1) affect the customer demand process. stands for the trend of customer demand and shows the correlation of demand over the entire time period, and stands for the degree of demand fluctuation and explains the variance of demand [19,20].
In Figure 1, the expected demand () of tiers (Manufacturer, Distributor, Wholesaler, and Retailer) at time t consists of the sum of the expected demand () and the incoming order () at time t − 1 from the downstream tier. This is expressed by Equation (2):
where, () is the relative weight between the incoming order and the expected demand. In Equation (2), if , the expected demand is not typically reflected, but only the actual incoming order is reflected. If , the actual incoming order is not reflected at all, but only the expected demand. Therefore, is appropriately set and used to reflect both the expected demand and incoming order.
To manage the performance of the supply chain, the total inventory cost (TIC) and order fill rate (OFR) of the supply chain are used, and the equations for calculating the total inventory cost and order fill rate are expressed in Equations (3) and (4) [1]:
TIC is composed of the total of the inventory holding cost (IHC) and the shortage cost (SC) for time t (t = 1, …, n) at tier i (i = 1, …, m). SC is supposed to be higher than IHC, because a shortage causes not only loss of sales opportunities but also loss of reliability for tiers. is the sum of shortage and is the sum of inventory at time t in tier i. OFR in the supply chain is explained by dividing the sum of (i = 1, …, m) by the number of tiers (m) [1].
For overall optimization, TIC of the supply chain should be minimized and OFR should be maximized, so the objective functions for supply chain optimization are expressed in Equations (5) and (6):
Data required for machine learning are collected for all four sequences (Manufacturer, Distributor, Wholesaler, and Retailer) because each tier is represented as a sequence. For each sequence, it is assumed that the average () is 100, the customer demand fluctuation () is 10, and the value representing the demand trend is −0.6. The inventory information of each tier is collected and used as learning and verification data for machine learning. It is assumed that the total data collection period is 600 weeks.
2.2. Machine Learning Algorithms
Machine learning, a field of artificial intelligence, is a methodology that extracts prediction, judgment, and knowledge using a model learned using a large number of data [21,22]. Machine learning is divided into supervised learning, unsupervised learning, and reinforcement learning [23]. In addition, the classification of machine learning is divided into binary, multi-class, multi-labelled, and hierarchical tasks [24]. This study belongs to a classification problem that finds the source of information by using previously known information in the supply chain, and, in particular, belongs to a multi-classification problem because the supply chain has multiple tiers. In addition, it belongs to supervised learning because the result value of the input data can be used for learning.
Machine learning algorithms are diverse [25]. This work uses logistic regression (LR), random forest (RF), naive Bayes (NB), decision tree (DT), support vector machine (SVM), k-nearest neighbor (K-NN), and multi-layer perceptron (MLP) to evaluate multi-class machine learning algorithms [21,23,26,27].
Logistic regression is a supervised learning algorithm that predicts the probability of data belonging to a particular category by a value between 0 and 1, and classifies it by probability to belong to a more likely category [21]. Logistic regression initializes the coefficient and intercept of each feature to zero, multiplies the value of each feature by the coefficient to obtain the log-odds value, and then puts it in a sigmoid function to obtain a probability between 0 and 1.
Random forest is an ensemble machine learning model, and it is an algorithm that outputs classification or prediction values from multiple decision trees created during the training process [21]. Decision tree means a tree for making a decision. Because it uses a hierarchical approach, if an error occurs in the middle, it has the disadvantage of continuing to pass the error to the next stage. The bagging (or bootstrap aggregating) or randomized node optimization technique is used to overcome this [28].
Naive Bayes is an algorithm that uses the Bayesian theorem to determine which class of measurements should be included when they have various properties, and is a conditional probability model [27]. Naive Bayes algorithm has the advantage of being easy to create, useful for large datasets, and working well in complex environments such as real-world situations, despite simple design and assumptions.
Decision tree is widely used in classification and regression, and it is a predictive model that connects the observation values and target values of items [23,26]. Decision tree divides the data into ‘yes’ or ‘no’ for a specific question and divides the variable area into two at each branch. Decision tree puts the correct answer in a square box and calls it a node. The first question is called a root node, and the last node is called a terminal node. Decision Tree uses a pruning technique to prevent overfitting because overfitting is common when there are too many branches in the tree.
Support vector machine is a supervised learning model used for classification and regression analysis [29], and an algorithm to find decision boundaries that maximize margins while reducing classification errors. The training data closest to the decision boundary are called support vector [26]. Support vector machine is a non-stochastic, linear classification model that determines which category new data is included in when data is divided into categories and consists of a data set, but it can also be used for non-linear classification. When Support Vector Machine is used for nonlinear classification, it is necessary to map data into a high-dimensional feature space, and a kernel trick is used to do this task efficiently.
K-nearest neighbor is a nonparametric method used for classification and regression [30]. It is an algorithm that classifies by referring to ‘k’ data labels with the closest distance from a particular datum and uses Euclidean distance to measure the distance between the data. K-nearest neighbor has the advantage of being easy to use because of its simple algorithm, but it has the disadvantage of lowering the classification speed as the amount of computation increases as the amount of data increases. When applying the k-nearest neighbor algorithm, it is necessary to normalize the data and to specify the number of k as an odd number to prevent a tie situation [26].
Multi-layer perceptron is a feed-forward neural network model consisting of an input layer, a hidden layer, and an output layer [23,26]. That is, the input value enters the input layer, the weights are given in the hidden layer, and the output layer gives the result value. If there are two or more hidden layers, more accurate prediction than a machine learning algorithm is possible [31]. Multi-layer perceptron refers to perceptron with more than one hidden layer. When the number of hidden layers is more than two it is called a deep neural network (DNN), and the learning process of a deep neural network is called deep learning (DL). To solve the gradient loss problem arising from multi-layer perceptron, deep learning uses reLU instead of tanh as an activation function [26].
2.3. Performance Measurement of Machine Learning Algorithms
There are various methods for evaluating the performance of multi-class classification machine learning algorithms [24], and this work uses accuracy, confusion matrix, precision, recall (or true positive rate), and F1-score as performance evaluation methods for multi-class classification machine learning algorithms [24,32].
The symbols used in performance evaluation algorithms is described below. Where means the total number of classes, and means the ith class. means to accurately predict the true as true (true positive) in the ith class, and means to accurately predict the false as false (true negative) in the ith class. means to incorrectly predict the false as true (false positive) in the ith class, and means to incorrectly predict the true as false (false negative) in the ith class [24].
Accuracy refers to the ratio of the number of correctly predicted samples among all samples. The higher the value, the better the model, and the accuracy is expressed by Equation (7):
Confusion matrix means how much the result value of the verification data matches the predicted result value. The verification data are displayed in a row and prediction data in a column.
Precision refers to the ratio of the number of samples that are actually included in a positive class, with the output being included in the positive class. The higher the precision, the better the model, and the basic formula is expressed by Equation (8):
Recall refers to the ratio of the number of samples that actually belong to the positive class among the samples included in the positive class. Recall is also called Sensitivity. The higher the recall, the better the model, and the formula is expressed by Equation (9).
F-score means a weighted harmonic average of precision and recall, and the weight given to precision is called beta. The F1-score means that beta is 1, and the higher the value, the better the model, and the formula is described as Equation (10):
2.4. Data Collection
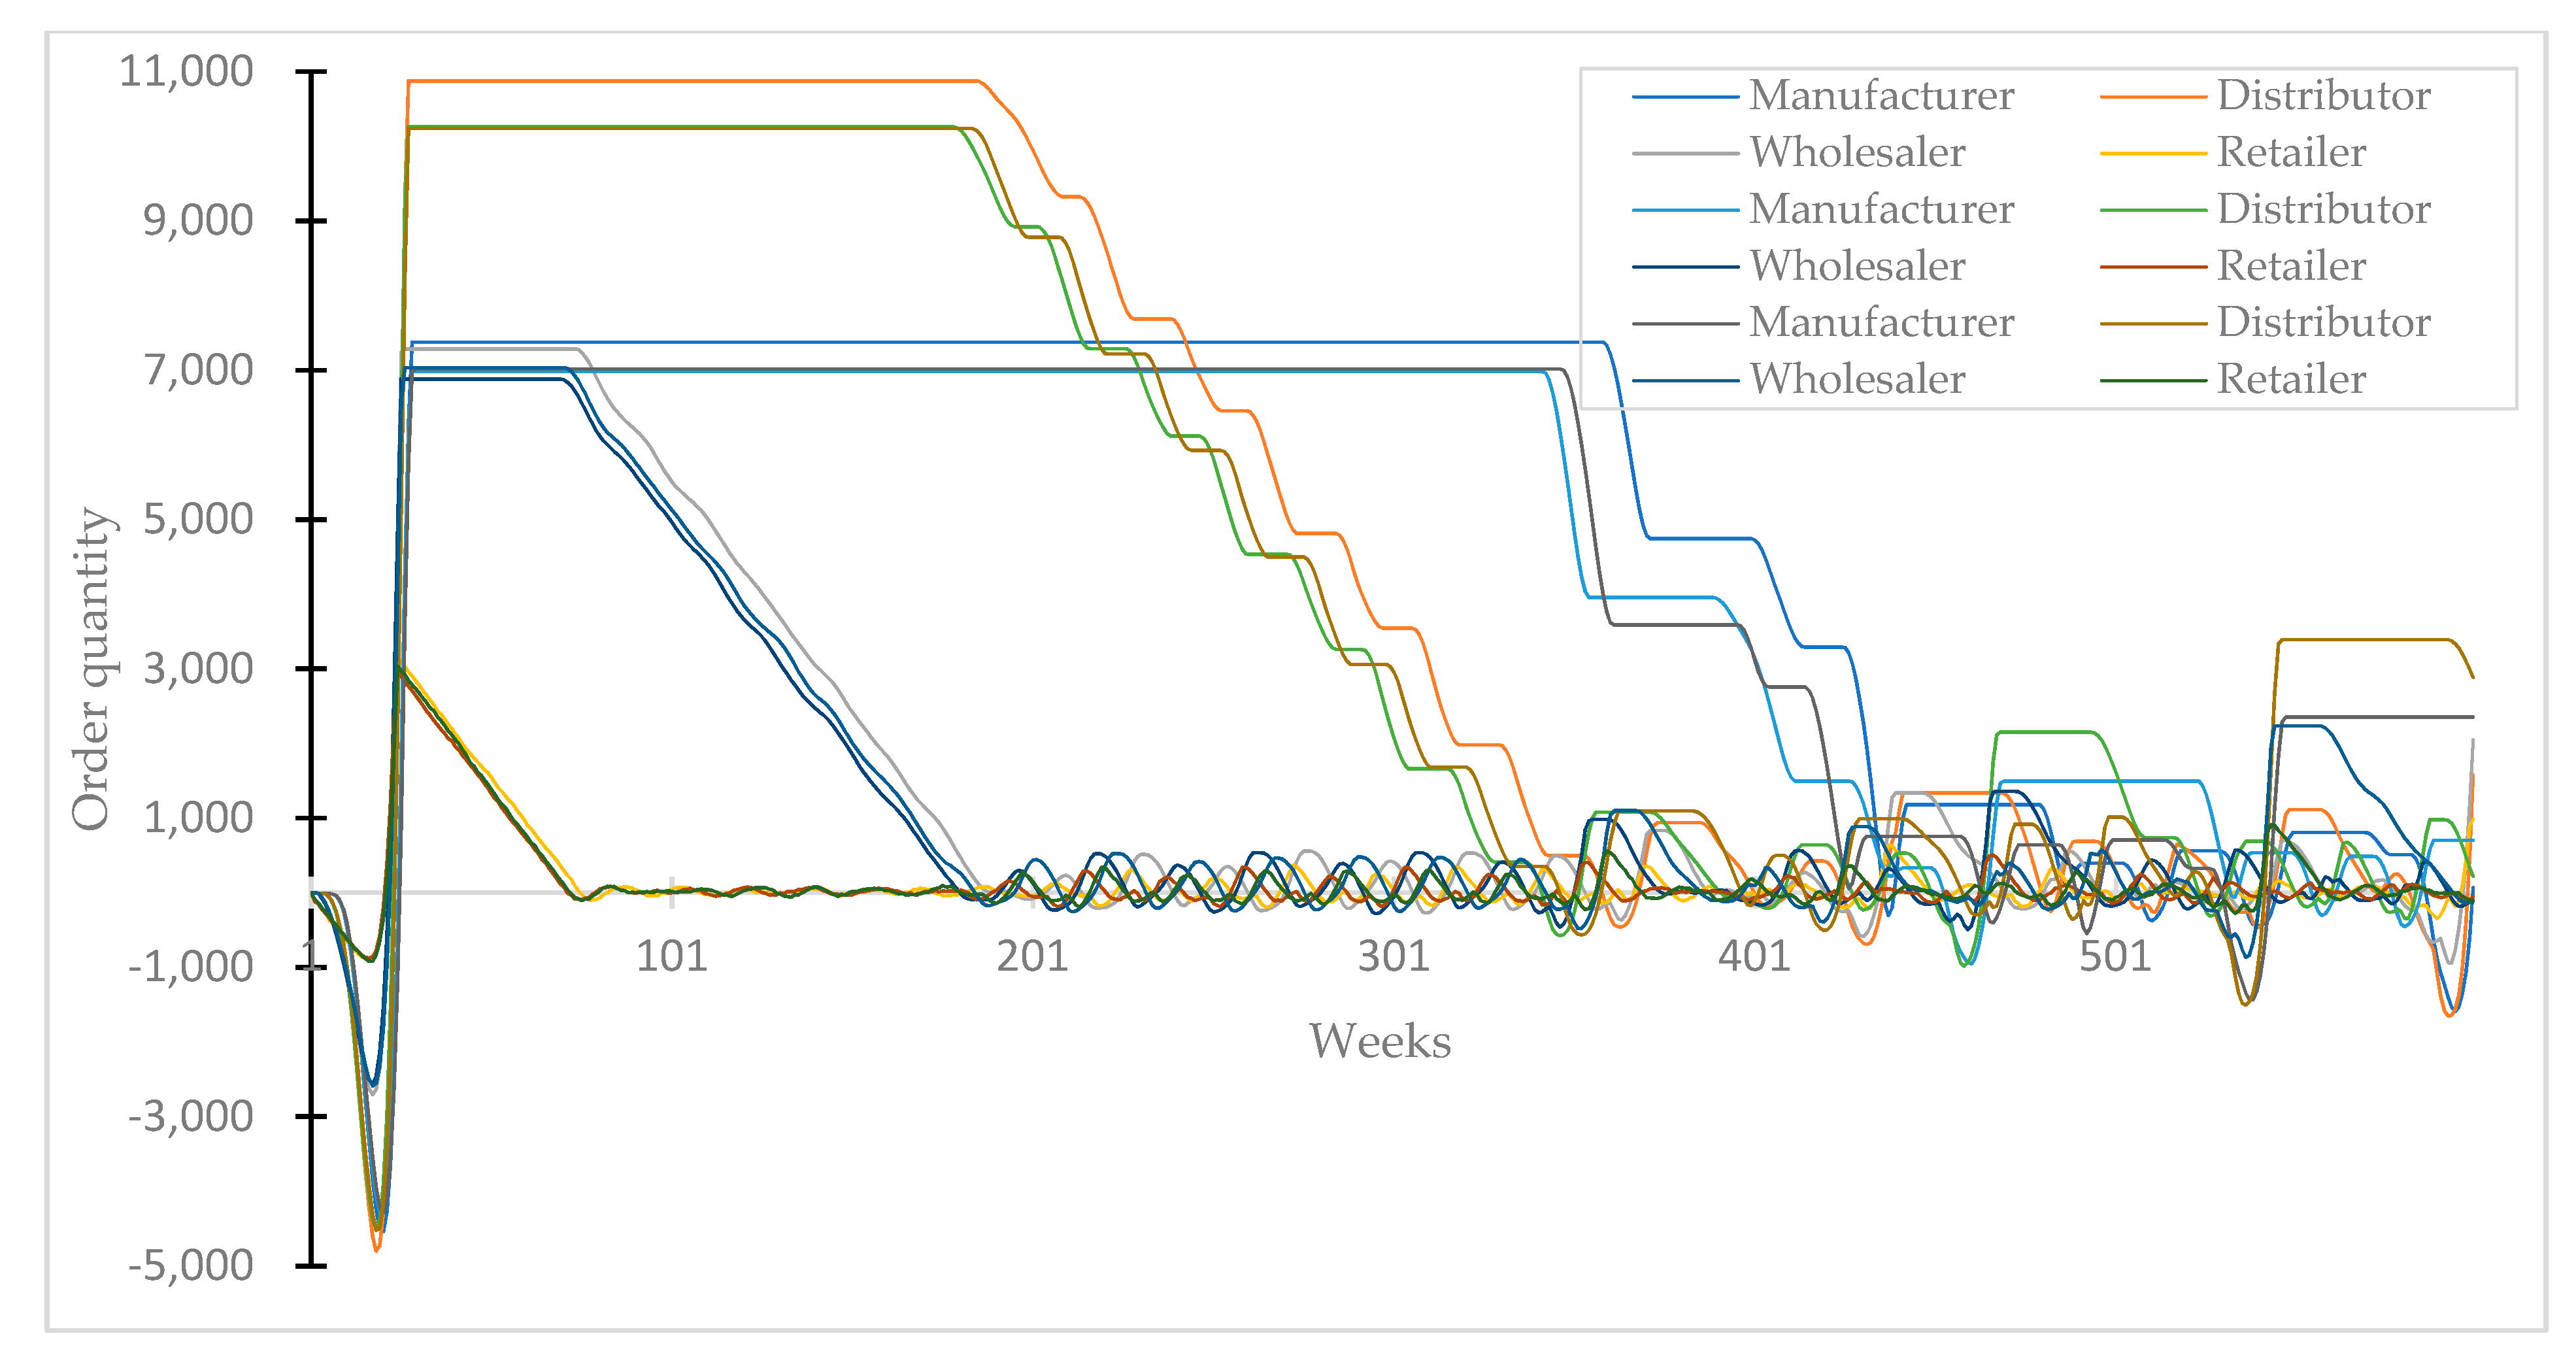
The data used for machine learning use order information of manufacturer, distributor, wholesaler, and retailer included in the supply chain model in Figure 1. By a customer order assuming AR(1), the sum of the customer order quantity and the predicted order quantity to prevent backlog is sequentially requested from the retailer → wholesaler → distributor → manufacturer, and the produced order quantity is delivered by the manufacturer → distributor → wholesaler → retailer and delivered to the final customer. Figure 2 shows an example of the trend of change for three sets of order data for manufacturer, distributor, wholesaler, and retailer.
The order data of the supply chain tiers shown in Figure 2 shows different data characteristics for each tier. Therefore, if the machine learning multi-class discrimination classification algorithms presented in this study are applied, it is predicted that the tier that the collected data refers to can be determined.
The learning data used for the training of machine learning algorithms are assumed to be operated by four tiers in the supply chain for 600 weeks, obtained by performing 40 simulation runs, and consists of 96,000 (4 tiers × 40 sets × 600 weeks) ordered data.
Validation data are data obtained by performing 169 simulations in the same environment with the same supply chain model (Figure 2), from which training data are obtained, consisting of a total of 405,600 (4 tiers × 169 sets × 600 weeks) ordered data requested by manufacturer–retailer.
3. Results and Discussion
In this study, assuming that customer demand follows the AR(1) model, a machine learning algorithm was used to determine the tier that the order data of unknown origin refer to in the supply chain model consisting of manufacturer, distributor, wholesaler, and retailer. The machine learning algorithms used were logistic regression, naive bayes, decision tree, random forest, support vector machine, K-nearest neighbor, and multi-layer perceptron, and the obtained results were compared.
First, the accuracy of the machine learning algorithms for tier determination of the supply chain is shown in Table 2. LR and MLP have the highest accuracy of 100%, RF is 94.8%, K-NN is 89.2%, SVM is 85.5%, and NB and DT are the lowest at 83.9%.
Second, the classification result table comparing the original result value and the predicted result value of the verification data is shown in Table 3. Since LR and MLP have 100% accuracy, the values in the classification result table also accurately judge manufacturer (M), distributor (D), wholesaler (W), and retailer (R). Because the other machine learning methods except LR and MLP did not reach 100% accuracy, this paper checks which tiers were not accurately identified through the classification result table. All machine learning methods correctly discriminated D and R regardless of accuracy, but the methods except LR and MPL did not accurately discriminate M and W. In particular, NB and DT had the highest rate of misjudging M as D at 64.5% (109/169), while SVM and K-NN were not as high as NB and DT but reached 29% (49/169) and 14.2% (24/169), respectively. In RF, the rate of misjudging M as D was very low at 0.01% (1/169). In addition, RF, SVM, and K-NN showed high rates of erroneously discriminating W as D at 20.1% (34/169), 29% (49/169), and 29% (49/169), respectively. Summarizing the results presented in the classification result table, NB and DT had a high rate of erroneously discriminating M as D, and SVM and K-NN had a high rate of erroneously discriminating W as D. Summarizing the results, it can be seen that the discrimination errors of machine learning algorithms are greatly affected by a specific data set, such as erroneously discriminating M as D or W as D.
Table 4 describes the precision, recall, and F1-score obtained when determining tiers by applying machine learning algorithms. Since LR and MLP have an accuracy of 1, the precision, recall, and F1-score of all tiers are 1. NB and DT had the same accuracy as 0.839, and since the precision, recall, and F1-score of the tiers all had the same value, it is judged that they show the same performance. RF shows accuracy 1 only in Retailer, and the other tiers show differences in precision, recall, and F1-score. It can be seen that SVM has an accuracy of 1 only in retailer, and the other tiers perform worse than the values of precision, recall, and F1-score in RF. It can be seen that K-NN has an accuracy of 1 only in retailer, and the other tiers have better performance than the SVM, although the values of precision, recall, and F1-score are worse than RF. Macro avg. in Table 4 means simple average values of precision, recall, and F1-score for all tiers.
Among the seven machine learning algorithms used in the verification process, five algorithms (all except LR and MLP) had discriminant errors in some cases, so the discrimination accuracy did not reach 100%. This phenomenon means that it is not easy to completely solve over-fitting and under-fitting problems in the training process of data, and it is difficult to find data and setting methods that can simultaneously satisfy various machine learning algorithms. In other words, classification algorithms must meet the generalization that must fit well not only with learning data, but also with verification data. This is not easy, and therefore various additional studies are necessary.
4. Conclusions
This study tried to manage the volatility of the supply chain by analyzing the data generated in the supply chain using a machine learning algorithm to secure the sustainability of the supply chain model consisting of manufacturers, distributors, wholesalers, and retailers. This work assumed that customer demand follows AR(1), used order information as learning data to find the tier the data describes, and analyzed the results using machine learning algorithms (LR, NB, DT, RF, SVM, K-NN, MLP).
In the analysis that appeared after the machine learning algorithms were applied, all seven applied machine learning algorithms predicted distributor and retailer as one tier, and the results were also accurately determined. However, a difference occurred when the applied machine learning algorithms discriminated the manufacturer and wholesaler tiers. LR and MLP predicted one tier and accurately discriminated the results, but the other five machine learning algorithms (NB, DT, RF, SVM, and K-NN) had performance differences. The probability of misjudging manufacturer as distributor was 64.5% (109/169) for NB and DT, 29% (49/169) for SVM, 14.2% (24/169) for K-NN, and 0.01% (1/169) for RF. The probability of misjudging a wholesaler as a distributor was the same for SVM and K-NN at 29% (49/169), RF at 20.1% (34/169), and the remaining four machine learning algorithms (LR, NB, DT, MLP) accurately identified each case. The performance similarity of machine learning algorithms through experiments was classified into LR and MLP groups, NB and DT groups, and RF, SVM, and K-NN groups.
In conclusion, the tier discrimination of the supply chain has been accurately predicted (distributor, retailer) or not accurately predicted (manufacturer, wholesaler) depending on the characteristics of the data describing each tier. In addition, it was found that the machine learning algorithms applied for tier discrimination are grouped into algorithms showing similar performance.
In order to accurately understand the exact meaning of the data generated in the supply chain and the source of the data, the number of data collected must be large and the quality of information obtained using the data must be high. However, in reality, it is difficult to obtain data that satisfy both of these conditions. In addition, the data of the supply chain used in this study have the limitation that the theoretical data collected are used to assume that the customer demand, not data from the actual field, follows AR(1).
Data generated in a supply chain can be collected only within a limited range and the amount of data collected is limited, so it is necessary to increase the prediction accuracy of machine learning algorithms by collecting a lot of data and efficiently preprocessing the collected data. Future research related to data collected in the supply chain should suggest ways to efficiently preprocess the provided data in order to increase prediction accuracy when the same machine learning algorithm is applied. In addition, in order to overcome the limitation that this study used only theoretical customer demand data in experiments, it is necessary to check the results by applying it to manufacturing sites both with and without knowing the source of the data generated in the supply chain.
Funding
This study was conducted by research funds from Gwangju University in 2021.
Conflicts of Interest
The author declares no conflict of interest.
References
- Park, K.J. A Heuristic Simulation–Optimization Approach to Information Sharing in Supply Chains. Symmetry 2020, 12, 1319. [Google Scholar] [CrossRef]
- Huo, B.; Zhao, X.; Zhou, H. The Effects of Competitive Environment on Supply Chain Information Sharing and Performance: An Empirical Study in Chin. Prod. Oper. Manag. 2014, 23, 552–569. [Google Scholar] [CrossRef]
- Zhou, H.; Benton, W.C., Jr. Supply Chain Practice and Information Sharing. J. Oper. Manag. 2007, 25, 1348–1365. [Google Scholar] [CrossRef]
- Lee, C.; Ha, B.C. Interactional Justice, Informational Quality, and Sustainable Supply Chain Management: A Comparison of Domestic and Multinational Pharmaceutical Companies. Sustainability 2021, 13, 998. [Google Scholar] [CrossRef]
- Alzubi, J.; Nayyar, A.; Kumar, A. Machine Learning from Theory to Algorithms: An Overview. J. Phys. Conf. Ser. 2018, 1142, 012012. [Google Scholar] [CrossRef]
- Sharma, N.; Sharma, R.; Jindal, N. Machine Learning and Deep Learning Applications-A Vision. Glob. Transit. Proc. 2021, 2, 24–28. [Google Scholar] [CrossRef]
- Lee, A.; Taylor, P.; Kalpathy-Cramer, J.; Tufail, A. Machine Learning Has Arrived! Am. Acad. Ophthalmol. 2017, 127, 1726–1728. [Google Scholar] [CrossRef] [Green Version]
- Sang, B. Application of Genetic Algorithm and BP Neural Network in Supply Chain Finance Under Information Sharing. J. Comput. Appl. Math. 2021, 384, 113170. [Google Scholar] [CrossRef]
- Malviya, L.; Chittora, P.; Chakrabarti, P.; Vyas, R.S.; Poddar, S. Backorder Prediction in the Supply Chain Using Machine Learning. In Materials Today: Proceedings; Elsevier: Amsterdam, The Netherlands, 2021. [Google Scholar]
- Baryannis, G.; Dani, S.; Antoniou, G. Predicting Supply Chain Risks using Machine Learning: The Trade-off Between Performance and Interpretability. Future Gener. Comp. Syst. 2019, 101, 993–1004. [Google Scholar] [CrossRef]
- Abbasi, B.; Babaei, T.; Hosseinifard, Z.; Smith-Miles, K.; Dehghani, M. Predicting Solutions of Large-scale Optimization Problems via Machine Learning: A Case Study in Blood Supply Chain Management. Comput. Oper. Res. 2020, 119, 104941. [Google Scholar] [CrossRef]
- Huang, Y.; Wang, Z. Information Sharing in a Closed-loop Supply Chain with Learning Effect and Technology Licensing. J. Clean. Prod. 2020, 271, 122544. [Google Scholar] [CrossRef]
- Carbonneau, R.; Laframboise, K.; Vahidov, R. Application of Machine Learning Techniques for Supply Chain Demand Forecasting. Eur. J. Oper. Res. 2008, 184, 1140–1154. [Google Scholar] [CrossRef]
- Nurhayati, A.; Purnomo, A.H. A Proposed Integrated Supply Chain Management Framework for Tuna Fishery in Palabuhanratu. WSEAS Trans. Environ. Dev. 2020, 16, 1–10. [Google Scholar] [CrossRef]
- Rasmussen, S.S.; Talla, M.; Valverde, R. Case Study on Geocoding based Scheduling Optimization in Supply Chain Operations Management. WSEAS Trans. Comput. Res. 2019, 7, 29–35. [Google Scholar]
- Liu, L.; Li, C. Research on Supply Chain Architecture of Logistics Network Platform based on Blockchain Technology. Int. J. Circuits Syst. Signal Process. 2020, 14, 526–532. [Google Scholar]
- Loi, N.T.; Hoa, H.T.T.; Anh, P.D.T.; Khoi, N.D.; My, N.T.K.; Luan, N.T. The Integration of Fuzzy-ISM, Fuzzy-AHP, and Fuzzy-MICMAC Approach under Trapezoid Fuzzy Linguistic to Analyze Enablers of The Logistics Outsourcing Relationship: Mekong Delta, Vietnam Rice Supply Chain Context. Int. J. Circuits Syst. Signal Process. 2021, 15, 1260–1281. [Google Scholar] [CrossRef]
- Sakai, H. New Human-centered Production System-Building an Integrated Human Management System. Int. J. Appl. Math. Comput. Sci. Syst. Eng. 2021, 3, 116–123. [Google Scholar]
- Park, K.J. Effect of Information Quality Level and Customer Demand on Performance Measures in a Supply Chain. J. Korea Soc. Ind. Syst. Eng. 2012, 35, 136–144. [Google Scholar]
- Zhang, C.; Zhang, C. Design and Simulation of Demand Information Sharing in a Supply Chain. Simul. Model. Pract. Theory 2007, 15, 32–46. [Google Scholar] [CrossRef]
- Lee, J.S.; Lee, H. Developing a Pedestrian Satisfaction Prediction Model Based on Machine Learning Algorithms. J. Korea Plan. Assoc. 2019, 54, 106–118. [Google Scholar] [CrossRef]
- Lee, Y.; Moon, P. A Comparison and Analysis of Deep Learning Framework. J. KIECS 2017, 12, 115–122. [Google Scholar]
- Hong, J.; Lee, S.; Bae, J.H.; Lee, J.; Park, W.J.; Lee, D.; Kim, J.; Lim, K.J. Development and Evaluation of the Combined Machine Learning Models for the Prediction of Dam Inflow. Water 2020, 12, 2927. [Google Scholar] [CrossRef]
- Sokolova, M.; Lapalme, G. A Systematic Analysis of Performance Measures for Classification Tasks. Inf. Process. Manag. 2009, 45, 427–437. [Google Scholar] [CrossRef]
- Ferri, C.; Hernandez-Orallo, J.; Modroiu, R. An Experimental Comparison of Performance Measures for Classification. Pattern Recogn. Lett. 2009, 30, 27–38. [Google Scholar] [CrossRef]
- Lee, G.M. Artificial Intelligence; Life and Power Press: Paju-si, Korea, 2018. [Google Scholar]
- Kim, D.S. Welcome to the A.I. World; Life and Power Press: Paju-si, Korea, 2020. [Google Scholar]
- Wikipedia. Random Forest. Available online: https://ko.wikipedia.org/wiki/%EB%9E%9C%EB%8D%A4_%ED%8F%AC%EB%A0%88%EC%8A%A4%ED%8A%B8 (accessed on 25 June 2021).
- Cortes, C.; Vapnik, V. Support-vector Networks. Mach. Learn. 1995, 20, 273–297. [Google Scholar] [CrossRef]
- Altman, N.S. An Introduction to Kernel and Nearest-neighbor Nonparametric Regression. Am. Stat. 1992, 46, 175–185. [Google Scholar]
- Moon, J.; Park, S.; Hwang, E. A Multilayer Perceptron-based Electric Load Forecasting Scheme via Effective Recovering Missing Data. KIPS Trans. Softw. Data Eng. 2019, 8, 67–78. [Google Scholar]
- Raschka, S.; Mirjalili, V. Python Machine Learning, 2nd ed.; Packt Publishing: Birmingham, UK, 2017. [Google Scholar]
- Sklearn.Linear_Model.LogisticRegression. Available online: https://scikit-learn.org/stable/modules/generated/sklearn.linear_model.LogisticRegression.html?highlight=sklearn%20linear_model%20logisticregression#sklearn.linear_model.LogisticRegression (accessed on 26 June 2021).
- Sklearn.Naive_Bayes.GaussianNB. Available online: https://scikit-learn.org/stable/modules/generated/sklearn.naive_bayes.GaussianNB.html?highlight=sklearn%20naive_bayes%20gaussiannb#sklearn.naive_bayes.GaussianNB (accessed on 26 June 2021).
- Sklearn.Tree.DecisionTreeClassifier. Available online: https://scikit-learn.org/stable/modules/generated/sklearn.tree.DecisionTreeClassifier.html?highlight=sklearn%20tree#sklearn.tree.DecisionTreeClassifier (accessed on 26 June 2021).
- Sklearn.Ensemble.RandomForestClassifier. Available online: https://scikit-learn.org/stable/modules/generated/sklearn.ensemble.RandomForestClassifier.html (accessed on 26 June 2021).
- Sklearn.SVM.SVC. Available online: https://scikit-learn.org/stable/modules/generated/sklearn.svm.SVC.html?highlight=sklearn%20svm#sklearn.svm.SVC (accessed on 26 June 2021).
- Sklearn.Neighbors.KneighborsClassifier. Available online: https://scikit-learn.org/stable/modules/generated/sklearn.neighbors.KNeighborsClassifier.html?highlight=sklearn%20neighbors%20kneighborsclassifier#sklearn.neighbors.KNeighborsClassifier (accessed on 26 June 2021).
- Karaki, Y.; Ivanov, N. Hyperparameters of Multilayer Perceptron with Normal Distributed Weights. Pattern Recognit. Image Anal. 2020, 30, 170–173. [Google Scholar] [CrossRef]
Figure 1.
Supply chain model.

Figure 2.
Training data sets (manufacturer, distributor, wholesaler, and retailer) of supply chain model.
Figure 2.
Training data sets (manufacturer, distributor, wholesaler, and retailer) of supply chain model.


Table 1.
The hyperparameters in the machine learning algorithms.
| Algorithm | Hyperparameter | Value |
|---|---|---|
| Logistic Regression [33] | solver | lbfgs |
| penalty | l2 | |
| tol | 1 × 10⁻⁴ | |
| fit_intercept | true | |
| intercept_scaling | 1 | |
| verbose | 0 | |
| Naive Bayes [34] | var_smoothing | 1 × 10⁻⁹ |
| Decision Tree [35] | criterion | gini |
| splitter | best | |
| max_depth, max_features, random_state | none | |
| min_samples_split | 2 | |
| min_samples_leaf | 1 | |
| min_weight_fraction_leaf | 0 | |
| Random Forest [36] | n_estimator | 100 |
| max_features | auto | |
| max_depth | 2 | |
| max_leaf_nodes, min_impurity_split | none | |
| min_samples_leaf | 1 | |
| min_samples_split | 2 | |
| verbose, min_weight_fraction_leaf, min_impurity_decrease | 0 | |
| Support Vector Machine [37] | kernel | linear |
| degree | 3 | |
| gamma | scale | |
| C | 1 | |
| tol | 1 × 10⁻³ | |
| coef0 | 0 | |
| shrinking | true | |
| probability | false | |
| K-Nearest Neighbor [38] | n_neighbors | 3 |
| weights | uniform | |
| algorithm | auto | |
| leaf_size | 30 | |
| p | 2 | |
| metric | minkowski | |
| Multi-Layer Perceptron [39] | solver | adam |
| hidden_layer_sizes | (1,000,600) | |
| activation | tanh, reLU | |
| lr | 0.1 | |
| beta_1 | 0.9 | |
| beta_2 | 0.999 | |
| epsilon | 1 × 10⁻⁸ | |
| decay | 0 | |
| metrics | accuracy | |
| batch_size | 5 | |
| max_iter | 100 |
Table 2.
Prediction accuracy results of machine learning algorithms.
| Algorithm | Accuracy |
|---|---|
| Logistic Regression | 100% |
| Naive Bayes | 83.9% |
| Decision Tree | 83.9% |
| Random Forest | 94.8% |
| Support Vector Machine | 85.5% |
| K-Nearest Neighbor | 89.2% |
| Multi-Layer Perceptron | 100% |
Table 3.
Confusion matrix of machine learning algorithms.
| Tier | Algorithm | Tier | |||
|---|---|---|---|---|---|
| M | D | R | W | ||
| M | LR | 169 | 0 | 0 | 0 |
| NB | 60 | 109 | 0 | 0 | |
| DT | 60 | 109 | 0 | 0 | |
| RF | 168 | 1 | 0 | 0 | |
| SVM | 120 | 49 | 0 | 0 | |
| K-NN | 145 | 24 | 0 | 0 | |
| MLP | 169 | 0 | 0 | 0 | |
| D | LR | 0 | 169 | 0 | 0 |
| NB | |||||
| DT | |||||
| RF | |||||
| SVM | |||||
| K-NN | |||||
| MLP | |||||
| W | LR | 0 | 0 | 0 | 169 |
| NB | 0 | 0 | 0 | 169 | |
| DT | 0 | 0 | 0 | 169 | |
| RF | 0 | 34 | 0 | 135 | |
| SVM | 0 | 49 | 0 | 120 | |
| K-NN | 0 | 49 | 0 | 120 | |
| MLP | 0 | 0 | 0 | 169 | |
| R | LR | 0 | 0 | 169 | 0 |
| NB | |||||
| DT | |||||
| RF | |||||
| SVM | |||||
| K-NN | |||||
| MLP | |||||
Table 4.
Precision, recall, and F1-score of the machine learning algorithms.
| Algorithm | Tier | Precision | Recall | F1-Score |
|---|---|---|---|---|
| LR & MLP | M | 1.0 | 1.0 | 1.0 |
| D | 1.0 | 1.0 | 1.0 | |
| R | 1.0 | 1.0 | 1.0 | |
| W | 1.0 | 1.0 | 1.0 | |
| Macro avg. | 1.0 | 1.0 | 1.0 | |
| NB & DT | M | 1.0 | 0.36 | 0.52 |
| D | 0.61 | 1.0 | 0.76 | |
| R | 1.0 | 1.0 | 1.0 | |
| W | 1.0 | 1.0 | 1.0 | |
| Macro avg. | 0.9 | 0.84 | 0.82 | |
| RF | M | 1 | 0.99 | 1 |
| D | 0.83 | 1.0 | 0.91 | |
| R | 1 | 1 | 1 | |
| W | 1 | 0.8 | 0.89 | |
| Macro avg. | 0.96 | 0.95 | 0.95 | |
| SVM | M | 1 | 0.71 | 0.83 |
| D | 0.63 | 1 | 0.78 | |
| R | 1 | 1 | 1 | |
| W | 1 | 0.71 | 0.83 | |
| Macro avg. | 0.91 | 0.86 | 0.86 | |
| K-NN | M | 1 | 0.86 | 0.92 |
| D | 0.7 | 1 | 0.82 | |
| R | 1 | 1 | 1 | |
| W | 1 | 0.71 | 0.83 | |
| Macro avg. | 0.92 | 0.89 | 0.89 |
Publisher’s Note: MDPI stays neutral with regard to jurisdictional claims in published maps and institutional affiliations. |
© 2021 by the author. Licensee MDPI, Basel, Switzerland. This article is an open access article distributed under the terms and conditions of the Creative Commons Attribution (CC BY) license (https://creativecommons.org/licenses/by/4.0/).
Share and Cite
MDPI and ACS Style
Park, K.J. Determining the Tiers of a Supply Chain Using Machine Learning Algorithms. Symmetry 2021, 13, 1934. https://0-doi-org.brum.beds.ac.uk/10.3390/sym13101934
AMA Style
Park KJ. Determining the Tiers of a Supply Chain Using Machine Learning Algorithms. Symmetry. 2021; 13(10):1934. https://0-doi-org.brum.beds.ac.uk/10.3390/sym13101934
Chicago/Turabian StylePark, Kyoung Jong. 2021. "Determining the Tiers of a Supply Chain Using Machine Learning Algorithms" Symmetry 13, no. 10: 1934. https://0-doi-org.brum.beds.ac.uk/10.3390/sym13101934
Note that from the first issue of 2016, this journal uses article numbers instead of page numbers. See further details here.