
Lower Levels of Vestibular Developmental Stability in Slow-Moving than Fast-Moving Primates
by
 , , , and
Renaud Lebrun
1,2,* ,
,
Alexandre Perier
3,
Judith Masters
3,4,
Laurent Marivaux
1 and
Sébastien Couette
5 1
Institut des Sciences de l’Evolution de Montpellier (ISEM), UMR 5554 (CNRS, UM, IRD/EPHE), Université de Montpellier, 34000 Montpellier, France
2
BioCampus Montpellier, CNRS, UMS 3426, Université de Montpellier (UM), 34000 Montpellier, France
3
Department of Zoology & Entomology, University of Fort Hare, Alice 5700, South Africa
4
Department of Botany and Zoology, Stellenbosch University, Matieland 7602, South Africa
5
Ecole Pratique des Hautes Etudes, PSL, Paris & UMR 6282 Biogéosciences, Université de Bourgogne, 21000 Dijon, France
*
Author to whom correspondence should be addressed.
Symmetry 2021, 13(12), 2305; https://0-doi-org.brum.beds.ac.uk/10.3390/sym13122305
Submission received: 8 October 2021
/
Revised: 12 November 2021
/
Accepted: 13 November 2021
/
Published: 3 December 2021
(This article belongs to the Special Issue Biological Symmetry Analysis)
Abstract
:The vestibular system of the mammalian inner ear senses angular and linear velocity of the head and enables animals to maintain their balance. Vestibular anatomy has been studied extensively in order to link its structure to particular kinds of locomotion. Available evidence indicates that, in primates, slow-moving species show higher levels of vestibular variation than fast-moving taxa. We analysed intraspecific morphological variation and fluctuating asymmetry (FA) levels in the semicircular canal systems of six species of lorisiform primates: three slow-moving lorisids and three fast-moving galagids. Our results showed clear differences in levels of intraspecific variation between slow-moving and fast-moving taxa. Higher levels of variation were responsible for deviations from coplanarity for synergistic pairs of canals in slower taxa. Lorisids also presented higher levels of FA than galagids. FA is a better indicator of agility than intraspecific variation. These results suggest that in order to function efficiently in fast taxa, semicircular canal systems must develop as symmetrically as possible, and should minimise the deviation from coplanarity for synergistic pairs. Higher levels of variation and asymmetry in slow-moving taxa may be related to lower levels of stabilising selection on the vestibular system, linked to a lower demand for rapid postural changes.
1. Introduction
The mammalian inner ear (or labyrinth) has two components, the inner membranous labyrinth, and the outer bony labyrinth. The membranous labyrinth develops very early in the growth of the vertebrate skull, during the formation of the cartilaginous chondrocranium, while the bony labyrinth ossifies only later along with the cranium [1]. The bony labyrinth (see Figure 1A) is a series of ossified cavities that protect the delicate membranous labyrinth, which is composed of the organ of hearing (the cochlear duct) and the organ of balance (the semicircular canal ducts, the utricle and saccule, also referred to as the vestibular system). The vestibular system of the inner ear is related to the detection of angular and linear head acceleration and to several reflexes (vestibulo-ocular and vestibulo-collic reflexes) that help to stabilise the gaze and head during movements of the body [2,3]. It is hence responsible for maintaining the balance of the body when in motion.
During the last three decades, the increasing availability of X-ray Computed Tomography (CT) and µCT facilities has enabled researchers to visualise internal anatomical structures, such as the mammalian inner ear, without damaging the specimens. The labyrinth is functionally highly constrained, and likely to reflect adaptations to both the hearing system and the type of locomotion, which is particularly useful for understanding the ecology of extinct species. The petrosal bone, which houses the bony labyrinth, is relatively dense [4], and therefore is frequently preserved in fossils. Most attempts to document labyrinthine morphology using X-ray CT techniques to infer the locomotor repertoire of extinct species have focused on fossil hominins [5,6,7,8] and non-human primates [9,10]. These studies have established a general correlation between the means of the radii (R) of the three semicircular canals (SCCs), body mass and agility. More agile mammals (performing faster head movements) tend to develop larger SCCs than slower ones relative to body mass [11]. Hence, relative SCC size has been used most frequently as a proxy to infer locomotion within various primates [12,13,14,15] and non-primate [16,17,18,19,20,21,22,23] mammalian clades. Although R is an important determinant of the sensitivity of the vestibular system, it captures only a fraction of the morphology of this structure. Other aspects of the SCCs, such as deviation from circularity [24,25,26] and deviation from orthogonality [27], also have a mechanical impact on canal sensitivity [28]. However, little to no significant correlation between deviation from circularity, body mass and agility could be established within a broad sample of mammals [26], and deviation from canal orthogonality has proven not to be a good proxy for agility in some extant and one extinct primate species [15,29], and in rodents [30]. Furthermore, the widely used regressions based on R [11] and deviations from orthogonality [27] to predict agility have been established using one or a few specimens for each species, hence relying on the implicit hypothesis that intraspecific labyrinthine morphological variation is insignificant compared to interspecific variation. However, examples of extremely high levels of morphological variation in bony labyrinth shape have been reported for Bradypus variegatus (the 3-toed sloth) [31], which is characterised by very slow locomotion. Billet et al. [31] hypothesised that a relaxation in the selective pressure applied to the morphology of the bony labyrinth was the likely reason for this higher amount of intraspecific variation. This hypothesis was subsequently tested for samples comprising slow-moving versus fast-moving primate taxa; they revealed that slow-moving species express significantly higher amounts of intraspecific variation of the SCC system than fast-moving species, and that even the latter exhibit non-negligible levels of vestibular morphological variation [29,32]. These results strengthen support for the hypothesis of Billet et al. that lower selective pressures are applied to the vestibular system in taxa with a reduced functional demand for rapid postural adjustments. Perier et al. [29] further suggested that such selective pressures would probably act upon the prenatal ontogenetic pathways responsible for the formation of the SCCs, in order to minimise inter-individual variations of vestibular morphology. In other words, intraspecific vestibular variation levels would partly reflect the efficiency of canalisation of developmental pathways that buffer against the phenotypic effects of changing environmental conditions or genetic variation, in order to maintain fit phenotypes [33]. A question then arises as to whether differences in the levels of asymmetry in vestibular morphology exist between slow-moving and fast-moving taxa. In mammals, left and right vestibular systems are known to depart from perfect symmetry at the interspecific [16,34] and intraspecific [32,35] levels. However, in these studies, the issue of vestibular asymmetry and its potential correlation with SCC sensitivity has remained peripheral, or, when addressed, has not been explored using the concepts and methods specifically developed to investigate the developmental stability of biological structures.
Over the past three decades, quantifying fluctuating asymmetry (FA) levels using geometric morphometric methods to estimate the developmental stability of morphological structures has been a burgeoning field of research [36]. FA is generally considered a nuisance resulting from the inability of organisms to buffer accidental deviation from a canonical phenotype during development [37,38]. FA has been used for decades as a proxy for genetic and environmental stress [39,40], and as an estimation of various aspects of fitness such as mating success (e.g., [41,42]), although the relationship between FA and fitness may not be straightforward [43,44]. A few studies have focused on the links between FA measurements and the functional efficiency of traits [45,46], and found FA levels ranging between 3 and 200 times higher in vestigial (thus non-functional) structures than in functional ones.
In the present study, we compared the intraspecific morphological variability and the FA levels of SCCs in six strepsirrhine primate species showing diverse patterns of arboreal locomotion. Primates exhibit a range of locomotor movements, including quadrupedal walking, leaping, climbing and suspension [47,48,49,50]. No given primate species evinces a single locomotion category, but rather a repertoire that overlaps with those of other species. Nevertheless, some primates, such as lorisids, move relatively slowly, while others, such as galagids, are faster and more agile. For simplification purposes, we chose to compare the extent of morphological variation of the SCC system in so-called “slow” and “fast” primate taxa, following the agility scale defined by Spoor et al. [11]. Our comparative sample comprised three slow-moving lorisid taxa (Loris tardigradus, Nycticebus coucang, and Perodicticus edwardsi), two fast-moving galagid species (Paragalago granti and Galago moholi), and the largest galagid species (Otolemur crassicaudatus), which is relatively slow-moving for a galagid, and occupies an intermediate position in this continuum. We asked:
- Do slow-moving species show higher levels of SCC morphological variation than fast-moving taxa? Is stabilising selection stronger in animals with rapid postural adjustments and less restrictive in species with slower locomotor repertoires?
- If a selective difference exists, does it affect fluctuating asymmetry levels expressed in SCC morphology, and is the level of asymmetry higher in slow-moving taxa than in fast-moving ones? How strong are the developmental stabilising forces during the early stages of ontogeny?
2. Materials and Methods
2.1. Specimens and Selected Taxa
Our comparative sample comprised 130 specimens of lorisiform primates, most of which were housed in six museum collections: Ditsong National Museum of Natural History (DNMNH, n = 30), Pretoria, South Africa; National Museum of Natural History (NMNH, n = 45), Bulawayo, Zimbabwe; Anthropological Institute and Museum (AIM, n = 19), Zürich, Switzerland; University Museum of Zoology (UMZC, n = 1) of Cambridge, United Kingdom; Museum für Naturkunde (MNB, n = 1), Berlin, Germany; and Muséum national d’Histoire naturelle (MNHN, n = 23), Paris, France. The specimens were digitised using different X-ray microtomography (X-ray µCT) facilities by A.P., R.L. and S.C. for the purposes of this study. Additionally, 11 µCT scans were downloaded from MorphoSource [51] (www.morphosource.org, accessed on 15 November 2021), representing specimens from the American Museum of Natural History (AMNH, n = 2), New York, USA; the United States National Museum of Natural History (USNM, n = 1), Washington, USA; the Duke Lemur Center (DLC, n = 6), Durham, USA; and Duke University (DU, n = 2), Durham, USA. Three of the six species studied were slow-moving lorises, while three were faster-moving galagos.
Nycticebus coucang (Boddaert, 1784) (Strepsirrhini, Lorisiformes, Lorisidae), also known as the slow loris, is found in Southeast Asia. It is a nocturnal, arboreal animal that lives in evergreen forests. The most frequent movements included in its locomotion are suspension and slow-moving quadrupedalism [52], followed by bridging and slow-climbing. We included 19 Nycticebus museum specimens, both wild-caught and maintained in zoos, all labelled as “Nycticebus coucang” (see Table S1). However, the taxonomy of Nycticebus is still strongly debated, and the number of species recognised within the genus has increased during the last few years [53]. A number of the sampled Nycticebus specimens may therefore belong to two other species depending on their provenance; i.e., Nycticebus (c.) menagensis (n = 2 specimens wild-caught in Borneo), and N. bengalensis (1 specimen from Vietnam, 1 from Cambodia, and 5 from Thailand). Nycticebus coucang also occurs in southern Thailand, and the five Thai specimens included lacked geographical provenances. Furthermore, N. bengalensis and N. coucang are difficult to distinguish morphologically and genetically from each other [54] and are known to hybridise in Thailand [55], which may argue against the validity of N. bengalensis. Within Nycticebus, however, the specific status of N. pygmaeus is unquestionable [56]. Referred to colloquially as the pygmy loris, it is significantly smaller than all other taxa within the genus [55,57]. As N. pygmaeus coexists with N. bengalensis in Vietnam and Cambodia, we confirmed that our samples did not confound these species by comparing the cranial sizes of our specimens with those of three N. pygmaeus specimens hosted by MorphoSource. Though our Nycticebus sample may contain a few specimens from other slow loris taxa, the vast majority belong to the N. coucang/N. bengalensis group. Furthermore, all species of Nycticebus share the same type of locomotion [58]. In that context, it might be expected that our measurements of intraspecific SCC system variation are (slightly) overestimated, but given the homogeneity of locomotion within the genus, we expect this not to affect the validity of our results regarding FA levels to any significant extent.
Perodicticus edwardsi Bouvier, 1879 (Strepsirrhini, Lorisiformes, Lorisidae), dubbed Milne-Edwards’ potto, has a widespread African distribution from Cameroon to the eastern Congo Basin [59]. Until recently, the taxonomy of Perodicticus was assumed to contain a single species, Perodicticus potto. However, two subspecies have been elevated to species status [60,61]: P. edwardsi and P. ibeanus. Perodicticus is a cryptic nocturnal animal that climbs slowly and moves quadrupedally [52,62], though it can run at times [63]. In the present study, we included 20 specimens of P. edwardsi.
Loris tardigradus (Linnaeus, 1758) (Strepsirrhini, Lorisiformes, Lorisidae), the red slender loris, is a nocturnal slow climber endemic to the humid and montane forests of southwestern Sri Lanka, whose movements depend a lot on the grip of the limbs [64,65]. Two species of Loris are found in Sri Lanka, Loris tardigradus (red slender loris) and Loris lydekkerianus (grey slender loris) which is larger and can also be found in Southern India [66]. As emphasised by Subramoniam’s drawings [64], the locomotor and postural activity of Loris tardigradus involves frequent tensile loading of the limbs [67]. It has been described as moving in a slow quadrupedal fashion, like all lorisids [67], although more recent reports indicate that it is capable of swift movements during locomotion, described as rapid arboreal quadrupedalism [68,69,70]. Nekaris and Bearder [71] described its locomotion as quadrupedal climbing and running. We included 16 L. tardigradus specimens, a minority of which were wild-caught (n = 2, see Table S1); most were zoo or captive-bred specimens from the Duke University Primate Center.
The three lorisid species were given an agility score of 2/6 according to the scale proposed by Spoor et al. [11], which is the lowest score these authors gave to primate species included in their sample.
Otolemur crassicaudatus (Geoffroy, 1812) (Strepsirrhini, Lorisiformes, Galagidae) occurs across a geographical range that extends from Angola to Tanzania, and from South Africa to Uganda. The species practices quadrupedal locomotion, primarily walking, running and climbing, with limited leaping [65,67]. Like Perodicticus, it crosses between trees by tensile bridging behaviour [65]. Otolemur crassicaudatus was given an agility score of 4/6 by Spoor et al. [11], along with Galagoides demidoff; the lowest score accorded to galagid taxa by these authors. We included 30 O. crassicaudatus individuals in our sample.
Galago moholi (Smith, 1836) (Strepsirrhini, Lorisiformes, Galagidae) is widely distributed within southern Africa, where its geographic range extends from Angola to Tanzania, and from South Africa to Rwanda. It is the most specialised leaper within Galagidae, moving on the ground by bipedal hopping [71]: Horizontal leaps of 4 m and height gains of over 2 m are common [72,73]. For G. moholi, leaping is of far greater importance than quadrupedal walking or running as a means of travel [74]. Galago moholi populations may lose as much as 15% of their number annually to aerial predators, primarily to owls at night, but also to hawks during the day, and their locomotor specialisation is likely to have evolved as a means of predator avoidance [75], enabling them to make sudden and unexpected changes of direction [73]. Galago moholi was given an agility score of 6/6 by Spoor et al. [11]. We studied 29 G. moholi specimens housed in the Ditsong Museum of Natural History, Pretoria.
Paragalago granti (Thomas and Wroughton, 1907) (Strepsirrhini, Lorisiformes, Galagidae), the Mozambique eastern dwarf galago, ranges from South Africa through Mozambique, eastern Zimbabwe and Malawi, to southern Tanzania [76]. The species leaps more often than Galagoides, but not as frequently as species of Galago [77], and is hence more quadrupedal. Their preferred habitat in southeastern Africa is dry Newtonia sand forest, which has a high canopy but little understorey, while Galago moholi prefers dry savanna woodland or thornveld [76]. We included 16 P. granti specimens in our study, 15 of which derive from Zimbabwe and the last from South Africa, previously misidentified as G. moholi. Although they were not included in the primate list of Spoor et al. [11], and have a unique locomotor repertoire, they are likely to be more comparable in agility with G. moholi (6) than with O. crassicaudatus (4).
2.2. 3D Data Acquisition
The specimens were X-ray µCT scanned at resolutions ranging between 12 µm and 74 µm of isotropic voxel size, which is sufficient to capture the 3D morphology of the bony labyrinth. The crania of most specimens (n = 109) were scanned entirely, while only the basicranial region was scanned for a subset (n = 21, see Table S1). Bony labyrinths were segmented using Avizo 2019.3 (Thermofisher Scientific) either by manual segmentation or with the help of the watershed segmentation tool, or using a two-step approach involving smart interpolation: (i) pre-segmentation one slice out of around 20 slices in Avizo; (ii) Biomedisa smart interpolation tool [78]. The latter approach was the fastest to achieve a reliable segmentation of the bony labyrinth, especially for the few iodine-stained specimens downloaded from MorphoSource, for which segmentation would otherwise have been complicated. The 3D surfaces representing the left and right labyrinths and the whole or partial crania were exported as PLY files.
2.3. Semilandmarks Protocol
Before semilandmark digitisation, each cranium or basicranium was positioned in space using MorphoDig [79] in order to align the median sutures along the vertical sagittal (XZ) plane and to orientate the two external auditory meatuses perpendicularly to that plane. The rotation matrix of each cranium was saved and applied to both ears. The inner ears were subsequently rotated along the Y-axis to align the left and right lateral canals along the horizontal plane (see Figure 1B). It has been shown recently that the plane of the lateral SCCs departs somewhat from horizontality when the head is at rest in a number of mammal species [80]. However, this standardised way of orientating left and right ears is convenient and biologically relevant. Once positioned, 3D Bezier curves were placed along the centroid of the lumen of each SCC, starting from each ampulla. Curves along the anterior semicircular canal (ASCC) and posterior semicircular canal (PSCC) were fused at the common crus (CC), and the CC was treated as an independent curve (see Figure 1 and Figure 2). A total of four curves for each inner ear (one for each SCC and one for the CC) was digitised for each specimen. These height Bezier curves were exported as an arbitrarily large number of equidistant coordinates within a single TPS file with MorphoDig. TPS files were opened in R and re-expressed using the Geomorph package [81] into 25 equidistant semilandmarks for each lateral semicircular canal (LSCC), 20 semilandmarks for each ASCC and PSCC, and 5 semilandmarks for each CC, making a total of 140 semilandmarks for both left and right inner ears, for each specimen (see Figure 2). The right-mirrored semilandmark configurations were re-mirrored in a second step into their original anatomical positions relative to the left vestibular systems. Semilandmark digitisation for both left and right SCC systems of the 130 specimens were performed twice on different days without reference to the previous measurements, to allow for the estimation of measurement error (ME) [82], and analysis and partitioning of the effects of ME and asymmetry [83].
2.4. Intraspecific Variation in Orientation and Size of the Semicircular Canals
For each left and right SCC system of all specimens, we measured the length of the common crus (CCL). We used the centroid size (CS) of the semilandmarks digitised on each SCC as a proxy for canal size rather than the mean radius of curvature because the shape of the SCC often departs widely from circularity. CS and CCL were then rescaled for each species (so that mean (CS) = 1 and mean (CCL) = 1 for all six species), in order to allow comparison among the species’ variances. We also measured within each ear the angles between the three pairs of ipsilateral SCCs (and angular variances within the six species).
For each specimen, we measured the intraspecific mean and variance of the deviation from coplanarity between the three synergistic canal pairs (Left-LSCC/Right-LSCC, Left-PSCC/Right-ASCC, and Left-ASCC/Right-PSCC). Finally, we measured the absolute difference (asymmetry) between left and right measurements (angle within each ipsilateral ear, semicircular canal CS and CCL) within each species. These analyses were performed using the R [84] and RStudio [85] software.
2.5. Semicircular Canal Shape and Size Variation
Four semilandmark sets for each of the 130 specimens were digitised (left and right SCC systems and one replicate for each ear). As a first step, we produced mean semilandmark configurations as follows: for each specimen, we mirrored the right configurations (initial digitisation + replication) and we applied a generalised Procrustes alignment on the two left (initial digitisation and replication) and the two mirrored right configurations without scaling using the R Morpho package [86]. The consensus of the four aligned configurations was then used to characterise each specimen’s SCC morphology. Semilandmarks were subsequently slid along each curve so as to minimise bending energy, and thereafter Procrustes-aligned using Geomorph [81]. A principal component analysis (PCA) was performed on the whole sample to visualise the spatial distribution of shape variations of all specimens across species. Moreover, six independent PCA analyses were performed on the SCC systems of each species in order to characterise the intraspecific variation of this organ. For the SCC system and for each SCC, we also assessed intraspecific shape variance [87] as a measure of morphological dispersion for each species; a resampling procedure was used to compare the variances of the species [88].
2.6. Vestibular Fluctuating Asymmetry
Semilandmarks of each specimen’s left and mirrored-right vestibular SCC digitisations (initial digitisation and replication) were slid along each curve so as to minimise bending energy, and thereafter Procrustes-aligned. Subsequently, the FA component of SCC shape variation was extracted and, following the nomenclature described in [83], for each species we measured the FA10 index, which is a measure of the level of fluctuating asymmetry within a population of individuals corrected for measurement error (ME). For these first steps, we used the R Geomorph package [81]. For each specimen an “Asymmetry Score” was computed as the square root of the trace of the variance-covariance matrix of the FA component of SCC shape. A PCA was performed on the FA component of shape variation to visualise the asymmetry pattern of the inner ear for all species. Moreover, six independent PCA analyses of FA shape variation were performed for each species to explore the asymmetry of the SCC system. We further assessed intraspecific FA shape variance [87] as a measure of SCC asymmetric dispersion for each species, and a resampling procedure was used to compare the FA dispersion levels among species [88]. Finally, for each species, a 2-block partial least square (PLS) analysis between the symmetric and the asymmetric fractions of SCC shape was performed using the R Morpho package [85]. The significance of the covariance found between these two blocks was assessed using a permutation procedure.
3. Results
Measurement Error was estimated as 4.94%, implying that our acquisition protocol was repeatable at 95%.
3.1. Intraspecific Variation in Orientation and Size of the Semicircular Canals
3.1.1. Angular Values
For the three pairs of SCCs and for left and right SCC systems, G. moholi and P. granti, the fastest species in our sample, exhibited wider mean angles both between the LSCC and PSCC, and between the LSCC and ASCC, than the four other species. Mean angular values between the anterior and posterior SCCs were, however, similar across species. Furthermore, slow taxa expressed almost twice the angular variance as that observed in fast taxa (see Table 1). Only O. crassicaudatus showed similar angular variance values to the lorisid species for the angle between the ASCC and PSCC. Moreover, the mean deviation from coplanarity between synergistic pairs of SCCs was almost always twice as high in lorisid species as it was in galagids, and angular variance between synergistic pairs of SCCs was up to ten times higher in lorisids than in galagids. Otolemur crassicaudatus showed similar levels of mean deviation from coplanarity and angular variance between left and right LSCCs to the other galagid species. Left-right differences between angular values measured within each ipsilateral pair of SCCs tended to be much higher and much more variable within the three lorisid species and O. crassicaudatus than in G. moholi and P. granti. In other words, N. coucang, P. edwardsi, L. tardigradus and O. crassicaudatus show higher levels of angular asymmetry than G. moholi and P. granti.
3.1.2. SCC Size and Common Crus Length
For all species except P. granti, the LSCC was the most variable canal in terms of CS. There was a global trend towards higher levels of CS variance for the three SCCs in lorisids than in galagids (see Table 2). Among galagids, P. granti expressed the highest centroid size variation levels. For the common crus length, mean values were higher in slow taxa than in fast taxa. Moreover, among the six species, N. coucang and P. edwardsi expressed CCL variance levels at least six times higher than in the other four species (L. tardigradus included). There was also a trend towards higher levels of CS asymmetry between left and right SCCs in lorisid species and O. crassicaudatus than in P. granti and G. moholi, particularly for the ASCC. No such trend was observed for CCL asymmetry.
3.2. Semicircular Canal Shape Variation
3.2.1. Interspecific Patterns of Shape Variation Revealed by PCA
The SCC systems of the Galagidae and Lorisidae species were clearly separated in shape space (see Figure 3). Differentiation occurred mainly along the first axis (PC1), which accounted for 58.6% of the total variation. Patterns of shape variation along the PC1 axis showed (in accordance with [10,12,89]) that lorisids have relatively small LSCCs, whereas those of the faster galagids are relatively larger. Specimens of O. crassicaudatus showed intermediate projection values along PC1. Within lorisids, the three species projected onto similar scores within the PC1-PC2 space but could be discriminated from one another along subsequent PC axes. The projection scores for each species were related to the amount of SCC shape variance.
The scores of P. edwardsi were the most widespread in the PC1-PC2 space; those of O. crassicaudatus, N. coucang and L. tardigradus were intermediate; and those of the most active/fast species (P. granti and G. moholi) occupied a much narrower area. Perodicticus edwardsi, L. tardigradus and N. coucang exhibited twice as much or more SCC shape variance (SV) than O. crassicaudatus, P. granti and G. moholi (Table 3). This was also true when each SCC was considered separately. It is noteworthy that P. edwardsi exhibited the highest SV both for the three SCCs considered together and for each SCC considered separately. SV levels were significantly higher in all three lorisid species than in the three galagid species (see Table S2), and usually higher when each SCC was considered separately, with one exception: the difference in SV level between N. coucang on one hand, and P. granti and O. crassicaudatus on the other, was not significant for the LSCC.
3.2.2. Intraspecific Patterns of Shape Variation
Species-specific patterns of shape variation are shown in Figure 4. While each species displayed, to some extent, unique patterns of shape variation, some general trends were observed. Most species showed high shape variation in the posterior part of the LSCC. Among galagids, only O. crassicaudatus showed strong variation in the orientation and size of the LSCC. Variation in shape, relative size and orientation were observed in all three SCCs within L. tardigradus and P. edwardsi, and, to a lesser extent, within N. coucang.
3.3. Semicircular Canal System FA Levels
3.3.1. Asymmetry Scores and FA10 Levels
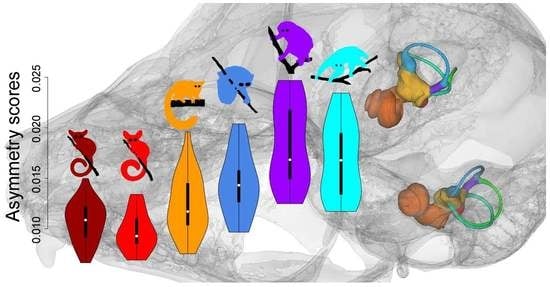
Asymmetry scores and semicircular canal FA10 levels tended to be lower in fast-moving species than in slow-moving species (see Figure 5 and Table 3). The mean value of the ratio of FA10 and SV for the lorisid species ranged from 0.14 in L. tardigradus to 0.25 in N. coucang. Specimens of O. crassicaudatus had asymmetry scores intermediate between those of the slowest- and fastest-moving species and their SCC FA10 level was intermediate between those of P. granti and G. moholi, on one hand, and those of the three lorisid species, on the other (see Figure 5, Table 3 and Table S2). Each lorisid species showed 1.3 to 3.8 times higher SCC FA10 than each galagid species (see Table 3). Among slow-moving species, L. tardigradus expressed the lowest asymmetry scores, with ranges close to those observed in O. crassicaudatus (see Figure 5). Furthermore, the L. tardigradus SCC FA10 level was 1.3 times higher than that of O. crassicaudatus, but this difference was not significant (see Table S2). When the three SCCs were considered separately, the same trend was observed: galagids tended to show less FA10 for each SCC than lorisids. Among the six species, P. granti and G. moholi tended to have the lowest SCC FA10 scores; Otolemur crassicaudatus and L. tardigradus were intermediate; and P. edwardsi and N. coucang tended to express the highest SCC FA10 scores (see Table 3 and Table S2). One exception worth noting is that the LSCC FA10 in L. tardigradus was the highest of all species studied.
3.3.2. Shared Patterns of FA Shape Variation
Patterns of FA variance shared by the six species are presented in Figure 6. PC1 described asymmetrical bending of the posterior part of the LSCC and of the superior portion of the ASCC, and asymmetry in the relative size of the PSCC. Variation along PC2 mainly described asymmetrical torsion of the anterior portion of the ASCC, and variation in the relative size and orientation of the LSCC. The projection scores for each species were related to the amount of asymmetrical shape variance. The scores of the three lorisid species were more widespread than those of the three galagid species in PC1-PC2 FA space. Among lorisids, N. coucang exhibited the most widespread PC1-PC2 FA scores, followed by P. edwardsi. Loris tardigradus and O. crassicaudatus had similar projection scores, and P. granti and G. moholi, the lowest.
3.3.3. Intraspecific Patterns of FA Shape Variation
Species-specific patterns of asymmetrical shape variation are shown in Figure 7. Semicircular canal asymmetry patterns almost exclusively affected the LSCC in P. granti and G. moholi. Otolemur crassicaudatus also showed asymmetrical patterns for the LSCC (mostly differences in its relative orientation and deviation from planarity), as well as the ASCC (asymmetrical torsion of its superior part, and asymmetrical variation in orientation). All species showed asymmetrical patterns affecting the posterior portion of the LSCC. The asymmetry patterns of the three lorisid species also affected the torsion, relative size and relative orientation of the ASCC, as well as the shape and relative size of the PSCC. In each species, the permutation procedures associated with the 2-block PLS analysis showed that the correlation between the symmetrical and asymmetrical components of SCC shape variation was not significant.
4. Discussion
The idealised vertebrate SCC system, in order to detect movements in three-dimensional space efficiently, follows the following interconnected rules [28]: (i) the left and right SCC systems are symmetrical; (ii) the three synergistic pairs of canals are coplanar and work in a push-pull fashion (when one is activated, the other one is inhibited); and (iii) all ipsilateral pairs of canals are orthogonal. A fourth implicit rule of this canonical model is that (iv) all canals are circular and planar. While increasing evidence of deviation from this idealised model has been documented (see [90] for a review), most of the investigative efforts that link vestibular morphology to locomotor behaviours within vertebrates have focused on SCC dimensions (mean radius of curvature R of all three SCCs) relative to body mass (for a review, see [11]). Only recently has the general validity of the canonical model been questioned, and the functional implications of deviations from this idealised representation explored [15,16,26,27,30]. Furthermore, mammalian species showing high levels of intraspecific vestibular morphological plasticity tend to have slow locomotor behaviours [29,31,32]. Only a handful of studies have investigated the first rule of the canonical model (i.e., symmetry) in mammals [16,32,34,35]. To our knowledge, within vertebrates, only two studies have used the theoretical and methodological concepts dedicated to investigating the SCC system symmetry [91,92]. Here, we investigated the intraspecific variation and symmetry of the 3D semicircular canal morphology among six species of lorisiform primates.
4.1. Interspecific and Intraspecific Semicircular Canal Morphological Variation
Semicircular canal morphologies of the “slow” lorisids and “fast” galagids are clearly differentiated in shape space. As tempting as it is to link these shape differences to variation in locomotor behaviours and/or agility, such morphological differences might also largely be explained by phylogeny [93,94,95,96,97,98].
Investigating levels of intraspecific variation of the SCC system is another approach that has recently been applied to mammalian and primate species: significantly higher levels of vestibular shape variation have been reported in slow-moving than in fast-moving species [29,31,32]. Likewise, in the present study, we report SCC shape variance levels in G. moholi, P. granti (agility score = 6) and O. crassicaudatus (agility score = 4) about half as much as those of the three slower lorisid species of our sample, L. tardigradus, P. edwardsi and N. coucang (agility score = 2). Our results further support the hypothesis that there is a correlation between SCC intraspecific variance and agility.
As stated in the introduction, our sample contains a few Nycticebus specimens for which the species attribution is uncertain. Accordingly, the variability measures (regarding the size of the SCCs, the angles and shape) that we provided for N. coucang may be overestimated and, to some extent, reflect interspecific differences. Using intraspecific SCC variability measurements as a proxy for agility may thus be sensitive to species misclassification. Measures of SCC CS variance, angular variance and shape variance reported for N. coucang, however, are very similar to those of P. edwardsi, and often smaller, implying either that our Nycticebus sample is not heterogeneous in terms of species composition, or that SCC morphological differentiation in different species of Nycticebus (excluding the pygmy slow loris) is negligible.
4.2. Orthogonality and Angular Variance
Two studies [16,27] have reported strongly negative correlations between SCC deviation from orthogonality and agility, sensu lato (measured in these works by a metrics called 90var, the variance from 90° among all ipsilateral canal pairs). However, we found no trend towards higher deviations from orthogonality in ipsilateral canal pairs in slow-moving taxa. The two slowest species (N. coucang and P. edwardsi) we investigated exhibited an average deviation from 90° of 1.9° and 1.4°, respectively, while the two fastest taxa, G. moholi and P. granti, had a mean deviation from 90° of 3.7° and 2.8°, respectively. Our results are in accordance with previously published claims [15,29,30] that deviation from orthogonality is not a good proxy for estimating the sensitivity of the SCC system, and thus agility. Currently, existing evidence suggests that among primates, and possibly in all mammals, a fair tolerance regarding deviation from orthogonality between SCC pairs is the general rule.
We report that intraspecific angular variation of ipsilateral pairs of canals is lower in fast-moving species, and especially in G. moholi and P. granti. Our results thus support the hypothesis that species that perform rapid postural adjustments need SCC systems with low levels of angular variation rather than perfect orthogonality between pairs of SCCs.
4.3. Coplanarity of Synergistic Canal Pairs
In their phylogenetically controlled analysis involving a large number of species, Berlin et al. [16] found no evidence of a relationship between estimated “vestibular sensitivity” (“sensitivity mean”, developed by [99], is computed using the radii of curvature of the six SCCs, and is strongly correlated with R, and hence with body mass) and coplanarity of synergistic pairs of SCCs. However, the authors did not take into account body mass variation in their sample, and we suspect they might have tested a correlation between coplanarity and a proxy that relates more to body mass than to agility or locomotion. In the present study, and in opposition to Berlin et al. [16], we found that synergistic canal pairs tend to deviate, on average, around twice as much from coplanarity in slow-moving than in fast-moving species. In addition, we detected up to 10 times higher levels of intraspecific variance in deviation from coplanarity when comparing slow-moving and fast-moving taxa. Among the three synergistic pairs of SCCs, the variance in the deviation from coplanarity between the two lateral canals is greater than that between contralateral anterior and posterior canals. High amounts of deviation from coplanarity between right and left lateral canals have been interpreted by Berlin et al. [16] as an indication that the lateral canal is an imprecise indicator of habitual head orientation (resting or active). However, our results suggest that high amounts of variation in deviation from coplanarity are probably better related to a lower demand for rapid postural adjustments.
The second rule of the idealised SCC canonical model states that for functionally optimal SCC systems, the three synergistic canal pairs should be coplanar, and that they work in a push-pull fashion [28,100]. Our results suggest that to remain optimally efficient, the SCC system of fast-moving primate species (and hence possibly of other mammals) should deviate as little as possible from coplanarity. Basically, our results support the hypothesis that deviation from perfect coplanarity of synergistic pairs of canals results in a much greater loss of SCC sensitivity than deviation from perfect orthogonality between ipsilateral pairs of canals.
4.4. Semicircular Canal Phenotypic Variation and Canalisation Mechanisms
Our results strengthen support for the hypothesis that in fast-moving species, higher selective pressures are applied to SCC morphology to maintain optimal sensitivity [29,31,32]. It is tempting to suggest that at least a fraction of SCC phenotypic variation levels observed in our set of species is due to canalisation mechanisms. Phenotypic variance levels, when measured in environmentally controlled and genetically controlled conditions (ideally in different genetically well-known populations belonging to the same species), are often used as an index of canalisation [101,102,103]. The design of our study does not meet such requirements. However, given the unequivocal differences in SCC phenotypic variation levels observed between slow-moving and fast-moving species, our results give support to the hypothesis that SCC morphology is less canalised in slow-moving primates.
4.5. Semicircular Canal Symmetry
Investigating symmetry/asymmetry levels of SCC structures (shape, SCC size, and angle between SCCs) is the most original aspect of our work, and is fully complementary to the results discussed above. Semicircular canal radius asymmetry and angle asymmetry levels (differences between left ear and right ear angles measured for each ipsilateral SCC pair) have been reported at the interspecific [16,34] and intraspecific [32,35] levels: in particular, low correlations between SCC angular asymmetry and estimated SCC sensitivity or agility levels have been found within a broad sample of mammalian species [32,34]. In this study, we analysed the angular symmetry as well as the SCC shape variation, quantifying interspecific, intraspecific and individual symmetry. Such decomposition of symmetry patterns, and in particular the use of fluctuating asymmetry, is innovative in the context of a functional evaluation of SCC morphology. Our results show that asymmetry clearly carries a signal correlated with agility: more agile (fast-moving) species have more symmetrical SCC systems than less agile (slow-moving) taxa. Species with intermediate agility scores (e.g., O. crassicaudatus) also present intermediate values of symmetry. In lorisids, N. coucang and P. edwardsi have low agility scores and are highly asymmetrical for most traits (angle between SCCs, SCC size and shape), while SCC asymmetry levels in L. tardigradus tend to be lower. Significantly, L. tardigradus express around a quarter of their locomotor activity as rapid quadrupedal walking [70], indicating that their locomotor capabilities may be different from those of N. coucang and P. edwardsi. Important differences in foraging behaviours exist among these three species. Nycticebus spp. are specialised exudate feeders. While pottos are more frugivorous than slow lorises, they also feed on tree exudates, although they do not engage in tree-gouging like slow lorises, feeding on natural tree wounds instead. Exudate feeding leads to spending long periods of time clinging to vertical tree trunks. On the other hand, L. tardigradus does not feed on tree exudates and is mainly insectivorous [104]. Hence, the low agility score (2) given to L. tardigradus by Spoor et al. [11] might be an underestimate, and a value closer to that given to O. crassicaudatus (4) may be more accurate.
Loris tardigradus had intermediate scores for SCC asymmetry: significantly higher than those of G. moholi and P. granti; similar to or slightly higher than those of O. crassicaudatus; and lower than those of N. coucang and P. potto, indicating, in accordance with field observations of locomotor modes, that asymmetry levels (particularly FA) constitute better proxies than intraspecific variation as estimates of agility. In our lorisid sample, N. coucang and P. edwardsi were the species with the lowest agility and also showed the highest asymmetry. However, N. coucang is the least variable lorisid regarding SCC system shape (even though we may have a slightly heterogeneous assemblage of taxa), making it clear in this instance that asymmetry is a more accurate indicator of agility than intraspecific variation. Furthermore, asymmetry levels are likely to be weakly affected by taxonomic errors in samples that contain cryptic species sharing the same type of locomotion, as for the larger Nycticebus species. FA levels computed for heterogeneous samples of closely related species with a common locomotor repertoire will not differ much from more homogenous samples, so that FA levels are less likely to yield erroneous agility estimates than intraspecific shape variance scores. Our results suggest that deviation from perfect symmetry between left and right SCC systems has a major negative impact on SCC sensitivity.
4.6. Canalisation and Developmental Stability
Two processes are classically identified in the reduction of variation: developmental stability and canalisation [105]. Developmental stability buffers random variations that may occur during development, often under stress. Canalisation indicates robustness to environmental changes and mutations, reducing inter-individual variation within species [106]. If FA can be considered as a measure of developmental stability (low FA level indicating higher stability), phenotypic variation is a measure of canalisation (low phenotypic variation means high canalisation) [101,102]. These processes can act together or in opposition.
Many attempts have been made to infer whether the same underlying developmental processes contribute to developmental stability and canalisation by investigating the correlation between FA variation and inter-individual variation patterns (for a review, see [36]). Several studies have reported a significant correlation (e.g., [107,108,109,110]) while others have rejected such correlation (e.g., [103,111]). In most cases in our sample, species with the highest levels of intraspecific SCC variation also expressed the highest level of FA. Furthermore, some of the SCC shape and FA variation patterns shared similarities. In galagids, FA and SV variation mainly occurred along the posterior part of the LSCC. In lorisids, similar FA and SV variation patterns were observed in the orientation and relative size of the anterior and posterior positions of the LSCC, as well as along the other two canals. However, in each species, FA and phenotypic variation were not significantly correlated; but this lack of correlation is insufficient to ascertain the independence of the underlying mechanisms responsible for canalisation and developmental stability. Canalisation may account for only a fraction of the observed levels of SCC SV, or intraspecific SCC variation may have other causes (such as environment, genetics), which obscure the canalisation signal. Hence, based on our results, we cannot rule out the possibility of the existence of shared mechanisms responsible for intra- and inter-individual variances. In 2005, Willmore et al. [112] analysed the correlation between FA and phenotypic variation in the cranial morphology of rhesus macaques (Macaca mulatta) and found them to be congruent. They interpreted this congruence as an overlap of the perturbations and buffering mechanisms for intra-and inter-individual variances. From our results, it is not possible to gain a clear and testable interpretation of the processes responsible for SCC variation, but we can speculate that, in our case, perturbations and buffering mechanisms seem to overlap for intra-individual and intra-specific variations, explaining the shared patterns of FA and SV variation.
Our study design does not permit us to demonstrate the existence of shared developmental mechanisms that minimise inter- and intra-individual SCC shape variances. However, the reduced SCC shape and FA variations in fast-moving species compared with slow-moving ones imply that selective pressures act to maintain a high degree of intra- and inter-individual SCC stability in fast-moving species.
4.7. Heritability
Another question relevant to our results is the heritability of asymmetry. Available evidence based on quantitative genetic analyses, traditional linear measurements or geometric morphometrics suggests that the heritability of FA is very low [113,114,115]. Whatever the method used or the system analysed, the heritability of FA does not reach more than 1%. Other authors [116] have qualified these results with respect to size and shape variation in Drosophila melanogaster wings and explained that if the heritability of FA is low, the heritability of developmental instability can reach 20%. A meta-analysis of individual fluctuating asymmetry in morphological characters also supported the heritability of developmental stability [117]; the authors concluded that additive genetic variance of developmental instability exists and that FA contributes to this variance. The heritability of developmental stability was tested again in Drosophila melanogaster, which presents a high level of FA when the Cyclin G gene is overexpressed [106]. Our study design does not allow this level of analysis. The estimation of heritability of developmental stability is possible under experimental (controlled) conditions, but much more difficult when working with individuals from natural populations of different species. Moreover, most studies focusing on the heritability of developmental stability were conducted over a short period of time on animals with short intergenerational times; two essential conditions for an experimental study to be feasible.
Nevertheless, our study indicated that selection acts to maintain a high degree of developmental stability in fast-moving lorisiform species. Our observations reflect the results of natural selection that has acted over tens of millions of years on animals with intergenerational times much longer than those of fruit flies. As we could not control for environmental effects, these will have been added to uncontrolled genetic effects [105]. Therefore, we propose that observed differences in FA levels between slow-moving and fast-moving lorisiform species reflect the cumulative effects of differential selective pressures applied to the SCC system over long periods of geological time.
5. Conclusions
Our results suggest that slight deviations from the first (symmetry) and second (coplanarity between synergistic pairs of SCCs) rules of Graf’s canonical model of the vertebrate SCC system result in a significant loss of SCC sensitivity. Furthermore, the evidence presented here suggests that the symmetry level between the left and right SCC systems is a promising proxy for agility. Should the generality of our findings be confirmed, palaeontologists would possess a powerful means of inferring locomotor behaviour in extinct species for which several specimens exist with both bony labyrinths preserved.
Additionally, a fair tolerance for deviation from the third rule (i.e., orthogonality) seems to be true in Primates, and possibly in all mammals. Higher levels of selection seem to act to maintain SCC morphological stability in fast-moving species than in slow-moving species. Such selective pressures would mostly affect the developmental mechanisms that act prenatally, during the formation of the SCC system, when the petrosal bones are not yet fully ossified. In our study, we analysed fully formed bony labyrinths of specimens, the vast majority of which were adult individuals. Our results urge further investigation of the morphology, position and orientation of left and right SCC systems during prenatal and postnatal development.
5.1. Prenatal Developmental Timing of the Semicircular Canal System
Variations in levels of FA could also result from differences in the length and timing of vestibular development. It is difficult to estimate this other than by comparing gestation periods. Gestation is approximately 130 days in G. moholi, unknown in P. granti, 126–135 days in O. crassicaudatus, but longer in N. coucang (185-197 days), L. tardigradus (165–175 days) and P. edwardsi (193–205 days) [58]. In these species, little is known about the time required from birth for the offspring to become independent in terms of locomotion. Would shorter vestibular development be correlated with earlier independence? Our results indicate that species with shorter gestation lengths (r-selected species, i.e., galagos) have lower levels of FA; lorisids are highly K-selected. We can thus hypothesise a difference in the timing of morphogenesis of the vestibular system, considering that if the vestibular systems develop faster in species with shorter gestation, they become functional earlier, and are less subject to variation than those of species with longer gestation periods.
5.2. Postnatal Relative Position and Orientation of Labyrinths
The mammalian bony labyrinth is known to reach its adult size and shape as soon as, or soon after, the ossification of the otic capsule [118,119,120,121,122]. However, the relative orientation of the left and right SCCs changes during ontogeny [123,124], at least in Homo sapiens, as the relative position and orientation of the two petrosal bones change along with the development of the rest of the basicranial region. We found that in slow-moving species, a trend exists towards higher levels of angular variation between synergistic pairs of SCCs. While higher intraspecific levels of morphological variation of the SCCs may explain the largest part of this greater intraspecific variation of the angles observed in synergistic pairs of canals, we cannot exclude the notion that a part of this variation is due to deviation from optimality of the relative left and right bony labyrinth positions and orientations across the midsagittal plane. The optimal relative position is indeed reached if the left bony labyrinth is positioned as a mirror image of the right one through the midsagittal plane, and the two SCC systems are orientated such that deviation from coplanarity between pairs of synergistic pairs of SCCs is minimised.
Supplementary Materials
The following are available online at https://0-www-mdpi-com.brum.beds.ac.uk/article/10.3390/sym13122305/s1, Table S1: Specimen list. Table S2: Tests for difference significance in semicircular canal shape variance (SV), semicircular canal FA10 levels, LSCC SV, LSCC FA10, ASCC SV, ASCC FA10, PSCC SV, PSCC FA10 in all pairs of species (1000 times resampling procedure each time).
Author Contributions
Conceptualization, R.L. and S.C.; methodology, R.L. and S.C.; µCT data acquisition: A.P., R.L. and S.C.; semi-landmark digitization, A.P. and R.L.; formal analysis, R.L. and S.C.; data curation, R.L., A.P. and S.C.; writing—original draft preparation, R.L. and S.C.; writing—review and editing, R.L., A.P., J.M., L.M. and S.C.; visualization, R.L. and S.C.; funding acquisition, J.M., L.M. and S.C. All authors have read and agreed to the published version of the manuscript.
Funding
This research was supported by the National Research Foundation of South Africa (Grant UID 92541), by the French ANR-ERC PALASIAFRICA Program (ANR-08-JCJC-0017), by the CNRS via the NAP4 PEPS Program, and by the ISEM.
Institutional Review Board Statement
The subjects of this study were museum-based specimens. No live animals were killed or manipulated during the course of this study. A.P. applied for and was granted clearance for his research by the University of Fort Hare Ethical Clearance Committee.
Informed Consent Statement
Not applicable.
Data Availability Statement
The analysed semilandmark dataset is available upon request.
Acknowledgments
We thank Aurélie Verguin and Jacques Cuisin (Muséum national d’Histoire naturelle [MNHN], Paris), Robert Asher (University of Cambridge), Christopher Zollikofer and Marcia Ponce de León (Anthropological Institute and Museum, Zürich), Peter Giere (Museum für Naturkunde, Berlin). We are grateful to Teresa Kearney from the Ditsong National Museum of Natural History, Pretoria, South Africa and to Tsitsi Maponga from the Natural History Museum of Zimbabwe in Bulawayo for access to their collections. We are also grateful to the staff of beamlines ID19 and ID17 of the European Synchrotron Radiation Facility ([ESRF], Grenoble) and especially to Paul Tafforeau, and to the personnel of the Radiography and Tomography group (RADTOM) located at NECSA in Pelindaba, South Africa, for the use of the MIXRAD facility, particularly Jakobus Hoffman and Lunga Bam. The authors thank Duke University for free access and data sharing via Morphosource. Finally, we acknowledge the MRI platform for access to µCT facilities, member of the national infrastructure France-BioImaging supported by the Agence Nationale de la Recherche (ANR-10-INBS-04, «Investissements d’Avenir »), the labex CEMEB (ANR-10-LABX-0004) and NUMEV (ANR-10-LABX-0020). We thank Rémi Laffont, Lauriane Poloni, Emilie Steimetz and the MorphOptics facility of the GISMO analytic Platform. Finally, we thank Julien Claude, Vincent Debat and Anne Le Maître for their feedback regarding methodological questions. This is ISEM publication n° 2021-305.
Conflicts of Interest
The authors declare no conflict of interest.
References
- Goodrich, E.S. Studies on the Structure and Development of Vertebrates; Macmillan: London, UK, 1930; ISBN 0-226-30354-3. [Google Scholar]
- Welgampola, M.S.; Colebatch, J.G. Vestibulocollic Reflexes: Normal Values and the Effect of Age. Clin. Neurophysiol. 2001, 112, 1971–1979. [Google Scholar] [CrossRef]
- Goldberg, J.M.; Cullen, K.E. Vestibular Control of the Head: Possible Functions of the Vestibulocollic Reflex. Exp. Brain Res. 2011, 210, 331–345. [Google Scholar] [CrossRef] [Green Version]
- Bar-Oz, G.; Dayan, T. FOCUS: On the Use of the Petrous Bone for Estimating Cranial Abundance in Fossil Assemblages. J. Archaeol. Sci. 2007, 34, 1356–1360. [Google Scholar] [CrossRef]
- Zonneveld, F.; Spoor, C.F.; Wind, J. The Use of CT in the Study of the Internal Morphology of Hominid Fossils. Medicamundi 1989, 34, 117–128. [Google Scholar]
- Spoor, C.F. The Comparative Morphology and Phylogeny of the Human Bony Labyrinth. Ph.D. Dissertation, Utrecht University, Utrecht, The Netherlands, 1993. [Google Scholar]
- Spoor, C.F.; Wood, B.; Zonneveld, F. Implications of Early Hominid Labyrinthine Morphology for Evolution of Human Bipedal Locomotion. Nature 1994, 369, 645–648. [Google Scholar] [CrossRef]
- Spoor, C.F.; Wood, B.; Zonneveld, F. Evidence for a Link between Human Semicircular Canal Size and Bipedal Behaviour. J. Hum. Evol. 1996, 30, 183–187. [Google Scholar] [CrossRef]
- Spoor, C.F.; Zonneveld, F. Morphometry of the Primate Bony Labyrinth: A New Method Based on High-Resolution Computed Tomography. J. Anat. 1995, 186, 271–286. [Google Scholar]
- Spoor, F.; Zonneveld, F. Comparative Review of the Human Bony Labyrinth. Am. J. Phys. Anthropol. 1998, 107, 211–251. [Google Scholar] [CrossRef]
- Spoor, F.; Garland, T.; Krovitz, G.; Ryan, T.M.; Silcox, M.T.; Walker, A. The Primate Semicircular Canal System and Locomotion. Proc. Natl. Acad. Sci. USA 2007, 104, 10808–10812. [Google Scholar] [CrossRef] [Green Version]
- Walker, A.; Ryan, T.M.; Silcox, M.T.; Simons, E.L.; Spoor, F. The Semicircular Canal System and Locomotion: The Case of Extinct Lemuroids and Lorisoids. Evol. Anthropol. Issues News Rev. 2008, 17, 135–145. [Google Scholar] [CrossRef]
- Silcox, M.T.; Bloch, J.I.; Boyer, D.M.; Godinot, M.; Ryan, T.M.; Spoor, F.; Walker, A. Semicircular Canal System in Early Primates. J. Hum. Evol. 2009, 56, 315–327. [Google Scholar] [CrossRef]
- Ryan, T.M.; Silcox, M.T.; Walker, A.; Mao, X.; Begun, D.R.; Benefit, B.R.; Gingerich, P.D.; Köhler, M.; Kordos, L.; McCrossin, M.L.; et al. Evolution of Locomotion in Anthropoidea: The Semicircular Canal Evidence. Proc. R. Soc. B Biol. Sci. 2012, 279, 3467–3475. [Google Scholar] [CrossRef] [Green Version]
- Bernardi, M.; Couette, S. Eocene Paleoecology of Adapis parisiensis (Primate, Adapidae): From Inner Ear to Lifestyle. Anat. Rec. 2017, 300, 1576–1588. [Google Scholar] [CrossRef] [Green Version]
- Berlin, J.C.; Kirk, E.C.; Rowe, T.B. Functional Implications of Ubiquitous Semicircular Canal Non-Orthogonality in Mammals. PLoS ONE 2013, 8, e79585. [Google Scholar] [CrossRef] [PubMed] [Green Version]
- Spoor, F.; Bajpai, S.; Hussain, S.T.; Kumar, K.; Thewissen, J.G.M. Vestibular Evidence for the Evolution of Aquatic Behaviour in Early Cetaceans. Nature 2002, 417, 163–166. [Google Scholar] [CrossRef]
- Orliac, M.J.; Benoit, J.; O’Leary, M.A. The Inner Ear of Diacodexis, the Oldest Artiodactyl Mammal. J. Anat. 2012, 221, 417–426. [Google Scholar] [CrossRef]
- Alloing-Séguier, L.; Sánchez-Villagra, M.R.; Lee, M.S.Y.; Lebrun, R. The Bony Labyrinth in Diprotodontian Marsupial Mammals: Diversity in Extant and Extinct Forms and Relationships with Size and Phylogeny. J. Mamm. Evol. 2013, 20, 191–198. [Google Scholar] [CrossRef]
- Ravel, A.; Orliac, M.J. The Inner Ear Morphology of the ‘Condylarthran’ Hyopsodus lepidus. Hist. Biol. 2015, 27, 957–969. [Google Scholar] [CrossRef]
- Pfaff, C.; Martin, T.; Ruf, I. Bony Labyrinth Morphometry Indicates Locomotor Adaptations in the Squirrel-Related Clade (Rodentia, Mammalia). Proc. R. Soc. B Biol. Sci. 2015, 282, 20150744. [Google Scholar] [CrossRef] [Green Version]
- Grohé, C.; Tseng, Z.J.; Lebrun, R.; Boistel, R.; Flynn, J.J. Bony Labyrinth Shape Variation in Extant Carnivora: A Case Study of Musteloidea. J. Anat. 2016, 228, 366–383. [Google Scholar] [CrossRef] [Green Version]
- Pfaff, C.; Czerny, S.; Nagel, D.; Kriwet, J. Functional Morphological Adaptations of the Bony Labyrinth in Marsupials (Mammalia, Theria). J. Morphol. 2017, 278, 742–749. [Google Scholar] [CrossRef] [PubMed]
- Hullar, T.E.; Williams, C.D. Geometry of the Semicircular Canals of the Chinchilla (Chinchilla laniger). Hear. Res. 2006, 213, 17–24. [Google Scholar] [CrossRef] [PubMed] [Green Version]
- Calabrese, D.R.; Hullar, T.E. Planar Relationships of the Semicircular Canals in Two Strains of Mice. J. Assoc. Res. Otolaryngol. 2006, 7, 151–159. [Google Scholar] [CrossRef] [PubMed] [Green Version]
- Cox, P.G.; Jeffery, N. Semicircular Canals and Agility: The Influence of Size and Shape Measures. J. Anat. 2010, 216, 37–47. [Google Scholar] [CrossRef] [PubMed]
- Malinzak, M.D.; Kay, R.F.; Hullar, T.E. Locomotor Head Movements and Semicircular Canal Morphology in Primates. Proc. Natl. Acad. Sci. USA 2012, 109, 17914–17919. [Google Scholar] [CrossRef] [PubMed] [Green Version]
- Graf, W. Motion Detection in Physical Space and Its Peripheral and Central Representation. Ann. N. Y. Acad. Sci. 1988, 545, 154–169. [Google Scholar] [CrossRef]
- Perier, A.; Lebrun, R.; Marivaux, L. Different Level of Intraspecific Variation of the Bony Labyrinth Morphology in Slow- versus Fast-Moving Primates. J. Mamm. Evol. 2016, 23, 353–368. [Google Scholar] [CrossRef]
- Bhagat, R.; Bertrand, O.; Silcox, M.T. Evolution of Arboreality and Fossoriality in Squirrels and Aplodontid Rodents: Insights from the Semicircular Canals of Fossil Rodents. J. Anat. 2020, 238, 96–112. [Google Scholar] [CrossRef]
- Billet, G.; Hautier, L.; Asher, R.J.; Schwarz, C.; Crumpton, N.; Martin, T.; Ruf, I. High Morphological Variation of Vestibular System Accompanies Slow and Infrequent Locomotion in Three-Toed Sloths. Proc. R. Soc. B Biol. Sci. 2012, 279, 3932–3939. [Google Scholar] [CrossRef] [PubMed]
- Gonzales, L.A.; Malinzak, M.D.; Kay, R.F. Intraspecific Variation in Semicircular Canal Morphology—A Missing Element in Adaptive Scenarios? Am. J. Phys. Anthropol. 2019, 168, 10–24. [Google Scholar] [CrossRef] [Green Version]
- Waddington, C.H. Canalization of Development and the Inheritance of Acquired Characters. Nature 1942, 150, 563–565. [Google Scholar] [CrossRef]
- Rodgers, J.C. Comparative Morphology of the Vestibular Semicircular Canals in Therian Mammals. Ph.D. Thesis, The University of Texas at Austin, Austin, TX, USA, 2011. [Google Scholar]
- Welker, K.L.; Orkin, J.D.; Ryan, T.M. Analysis of Intraindividual and Intraspecific Variation in Semicircular Canal Dimensions Using High-Resolution x-Ray Computed Tomography. J. Anat. 2009, 215, 444–451. [Google Scholar] [CrossRef] [PubMed]
- Klingenberg, C.P. Analyzing Fluctuating Asymmetry with Geometric Morphometrics: Concepts, Methods, and Applications. Symmetry 2015, 7, 843–934. [Google Scholar] [CrossRef] [Green Version]
- Van Valen, L. A Study of Fluctuating Asymmetry. Evolution 1962, 16, 125–142. [Google Scholar] [CrossRef]
- Debat, V.; Peronnet, F. Asymmetric Flies: The Control of Developmental Noise in Drosophila. Fly (Austin) 2013, 7, 70–77. [Google Scholar] [CrossRef] [Green Version]
- Parsons, P.A. Fluctuating Asymmetry: A Biological Monitor of Environmental and Genomic Stress. Heredity 1992, 68, 361–364. [Google Scholar] [CrossRef] [PubMed] [Green Version]
- Clarke, G.M. Fluctuating Asymmetry: A Technique for Measuring Developmental Stress of Genetic and Environmental Origin. Acta Zool. Fenn. 1992, 191, 31–35. [Google Scholar]
- Møller, A.P. Female Swallow Preference for Symmetrical Male Sexual Ornaments. Nature 1992, 357, 238–240. [Google Scholar] [CrossRef]
- Møller, A.P. Fluctuating Asymmetry in Male Sexual Ornaments May Reliably Reveal Male Quality. Anim. Behav. 1990, 40, 1185–1187. [Google Scholar] [CrossRef]
- Clarke, G.M. Developmental Stability and Fitness: The Evidence Is Not Quite so Clear. Am. Nat. 1998, 152, 762–766. [Google Scholar] [CrossRef]
- David, P. Heterozygosity–Fitness Correlations: New Perspectives on Old Problems. Heredity 1998, 80, 531–537. [Google Scholar] [CrossRef] [PubMed]
- Crespi, B.J.; Vanderkist, B.A. Fluctuating Asymmetry in Vestigial and Functional Traits of a Haplodiploid Insect. Heredity 1997, 79, 624–630. [Google Scholar] [CrossRef]
- Garnier, S.; Gidaszewski, N.; Charlot, M.; Rasplus, J.-Y.; Alibert, P. Hybridization, Developmental Stability, and Functionality of Morphological Traits in the Ground Beetle Carabus solieri (Coleoptera, Carabidae). Biol. J. Linn. Soc. 2006, 89, 151–158. [Google Scholar] [CrossRef] [Green Version]
- Ashton, E.H.; Oxnard, C.E. Locomotor Patterns in Primates. Proc. Zool. Soc. Lond. 1964, 142, 1–28. [Google Scholar] [CrossRef]
- Napier, J.R.; Napier, P.H. A Handbook of Living Primates.; Academic Press: London, UK, 1967. [Google Scholar]
- Martin, R.D. Primate Origins and Evolution. A Phylogenetic Reconstruction; Chapman and Hall: London, UK, 1990; ISBN 0-691-08565-X. [Google Scholar]
- Hunt, K.D.; Cant, J.G.H.; Gebo, D.L.; Rose, M.D.; Walker, S.E.; Youlatos, D. Standardized Descriptions of Primate Locomotor and Postural Modes. Primates 1996, 37, 363–387. [Google Scholar] [CrossRef]
- Boyer, D.M.; Gunnell, G.F.; Kaufman, S.; McGeary, T.M. MorphoSource: Archiving and Sharing 3-D Digital Specimen Data. Paleontol. Soc. Pap. 2016, 22, 157–181. [Google Scholar] [CrossRef]
- Walker, A. Locomotor adaptations in past and present prosimian primates. In Primate Locomotion; Jenkins, F.A., Ed.; Academic Press: New York, NY, USA; London, UK, 1974; pp. 349–382. [Google Scholar]
- Masters, J. Sluggards and drunkards? In Evolution, Ecology and Conservation of Lorises and Pottos; Nekaris, K.A.I., Burrows, A.M., Eds.; Cambridge University Press: Cambridge, UK, 2020; pp. 19–32. ISBN 978-1-108-67652-6. [Google Scholar]
- Chen, J.-H.; Pan, D.; Groves, C.; Wang, Y.-X.; Narushima, E.; Fitch-Snyder, H.; Crow, P.; Thanh, V.N.; Ryder, O.; Zhang, H.-W.; et al. Molecular Phylogeny of Nycticebus Inferred from Mitochondrial Genes. Int. J. Primatol. 2006, 27, 1187–1200. [Google Scholar] [CrossRef]
- Groves, C. Primate Taxonomy; Smithsonian Institution Press: Washington, DC, USA, 2001; ISBN 1-56098-872-X. [Google Scholar]
- Groves, C. Systematics of the genus Nycticebus. In Proceeding of the Third International Congress of Primatology, Zurich 1970, Vol. 1: Taxonomy, Anatomy, Reproduction; Biegert, J., Leutenegger, W., Eds.; Karger: Basel, Switzerland, 1971; Volume 1, pp. 44–53. [Google Scholar]
- Jenkins, P.D. Catalogue of Primates in the British Museum (Natural History) and Elsewhere in the British Isles. Part IV: Suborder Strepsirrhini, Including the Subfossil Madagsacan Lemurs and the Family Tarsiidae.; British Museum: London, UK, 1987. [Google Scholar]
- Mittermeier, R.A.; Rylands, A.B.; Wilson, D.E. Handbook of the Mammals of the World. Volume 3. Primates; Lynx Edicions: Barcelona, Spain, 2013. [Google Scholar]
- Butynski, T.; de Jong, Y. Distribution of the Potto Perodicticus potto (Primates: Lorisidae) in Eastern Africa, with a Description of a New Subspecies from Mount Kenya. J. East Afr. Nat. Hist. 2007, 96, 113–147. [Google Scholar] [CrossRef]
- Oates, J.F. Primates of West Africa: A Field Guide and Natural History; Conservation International: Arlington, Virginia, 2011; ISBN 1-934151-48-3. [Google Scholar]
- Nekaris, K.A.I. Family Lorisidae (angwantibos, pottos and lorises). In Handbook of the Mammals of the World. Volume 3. Primates; Mittermeier, R.A., Rylands, A.B., Wilson, D.E., Eds.; Lynx Edicions: Barcelona, Spain, 2013; pp. 210–235. [Google Scholar]
- Forbes, H.O. A Handbook to the Primates, Vol. I.; Bowdler Sharpe, R., Ed.; Allen’s Naturalist’s Library: London, UK, 1896. [Google Scholar]
- Walker, A. The Locomotion of the Lorises, with Special Reference to the Potto. Afr. J. Ecol. 1969, 7, 1–5. [Google Scholar] [CrossRef]
- Subramoniam, S. Some Observations on the Habits of the Slender Loris, Loris tardigradus (Linnaeus). J. Bombay Nat. Hist. Soc. 1957, 54, 387–398. [Google Scholar]
- Walker, A. Prosimian locomotor behavior. In The Study of Prosimian Behavior; Doyle, G.A., Martin, R.D., Eds.; Academic Press: Cambridge, UK, 1979; pp. 543–565. ISBN 978-0-12-222150-7. [Google Scholar]
- Gamage, S.; Groves, C.; Marikar, F.M.M.T.; Turner, C.; Padmalal, K.U.K.G.; Kotagama, S. The Taxonomy, Distribution, and Conservation Status of the Slender Loris (Primates, Lorisidae: Loris) in Sri Lanka. Primate Conserv. 2017, 31, 83–106. [Google Scholar]
- Oxnard, C.E.; Crompton, R.H.; Lieberman, S.S. Animal Lifestyles and Anatomies: The Case of the Prosimian Primates; University of Washington Press: Washington, DC, USA, 1990; ISBN 0-295-96839-7. [Google Scholar]
- Demes, B.; Jungers, W.L.; Nieschalk, U. Size and speed-related aspects of quadrupedal walking in slender and slow lorises. In Gravity, Posture and Locomotion in Primates; Jouffroy, F.K., Stack, M.H., Niemitz, C., Eds.; Il Sedicesimo: Firenze, Italy, 1990; pp. 175–197. [Google Scholar]
- Nekaris, K.A.I. Activity Budget and Positional Behavior of the Mysore Slender Loris (Loris tardigradus lydekkerianus): Implications for Slow Climbing Locomotion. Folia Primatol. 2001, 72, 228–241. [Google Scholar] [CrossRef] [PubMed]
- Nekaris, K.A.I.; Stevens, N.J. Not All Lorises Are Slow: Rapid Arboreal Locomotion in Loris tardigradus of Southwestern Sri Lanka. Am. J. Primatol. 2007, 69, 113–121. [Google Scholar] [CrossRef]
- Nekaris, K.A.I.; Bearder, S.K. The strepsirrhine primates of Asia and mainland Africa: Diversity shrouded in darkness. In Primates in perspective; Campbell, C., Fuentes, A., MacKinnon, K., Stumpf, R., Eds.; Oxford University Press: Oxford, UK, 2007; pp. 34–54. [Google Scholar]
- Günther, M.M.; Ishida, H.; Kumakura, H.; Nakano, Y. The Jump as a Fast Mode of Locomotion in Arboreal and Terrestrial Biotopes. Z. Für Morphol. Anthropol. 1991, 78, 341–372. [Google Scholar] [CrossRef]
- Crompton, R.H.; Sellers, W.I. A consideration of leaping locomotion as a means of predator avoidance in prosimian primates. In Primate Anti-Predator Strategies; Gursky, S.L., Nekaris, K.A.I., Eds.; Springer: Boston, MA, USA, 2007; pp. 127–145. ISBN 978-0-387-34810-0. [Google Scholar]
- Crompton, R.H.; Sellers, W.I.; Günther, M.M. Energetic Efficiency and Ecology as Selective Factors in the Saltatory Adaptation of Prosimian Primates. Proc. R. Soc. Lond. B Biol. Sci. 1993, 254, 41–45. [Google Scholar] [CrossRef]
- Bearder, S.K. Lorises, bushbabies, and tarsiers: Diverse societies in solitary foragers. In Primate Societies; Smuts, B.B., Cheney, D.L., Seyfarth, R.M., Wrangham, R.W., Eds.; University of Chicago Press: Chicago, IL, USA, 2008; pp. 11–24. ISBN 978-0-226-22046-8. [Google Scholar]
- Génin, F.; Yokwana, A.; Kom, N.; Couette, S.; Dieuleveut, T.; Nash, S.D.; Masters, J.C. A New Galago Species for South Africa (Primates: Strepsirhini: Galagidae). Afr. Zool. 2016, 51, 135–143. [Google Scholar] [CrossRef]
- Masters, J.C.; Génin, F.; Couette, S.; Groves, C.P.; Nash, S.D.; Delpero, M.; Pozzi, L. A New Genus for the Eastern Dwarf Galagos (Primates: Galagidae). Zool. J. Linn. Soc. 2017, 181, 229–241. [Google Scholar] [CrossRef] [Green Version]
- Lösel, P.D.; van de Kamp, T.; Jayme, A.; Ershov, A.; Faragó, T.; Pichler, O.; Tan Jerome, N.; Aadepu, N.; Bremer, S.; Chilingaryan, S.A.; et al. Introducing Biomedisa as an Open-Source Online Platform for Biomedical Image Segmentation. Nat. Commun. 2020, 11, 5577. [Google Scholar] [CrossRef] [PubMed]
- Lebrun, R. MorphoDig, an Open-Source 3D Freeware Dedicated to Biology. In Proceedings of the IPC5 The 5th International Palaeontological Congress, Paris, France, 9–13 July 2018. [Google Scholar]
- Benoit, J.; Legendre, L.J.; Farke, A.A.; Neenan, J.M.; Mennecart, B.; Costeur, L.; Merigeaud, S.; Manger, P.R. A Test of the Lateral Semicircular Canal Correlation to Head Posture, Diet and Other Biological Traits in “Ungulate” Mammals. Sci. Rep. 2020, 10, 1–22. [Google Scholar] [CrossRef]
- Adams, D.; Collyer, M.; Kaliontzopoulou, A.; Baken, E. Geomorph: Software for Geometric Morphometric Analyses, R Package Version 4.0; 2021; Available online: https://cran.r-project.org/web/packages/geomorph/index.html (accessed on 15 November 2021).
- Yezerinac, S.M.; Lougheed, S.C.; Handford, P. Measurement Error and Morphometric Studies: Statistical Power and Observer Experience. Syst. Biol. 1992, 41, 471–482. [Google Scholar] [CrossRef]
- Palmer, A.R. Fluctuating asymmetry analyses: A primer. In Developmental Instability: Its Origins and Evolutionary Implications; Markow, T.A., Ed.; Springer: Dordrecht, The Netherlands, 1994; pp. 335–364. ISBN 978-94-010-4357-1. [Google Scholar]
- R Core Team R: A Language and Environment for Statistical Computing; R Foundation for Statistical Computing: Vienna, Austria, 2021.
- Team RStudio. RStudio: Integrated Development for R. RStudio; PBC: Boston, MA, USA, 2021. [Google Scholar]
- Schlager, S. Chapter 9—Morpho and Rvcg—Shape analysis in R: R-packages for geometric morphometrics, shape analysis and surface manipulations. In Statistical Shape and Deformation Analysis; Zheng, G., Li, S., Székely, G., Eds.; Academic Press: Cambridge, UK, 2017; pp. 217–256. ISBN 978-0-12-810493-4. [Google Scholar]
- Zelditch, M.L.; Swiderski, D.L.; Sheets, H.D.; Fink, W.L. 12—Disparity and variation. In Geometric Morphometrics for Biologists; Zelditch, M.L., Swiderski, D.L., Sheets, H.D., Fink, W.L., Eds.; Academic Press: San Diego, CA, USA, 2004; pp. 293–319. ISBN 978-0-12-778460-1. [Google Scholar]
- Webster, M.; Sheets, H.D. A Practical Introduction to Landmark-Based Geometric Morphometrics. Paleontol. Soc. Pap. 2010, 16, 163–188. [Google Scholar] [CrossRef] [Green Version]
- Matano, S.; Kubo, T.; Günther, M.M. Semicircular Canal Organ in Three Primate Species and Behavioural Correlations. Fortschr Zool 1985, 30, 677–680. [Google Scholar]
- David, R.; Droulez, J.; Allain, R.; Berthoz, A.; Janvier, P.; Bennequin, D. Motion from the Past. A New Method to Infer Vestibular Capacities of Extinct Species. Comptes Rendus Palevol 2010, 9, 397–410. [Google Scholar] [CrossRef]
- Cerio, D.G.; Witmer, L.M. Intraspecific Variation and Symmetry of the Inner-Ear Labyrinth in a Population of Wild Turkeys: Implications for Paleontological Reconstructions. PeerJ 2019, 7, e7355. [Google Scholar] [CrossRef]
- Ward, D.L.; Schroeder, L.; Pomeroy, E.; Roy, J.E.; Buck, L.T.; Stock, J.T.; Martin-Gronert, M.; Ozanne, S.E.; Silcox, M.T.; Viola, T.B. Early Life Malnutrition and Fluctuating Asymmetry in the Rat Bony Labyrinth. Anat. Rec. 2021, 304, 2645–2660. [Google Scholar] [CrossRef]
- Lebrun, R.; León, M.P.D.; Tafforeau, P.; Zollikofer, C. Deep Evolutionary Roots of Strepsirrhine Primate Labyrinthine Morphology. J. Anat. 2010, 216, 368–380. [Google Scholar] [CrossRef]
- de León, M.S.P.; Koesbardiati, T.; Weissmann, J.D.; Milella, M.; Reyna-Blanco, C.S.; Suwa, G.; Kondo, O.; Malaspinas, A.-S.; White, T.D.; Zollikofer, C.P.E. Human Bony Labyrinth Is an Indicator of Population History and Dispersal from Africa. Proc. Natl. Acad. Sci. USA 2018, 115, 4128–4133. [Google Scholar] [CrossRef] [Green Version]
- Beaudet, A.; Clarke, R.J.; Bruxelles, L.; Carlson, K.J.; Crompton, R.; de Beer, F.; Dhaene, J.; Heaton, J.L.; Jakata, K.; Jashashvili, T.; et al. The Bony Labyrinth of StW 573 (“Little Foot”): Implications for Early Hominin Evolution and Paleobiology. J. Hum. Evol. 2019, 127, 67–80. [Google Scholar] [CrossRef]
- Urciuoli, A.; Zanolli, C.; Beaudet, A.; Dumoncel, J.; Santos, F.; Moyà-Solà, S.; Alba, D.M. The Evolution of the Vestibular Apparatus in Apes and Humans. eLife 2020, 9, e51261. [Google Scholar] [CrossRef] [PubMed]
- Gunz, P.; Ramsier, M.; Kuhrig, M.; Hublin, J.-J.; Spoor, F. The Mammalian Bony Labyrinth Reconsidered, Introducing a Comprehensive Geometric Morphometric Approach. J. Anat. 2012, 220, 529–543. [Google Scholar] [CrossRef] [PubMed]
- Schwab, J.A.; Kriwet, J.; Weber, G.W.; Pfaff, C. Carnivoran Hunting Style and Phylogeny Reflected in Bony Labyrinth Morphometry. Sci. Rep. 2019, 9, 70. [Google Scholar] [CrossRef] [PubMed]
- Yang, A.; Hullar, T.E. Relationship of Semicircular Canal Size to Vestibular-Nerve Afferent Sensitivity in Mammals. J. Neurophysiol. 2007, 98, 3197–3205. [Google Scholar] [CrossRef] [Green Version]
- Graf, W.; Klam, F. Le système vestibulaire: Anatomie fonctionnelle et comparée, évolution et développement. Comptes Rendus Palevol 2006, 5, 637–655. [Google Scholar] [CrossRef]
- Debat, V.; David, P. Mapping Phenotypes: Canalization, Plasticity and Developmental Stability. Trends Ecol. Evol. 2001, 16, 555–561. [Google Scholar] [CrossRef]
- Hoffmann, A.; Woods, R. Trait Variability and Stress: Canalization, Developmental Stability and the Need for a Broad Approach. Ecol. Lett. 2001, 4, 97–101. [Google Scholar] [CrossRef]
- Réale, D.; Roff, D.A. Inbreeding, Developmental Stability, and Canalization in the Sand Cricket Gryllus firmus. Evolution 2003, 57, 597–605. [Google Scholar] [CrossRef] [PubMed]
- Nekaris, K.A.-I.; Starr, C.R.; Collins, R.L.; Wilson, A. Comparative ecology of exudate feeding by lorises (Nycticebus, Loris) and pottos (Perodicticus, Arctocebus). In The Evolution of Exudativory in Primates; Burrows, A.M., Nash, L.T., Eds.; Developments in Primatology: Progress and Prospects; Springer: New York, NY, USA, 2010; pp. 155–168. ISBN 978-1-4419-6661-2. [Google Scholar]
- Graham, J.H.; Raz, S.; Hel-Or, H.; Nevo, E. Fluctuating Asymmetry: Methods, Theory, and Applications. Symmetry 2010, 2, 466–540. [Google Scholar] [CrossRef] [Green Version]
- Debat, V.; Bloyer, S.; Faradji, F.; Gidaszewski, N.; Navarro, N.; Orozco-terWengel, P.; Ribeiro, V.; Schlötterer, C.; Deutsch, J.S.; Peronnet, F. Developmental Stability: A Major Role for Cyclin G in Drosophila melanogaster. PLoS Genet. 2011, 7, e1002314. [Google Scholar] [CrossRef] [PubMed] [Green Version]
- Hallgrímsson, B.; Willmore, K.; Hall, B.K. Canalization, Developmental Stability, and Morphological Integration in Primate Limbs. Am. J. Phys. Anthropol. 2002, 35, 131–158. [Google Scholar] [CrossRef] [PubMed] [Green Version]
- Klingenberg, C.P. Developmental Instability as a Research Tool: Using Patterns of Fluctuating Asymmetry to Infer the Developmental Origins of Morphological Integration. In Developmental Stability: Causes andConsequences; Klingeberg, C.P., Polak, M., Eds.; Oxford University Press: Oxford, UK, 2003; pp. 427–442. ISBN 978-0195143454. [Google Scholar]
- Klingenberg, C.P.; Zaklan, S.D. Morphological Integration between Developmental Compartments in the Drosophila Wing. Evolution 2000, 54, 1273–1285. [Google Scholar] [CrossRef] [PubMed]
- Breuker, C.J.; Patterson, J.S.; Klingenberg, C.P. A Single Basis for Developmental Buffering of Drosophila Wing Shape. PLoS ONE 2006, 1, e7. [Google Scholar] [CrossRef]
- Debat, V.; Alibert, P.; David, P.; Paradis, E.; Auffray, J.-C. Independence between Developmental Stability and Canalization in the Skull of the House Mouse. Proc. R. Soc. Lond. B Biol. Sci. 2000, 267, 423–430. [Google Scholar] [CrossRef] [Green Version]
- Willmore, K.E.; Klingenberg, C.P.; Hallgrímsson, B. The Relationship between Fluctuating Asymmetry and Environmental Variance in Rhesus Macaque Skulls. Evolution 2005, 59, 898–909. [Google Scholar] [CrossRef] [PubMed]
- Tsujino, M.; Takahashi, K.H. Natural Genetic Variation in Fluctuating Asymmetry of Wing Shape in Drosophila melanogaster. Ecol. Res. 2012, 27, 133–143. [Google Scholar] [CrossRef] [Green Version]
- Radwan, J.; Watson, P.J.; Farslow, J.; Thornhill, R. Procrustean Analysis of Fluctuating Asymmetry in the Bulb Mite Rhizoglyphus robini Claparede (Astigmata: Acaridae). Biol. J. Linn. Soc. 2003, 80, 499–505. [Google Scholar] [CrossRef]
- Leamy, L.J.; Klingenberg, C.P. The Genetics and Evolution of Fluctuating Asymmetry. Annu. Rev. Ecol. Evol. Syst. 2005, 36, 1–21. [Google Scholar] [CrossRef] [Green Version]
- Carter, A.J.R.; Houle, D. Artificial Selection Reveals Heritable Variation for Developmental Instability. Evolution 2011, 65, 3558–3564. [Google Scholar] [CrossRef] [PubMed]
- Møller, A.P.; Thornhill, R. A Meta-Analysis of the Heritability of Developmental Stability. J. Evol. Biol. 1997, 10, 1–16. [Google Scholar] [CrossRef]
- Jeffery, N.; Spoor, F. Prenatal Growth and Development of the Modern Human Labyrinth. J. Anat. 2004, 204, 71–92. [Google Scholar] [CrossRef] [PubMed]
- Ekdale, E.G. Ontogenetic Variation in the Bony Labyrinth of Monodelphis domestica (Mammalia: Marsupialia) Following Ossification of the Inner Ear Cavities. Anat. Rec. 2010, 293, 1896–1912. [Google Scholar] [CrossRef]
- Berlioz, E.; Cornette, R.; Lenoir, N.; Santin, M.D.; Lehmann, T. Exploring the Ontogenetic Development of the Inner Ear in Aardvarks. J. Anat. 2021, 238, 1128–1142. [Google Scholar] [CrossRef] [PubMed]
- Mennecart, B.; Costeur, L. Shape Variation and Ontogeny of the Ruminant Bony Labyrinth, an Example in Tragulidae. J. Anat. 2016, 229, 422–435. [Google Scholar] [CrossRef] [Green Version]
- Costeur, L.; Mennecart, B.; Müller, B.; Schulz, G. Prenatal Growth Stages Show the Development of the Ruminant Bony Labyrinth and Petrosal Bone. J. Anat. 2017, 230, 347–353. [Google Scholar] [CrossRef] [PubMed]
- Toyoda, S.; Shiraki, N.; Yamada, S.; Uwabe, C.; Imai, H.; Matsuda, T.; Yoneyama, A.; Takeda, T.; Takakuwa, T. Morphogenesis of the Inner Ear at Different Stages of Normal Human Development. Anat. Rec. 2015, 298, 2081–2090. [Google Scholar] [CrossRef] [PubMed] [Green Version]
- Lyu, H.-Y.; Chen, K.-G.; Yin, D.-M.; Hong, J.; Yang, L.; Zhang, T.-Y.; Dai, P.-D. The Age-Related Orientational Changes of Human Semicircular Canals. Clin. Exp. Otorhinolaryngol. 2016, 9, 109–115. [Google Scholar] [CrossRef] [PubMed]
Figure 1.
(A): Anatomical position, anatomy and orientation of the left and right bony labyrinths in the skull of a Galago moholi specimen (TM 1298). 1: right cochlea; 2: ampullae of the left semicircular canals (SCCs); 3: left lateral SCC; 4: right anterior SCC; 5: left posterior SCC; 6: left common crus; 7: vestibule of the right bony labyrinth that encloses the saccule and the utricle. (B): reference head-centred orientation planes used before digitising semi-landmarks. Scale bars: 1 cm.

Figure 2.
Semilandmark protocol used in the study, illustrated on the left bony labyrinth of the specimen TM1298 (Galago moholi). (A) 3D surface of the bony labyrinth presenting the positions of the anterior semicircular canal (ASCC), of the posterior semicircular canal (PSCC), of the lateral semicircular canal (LSCC) and of the common crus (CC); (B) Bezier curves placed on each SCC; (C) large number of equidistant semilandmarks characterising the SCC curves; (D) 70 equidistant sliding semilandmarks used for analyses.

Figure 3.
PCA of semicircular canal shape variation for all (130) specimens, and associated shape deformation along the first two axes. Maroon: G. moholi; Bright red: P. granti. Orange: O. crassicaudatus. Blue: L. tardigradus. Purple: N. coucang. Cyan: P. edwardsi.
Figure 3.
PCA of semicircular canal shape variation for all (130) specimens, and associated shape deformation along the first two axes. Maroon: G. moholi; Bright red: P. granti. Orange: O. crassicaudatus. Blue: L. tardigradus. Purple: N. coucang. Cyan: P. edwardsi.

Figure 4.
Intraspecific patterns of semicircular canal shape variation for the six species. Maroon: G. moholi; Bright red: P. granti. Orange: O. crassicaudatus. Blue: L. tardigradus. Purple: N. coucang. Cyan: P. edwardsi.
Figure 4.
Intraspecific patterns of semicircular canal shape variation for the six species. Maroon: G. moholi; Bright red: P. granti. Orange: O. crassicaudatus. Blue: L. tardigradus. Purple: N. coucang. Cyan: P. edwardsi.

Figure 5.
Asymmetry score violin plot for the specimens within each studied species.

Figure 6.
Patterns of FA in semicircular canal shape variation, and associated shape deformation (deformation amplification factor along the first PC axes: 2). Maroon: G. moholi; Bright red: P. granti. Orange: O. crassicaudatus. Blue: L. tardigradus. Purple: N. coucang. Cyan: P. edwardsi.
Figure 6.
Patterns of FA in semicircular canal shape variation, and associated shape deformation (deformation amplification factor along the first PC axes: 2). Maroon: G. moholi; Bright red: P. granti. Orange: O. crassicaudatus. Blue: L. tardigradus. Purple: N. coucang. Cyan: P. edwardsi.

Figure 7.
Intraspecific patterns of semicircular canal asymmetric shape variation for the six species. Maroon: G. moholi; Bright red: P. granti. Orange: O. crassicaudatus; Blue: L. tardigradus; Purple: N. coucang; Cyan: P. edwardsi. Deformation amplification factor along the PC axes: 3.
Figure 7.
Intraspecific patterns of semicircular canal asymmetric shape variation for the six species. Maroon: G. moholi; Bright red: P. granti. Orange: O. crassicaudatus; Blue: L. tardigradus; Purple: N. coucang; Cyan: P. edwardsi. Deformation amplification factor along the PC axes: 3.


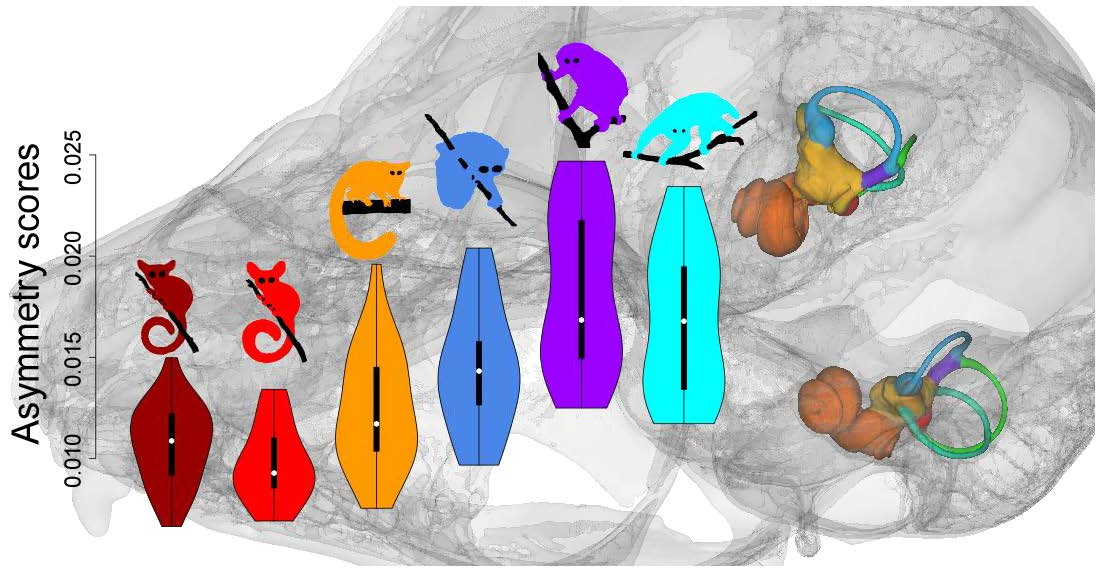
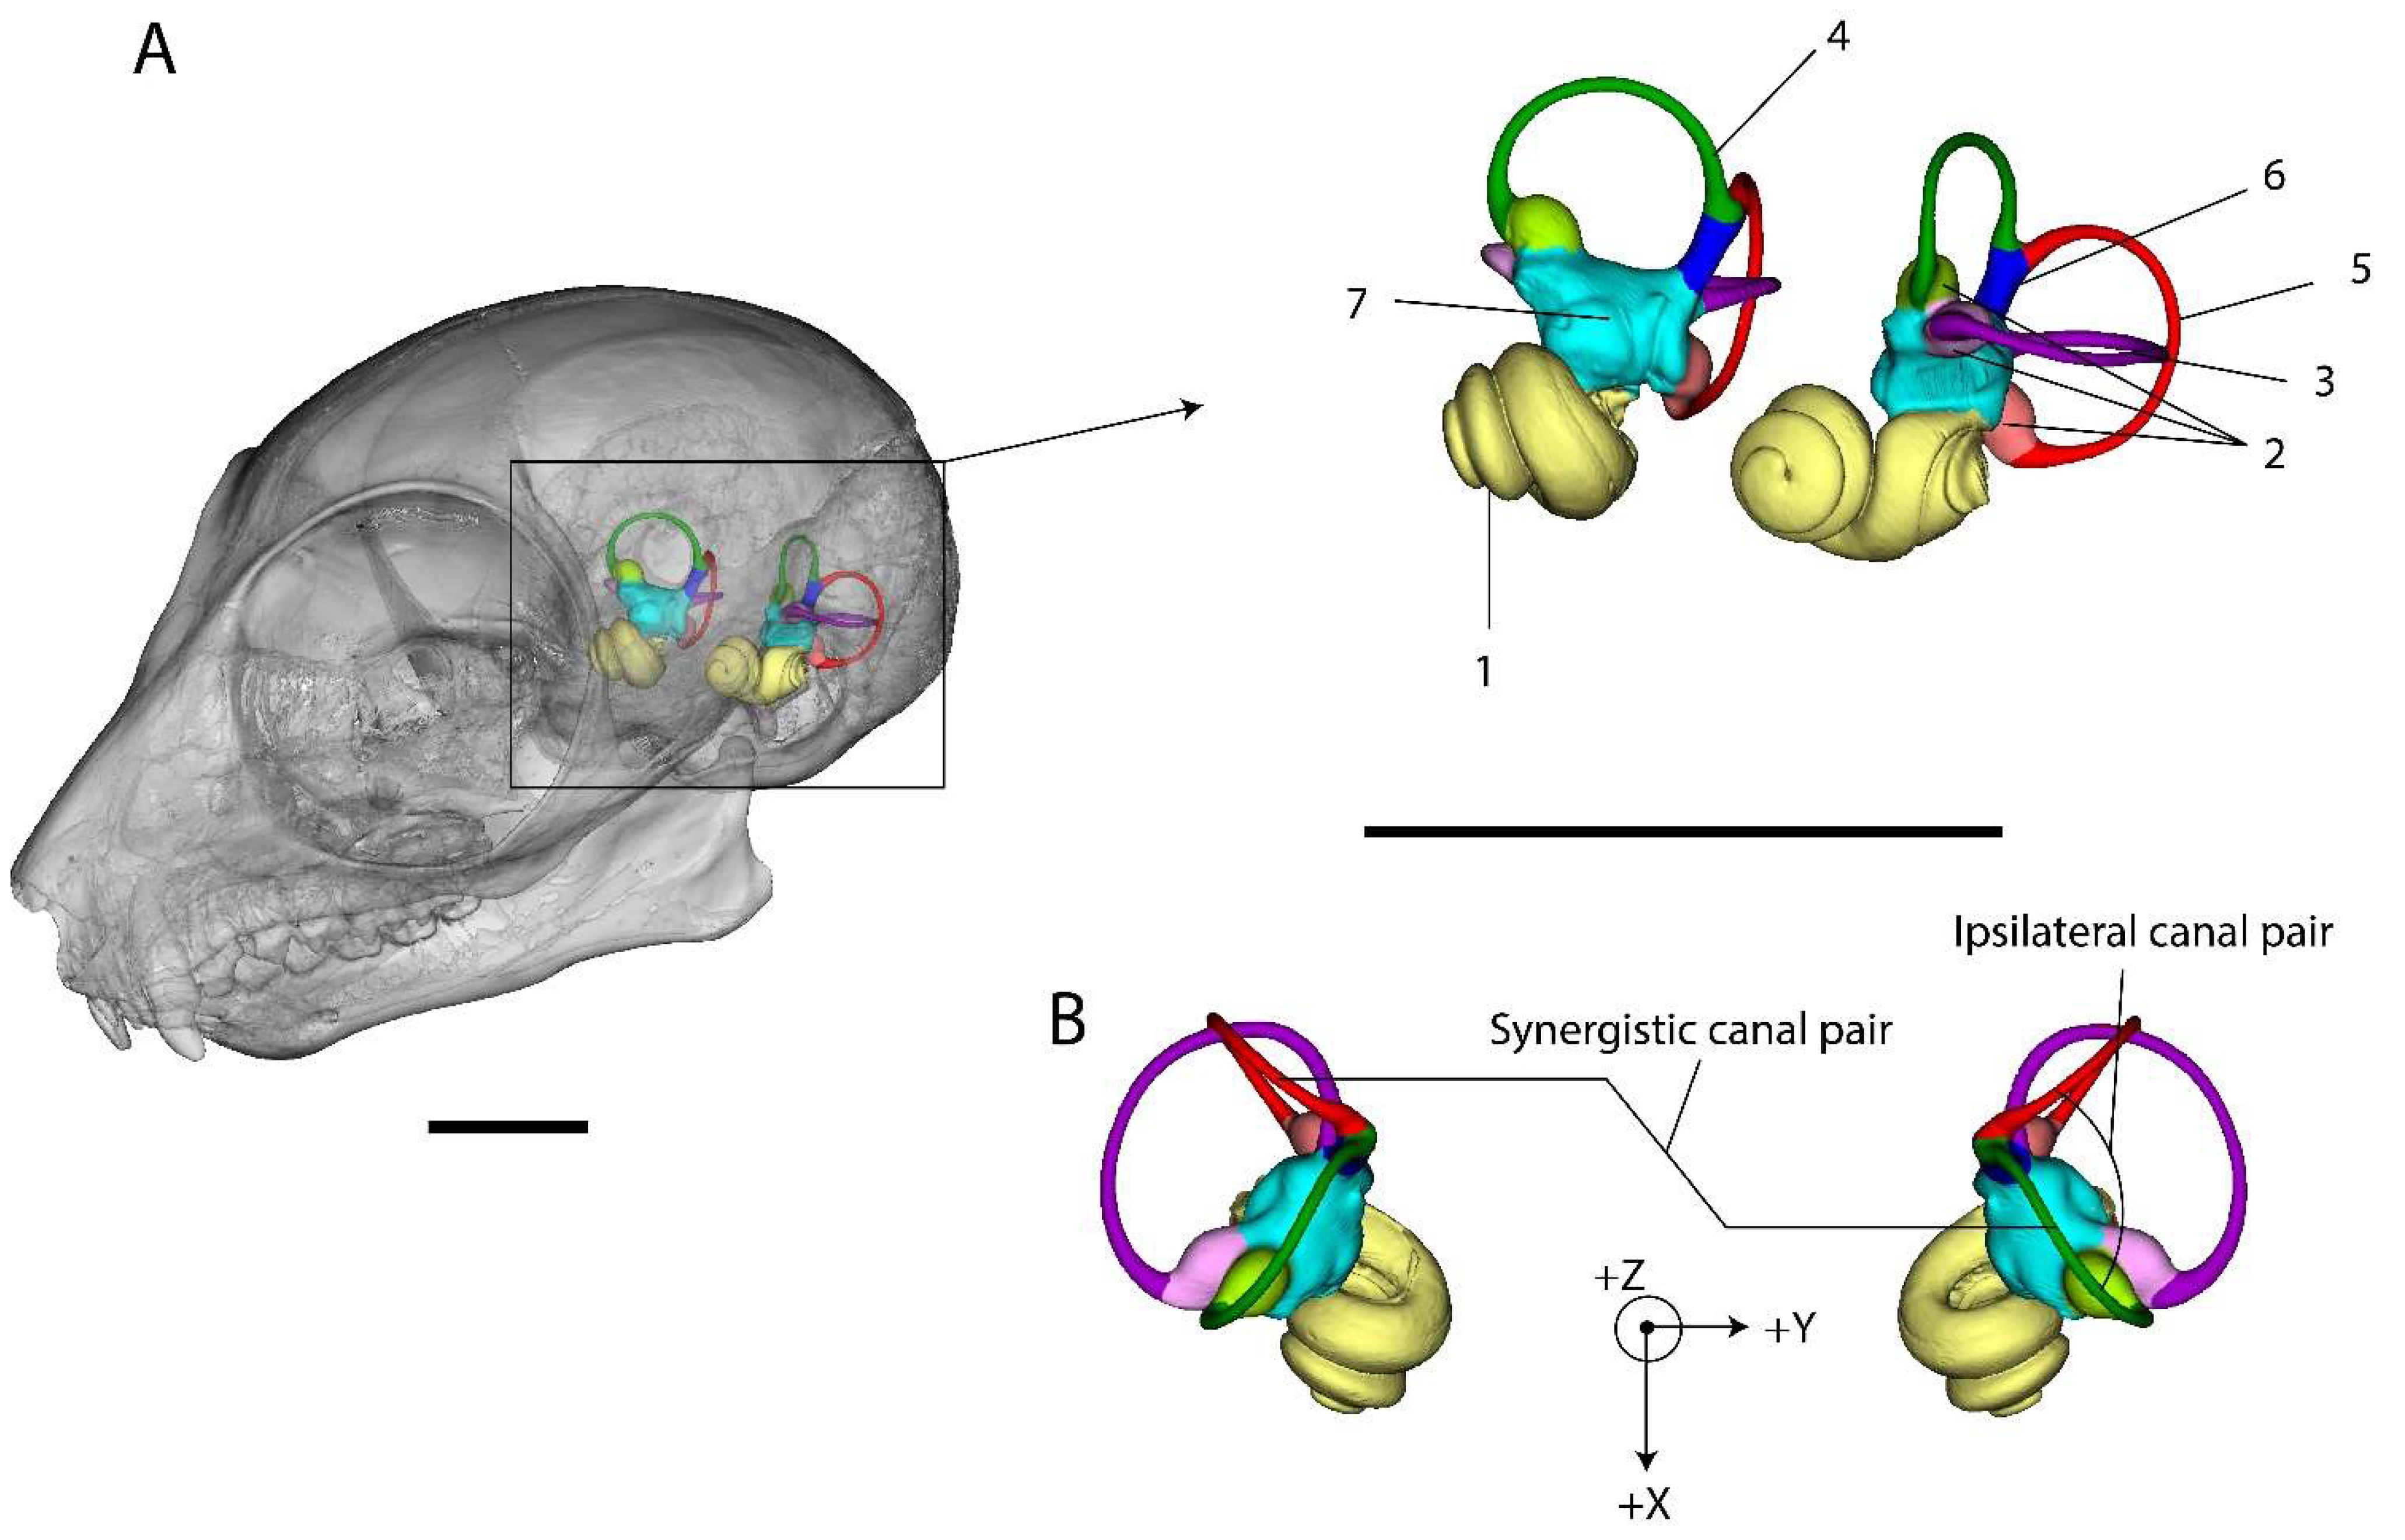
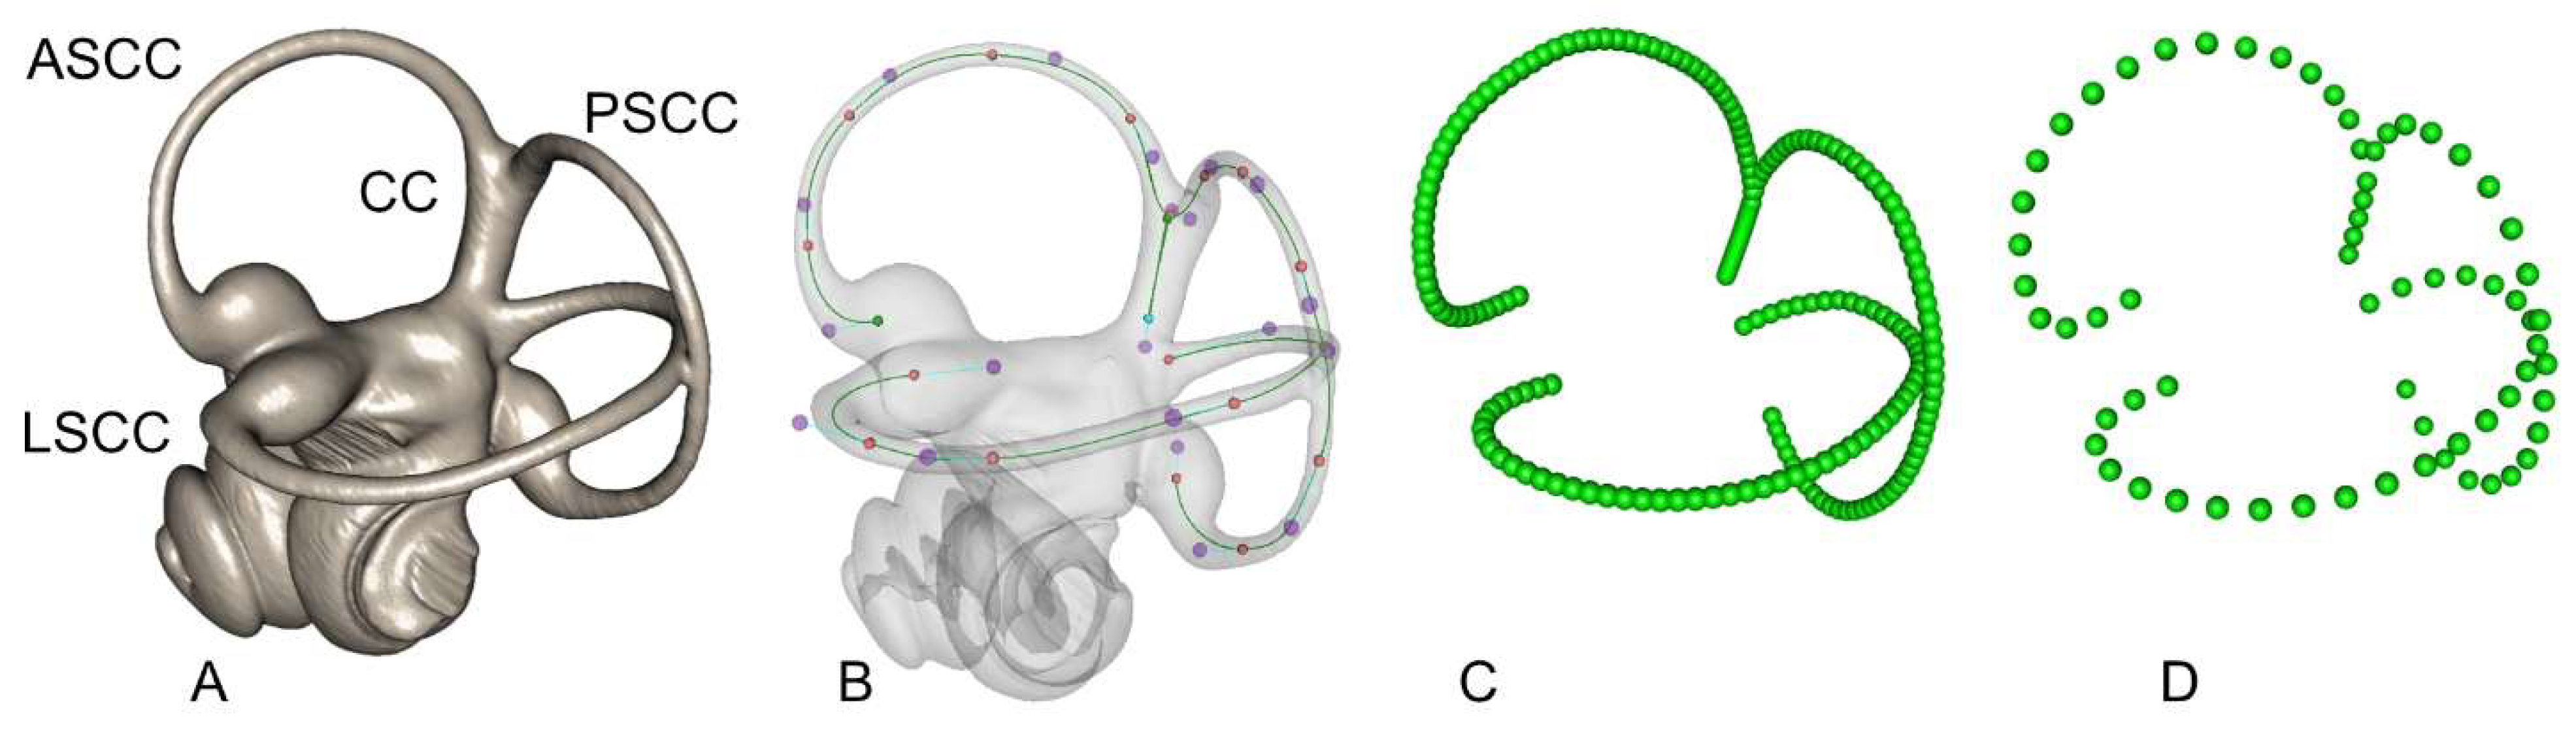
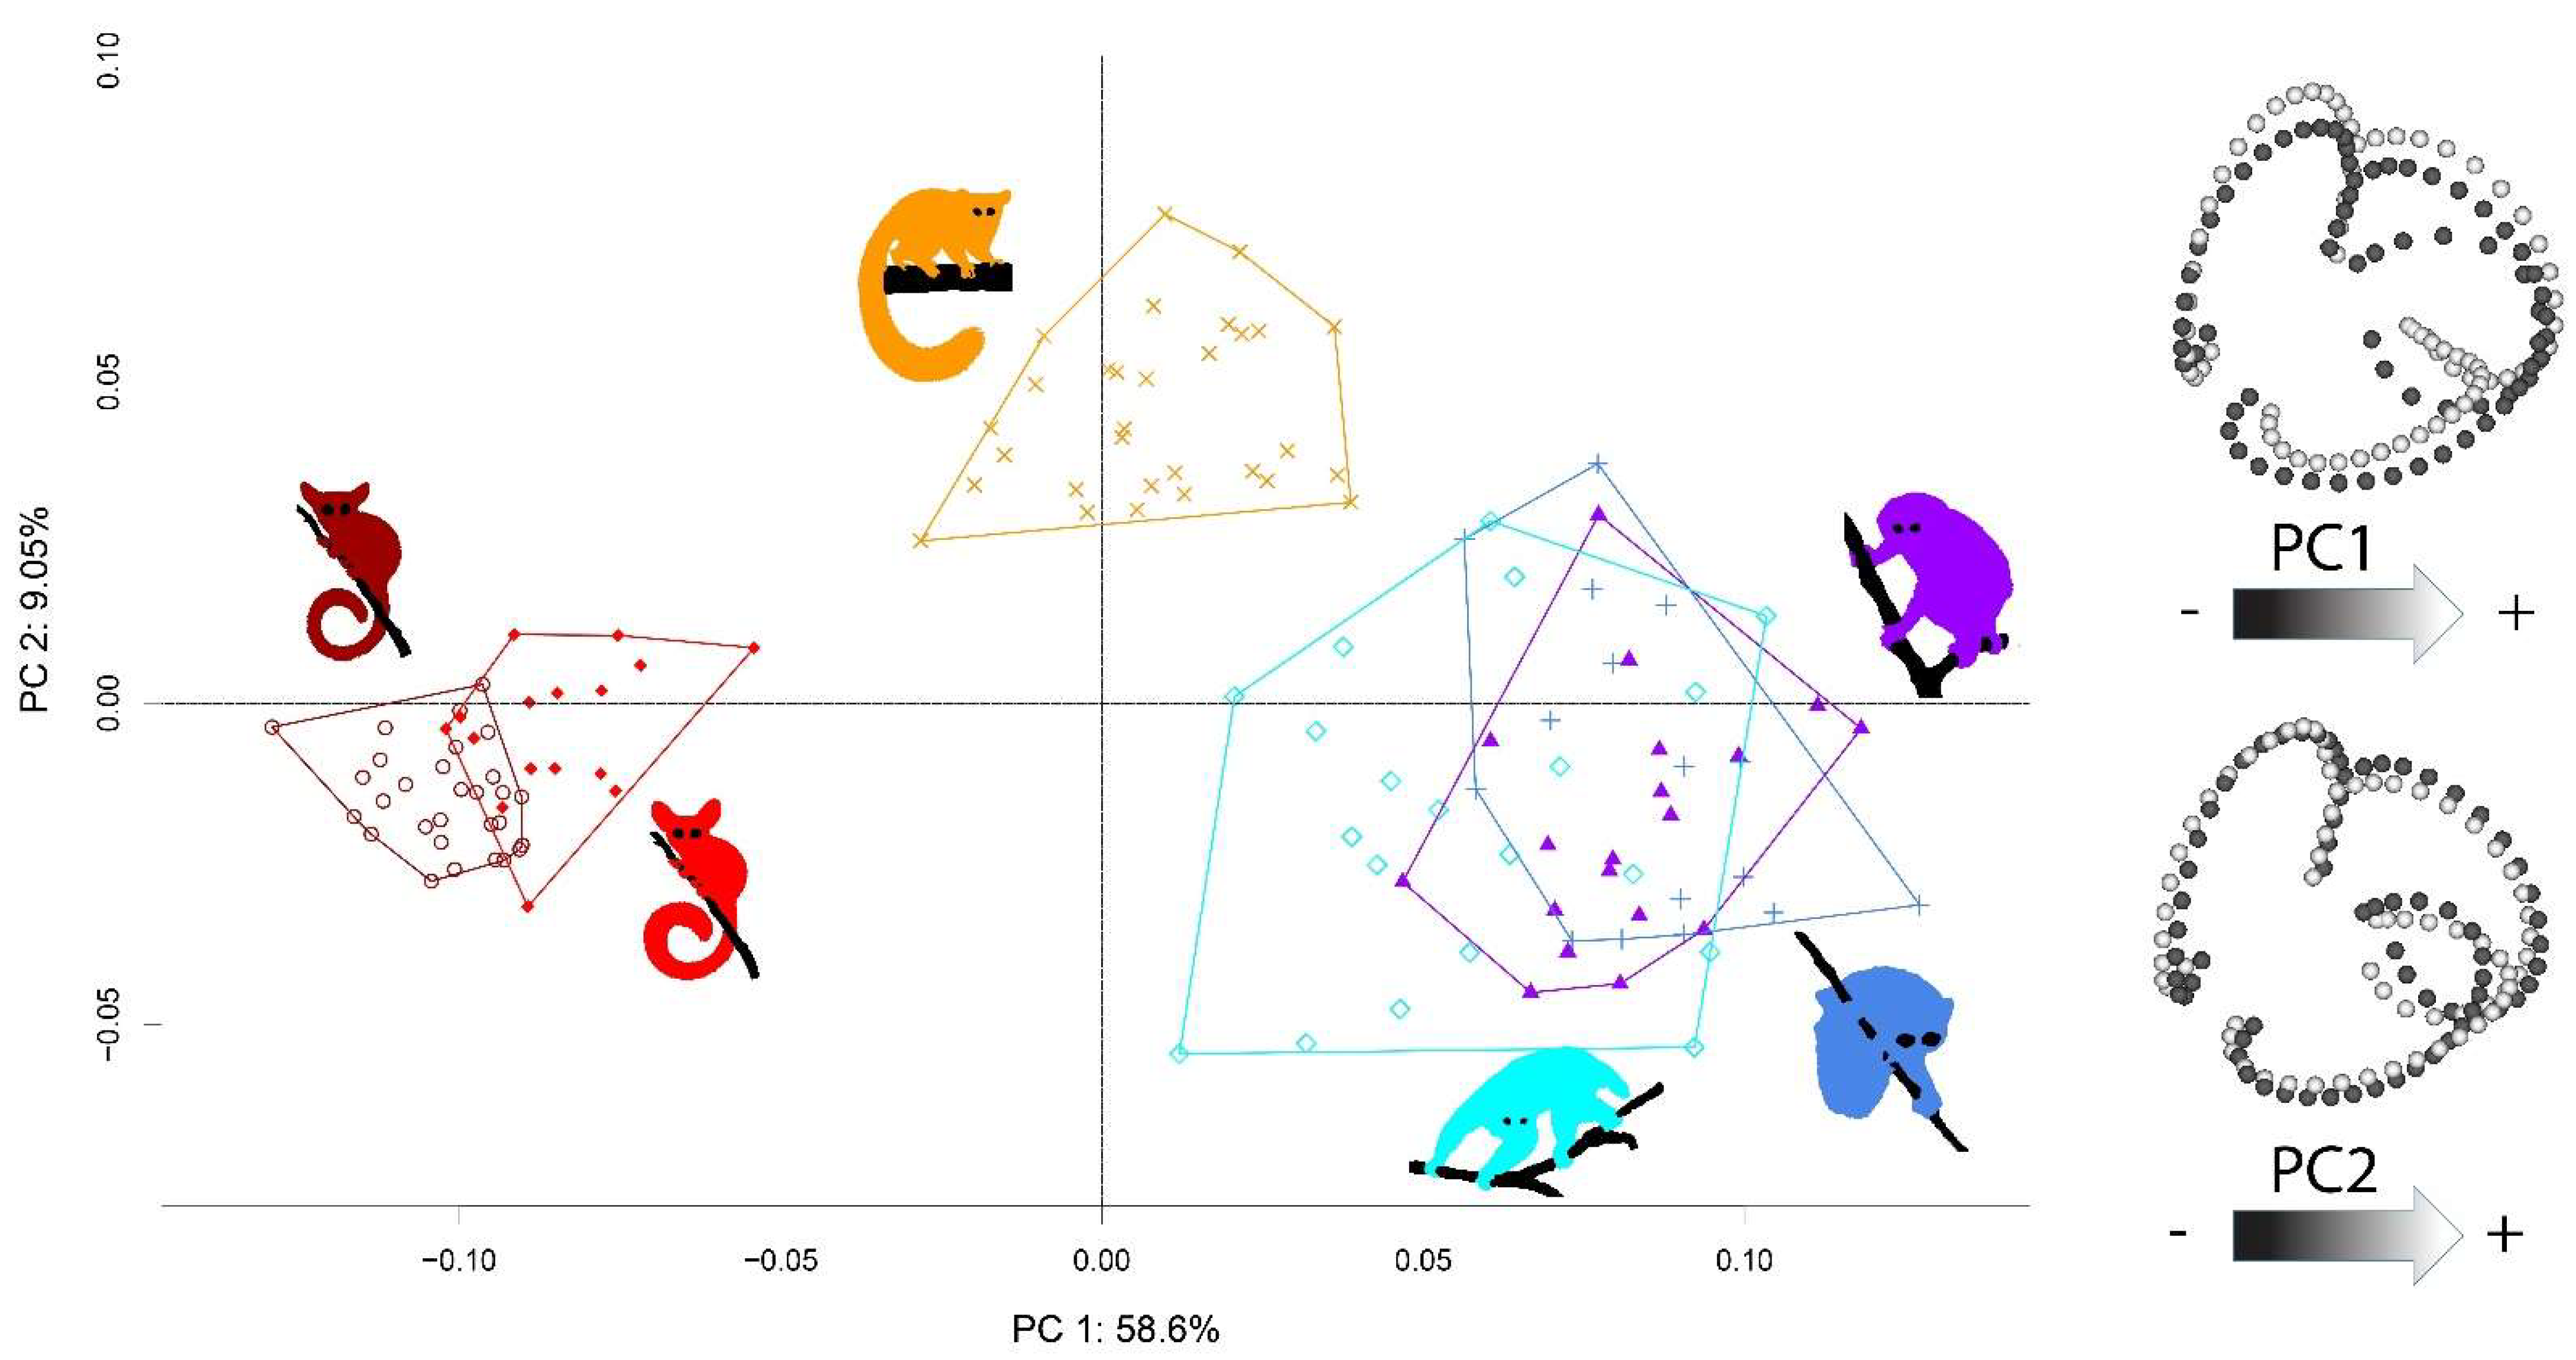
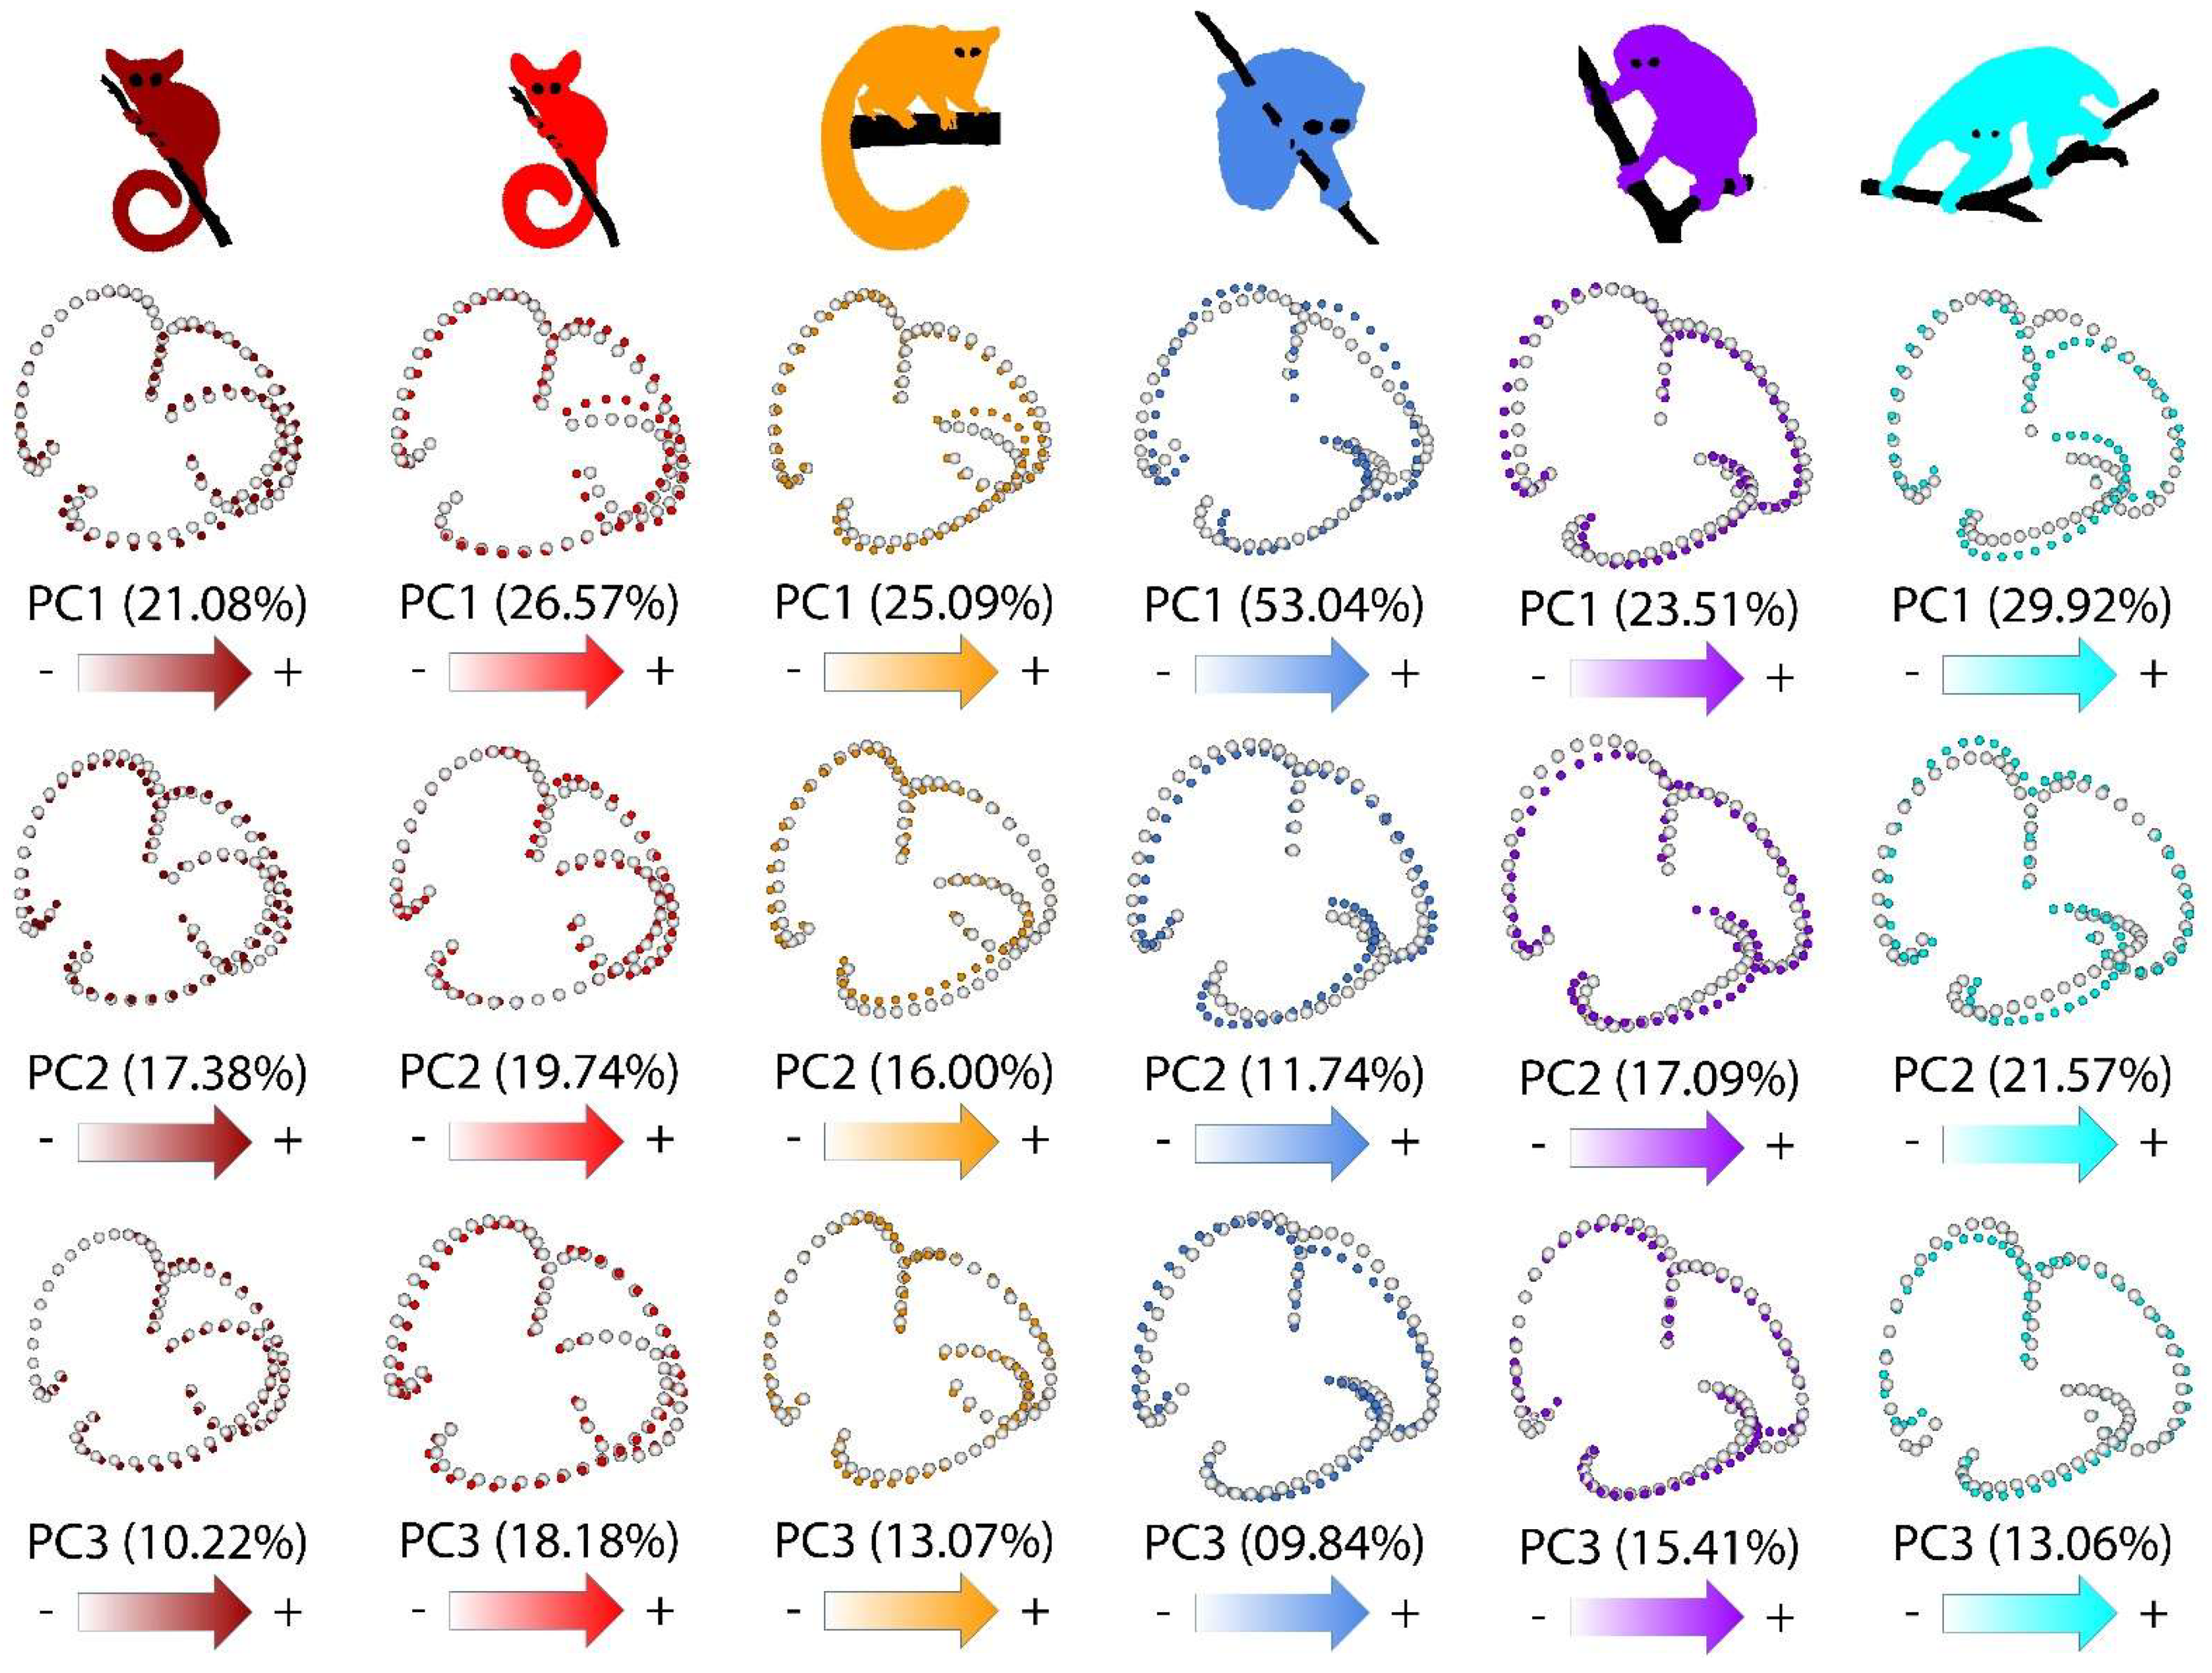
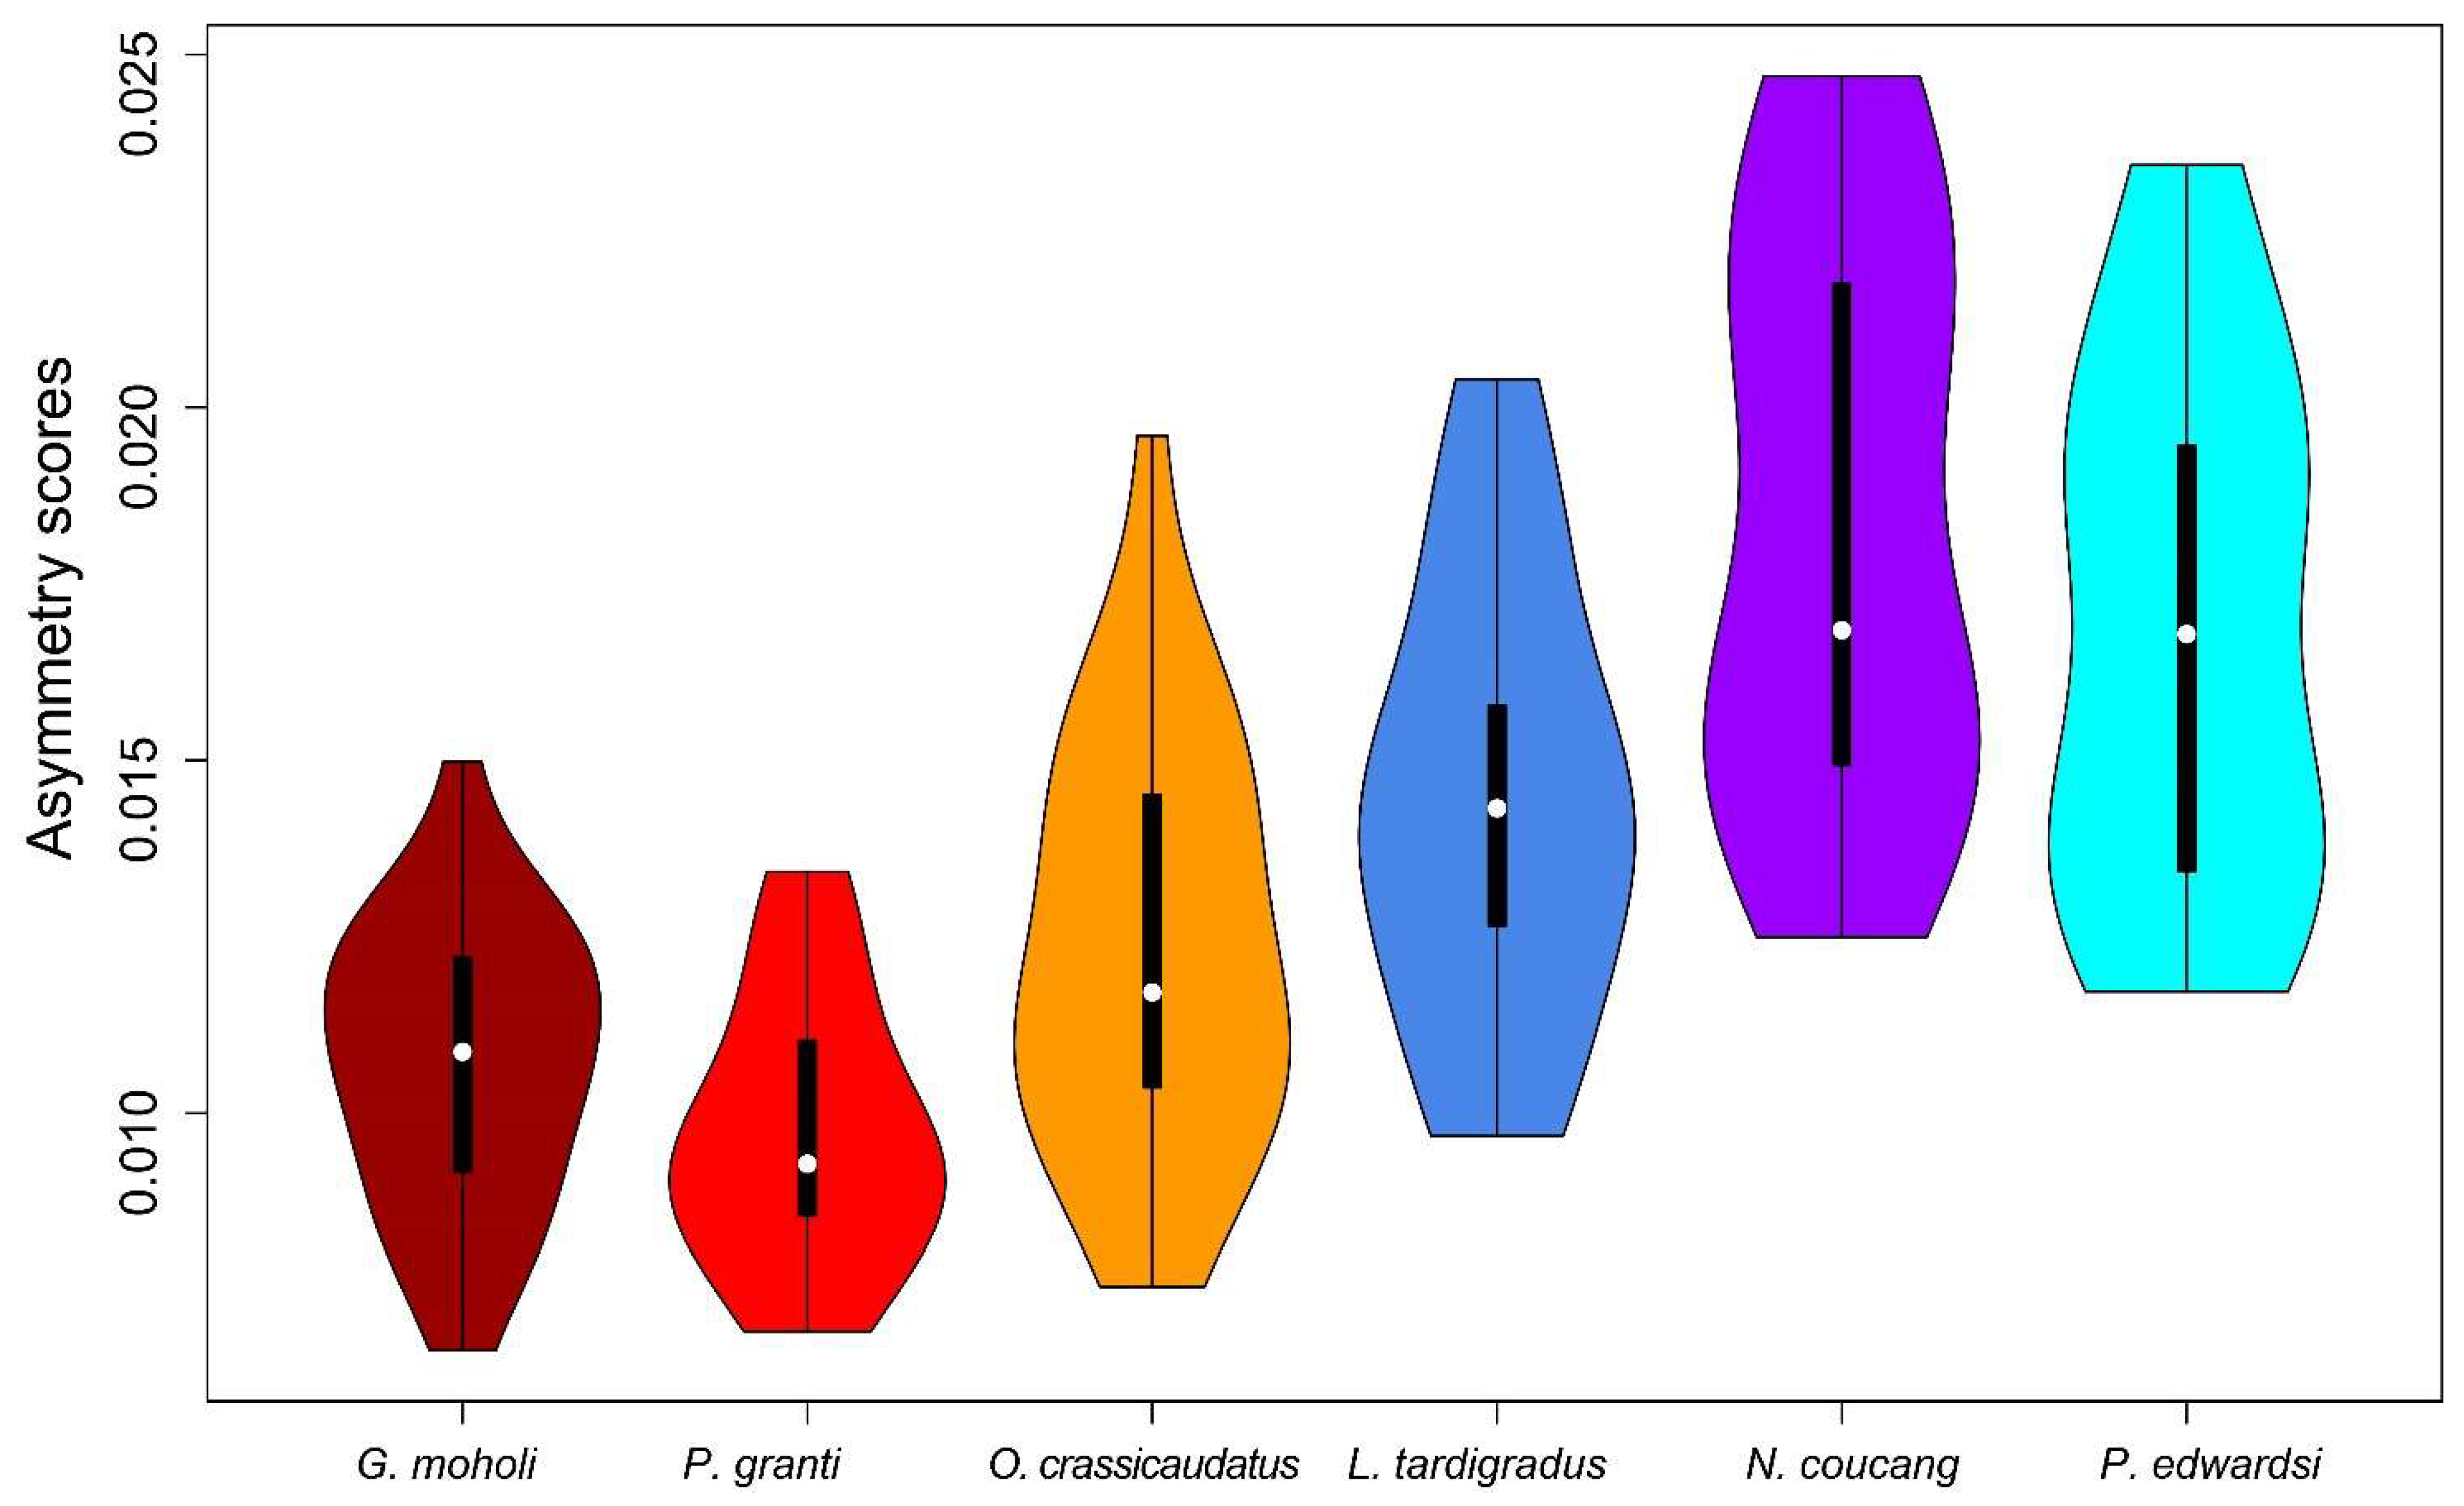
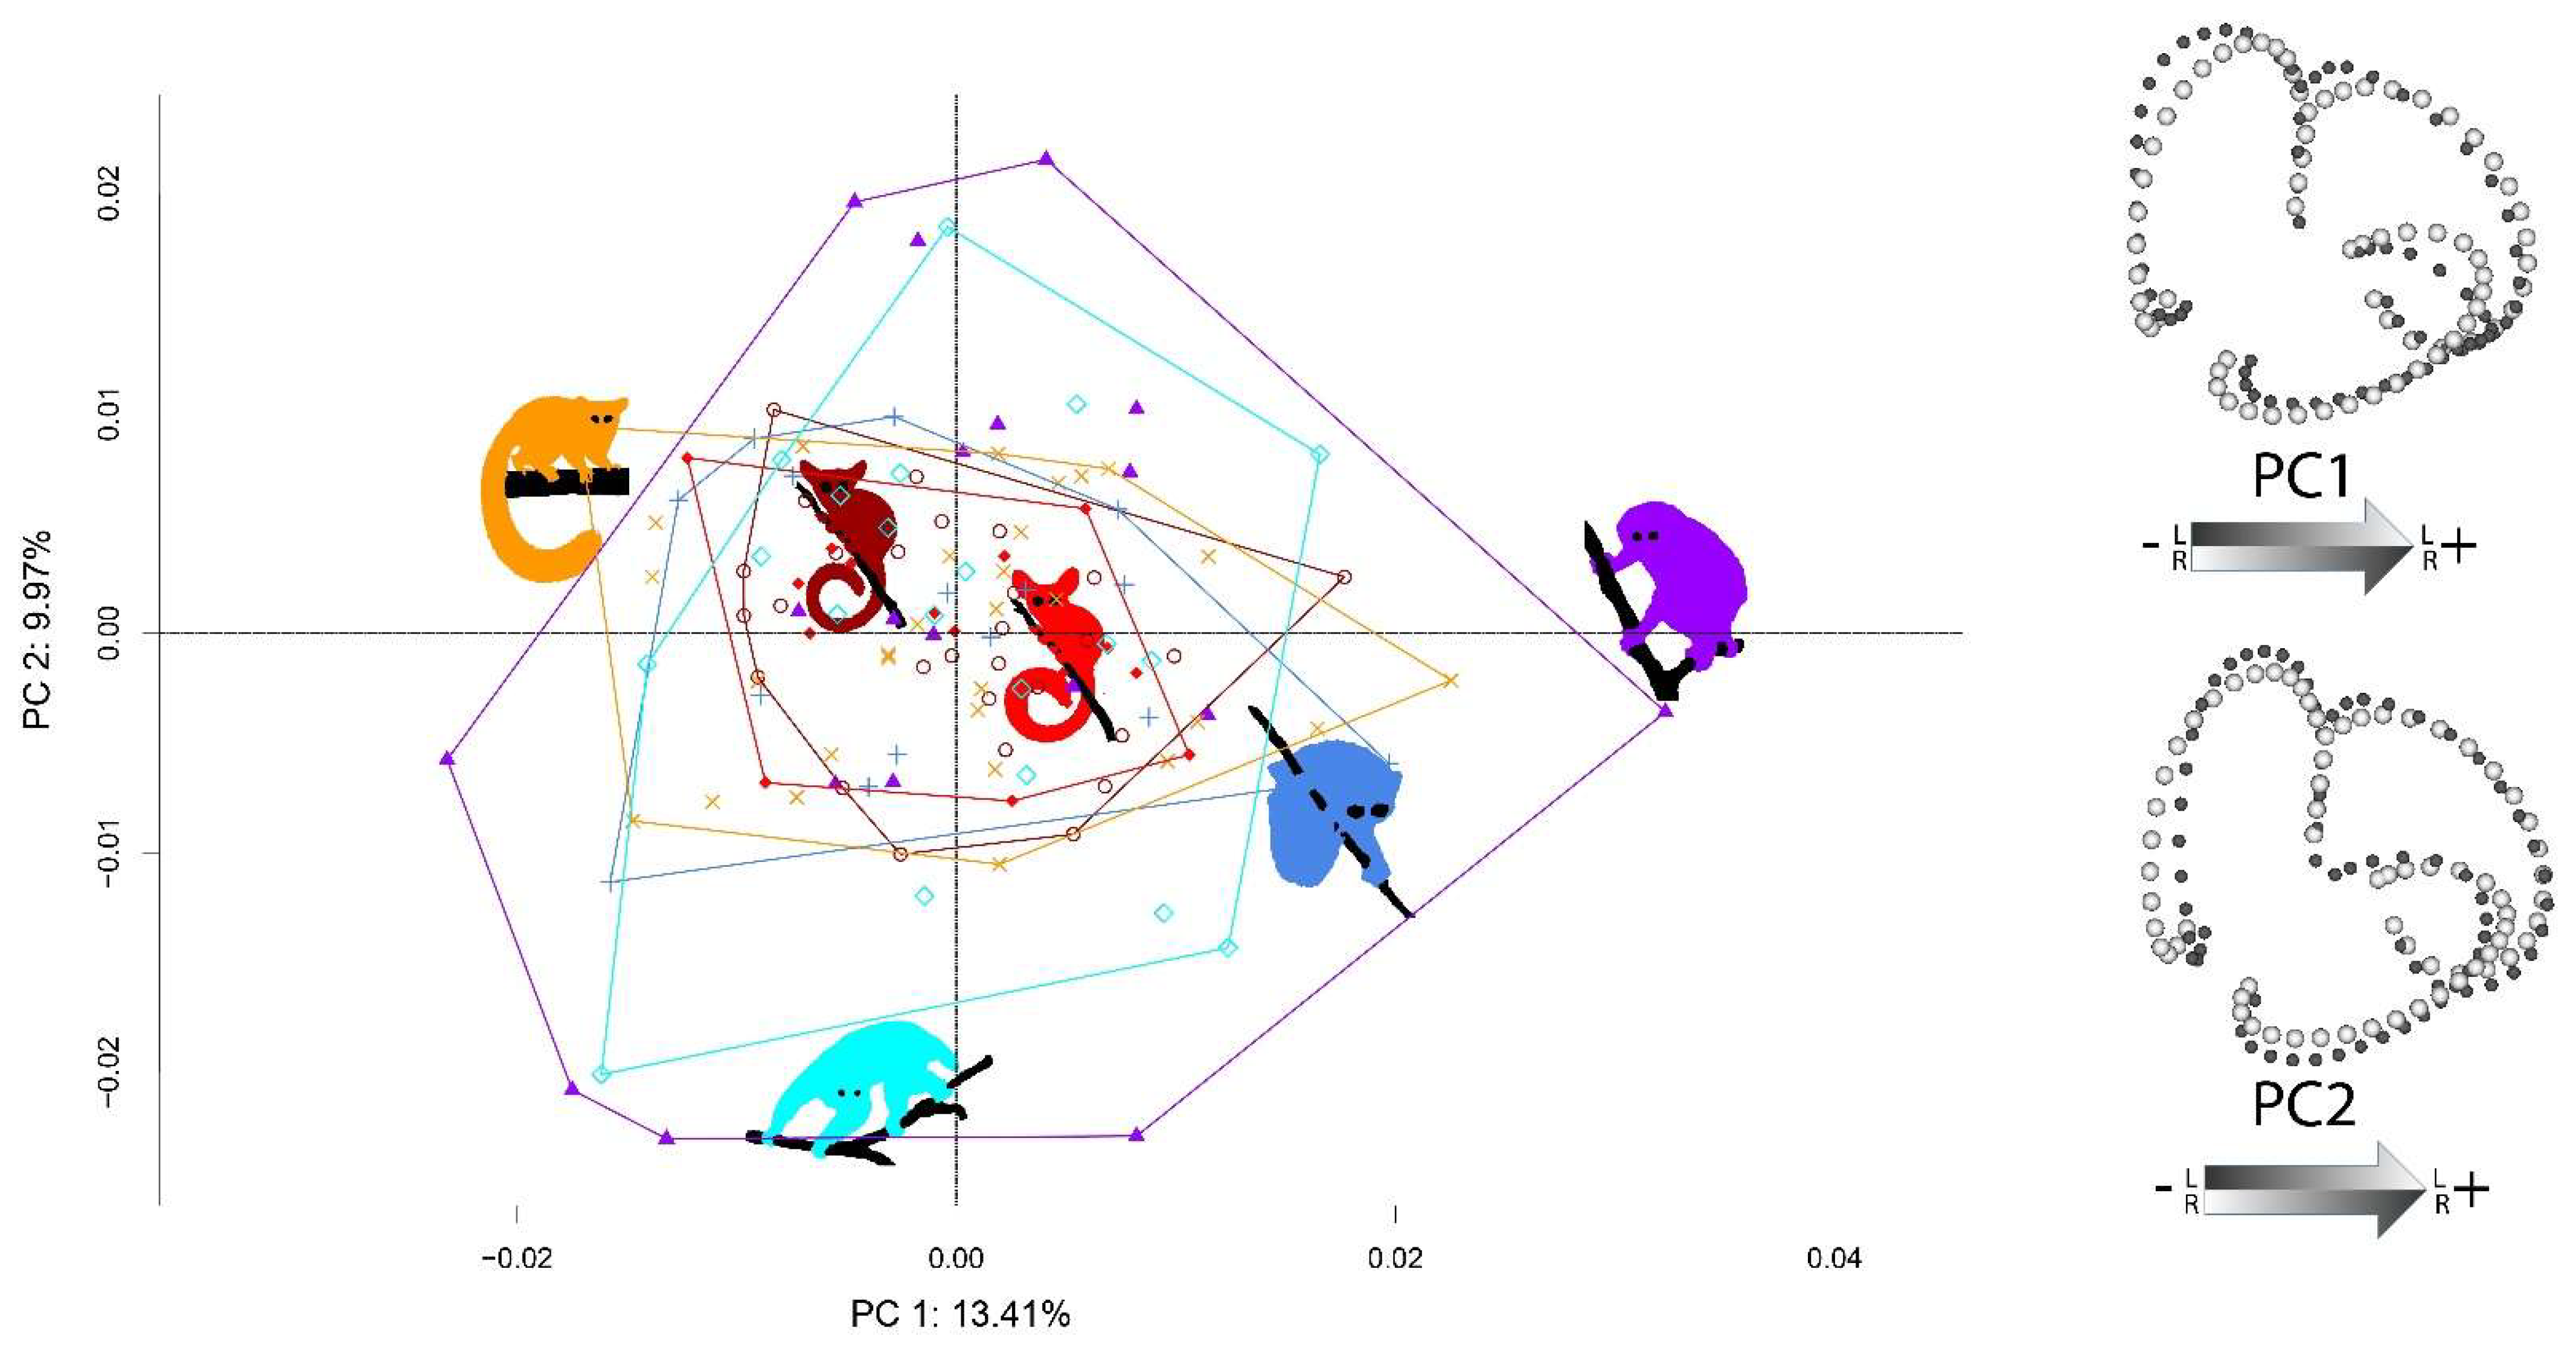
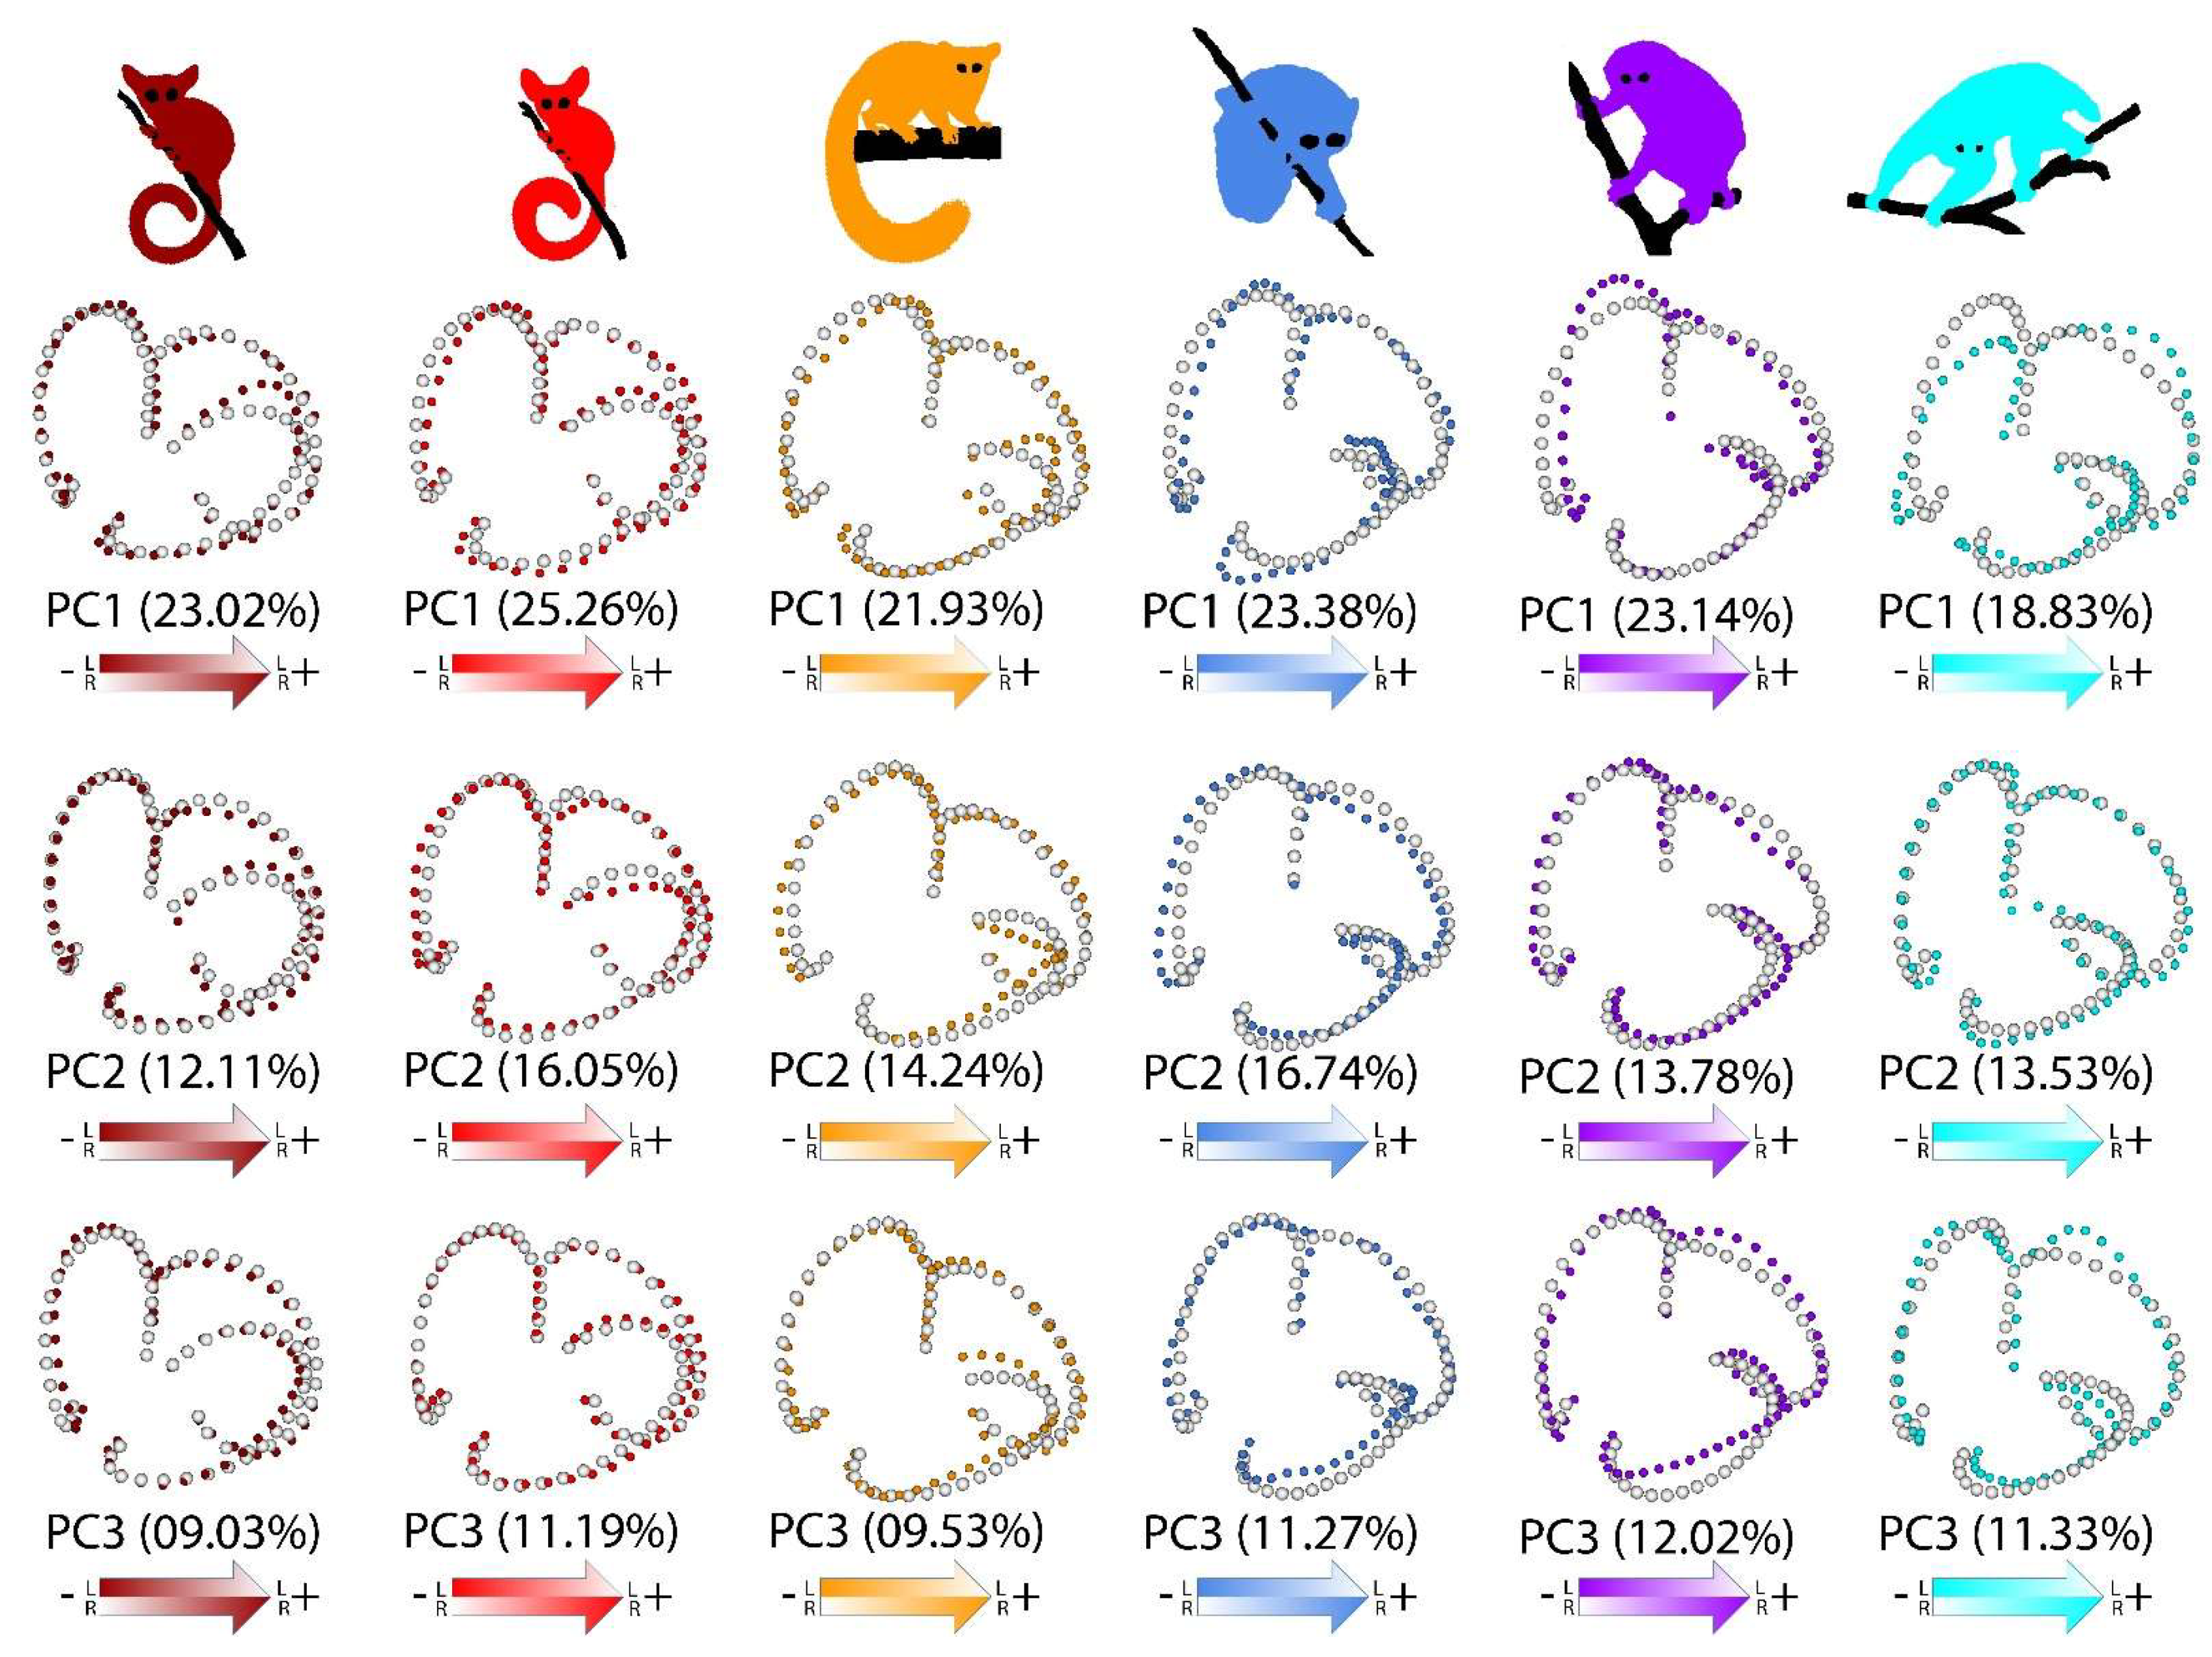
Table 1.
Species-specific mean angles (in degrees), angle variances and angular asymmetry. The term “Asymmetry” (Asym) here refers to the absolute value of the difference between angles measured within left and right vestibuli for each ipsilateral pair of canals. For synergistic pairs of SCCs, the measures correspond to the means of the angle deviation from coplanarity (deviation from 180°), and the variance of the deviation from coplanarity. l_lat: left lateral SCC; l_ant: left anterior SCC; l_post: left posterior SCC; r_lat: right lateral SCC; r_ant: right anterior SCC; r_post: right posterior SCC.
| Measure | G. moho. | P. gran. | O. cras. | L. tard. | N. couc. | P. edwa. | |
|---|---|---|---|---|---|---|---|
| Left vestibulum | Mean(l_lat ∡ l_post) | 95.33 | 94.55 | 87.77 | 87.61 | 88.21 | 89.28 |
| VAR(l_lat ∡ l_post) | 4.30 | 11.67 | 7.64 | 36.17 | 22.04 | 30.78 | |
| Mean(l_lat ∡ l_ant) | 91.57 | 89.52 | 82.10 | 77.71 | 84.21 | 80.49 | |
| VAR(l_lat ∡ l_ant) | 5.05 | 7.13 | 11.68 | 25.84 | 26.41 | 40.55 | |
| Mean(l_ant ∡ l_post) | 94.35 | 94.63 | 97.80 | 92.85 | 91.44 | 95.44 | |
| VAR(l_ant ∡ l_post) | 4.06 | 4.31 | 10.94 | 10.57 | 12.72 | 11.09 | |
| Right vestibulum | Mean(r_lat ∡ r_post) | 95.40 | 94.17 | 87.61 | 87.35 | 87.63 | 89.65 |
| VAR(r_lat ∡ r_post) | 3.83 | 9.32 | 7.73 | 36.59 | 18.90 | 23.01 | |
| Mean(r_lat ∡ r_ant) | 91.05 | 89.27 | 82.04 | 77.46 | 85.43 | 80.74 | |
| VAR(r_lat ∡ r_ant) | 5.58 | 6.30 | 13.29 | 23.10 | 29.12 | 29.25 | |
| Mean(r_ant ∡ r_post) | 94.67 | 94.61 | 97.85 | 92.74 | 91.54 | 95.73 | |
| VAR(r_ant ∡ r_post) | 4.19 | 4.42 | 9.68 | 10.09 | 14.26 | 12.39 | |
| Both vestibuli | Mean(6 ipsilateral ∡) | 93.7 | 92.8 | 89.2 | 86.0 | 88.1 | 88.6 |
| Synergistic pairs of SCCs | Mean(l_lat ∡ r_lat) | 4.39 | 6.64 | 11.90 | 13.00 | 9.13 | 11.58 |
| VAR(l_lat ∡ r_lat) | 16.20 | 12.55 | 42.64 | 122.09 | 30.78 | 97.10 | |
| Mean(l_ant ∡ r_post) | 6.09 | 5.05 | 5.21 | 11.13 | 11.37 | 12.27 | |
| VAR(l_ant ∡ r_post) | 5.08 | 5.38 | 7.27 | 49.65 | 32.01 | 28.52 | |
| Mean(l_post ∡ r_ant) | 6.28 | 4.97 | 5.25 | 10.42 | 11.36 | 12.17 | |
| VAR(l_post ∡ r_ant) | 5.67 | 5.05 | 6.70 | 60.17 | 34.46 | 28.58 | |
| Asymmetry | Mean(Asym(lat ∡ post)) | 0.78 | 0.68 | 1.04 | 1.30 | 1.50 | 1.23 |
| VAR(Asym(lat ∡ post)) | 0.39 | 0.35 | 0.53 | 0.51 | 1.21 | 0.52 | |
| Mean(Asym(lat ∡ ant)) | 0.70 | 0.76 | 1.23 | 1.14 | 1.79 | 1.94 | |
| VAR(Asym(lat ∡ ant)) | 0.39 | 0.52 | 1.51 | 0.94 | 2.41 | 2.45 | |
| Mean(Asym(ant ∡ post)) | 0.79 | 0.63 | 0.81 | 0.73 | 1.06 | 1.06 | |
| VAR(Asym(ant ∡ post)) | 0.35 | 0.24 | 0.37 | 0.33 | 1.27 | 0.84 |
Table 2.
Species-specific mean centroid sizes (CS), mean common crus length (CCL, in mm), rescaled (RSC) CS and CCL variances for left and right vestibuli, and asymmetry (Asym). The term “Asymmetry” here refers to the absolute value of the difference between left and right CCL and canal CS. Species-specific rescaling (RSC) was computed in order to achieve mean (CS) = 1, and mean (CCL) = 1 for each of the six species so that variances, asymmetry means and variances are comparable across species. l_lat: left lateral SCC; l_ant: left anterior SCC; l_post: left posterior SCC; r_lat: right lateral SCC; r_ant: right anterior SCC; r_post: right posterior SCC.
| Measure | G. moho. | P. gran. | O. cras. | L. tard. | N. couc. | P. edwa. | |
|---|---|---|---|---|---|---|---|
| Left vestibulum | Mean(CS(l_lat)) | 8.66 | 8.39 | 9.48 | 5.88 | 7.36 | 7.62 |
| VAR(RSC(CS(l_lat))) | 0.0019 | 0.0037 | 0.0021 | 0.0050 | 0.0063 | 0.0081 | |
| Mean(CS(l_ant)) | 8.24 | 7.88 | 10.88 | 7.83 | 10.10 | 10.06 | |
| VAR(RSC(CS(l_ant))) | 0.0012 | 0.0021 | 0.0016 | 0.0031 | 0.0054 | 0.0074 | |
| Mean(CS(l_post)) | 7.80 | 7.78 | 10.06 | 7.19 | 8.47 | 8.85 | |
| VAR(RSC(CS(l_post))) | 0.0022 | 0.0031 | 0.0016 | 0.0032 | 0.0055 | 0.0064 | |
| Mean(l_CCL) | 01.03 | 01.07 | 1.67 | 1.62 | 1.50 | 1.58 | |
| VAR(RSC(l_CCL)) | 0.0085 | 0.0084 | 0.0089 | 0.0086 | 0.0619 | 0.0540 | |
| Right vestibulum | Mean(CS(r_lat)) | 8.66 | 8.40 | 9.51 | 5.91 | 7.34 | 7.66 |
| VAR(RSC(CS(r_lat))) | 0.0019 | 0.0038 | 0.0023 | 0.0050 | 0.0060 | 0.0082 | |
| Mean(CS(r_ant)) | 8.27 | 7.86 | 10.84 | 7.85 | 10.10 | 10.03 | |
| VAR(RSC(CS(r_ant))) | 0.0013 | 0.0017 | 0.0016 | 0.0035 | 0.0054 | 0.0074 | |
| Mean(CS(r_post)) | 7.82 | 7.78 | 10.08 | 7.14 | 8.45 | 8.87 | |
| VAR(RSC(CS(r_post))) | 0.0021 | 0.0031 | 0.0018 | 0.0030 | 0.0050 | 0.0060 | |
| Mean(r_CCL) | 01.09 | 1.13 | 1.62 | 1.60 | 1.56 | 1.59 | |
| VAR(RSC(r_CCL)) | 0.0064 | 0.0076 | 0.0070 | 0.0108 | 0.0342 | 0.0572 | |
| Asymmetry | Mean(Asym(RSC(CS(lat)))) | 0.0047 | 0.0060 | 0.0109 | 0.0117 | 0.0069 | 0.0145 |
| VAR(Asym(RSC(CS(lat)))) | 0.000011 | 0.000017 | 0.000069 | 0.000076 | 0.000021 | 0.000086 | |
| Mean(Asym(RSC(CS(ant)))) | 0.0071 | 0.0068 | 0.0064 | 0.0116 | 0.0118 | 0.0098 | |
| VAR(Asym(RSC(CS(ant)))) | 0.000026 | 0.000018 | 0.000030 | 0.000108 | 0.000069 | 0.000069 | |
| Mean(Asym(RSC(CS(post)))) | 0.0071 | 0.0031 | 0.0096 | 0.0108 | 0.0117 | 0.0091 | |
| VAR(Asym(RSC(CS(post)))) | 0.000023 | 0.000006 | 0.000053 | 0.000049 | 0.000104 | 0.000067 | |
| Mean(Asym(RSC(CCL))) | 0.0709 | 0.0587 | 0.0446 | 0.0287 | 0.0895 | 0.0518 | |
| VAR(Asym(RSC(CCL))) | 0.0017 | 0.0013 | 0.0015 | 0.0008 | 0.0031 | 0.0019 |
Table 3.
Shape variance (SV) and asymmetry levels (FA10) for the three semicircular canals (3 SCCs), lateral semicircular canal (LSCC), anterior semicircular canal (ASCC) and posterior semicircular canal (PSCC) for the six species.
Table 3.
Shape variance (SV) and asymmetry levels (FA10) for the three semicircular canals (3 SCCs), lateral semicircular canal (LSCC), anterior semicircular canal (ASCC) and posterior semicircular canal (PSCC) for the six species.
| G. moholi | P. granti | O. crassicaudatus | L. tardigradus | N. coucang | P. edwardsi | |
|---|---|---|---|---|---|---|
| 3 SCCs SV | 0.0015 | 0.0018 | 0.0020 | 0.0044 | 0.0039 | 0.0054 |
| 3 SCCs FA10 | 0.00035 | 0.00026 | 0.00046 | 0.00062 | 0.00099 | 0.00083 |
| LSCC SV | 0.0009 | 0.0013 | 0.0013 | 0.0029 | 0.0022 | 0.0043 |
| LSCC FA10 | 0.00045 | 0.00037 | 0.00059 | 0.00132 | 0.00087 | 0.00106 |
| ASCC SV | 0.0011 | 0.001 | 0.0011 | 0.0028 | 0.0023 | 0.0037 |
| ASCC FA10 | 0.00030 | 0.00021 | 0.00037 | 0.00055 | 0.00107 | 0.00086 |
| PSCC SV | 0.0013 | 0.0012 | 0.001 | 0.003 | 0.0022 | 0.0033 |
| PSCC FA10 | 0.00043 | 0.00024 | 0.00038 | 0.00054 | 0.00100 | 0.00083 |
Publisher’s Note: MDPI stays neutral with regard to jurisdictional claims in published maps and institutional affiliations. |
© 2021 by the authors. Licensee MDPI, Basel, Switzerland. This article is an open access article distributed under the terms and conditions of the Creative Commons Attribution (CC BY) license (https://creativecommons.org/licenses/by/4.0/).
Share and Cite
MDPI and ACS Style
Lebrun, R.; Perier, A.; Masters, J.; Marivaux, L.; Couette, S. Lower Levels of Vestibular Developmental Stability in Slow-Moving than Fast-Moving Primates. Symmetry 2021, 13, 2305. https://0-doi-org.brum.beds.ac.uk/10.3390/sym13122305
AMA Style
Lebrun R, Perier A, Masters J, Marivaux L, Couette S. Lower Levels of Vestibular Developmental Stability in Slow-Moving than Fast-Moving Primates. Symmetry. 2021; 13(12):2305. https://0-doi-org.brum.beds.ac.uk/10.3390/sym13122305
Chicago/Turabian StyleLebrun, Renaud, Alexandre Perier, Judith Masters, Laurent Marivaux, and Sébastien Couette. 2021. "Lower Levels of Vestibular Developmental Stability in Slow-Moving than Fast-Moving Primates" Symmetry 13, no. 12: 2305. https://0-doi-org.brum.beds.ac.uk/10.3390/sym13122305
Note that from the first issue of 2016, this journal uses article numbers instead of page numbers. See further details here.