
Trap Parameters Optimization Based on Metal Particle Dynamic Simulation Method


School of Electrical and Electronic Engineering, North China Electric Power University, Beijing 102206, China
*
Author to whom correspondence should be addressed.
Symmetry 2022, 14(6), 1187; https://0-doi-org.brum.beds.ac.uk/10.3390/sym14061187
Submission received: 24 May 2022
/
Revised: 3 June 2022
/
Accepted: 7 June 2022
/
Published: 9 June 2022
(This article belongs to the Special Issue Symmetry in High Voltage and Insulation Technology)
Abstract
:Insulation failure usually occurs in AC gas-insulated transmission (AC GIL) in field operation, in which the primary cause is the charged motion of metal particles in the electric filed. At present, the particle inhibition method applied is to design particle traps on the inner wall of the GIL shell. However, due to the large randomness of the charged motion for metallic particles and the limitations of field test methods, a particle trap has not yet been designed from the perspective of particle trapping effectiveness. In this paper, firstly, referring to the size of a running 252 kV AC GIL, a 1:1 scaled 3-D similarity simulation model is established to obtain the dynamic characteristics of particles with different sizes under the operating voltage level. This model can form symmetry between the real equipment, and its simulated simulation trajectory can achieve symmetry with the actual one. Secondly, an experimental platform that can easily capture the motion of the particles is set up to experimentally verify the symmetry between the field operating equipment and the simulation model. Finally, the particle traps are set on both sides of the concave and convex surface of the basin insulator, and an optimization scheme for the design of the particle trap is proposed from three aspects: the electric field regulation of the trap, the captured probability of particles, and the trap location. The proposed research shows that, with respect to the motion characteristics of the particles, this paper selects circular hole-shaped trap and its thickness, slot spacing, and slot width are 10 mm, 6 mm, and 8 mm, respectively. When the traps are arranged, one at the bottom of the shell at 70 mm and 80 mm from each side of the concave and convex insulator, the capture probability of the traps on both sides can be as high as 78% and 70%, respectively. Therefore, the analysis and optimization method in this paper has important reference value according to similarity concepts for optimizing particle traps in AC GIL at a certain voltage level.
1. Introduction
With the increasing scarcity of land resources in China, coupled with the huge pressure from ecological environment protection and the spatial constraints of special geographical areas, the traditional power transmission channel based on overhead lines is facing serious practical challenges. Therefore, a gas insulated metal-enclosed transmission line with SF6 and SF6/N2 mixed gas as insulation and arc extinguishing medium has been widely used in the field of AC transmission due to its advantages of high transmission level, large transmission capacity, small electromagnetic radiation, strong laying flexibility, and large environmental protection performance [1,2].
However, the inevitable existence of metal particles in gas insulation equipment will cause electric field distortion, and moving particles will cause air gap breakdown [3,4]. At the same time, the metal particles near the insulator are also subjected to the electrical gradient force generated by the axial uneven electric field and the Coulomb force generated by the charge accumulation on the insulator surface, so as to adsorb its surface, further aggravating the charge accumulation on the insulator surface and ultimately leading to the flashover fault of the insulator along the surface [5,6]. Therefore, in order to suppress the metal particles in the gas insulation system, or to prevent the particles from moving near the insulator, setting a particle trap on the inner wall of the GIL shell is the most direct and effective method. The particle traps can suppress particle movement by constructing a low electric field region, and the particle suppression effect is the most obvious and the most common particle suppression measure in AC GIL systems [7,8].
Over the years, scholars have continued to improve this method through experiments or field applications on the AC GIL equipment. As early as the 1970s, American researchers had begun to design AC particle traps [9,10] and proposed various AC GIL particle traps over the following decades [11]. Recent studies on particle traps have included: scholars placing particle traps near insulators in a true 1100 kV GIL and using experimental methods to obtain a step-by-step voltage application method that optimally inhibits particles in conjunction with particle traps [12]. Johannes et al. scholars, from the Technical University, Darmstadt, experimentally tested the effectiveness of particle traps for different gas mixtures by observing particle movement with a camera and evaluating the ultra-high frequency partial discharge amount [13]. Reference [14] calculates the characteristics of metal powder particle motion distribution at the rated voltage and evaluates the capture ability of the particle traps based on those characteristics. Chang et al., scholars from the North China Electric Power University, investigated the capture mechanism of particle traps in HVAC/HVDC GIL/GIS equipment using actual online operating conditions. The results showed that the collision motion mode is the main factor affecting the particle-capturing capability and further calculated the hazard index and minimum collision times. In addition, a novel trap structure, the wedge-shaped trap, has been proposed to improve the capture probability in the DC case [15]. In addition, the study of particle traps under DC stress conditions mainly considers the dynamic characteristics of particles, the reversal of DC polarity, and other special cases, and suggests the idea of setting particle traps in high-voltage conductors [16,17,18].
However, due to the random motion trajectory of metal particles in the GIL, a large number of experiments are needed to verify the effectiveness of the particle trap, which greatly limits the mobility of researchers [18]. Therefore, at present, some experts and scholars refer similarity concepts to AC GIL equipment, which effectively simulates the actual operation of AC GIL through field operation and sensing data [19].
Based on the above concepts, this paper establishes a 1:1 scaled similarity simulation model of a 252 kV AC GIL under actual operation and simulates the motion state of particles near the basin insulator under its operating voltage and obtains the motion characteristics of particles with different sizes. A variety of particle traps with various parameters are then set near the basin insulator, and the optimization scheme for the design of the particle trap is proposed from three perspectives, as follows: the electric field regulation, the capture effects of particle traps, and the trap location.
2. 3-D Similarity Simulation Model of Particle Motion
2.1. Geometric Similarity Model
The GIL in field operation is a mostly coaxial cylindrical structure, mainly composed of a closed metal shell, inner conductor, insulator, and insulating gas. In this paper, a geometric similarity model of 1:1 scale is established, referring to the size of a 252 kV GIL currently in field operation. Because the research content of this paper only involves the movement of metal particles in the pipeline, the external components, such as shell flanges and bolts, are ignored in the simplified model, thus forming a symmetry between the modelling and the actual equipment, as shown in Figure 1. The outer radius of the aluminum alloy inner conductor rod, R1, is 60 mm, the inner radius of the aluminum alloy shell, R2, is 180 mm, and the inner and outer radius of the basin insulator is 60 mm and 180 mm, respectively. Therefore, this model is symmetrical to the operating equipment on site. In this paper, in order to inhibit the activity of metal particles near the insulator, the particle trap is set at the inner wall of the shell near the concave and convex sides of the basin insulator in the simulation model.
2.2. Force and Motion Similarity Model of Metal Particles
The metal particles generated in AC GILs operating on site are of different shapes, but the analysis of their force situations shows that the types of forces acting on them are consistent, so in this paper we use spherical-shaped metal particles to simulate the different shapes of particles in the equipment. In the meantime, when studying the motion characteristics of charged metal particles near the basin insulator, the influence of the electric field gradient force caused by the axial uneven electric field and the Coulomb force caused by the accumulated charge on the insulator surface on the metal particles cannot be ignored. According to the force situation of metal particles shown in Figure 2, the force of metal particles moving near the insulator in the GIL system can include Coulomb force, Fq, gravity, G, electric field gradient force, Fd, and gas resistance, Fv.
According to the electrostatic analysis, the electrostatic field in the dielectric region of the particle at the time of collision with the electrode satisfies the Poisson equation, and the polarity of the charge carried by the particle is the same as that of the collision electrode. Therefore, the charge carried by the metal particle can be expressed as:
Among them, q is the positive and negative polar charge of metal particles, r is the particle radius, ε0 is the vacuum dielectric constant, ε1 is the relative dielectric constant of SF6, and E is the electric field intensity of the particle position.
Further, the Coulomb force, Fqz, caused by the high-voltage wire on the metal particles, and the Coulomb force, Fqy, caused by the accumulated charge on the insulator surface, can be obtained as follows:
In the formula, k is the electrostatic correction factor caused by mirror charge, and when the particle is on the electrode surface or close to the same polarity electrode, k = 0.832, or in other cases k = 1. σ is the accumulated charge density on the insulator surface, which can be ignored in the simulation because its value is too small.
In addition, the gravity of metal particle can be expressed as:
where ρm is the density of metal particles and g is gravity acceleration, 9.8 m2/s.
The electric field gradient force is the net force to which the dipole moment of the metal particles in an uneven electric field is subjected, independent of its charge, and its direction is always from low electric field strength to high electric field strength:
where m is the particles dipole moment.
The particles in motion are also subject to the resistance of SF6 gas, and its direction is opposite to that in motion:
In the formula, η is the aerodynamic viscosity, and the pure SF6 dynamic viscosity at one atmospheric pressure is 1.377 × 10⁻⁵ Pa·s.
In summary, the motion equation of non-collision moment in the rectangular coordinate system after the lifting of metal particles can be expressed as:
Among them, m is the particle mass, t is the particle motion time, and φ is the angle between the particle motion direction and the z axis.
2.3. Particle Elastic Mechanics Model
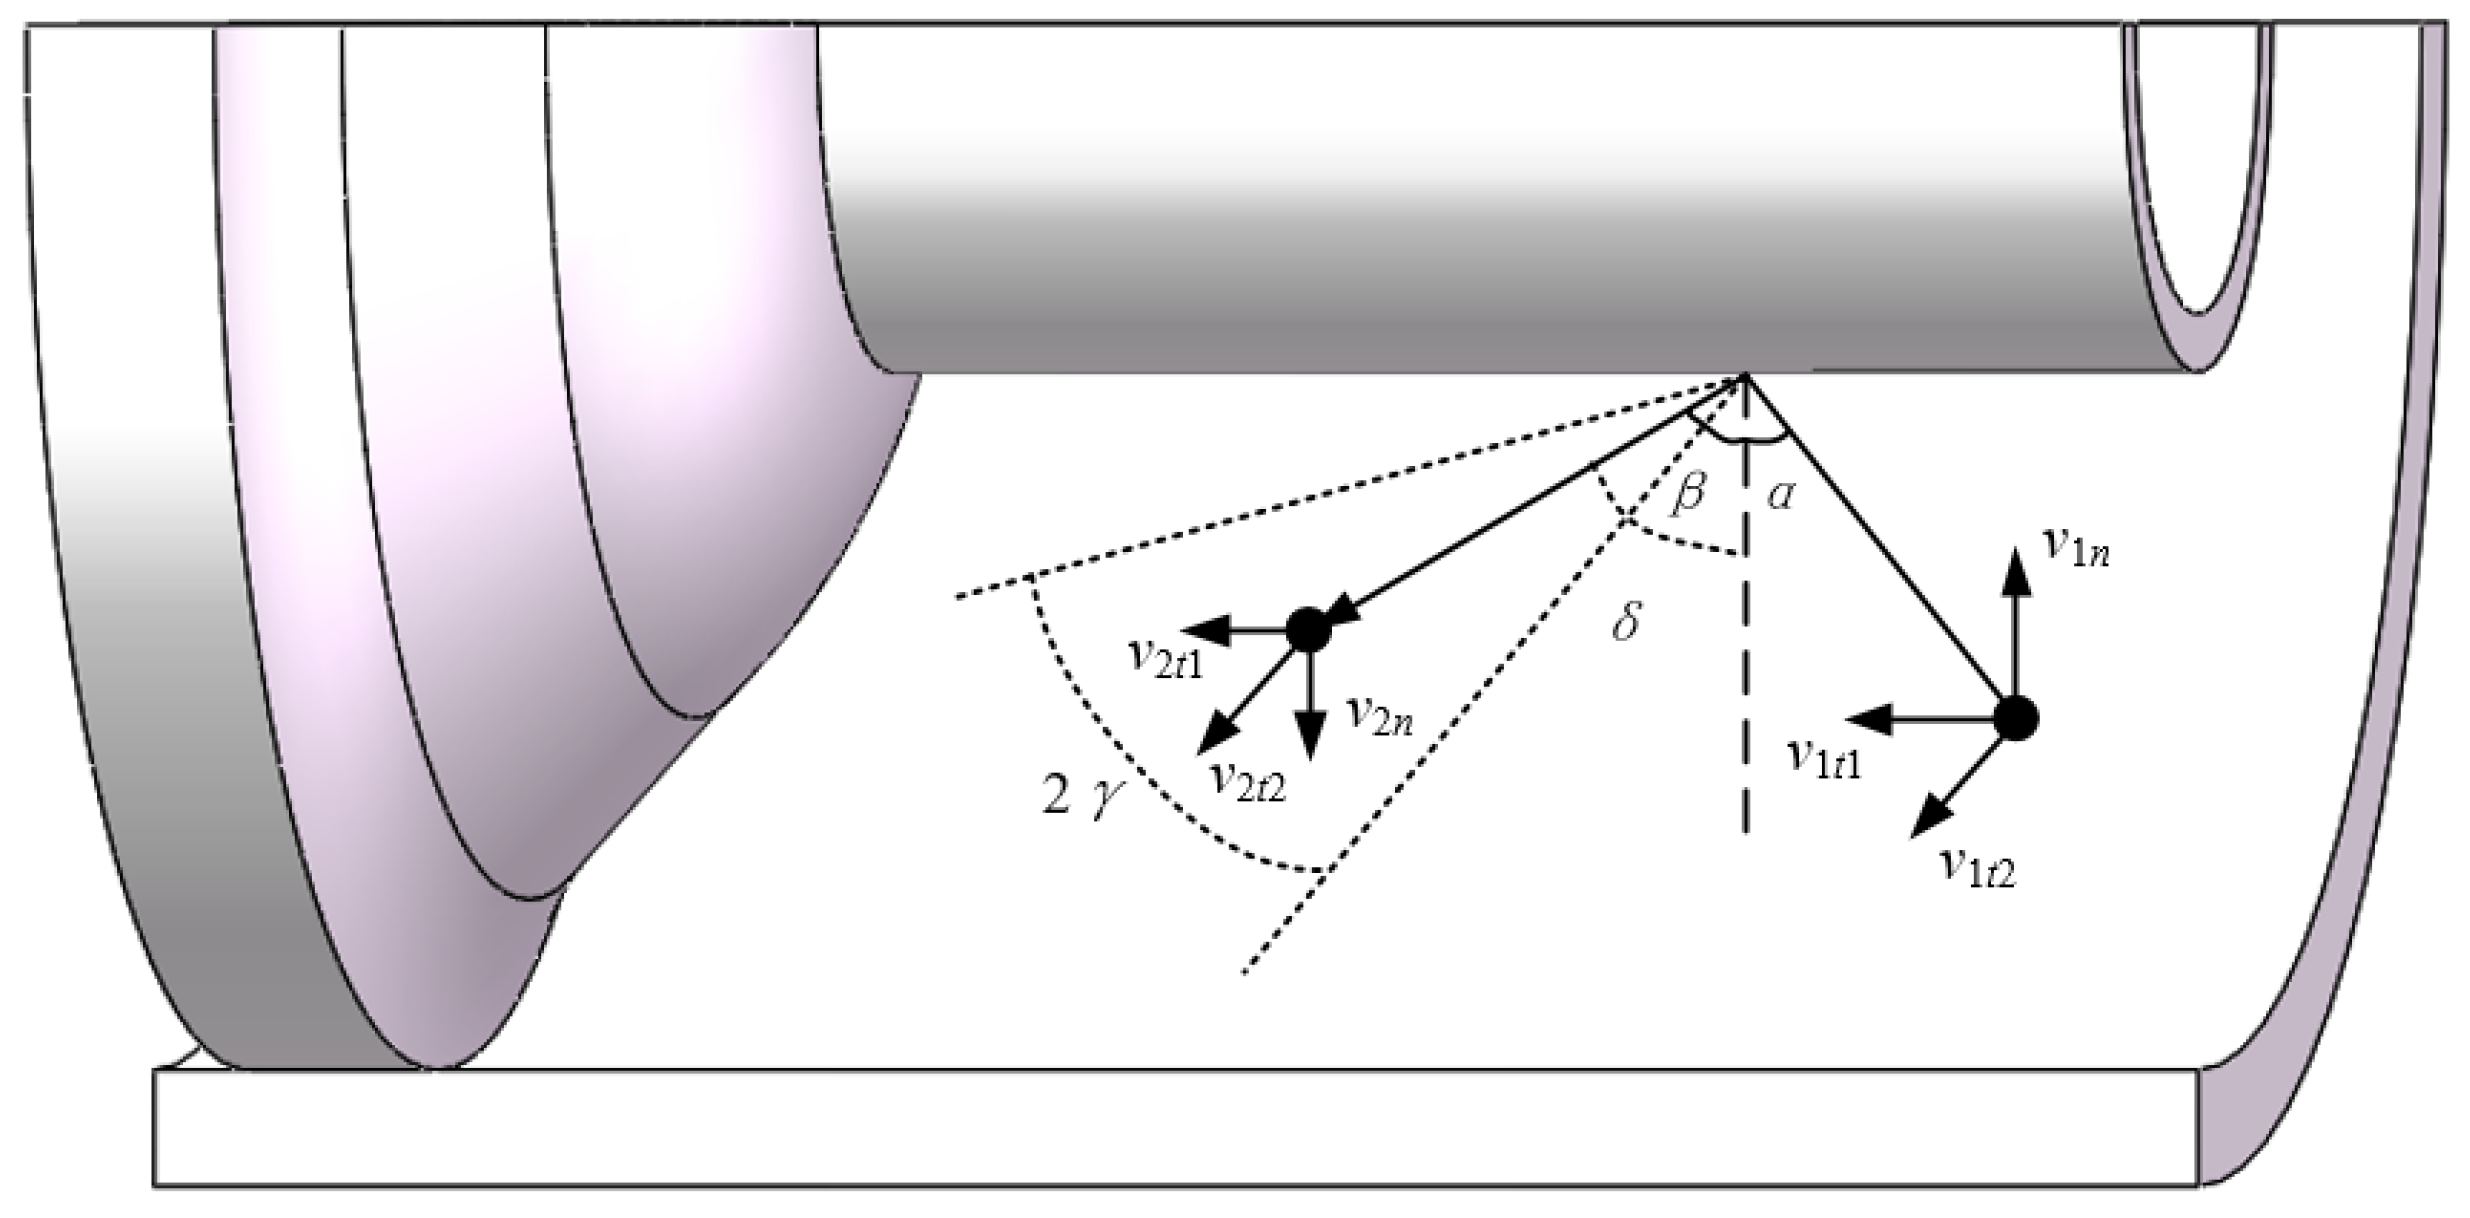
The complete elastic collision of macroscopical objects does not exist. After the spherical particles collide with the electrode, there will be a certain impact indentation, resulting in plastic deformation and friction. This process will cause the kinetic energy loss of the particles, which belongs to the inelastic collision. Therefore, the velocity recovery coefficient is usually used to express the process of the particle impact electrode. Because the normal and tangential collisions are essentially different when analyzing the three-dimensional collision process from a microscopic point of view, they can usually be decomposed into the decoupling of normal, n, of the collision surface, tangential t1 of the collision surface along the radial direction, and tangential t2 of the vertical relationship with n and t1, as shown in Figure 3, and the normal and tangential collisions are analyzed separately [20]:
In the formula, v1n and v2n are normal incidence velocity and reflection velocity, respectively; v1t and v2t are tangential incident velocity and reflection velocity, respectively; and hn and ht are normal and tangential velocity recovery coefficients, respectively.
According to the literature research, the relationship between the initial normal velocity of particles and the recovery coefficient of normal velocity is:
where the value range of v1n is 1.7~24 m/s, if v1n < 1.7 m/s and hn = 0.96. It can be seen that the normal velocity recovery coefficient decreases with the increase in the initial normal velocity, and the decreasing trend is gradually weak.
Because an electrode surface that has been collided by particles is not smooth, there is a certain roughness, so the particles along the shear deformation and friction work, thus consuming the kinetic energy of particles. Furthermore, due to the uneven surface roughness of the electrode and the randomness of the collision points, the velocity and direction of the particle reflection after collision are uncertain and have a strong random range; because the surface roughness of the high-voltage electrode and the shell is different, the range of random reflection angle is set to 2γi (i = 1, 2, see Figure 3), and the expression is
In the formula, i = 1 and 2 denote the collision of particles with the high-voltage electrode and shell, respectively. β is the reflection angle, α is the incident angle, and χ is the random number of collision rebound, and its range [−1, 1].
Therefore, according to the mathematical relationship, the tangential velocity after a particle collides with the electrode can be derived:
where δ is the reflection angle at the tangential direction, t2, which is similar to β.
Thus, the expression of a tangential velocity recovery coefficient of particles can be derived further:
3. Results and Analysis of 3-D Motion Simulation
3.1. 3-D Motion Simulation Calculationl
The simulation calculation steps are shown in Figure 4. Firstly, the simulation model and the setting of particle motion parameters are established. The radius of aluminum spherical particles is 0.1–1 mm, and the initial motion point is located at the inner wall of the shell 50 mm away from the horizontal line on both sides of the concave and convex surface of the basin insulator. The density is 2700 kg/m3; the gas pressure and viscosity coefficient of SF6 were 0.1 Mpa and 1.377 × 10⁻⁵ Pa·s, respectively. The random variation angles of the high-voltage electrode and shell were γ1 = 10° and γ2 = 20°, respectively. The simulation time is 2000 ms, and the time step is 0.1 s. Secondly, when the particle is still in the inner wall of the shell, the electric field force on the axis is very small [21], so it is difficult to overcome the static friction of the particle. However, in the radial direction, once the particle satisfies Fq + Fd ≥ G, the particle can be lifted.
The motion parameters of particles at the time of non-collision after starting the charged motion are calculated by Equations (7) and (8), while the charged amount and motion parameters after the collision are calculated by Equations (1) and (9)–(17). The process is repeated until the total simulation time is reached. Compared with the DC voltage, the direction of the power frequency voltage is constantly changing, and the direction of the electric field force on the particle can also change at any time. Therefore, compared with the DC voltage, the particle trajectory is denser, showing the phenomenon of frequent collision with the inner surface of the shell, and the maximum height that the particle can reach is lower than that under the DC voltage.
3.2. Motion Characteristics of Metal Particles with Different Size under Operating Voltage Level
The operating voltage of a 252 kV GIL is 145 kV, so the voltage in the simulation is set to this operating voltage, and the spherical aluminum particles with a radius of 0.1–1 mm are released to study the dynamic characteristics of particles with different sizes. Figure 5 shows the dynamic characteristics of particles with a radius of 0.1 mm at the concave and convex insulator.
From the dynamic characteristics of the above particles, it can be seen that the metal particles near the convex insulator are mostly close to the insulator lifting, while the particles are far away from the insulator lifting when they are near the concave insulator. However, the particles are likely to collide with the basin insulator again after they collide with the ground electrode during long-term movement. In addition, the motion activity of metal particles can be comprehensively expressed by their jump height, h, crawling distance, x, and motion distribution, θ, respectively. Due to the randomness of particle movement, each group of particles with different sizes runs 10 times, so as to obtain the average values of the particle dynamic values h, x, and θ. Table 1 shows the average dynamic values of h, x, and θ for particles of different sizes.
It can be seen from the above table that the smaller the size, the greater the motion activity is, and the dynamic value of the most active particle with a radius of 0.1 mm is h = 78 mm, x = 150 mm, θ = 80°, and vmax = 1.89 m/s. When the radius is greater than 0.6 mm, the dynamic values of particles are 0. Because the applied voltage is 50 Hz AC power, the polarity of the high-voltage electrode changes periodically with time. If the charged polarity of the particles in the air gap remains unchanged after the particles are lifted with negative polar charges, the Coulomb force and the electric field gradient force of the high-voltage electrode with positive polarity within 10 ms are greater than those of the gravity and accelerate forward. On the contrary, in the following 10 ms, when the high-voltage electrode is negative, the particle is subjected to the same Coulomb force and gravity direction, which slows down to 0, and then moves in the direction of the shell. Therefore, the motion of particles shows a fluctuation state. At the same time, it can also be found that the smaller the size of metal particle, the larger its dynamic value, but its velocity eventually tends to a certain average value. This is because, with the increase in particle velocity, the gas resistance is also greater, so the coulomb force, electric field gradient force, gravity, and gas resistance of the particle tend to find a balance point.
3.3. Experimental Verification
In order to verify the symmetry between the similarity modelling and the real equipment, an equally-scaled experimental platform was built that could be easily photographed, and the side view of the chamber is shown in Figure 6. The side cover of the chamber edge is a light-transmissive glass cover, on the opposite side of which a high-speed camera is set up. The chamber is filled with 0.1 MPa SF6 for the experiment.
Figure 7 shows the motion trajectory of a particle with a radius of 0.1 mm in the experimental platform when the applied voltage is the operating voltage. As can be seen from the trajectory diagram, the smaller-sized particles are highly active in motion and collide with the basin insulator, which is highly consistent with the simulation results shown in Figure 5. Therefore, the experimental results can verify the symmetry between the modelling and the real equipment. Due to the strong randomness of particle motion, it is not possible to verify the trap capture capability work through a large number of experiments, so this can be replaced by highly accurate simulations, resulting in multiple valid runs with reliable simulation results.
4. Optimization of Particle Trap
In the field operation, in the GIL, the particle trap is usually set to suppress the movement activity of metal particles. Usually, the trap for the inhibition of charged moving particles can include two aspects:
1. Inhibitory effect on charge: When particles enter the trap, they will collide with the bottom or sidewall of the trap. Because the particle trap has a shielding effect on the electric field, the bottom electric field will be far less than the unarranged particle trap. Therefore, from formulas (1) and (2), it can be seen that the Coulomb force of the particle decreases rapidly and is less than the gravity. If the rebound velocity of the particle is small, the particle will be captured. When the particle collides with the trap sidewall, the normal field strength of the collision position is almost zero due to the parallel direction of the sidewall and the electric field. According to formula (1), the charge carried by the particle is approximately zero, and the Coulomb force is very small.
2. Inhibitory effect on collisions: Energy loss will occur after collisions between particles and traps, resulting in a decrease in particle velocity and random reflection. If particles collide multiple times in a single slot of the trap, the velocity decreases continuously until the particles are successfully captured by the trap.
Therefore, it can be seen from the above analysis that the main parameters affecting the trapping ability of particle traps include trap slot shape, trap radian, Θ, trap thickness, H, trap slot spacing, J, and trap slot width, K. According to the content of Section 3, the most active particle dynamic value, θ, does not exceed 90°, so this paper sets the trap radian, Θ, as 90°. In addition, the capture effect of traps on particles increases monotonically with the increase in the number of slots and the decrease of the slot spacing, J. However, when the number of slots reaches a certain amount, the capture effect of traps tends to be saturated, and the decrease of the slot spacing will aggravate the distortion of the electric field strength near the top of the traps, and can even form a spike at the bottom of the pipeline. Therefore, this paper selects the number of slots as eight, and the slot spacing is 6 mm. As shown in Figure 8, this paper adds a circular hole-shaped trap and a grid-shaped trap and compares it with the traditional fence-shaped trap.
At the same time, when the trap parameters are optimized, in this paper, the strong randomness of metal particles in the collision process between electrodes is taken into account. Based on the Monte Carlo method, the random probability model of metal particle suppression is established by the MATLAB program (MathWorks, Natick, MA, America). That is, this model can run a COMSOL motion simulation under different conditions 20 times, and the probability of the successful capture of metal particles with different sizes with small rebound velocity is obtained.
As shown in Figure 9, in the simulation, it is assumed that when the particle moves to the trap area, there are three motion states: 1. The particle is not trapped and collides with the upper part of the trap and rebounds; thus, it does not enter the groove; 2. The particle is trapped and captured, and the literature shows that the particle cannot escape when the collision rebound velocity is less than 0.3 m/s after trapping; 3. The particle sinks but escapes, that is, the collision rebound velocity with the trap groove is greater than 0.3 m/s, and the particle then leaves the trap range again. Therefore, the trap capture rate, pcap, under different working conditions can be expressed as:
In the formula, NII is the number of particles arrested and Nsum is the total emission number of particles.
4.1. Optimization of Electric Field Control for Particle Trap
The purpose of the electric field regulation of the particle trap is to suppress the charge after the particle is trapped; that is, the more obvious the electric field shielding effect of the trap, the more favorable it is. Therefore, this section optimizes various parameters of particle traps from the perspective of electric field shielding. According to the particle motion simulation results in Section 3, this paper selects the thickness, H, range of each shape trap as 7 mm, 8 mm, 10 mm, 12 mm, and 13 mm, and the range of slot width, K, is 5 mm, 6 mm, 8 mm, 10 mm, and 11 mm (the K of grid-shaped traps is 5 mm ∗ 11 mm, 6 mm ∗ 12 mm, 8 mm ∗ 14 mm, 10 mm ∗ 16 mm, and 11 mm ∗ 17 mm, respectively); therefore, a total of 75 trap parameters are analyzed. Figure 10 shows the average shielded electric field intensity at the slot and the maximum distorted electric field intensity at the top of the trap under the different parameters of the three trap shapes.
It can be seen from the figure above that, regardless of the shape of the trap, its thickness, H, and slot width, K, will have a significant indigenous impact on the effect of the electric field, shielded or distorted. The simulation results show that, with the increase in trap thickness, H, the average shielded electric field intensity at the slot decreases consistently, which will be conducive to the capture of the particles. However, the top of the trap will cause a large distortion of the surrounding electric field strength, and the distortion degree increases with the increase in the trap thickness. On the contrary, with the increase in slot width, K, the average shielded electric field intensity at the groove increases consistently, but the distortion of the surrounding electric field caused by the top edge of the trap will decrease. Therefore, it is necessary to limit the trap thickness, H, and groove width, K.
At the same time, through the analysis of the regulation effect of the nearby electric field under different sizes of trap with different shapes in Figure 7, the circular hole-shaped trap has the lowest reduction of electric field intensity at the slot, which can decrease by nearly 93.25%. The top edge of the grid-shaped trap has the largest distortion of electric field intensity, which increases by about 63.48%. Therefore, according to the above quantitative analysis, from the angle of the shielding electric field effect of the trap slot, the circular hole-shaped trap is the best; the traditional fence-shaped trap has the smallest distortion field intensity from the top of the trap. Therefore, it is necessary to further optimize the trap parameters near the insulator from the perspective of the particle trapping effect.
4.2. Optimization of Trap Parameters Considering Trap Capture Probability
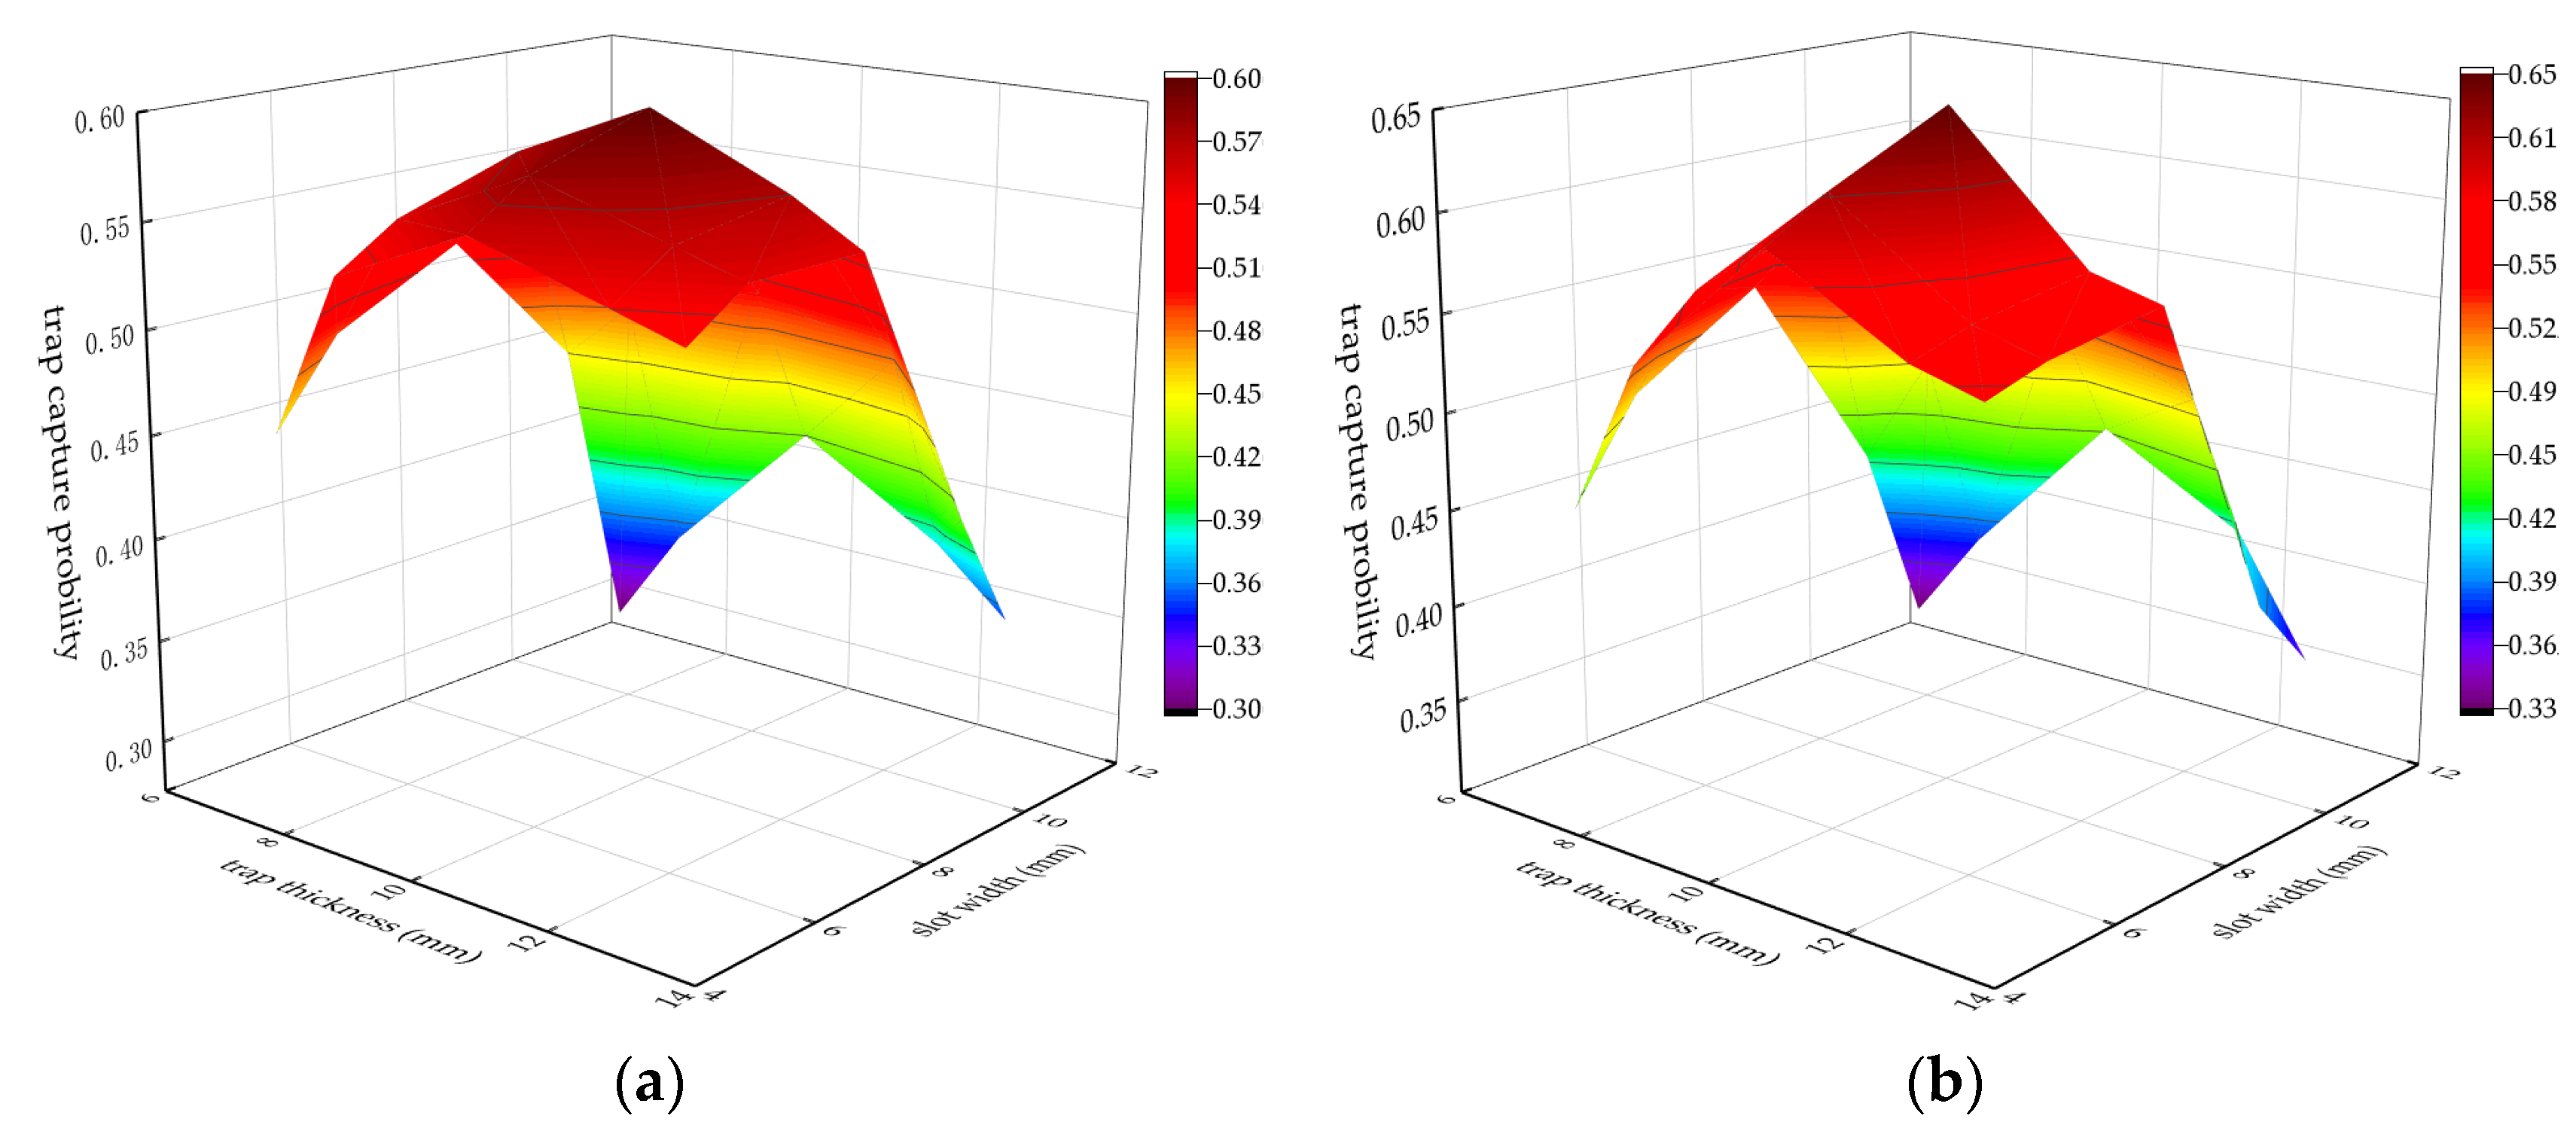
According to the analysis results from the perspective of electric field regulation in the previous section, this section mainly focuses on the fence-shaped trap and circular hole-shaped trap. Figure 11 shows the distribution of particles-captured probability under the different parameters of the two traps.
According to the capture probability of the above two shaped traps under different parameters, it is easy for the second escape phenomenon to occur when the trap thickness is small, thus reducing the effect of the trap to capture the metal particles. However, when the trap thickness is large, the metal particles collide with the outer boundary of the trap many times, and the recovery speed after rebound is very large. This is due to the high distorted electric field intensity at the top of trap, which will reduce trap capture ability. When the slot width of the trap increases appropriately, the probability of metal particle being trapped changes very little, but the trapping time decreases. However, as can be seen from Section 4.1, the average shielded electric field intensity at the trap groove increases when the trap width is too large, thus increasing the probability of the secondary escape of particles.
Finally, the trap parameters are optimized from the perspective of particle trapping probability. When the parameters of the circular hole-shaped trap (H, J, K) = (10, 6, 8) mm, the probability of a particle being successfully captured is the maximum, and can reach approximately 65%. In this paper, it is concluded that: first of all, the circular hole-shaped trap has a good shielding effect of the electric field, so the thin thickness can have a good inhibitory effect on the entrapped particles; secondly, when the thickness and slot width are in a smaller range, the distorted electric field intensity at the top of the trap is small, so that the rebound height of particles after collision with the trap slot is low; that is, the probability of being captured will be greatly improved after the activity is weakened.
4.3. Trap Optimization Scheme under Comperhensive Consideration
There are many main factors affecting the trapping ability of particle traps. Therefore, in order to improve the trapping ability of particle tarps for moving particles near basin insulators, in addition to the factors analyzed in the above two sections, the specific location of particle traps should also be considered. This section selects the circular hole-shaped trap and its parameters for (H, J, K) = (10, 6, 8) mm, and optimizes the location of traps on both sides of the concave and convex surfaces of the basin insulator through simulation calculation.
According to the dynamic characteristics of particles after lifting on both sides of the concave and convex surface of the basin insulator in Section 3, the distribution characteristics of particle collision shell when particles of different sizes move on both sides of the concave and convex surface of the insulator are shown in Table 2.
According to the above collision distribution characteristics, the trap positions are set at 40–100 mm from the bottom of the insulator. Figure 12 shows the capture probability of the trap at different distances on both sides of the concave and convex surface of the basin insulator when the release particle radius is 0.3 mm.
For convex insulators, the crawling distance of particles after colliding with the insulator is long, so the trap is arranged in a slightly distant position, which has the best effect. However, if the distance is too far, it is not good for small particles, or the capture time is too long or the activity of particles is too large to be suppressed when they reach the trap area. On the contrary, after the particle collides with the concave insulator, its crawling distance is short, and its activity is weaker than that of the convex insulator side. Therefore, when the traps on the concave and convex side are set at 70 mm and 80 mm, the capture efficiency of the traps is the best, that is, up to 78% and 70%, respectively.
5. Conclusions
In this paper, a 3-D simplified simulation model for analyzing the movement of metal particles in a GIL was established according to a 252 kV AC GIL operating on site. This model can be symmetrical with the operating equipment on site. The dynamic characteristics of particles with different sizes under the operating voltage level were simulated and analyzed. At the same time, by setting up an experimental platform, the symmetry between the modelling and the field operating equipment was experimentally verified. Finally, through a significant amount of simulation calculations, the optimized parameters and the layout strategy of particle traps for a 252 kV AC GIL were proposed. The simulation results show that, firstly, under the operating voltage level, the particles with a radius greater than 0.6 mm do not have dynamic processes, and the smaller the particle size, the more active it is. Secondly, after multi-dimensional analysis of particle traps, such as electric field regulation at the trap slot, particles-captured probability, and trap layout strategy, the following optimization schemes are obtained: The circular hole-shaped trap and its thickness, slot spacing, and slot width were 10 mm, 6 mm, and 8 mm, respectively; the layout strategies are 80 mm and 70 mm from the bottom of the convex and concave insulator, respectively. This optimized scheme enables traps arranged on both sides of the convex and concave insulator to have a capture probability of up to 70% and 78%. Thus, according to similarity concepts, the optimization simulation scheme for the main parameters affecting the capture probability of the particle traps is proposed, which will have a certain reference value for the optimization of particle traps for a certain voltage level AC GIL in the future.
Author Contributions
Conceptualization, J.W. and Y.C.; methodology, A.P.; software, A.P.; validation, A.P.; formal analysis, R.L.; investigation, R.X.; resources, R.X.; data curation, J.W.; writing—original draft preparation, A.P.; writing—review and editing, A.P.; visualization, A.P.; supervision, J.W. and Q.L.; project administration, J.W.; funding acquisition, R.L. All authors have read and agreed to the published version of the manuscript.
Funding
National Natural Science Foundation of China (No. 52177140), the Fundamental Research Funds for the Central Universities (No. 2022JG003).
Institutional Review Board Statement
Not applicable.
Informed Consent Statement
Not applicable.
Conflicts of Interest
The authors declare no conflict of interest.
References
- Sun, L.; Liu, H.B.; Bian, D. Influence factors of stability on offshore HVDC transmission systems. J. Coast. Res. 2019, 93, 561–571. [Google Scholar] [CrossRef]
- Takinami, N.; Kobayashi, S.; Miyazaki, A. Application of the world’s longest gas insulated transmission line in Japan. In Proceedings of the IEEE 7th International Conference on Properties and Applications of Dielectric Material, Nagoya, Japan, 1–5 June 2003. [Google Scholar] [CrossRef]
- Zhang, L.; Cheng, H.; Wei, W.; Ayubi, B.L.; Bretas, A.S. Suppression on particle movement and discharge by nanocomposite film coating on DC GIL electrode surface. IEEE ACCESS 2021, 9, 126095–126103. [Google Scholar] [CrossRef]
- Wang, J.; Li, Q.M.; Li, B.T.; Chen, C.; Liu, S.H.; Ji, H.X. Motion analysis of spherical metal particle in AC Gas-insulated lines: Random effects and resistance of the SF6/N2 mixture. IEEE Trans. Dielectr. Electr. Insul. 2017, 23, 2617–2625. [Google Scholar] [CrossRef]
- Iwabuchi, H.; Matsuoka, S.; Kumada, A.; Hidaka, K.; Hoshina, Y.; Yasuoka, T.; Takei, M. Influence of tiny metal particles on charge accumulation phenomena of GIS model spacer in high-pressure SF6 gas. IEEE Trans. Dielectr. Electr. Insul. 2013, 20, 1895–1901. [Google Scholar] [CrossRef]
- Moukengue, I.A. The influence of the dielectric strength of the N2/SF6-insulation by conducting particle on the spacer surface. IEEE Trans. Dielectr. Electr. Insul. 2003, 10, 483–490. [Google Scholar] [CrossRef]
- Wang, J.; Hu, Q.; Chang, Y.N.; Wang, J.R.; Liang, R.X.; Tu, Y.P.; Li, C.Y.; Li, Q.M. Metal particle contamination in gas-insulated switchgears/gas-insulated transmission lines. CSEE J. Power Energy Syst. 2021, 7, 1011–1025. [Google Scholar] [CrossRef]
- Morcos, M.; Ward, H.; Anis, H.; Srivastava, K.D.; Gubanski, S.M. Insulation integrity of GIS/GITL systems and management of particle contamination. IEEE Trans. Dielectr. Electr. Insul. 2000, 16, 25–37. [Google Scholar] [CrossRef]
- Banford, H.M. Particles and breakdown in SF6 insulated apparatus. Proc. Inst. Electr. Eng. 1976, 123, 877–881. [Google Scholar] [CrossRef]
- Itaka, K.; Hara, T.; Misaki, T.; Tsuboi, H. Improved structure avoiding local field intensification on spacers in SF6 gas. IEEE Power Eng. Rev. 1983, PAS-102, 250–255. [Google Scholar] [CrossRef]
- Dale, S.J.; Hopkins, M.D. Methods of particle control in SF6 insulated CGIT systems. IEEE Trans. Power Appar. Syst. 1982, 6, 1654–1663. [Google Scholar] [CrossRef]
- Zhang, B.; Yao, Y.Q.; Wang, Z.J.; Tan, S.W.; Wang, Z.G.; Zhong, L.S.; Du, Y.Q.; Zhang, H.; Liu, Y.P. Research on the dynamic capture by particle trap in 1100 kV gas insulated transmission line for metal particles. In Proceedings of the 2019 IEEE 3rd Conference on Energy Internet and Energy System Integration, Changsha, China, 8–10 November 2019. [Google Scholar] [CrossRef]
- Johannes, W.; Volker, H.; Daniel, R.W.; Felix, G.; Karsten, J. Investigation of free-moving particles under AC electric field in different insulating gas mixtures. IEEE Trans. Dielectr. Electr. Insul. 2021, 28, 672–680. [Google Scholar] [CrossRef]
- Zhan, Z.Y.; Wang, D.; Xie, J.; Xin, W.F.; Wang, W.; Zhang, Z.Q. Motion characteristics of metal powder particles in AC GIL and its trap design. IEEE ACCESS 2021, 9, 68619–68628. [Google Scholar] [CrossRef]
- Chang, Y.N.; Liu, Z.P.; Li, Q.M.; Xue, N.F.; Wang, J.; Hadad, M. Capture mechanism and optimal design of micro-particle traps in HVAC/HVDC gas insulated equipment. IEEE Trans. Power Deliv. 2022, 1–10. [Google Scholar] [CrossRef]
- Wang, Z.Y.; Wang, J.; Li, Q.M.; Ni, X.R.; Li, B.T. Three dimensional simulating and experimental study on the influential factors of the effectiveness of the DC-GIL particle trap. In Proceedings of the 1st International Conference on Electrical Materials and Power Equipment, Xi’an, China, 14–17 May 2017. [Google Scholar] [CrossRef]
- Berg, T.; Juhre, K.; Fedtke, T.; Koch, H.; Neuman, C. Specific Characteristics of Particle Traps for Application in DC Gas-Insulated Transmission Lines (DC GIL). In Proceedings of the VDE High Voltage Technology 2020, ETG-Symposium, online. 9–11 November 2020; pp. 1–8. [Google Scholar]
- Chang, Y.N.; Liu, C.H.; He, J.; Wang, J.; Wang, J.R.; Li, Q.M. Design and optimization of particle traps in DC GIL based on the capture effect analysis. In Proceedings of the 2019 IEEE Conference on Electrical Insulation and Dielectric Phenomena, Richland, WA, USA, 20–23 October 2019. [Google Scholar] [CrossRef]
- Zang, Y.M.; Qian, Y.; Wang, H.; Xu, A.T.; Zhou, X.L.; Sheng, G.H.; Jiang, X.C. A novel optical localization method for partial discharge source using ANFIS virtual sensors and simulation fingerprint in GIL. IEEE Trans. Instrum. Meas. 2021, 70, 3522411. [Google Scholar] [CrossRef]
- Sun, Q.Q.; Luo, C.J.; Wang, F.; Chen, H.; Wang, F. Jumping characteristics of metal particle on the surface of DC gas insulated transmission line conductor. Trans. China Electrotech. Soc. 2018, 33, 5206–5216. (In Chinese) [Google Scholar] [CrossRef]
- Hara, M.; Sakai, K.; Tsuru, S.; Abella, D.L. Particle-triggered breakdown mechanism in the presence of DC and AC electrical gradient forces in atmospheric air. In Proceedings of the 11th International Symposium on High Voltage Engineering ISH, London, UK, 27–23 August 1999. [Google Scholar] [CrossRef]
Figure 1.
Simplified geometric model of 252 kV GIL pipeline.

Figure 2.
The force situation of metal particles.

Figure 3.
Random phenomenon of collision reflection between metal particles and electrode.

Figure 4.
Calculation steps of particle motion simulation.

Figure 5.
Dynamic characteristics of 0.1 mm radius particle under 252 kV GIL operating voltage; (a,c,e,g) and (b,d,f,h) are the dynamic characteristics of the particle near the convex and concave insulator. Among them, (a–b) are the 3-D panoramic view, (c–d) are the y-z axial section, (e–f) are the x-z axial section, and (g–h) are the x-y axial section.


Figure 6.
The side view of the experimental chamber.

Figure 7.
The particle trajectory measured by the experiments.

Figure 8.
Main parameters of particle trap. (a) traditional fence-shaped trap, (b) circular hole-shaped trap, (c) grid-shaped trap.
Figure 8.
Main parameters of particle trap. (a) traditional fence-shaped trap, (b) circular hole-shaped trap, (c) grid-shaped trap.

Figure 9.
Motion state of metal particles in trap area.

Figure 10.
The regulation of the electric field near traps with different shapes under their different parameters. (a–c) the average shielded electric field intensity at the slot of a fence-shaped trap, a circular hole-shaped trap, and a grid-shaped trap, (d–f) the maximum distorted electric field intensity at the top of a fence-shaped trap, a circular hole-shaped trap, and a grid-shaped trap.


Figure 11.
Particles-captured probability of different shaped traps with different parameters. (a) the fence-shaped trap, (b) the circular hole-shaped trap.
Figure 11.
Particles-captured probability of different shaped traps with different parameters. (a) the fence-shaped trap, (b) the circular hole-shaped trap.

Figure 12.
The captured probability of traps at different locations.


Table 1.
The average dynamic values of h, x, and θ for particles of different sizes.
| Particle Size/mm | 0.1 | 0.2 | 0.3 | 0.4 | 0.5 |
|---|---|---|---|---|---|
| Dynamic values (h, x, θ) | (78, 150, 80) | (70, 120, 60) | (55, 85, 35) | (30, 45, 10) | (15, 30, 10) |
Table 2.
Distribution of collision shell when particles of different sizes move on both sides of concave and convex surfaces.
Table 2.
Distribution of collision shell when particles of different sizes move on both sides of concave and convex surfaces.
| Distance from Bottom of Convex Surface | Distance from Bottom of Concave Surface | |||||
|---|---|---|---|---|---|---|
| 0–40 mm | 40–80 mm | More than 80 mm | 0–40 mm | 40–80 mm | More than 80 mm | |
| 0.1–0.2 mm particles | 0.05 | 0.15 | 0.80 | 0.23 | 0.45 | 0.32 |
| 0.3–0.4 mm particles | 0.10 | 0.25 | 0.65 | 0.29 | 0.56 | 0.15 |
| 0.5 mm particles | 0.24 | 0.20 | 0.56 | 0.30 | 0.60 | 0.10 |
Publisher’s Note: MDPI stays neutral with regard to jurisdictional claims in published maps and institutional affiliations. |
© 2022 by the authors. Licensee MDPI, Basel, Switzerland. This article is an open access article distributed under the terms and conditions of the Creative Commons Attribution (CC BY) license (https://creativecommons.org/licenses/by/4.0/).
Share and Cite
MDPI and ACS Style
Ping, A.; Wang, J.; Xiao, R.; Liu, R.; Chang, Y.; Li, Q. Trap Parameters Optimization Based on Metal Particle Dynamic Simulation Method. Symmetry 2022, 14, 1187. https://0-doi-org.brum.beds.ac.uk/10.3390/sym14061187
AMA Style
Ping A, Wang J, Xiao R, Liu R, Chang Y, Li Q. Trap Parameters Optimization Based on Metal Particle Dynamic Simulation Method. Symmetry. 2022; 14(6):1187. https://0-doi-org.brum.beds.ac.uk/10.3390/sym14061187
Chicago/Turabian StylePing, An, Jian Wang, Ruofan Xiao, Renying Liu, Yanan Chang, and Qingmin Li. 2022. "Trap Parameters Optimization Based on Metal Particle Dynamic Simulation Method" Symmetry 14, no. 6: 1187. https://0-doi-org.brum.beds.ac.uk/10.3390/sym14061187
Note that from the first issue of 2016, this journal uses article numbers instead of page numbers. See further details here.