
Statistical Assessment of Low-Cycle Fatigue Durability


Faculty of Mechanical Engineering and Design, Kaunas University of Technology, Studentų Str. 56, 51424 Kaunas, Lithuania
*
Author to whom correspondence should be addressed.
Symmetry 2022, 14(6), 1205; https://0-doi-org.brum.beds.ac.uk/10.3390/sym14061205
Submission received: 20 May 2022
/
Revised: 4 June 2022
/
Accepted: 7 June 2022
/
Published: 10 June 2022
(This article belongs to the Special Issue Symmetry and Asymmetry Principles in Latest Advances and Prospects of the Materials Science and Engineering)
Abstract
:This article presents an experimental–analytical statistical study of low-cycle fatigue to crack initiation and complete failure. The application of statistical and probability methods provides for the possibility of improving the characteristics related to the structural life and the justification for the respective values of cyclic loads in the design stage. Most studies investigating statistical descriptions of crack initiation or complete failure do not analyse the distribution of the characteristics, correlation relationships, and statistical parameters of low-cycle fatigue. Low-cycle failure may be quasistatic or (due to the fatigue) transient. Materials with contrasting cyclic properties were selected for the investigation: cyclically softening alloyed steel 15Cr2MoVA; cyclically stable structural steel C45; cyclically hardening aluminium alloy D16T1. All samples were produced in a single batch of each respective material to reduce the distribution of data. The lowest values of the variation coefficient of one of the key statistical indicators were obtained using the log-normal distribution, which is superior to the normal or Weibull distribution. Statistical analysis of the durability parameters showed that the distribution was smaller than the parameters of the distribution of the deformation diagram. The results obtained in the study enable the verification of durability and life of the structural elements of in-service facilities subjected to elastoplastic loading by assessing the distribution of characteristics of crack initiation and failure and low-cycle strain parameters as well as the permissible distribution limits.
1. Introduction
The improvement in the durability and reliability of power, chemical, transport, and mining facilities and machines, as well as civil structures, is associated with a variety of factors that have an effect on the limit states and determine the strength of individual elements and entire structures. As a result of breakdowns, equipment must be stopped, the risk of catastrophe increases, and considerable material losses arise. Such failures prove that the design, manufacture, and maintenance methods for a number of facilities are not perfect. During the determination or revision of the life of potential hazardous facilities being designed or used, it is necessary to ensure the strength of each element by exploiting all aspects of the durability properties of the materials [1,2,3,4].
Structural elements and the linked large parts (i.e., covers, frames, and supports) are subject to a whole spectrum of loads. Their strength is considerably affected by the stress–strain state that develops in the environment of manufacturing and operational defects [5]. The majority of manufacturing defects (pores, cracks, inclusions, etc.) emerge in the casting process. Operational defects (primarily friction cracks) arise under normal and disturbed operating conditions [6,7]. Stopping fatigue cracks and the limit state of the process (i.e., the respective conditions that prevent the development of cracks) have considerable influence on the safe operation of the structures. If there are no defects in the structure or emergence thereof during operation, the defects will not reach critical values to ensure safe operation. Evaluation of the effect of defects upon the detection of a defect or crack is a complex process that requires both theoretical and experimental investigations. Nonuniformity of the statistical parameters of durability under low-cycle loading is explained by such reasons as heterogeneity of the macro- and microstructures, surface defects, conditions of the experiments, chemical composition, and metallurgical factors. Comparison of low-cycle and high-cycle fatigue has suggested that certain factors have a greater effect on the low-cycle strain, while others—on the high-cycle strain.
For greater reliability and safety of a structure or product during its operation, statistical probabilistic methods are used [8,9,10]. Basic fatigue resistance patterns are analysed according to the probabilistic distribution of independent events that allows for assessment of the key durability characteristics using statistical information. In the probabilistic forecasting of life and reliability in relation to failure, permissible stresses that depend on factors, conditions, and loading of the structure are determined [11]. The reliability and final life of a structure are influenced by the scattering of durability cycles, random deviations of the loads, and a prolonged stress load that causes fatigue failures. The scattering of the points of the fatigue curve reflects the nonuniformity of the material, which depends on the factors of the metallurgical and production processes and signals the action of external factors during operation [12].
Integrated probabilistic studies of low-cycle strength are used as a scientific basis for assessing durability, safety factors, and service time. Key statistical design, process, and operational factors are considered during these types of investigations including key mechanical and durability properties, welded joints and defects thereof, stationarity and randomness of external loads, degree of utilisation of the service life at a certain stage of service, and adaptation of structural elements to operational actions [13]. The importance of probabilistic calculation methods, probabilistic assessment of the permissible stresses, and determination of the strength safety margin in static and cyclic strength calculations is based on the contribution of prominent researchers such as W. A. Weibull [14,15]; A. M. Freudenthal; E. J. Gumbel [16,17]; K. Iida and H. Inoue [18]; S. V. Serensen; J. V. Giacintov; V. P. Kogaev [19,20]; M. N. Stepnov [21].
The application of probabilistic methods of strength and durability to various structures has become more frequent. These methods enable the use of statistical data on mechanical characteristics during the application of cyclic load on the materials. Daunys et al. [22,23,24,25] investigated the low-cycle durability dependences of low-cycle durability of the mechanical properties of steels used in the welded joints of nuclear power plants. A new probabilistic fatigue model was proposed in [26] for durability assessment and combines the concept of the weakest link theory and the strain energy. A new concept of an effective density of the strain energy was developed in order to establish a link between the experimental data of the specimens and the strain energy. The results suggested that the proposed model was more accurate than the other four models. The curves obtained in the study provided a more effective description of the distribution of the experimental data. Williams et al. [27] proposed a method to construct accurate statistical strain and durability curves based on experimental data obtained from fatigue tests under strain-controlled loading. Strzelecki [28] presented the characteristics of the S–N curve that uses the Weibull distribution of parameters 2 and 3 for fatigue limit and the limited service life, respectively. The parameters of the proposed model were assessed under the maximum likelihood method. Moreover, the solution to the estimation of the initial values of the likelihood function was presented in the paper. Liu et al. [29] used the finite element (FE) method for numerical analysis to investigate the reliability of low-cycle fatigue durability and designed the simulation method to obtain the distributions of the probabilistic density of the level of stress and strain at dangerous points of the disc structure in an aeronautical engine turbine. Zhu et al. [30] aimed to design a Bayesian system for the probabilistic prediction of low-cycle fatigue and quantitative uncertainty of material properties that emerge when different deterministic models of low-cycle strain are selected. Zhao et al. [31] investigated the statistical evolution of low-cycle fatigue crack initiation in the following aspects: general correspondence of statistical parameters to the test data and application of the most common distributions: Weibull (parameters 2 and 3), normal, log-normal, marginal minimum, marginal maximum, and exponential.
Most studies dedicated to the statistical evaluation of the results of the low-cycle fatigue test were conducted for single-axis stress states and are largely related to the evaluation of the durability distribution before the onset of fatigue crack or until crack propagation to a certain length. The scientific literature still lacks systematic investigations for the design of probabilistic low-cycle fatigue in view of the statistical durability values, or the available investigations available were carried out by the calculating mechanical characteristics of materials for single strain [32] and the characteristics of the strain diagram parameters [33]. Statistical investigation of low-cycle strain to crack initiation or complete failure has not been carried out to the fullest extent.
Based on the topics discussed above, the main outcomes of this paper are as follows: (1) we investigated materials with contrasting typical cyclic properties, namely, the cyclically softening alloyed steel 15Cr2MoVA, cyclically stable structural steel C45, and cyclically hardening aluminium alloy D16T1; (2) we determined the distribution patterns of statistical parameters of the durability of low-cycle fatigue; (3) we performed the statistical assessment parameters of durability to crack initiation and durability to crack propagation to complete rupture; (4) we confirmed the agreement between the hypotheses of the empirical distribution and the theoretical law of normal distribution according to the Smirnov compatibility criterion; (5) we present a comparison of the low-cycle fatigue durability curves of the experimental data; (6) we provide equations based on the experimental result for predicting the statistical performance of the durability parameters in advance.
2. Experiment, Materials, and Methods
2.1. Experiment
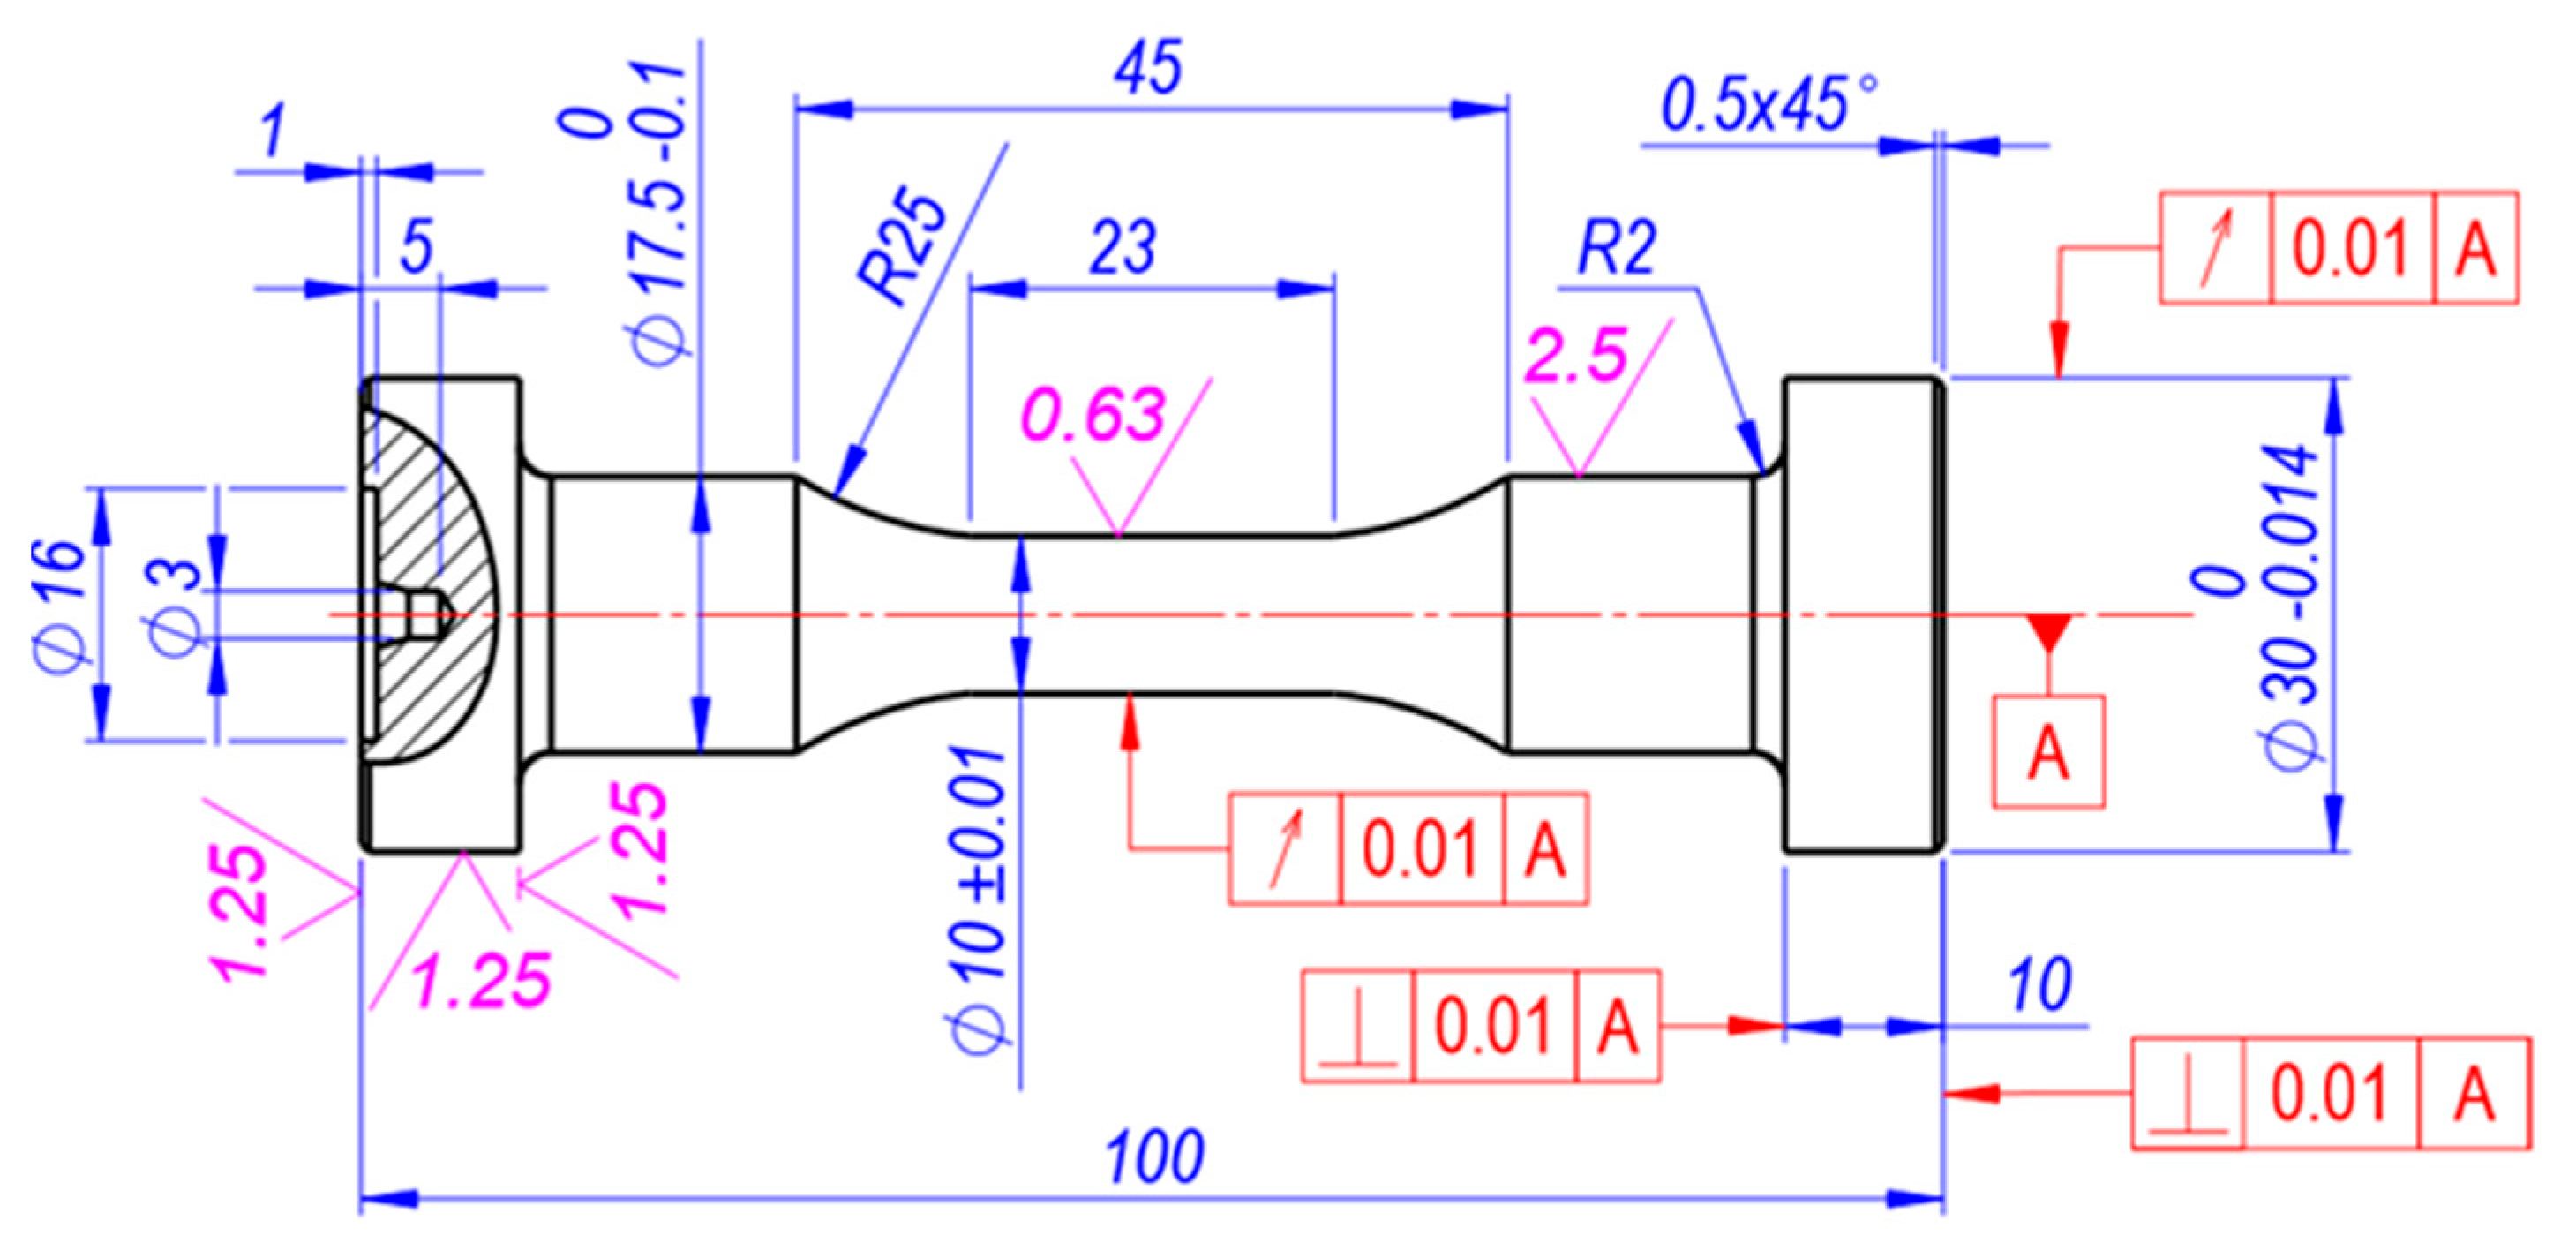
The main task of the fatigue loading device was to provide the test piece with a uniform axial strain. This is possible because of the high coaxiality of the grippers and the high stiffness of the machine. The samples used for the low-cycle fatigue testing had to maintain a uniform axial stress state in the test section until fatigue crack occurred. Figure 1 provides a drawing of the specimen that best fit the uniform axial deformation conditions.
The experiments were conducted in the Laboratory of the Faculty of Mechanical Engineering and Design of Kaunas Technology University. The experimental equipment consisted of a 50 kN UMM-5T low-cycle tension–compression test machine (Kaunas University of Technology, Kaunas, Lithuania) and an electronic device, which is designed to record stress–strain diagrams, cycles, and load reversal. The GOST 25502-79 standard (Strength analysis and testing in machine building. Methods of metals mechanical testing. Methods of fatigue testing) [34] was used to perform low-cycle fatigue tests. Statistical characteristics were calculated according to the GOST 22015-76 standard (Quality of product, regulation, and statistical quality evaluation of metal materials and products on speed-torque characteristics) [35].
Reference [36] explains the complete details of the test equipment and methods.
2.2. Materials
The chemical composition and mechanical properties of the tested materials are presented in Table 1 and Table 2. For the investigation, materials with contrasting typical cyclic properties were selected: cyclically softening alloyed steel 15Cr2MoVA (the material was anisotropic during cyclic loading; that is, it accumulated plastic strain in the direction of tension compression), cyclically stable anisotropic structural steel C45, and aluminium alloy D16T1 (the material was cyclically hardened during cyclic loading with stress-limited loading and did not unilaterally accumulate plastic deformation).
2.3. Methods
The present study employed three loading levels for the low-cycle fatigue experiments (Table 3). According to [19], to obtain a stable distribution of mechanical characteristics for a single loading level, 20–25 specimens need to be tested.
Under strain-controlled loading, the material was subject to failure only as a result of fatigue; hence, the value of all three levels of loading was the same. However, in order to investigate the effect of the product batch on the statistical characteristics, the number of specimens was increased to 80 for the medium levels and 120 for the C45 level (Table 3).
Reference [37] presented low-cycle fatigue curves under the strain-controlled loading. These curves were developed according to the recommendations [38].
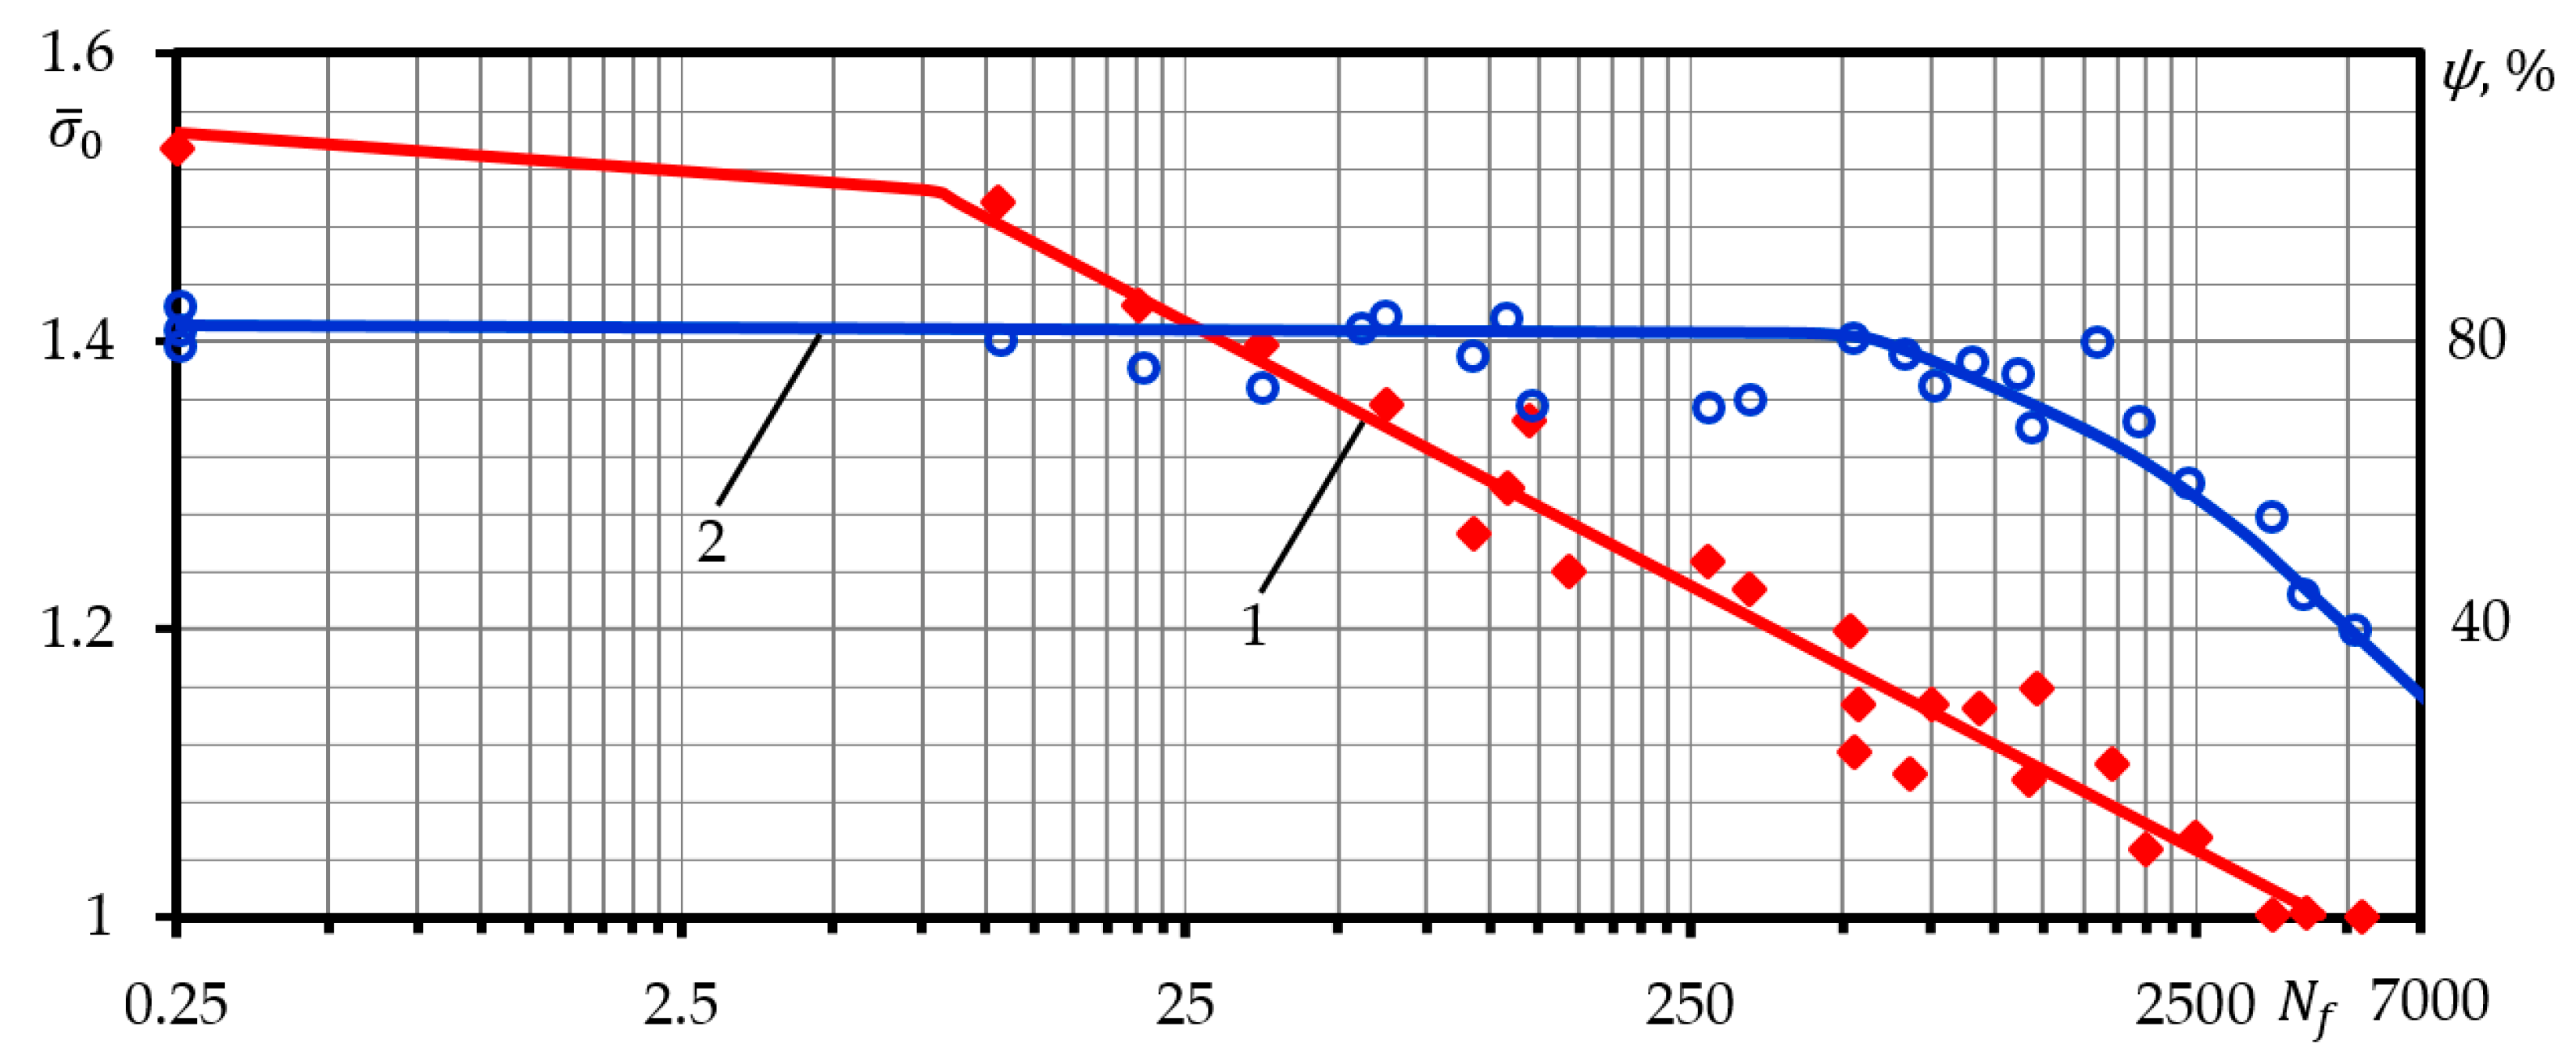
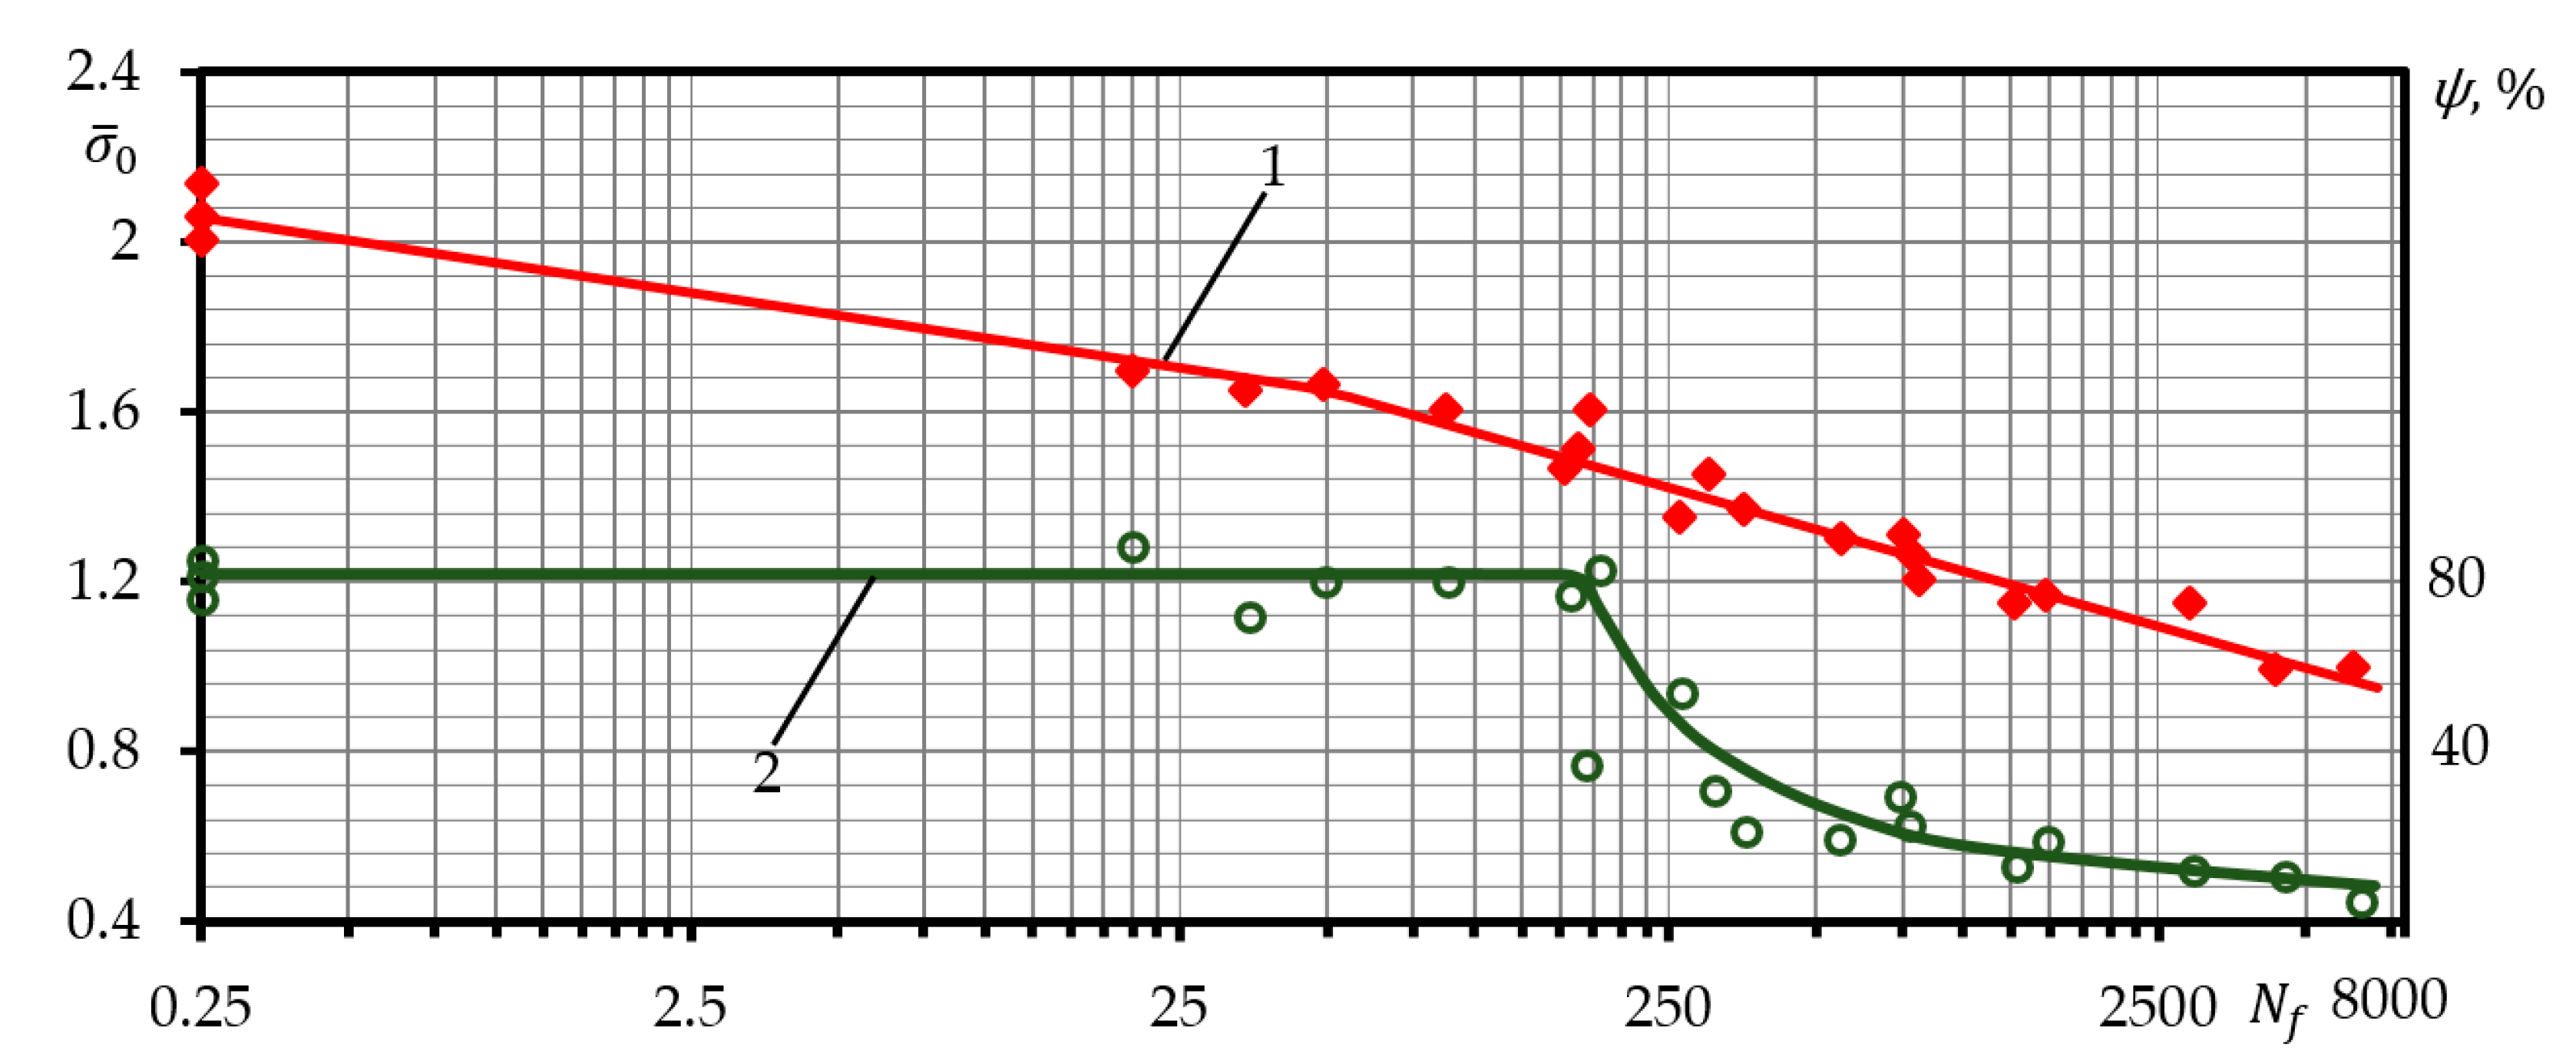
Figure 2, Figure 3 and Figure 4 show the curves of the stress-controlled loading fatigue of all the materials analysed in accordance with the described specifications on the relative coordinates “stress amplitude —durability to failure ”. Moreover, the figures show the change in the comparative cross-section narrowing at rupture, depending on the load amplitude .
As suggested in Figure 2, the quasi-static break zone of steel 15Cr2MoVa occupied the area at , and the transitional zone was , while the fatigue zone was . Therefore, for the purpose of the experiments with this material, the following stress-controlled loading levels were determined in this study: .
As suggested by the analysis of Figure 3, the quasi-static break zone of steel C45 occupied the area at , and the transitional zone was , while the fatigue zone was . The following stress-controlled loading levels were determined in this study for this type of steel: .
Similar analysis of the aluminium alloy D16T1 (Figure 4) has shown that the transitional zone was very narrow. Two loading levels were selected for the statistical investigation—one in the fatigue zone and another in the quasi-static rupture area: .
Evidence from other studies [39] suggests that the distribution increases in the transition zone compared to the quasi-static and fatigue zones. Therefore, a larger number of specimens were used in the transitional area, i.e., 40 specimens each for steels 15Cr2MoVa and C45. The number of specimens for all materials was increased to learn about the effect of the number of specimens on the statistical characteristics of the strain and durability diagrams.
The cyclic load strain was measured on the 23 mm length of the specimen (Figure 1). The stability of the strain meter measurement base was maintained by the special calliper to control the distance between the strain meter clamp attachment points.
The low-cycle test machine used for the investigation had three speed modes. Two speed modes were chosen for the experiments under the study: 4 and 20 mm/min. Although the speed of the strain was found to have no effect on the experiment’s results [20], the experiments on the specimens were conducted under the same conditions in view of the speed of strain.
During the cyclic elastoplastic loading, fatigue diagrams were registered periodically to the final rupture of the specimen. The fatigue diagrams were recorded for each semi-cycle at a speed of 4 mm/min up to the 10th cycle. Further loading and recording of the fatigue diagrams to the specimen rupture were performed at the speed of 4 mm/min; the recording was made every 10 semi-cycles up to the 100th semi-cycle, every 100 semi-cycles up to the 1000th semi-cycle, and every 1000 semi-cycles up to the rupture fatigue diagram.
3. Results
The fatigue crack appeared as a result of various defects in the metallographic or geometric structures that determined the statistical nature of fatigue and were the main cause of the distribution of the fatigue characteristics. The internal defects and nonuniformity of the microstructure of the metals appeared largely in the processes of metallurgical and thermal treatment. Surface defects (i.e., smoothness and hardening) that appear in the manufacturing of the specimens and are of a statistical nature also play an important role. Certain errors appeared as a result of the nonuniformity of the experimental conditions, for example, variations in the concentricity of the specimen and machine clamps during tension–compression, inaccuracy of the loading level setting, and fluctuations in the experimental temperature, where the specimens of a single batch were tested. All of these errors were characteristic of the metal of a single batch. All factors had an effect on the durability distribution, although the effect was not uniform.
The numbers of cycles obtained during the low-cycle fatigue experiments to the fatigue crack initiation or rupture of fatigue cracks were distributed in ascending order and constituted a variation series, which was the initial information for statistical processing and graphic representation of the random value function and distribution.
The number of results was usually very high where a large number of tests (i.e., hundreds) were conducted. Hence, to determine the low-cycle fatigue failure characteristics, additional statistical processing was performed, i.e., the statistical series were formed. During the formation of the histograms, the total number of histograms was divided into 10 equal statistical series (intervals), the length of which was calculated using the equation:
The use of 15–20 intervals was unreasonable, as a very large number of results does not translate into greater precision of the statistical characteristics. Upon division of the statistical series into 10 intervals, histograms of durability for crack initiation and to failure were formed. Intervals of the same length were marked on the x-coordinate axis. The height of each interval was equal to probability, P. Probabilistic values of the low-cycle fatigue to crack initiation or to failure may be calculated according to the dependence:
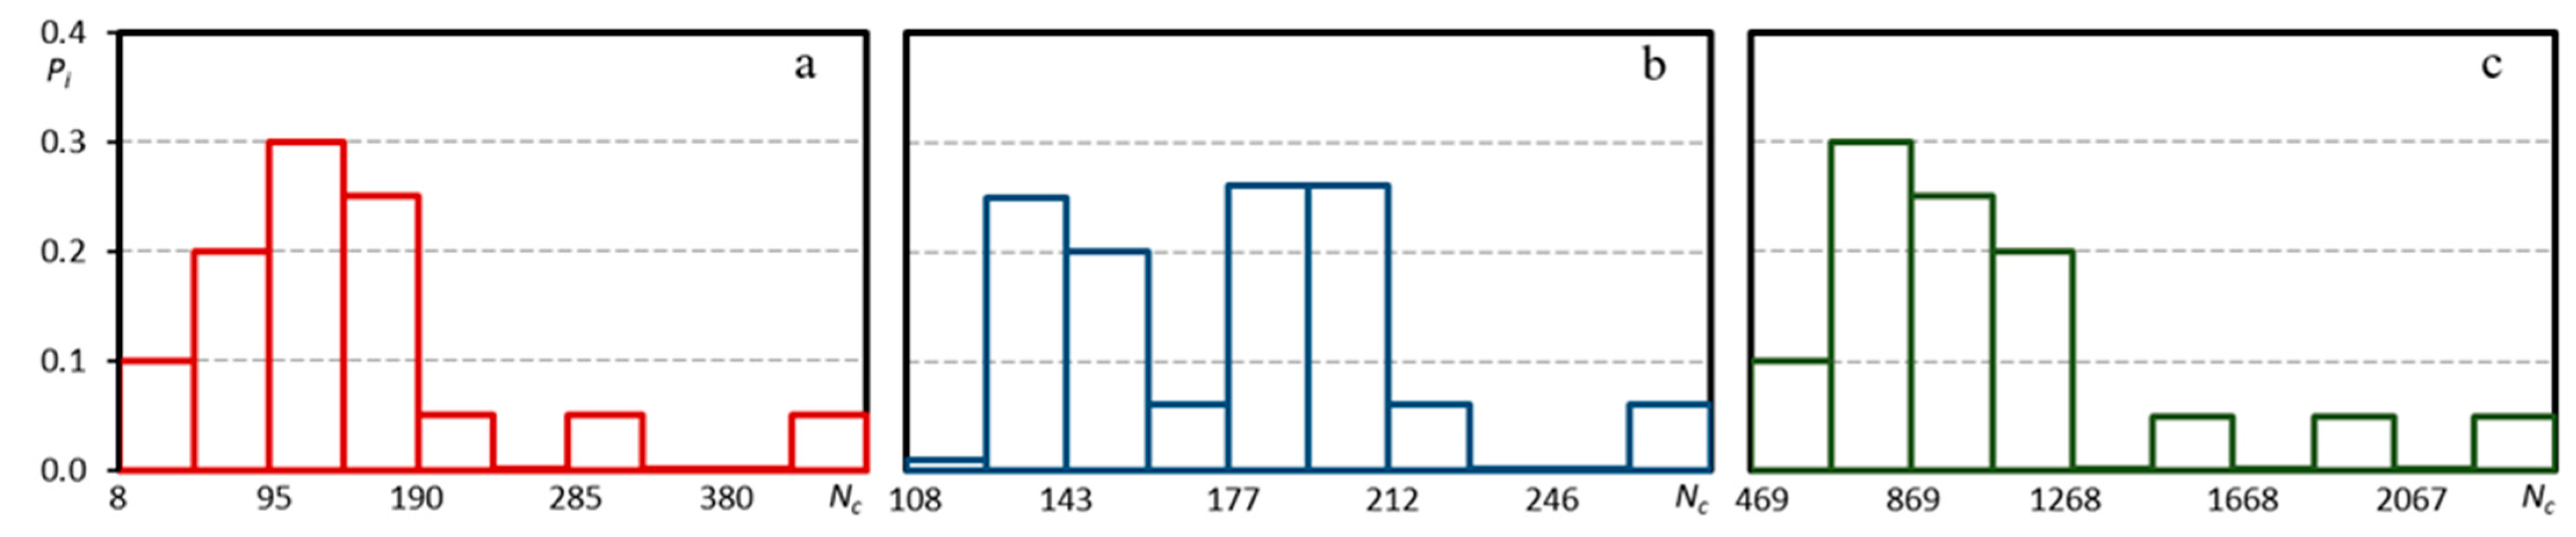
The analysis of the stress-controlled loading histograms (Figure 5) showed a positive asymmetry that was characteristic of all of the levels of the materials and all of the rupture zones analysed. A large positive asymmetry was observed when comparing the quasi-static versus fatigue failure cases of steel 15Cr2MoVa. The largest asymmetry was observed in the steel C45 histograms in the transitional zone, while the lowest was observed in the case of fatigue failure.
The asymmetry increased in the failure diagrams of the DT16T1 aluminium alloy with the rising loading level. However, under stress-controlled loading, the fatigue failure zone of this material covered the entire range of durability, and the loading levels chosen by the study authors were distributed evenly in the fatigue zone.
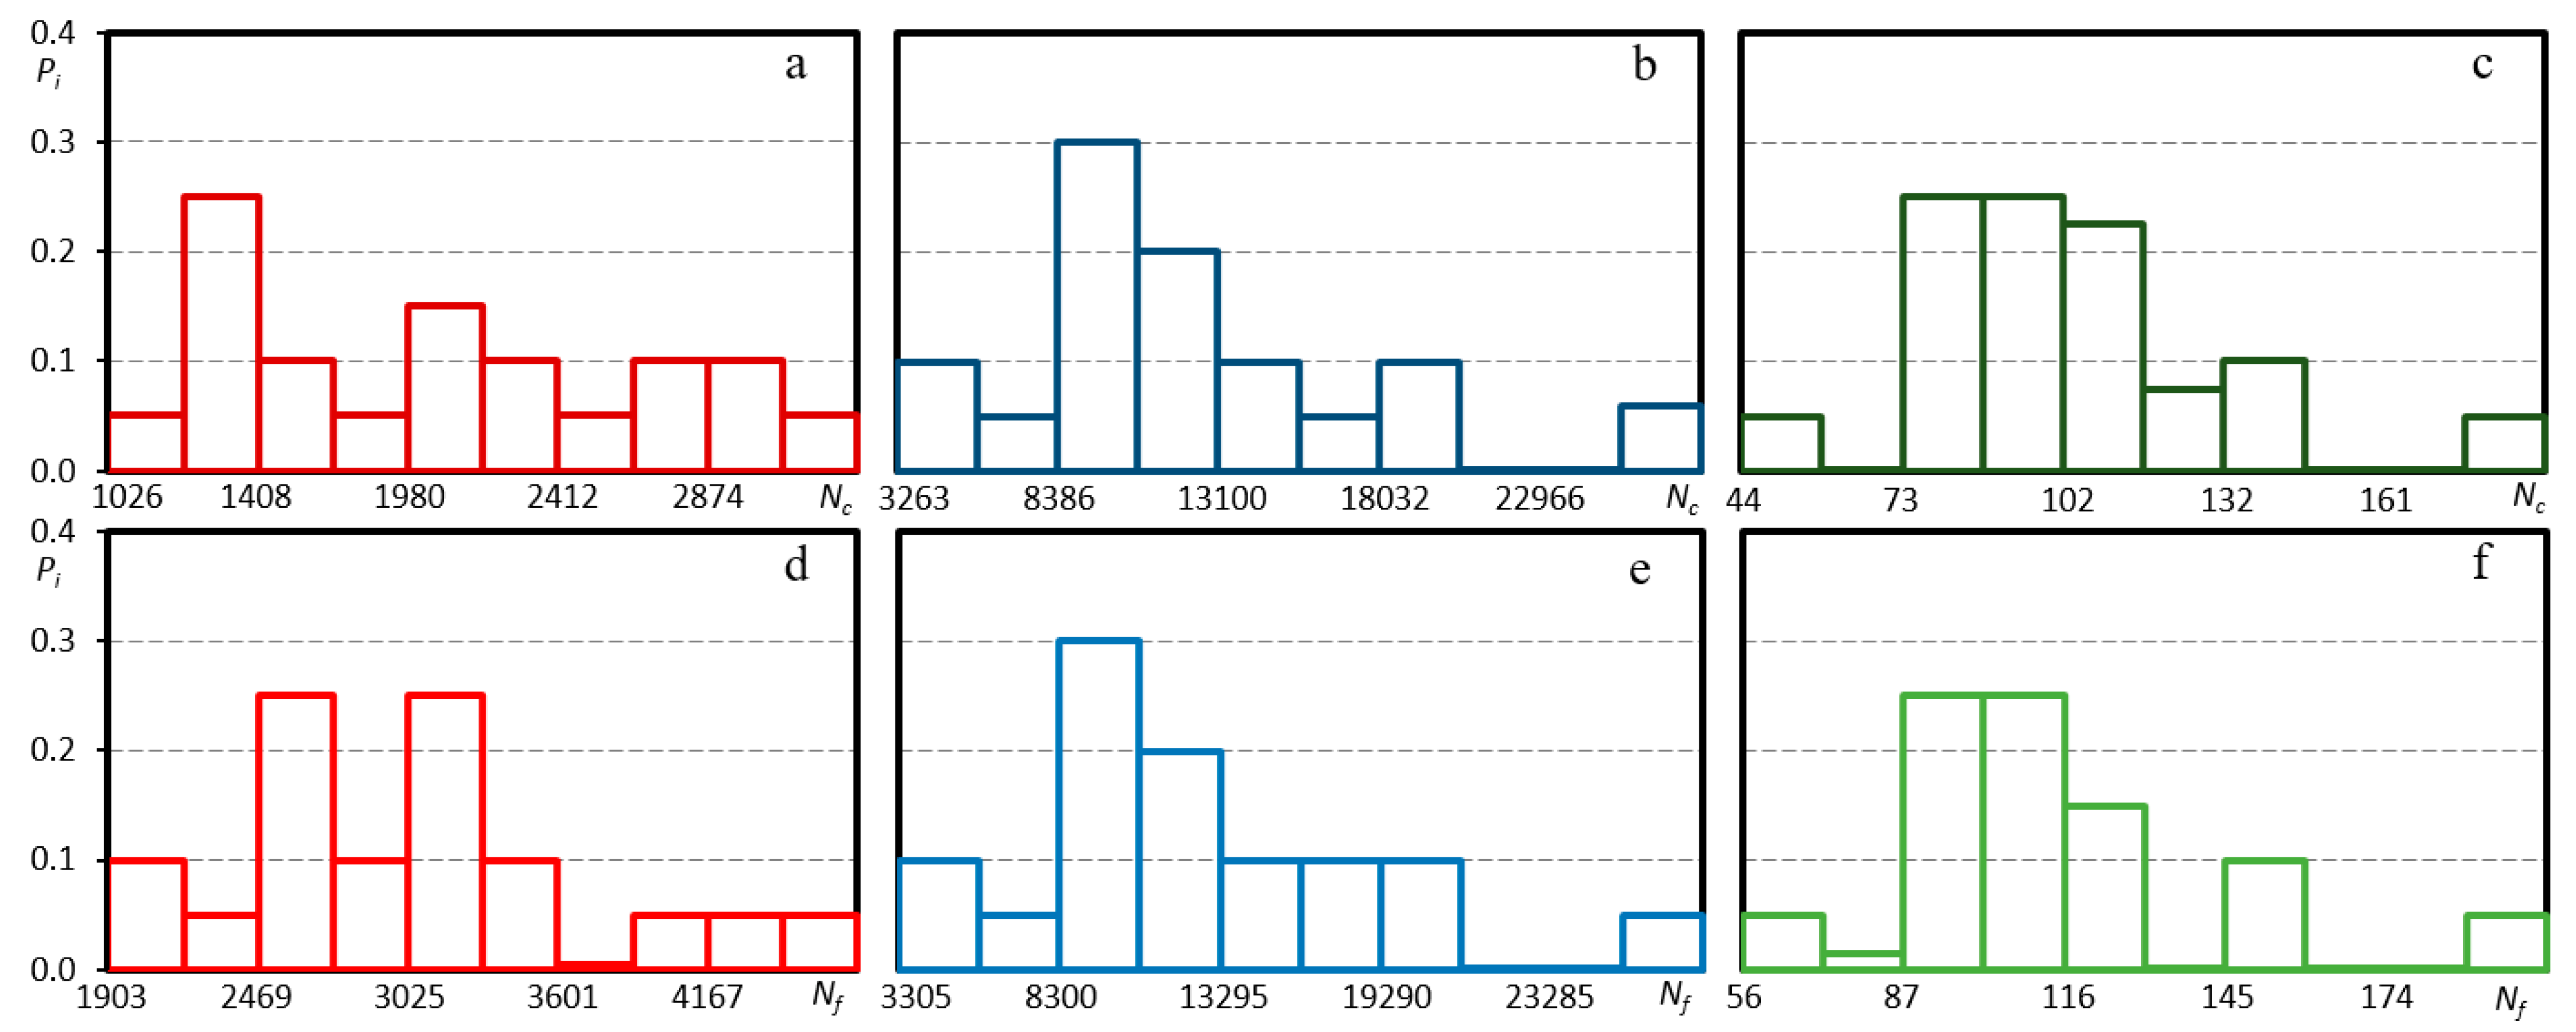
Histograms of the strain-controlled loading durability to crack initiation, , and failure, , are presented in Figure 6. Analysis of the histograms of the durability to crack initiation, , and failure, , of steel 15Cr2MoVa under strain-controlled loading suggest that their distribution depends on the sample size. It can be observed in Figure 6a,d that under a loading level (150 specimens tested), the form of the histogram resembles a normal distribution.
During the investigation of the durability diagrams to crack initiation and steel C45, the forms of the histograms of this material were found to depend on the sample size. With increasing sample size, a normal distribution with positive asymmetry was approached. Under the loading level (120 specimens analysed), the failure () histogram was similar to the form of normal distribution with significant positive asymmetry and a mean arithmetic value of the cycles. It should be noted that compared to the failure () diagrams, the histograms of durability to failure, , of steel C45 was characterised by lower asymmetry and more significant mean values, where the loading level reached , the mean arithmetic value of the durability to failure was cycles; where the loading level reached , the mean arithmetic value of the durability to failure was cycles; where the loading level reached , the mean arithmetic value of the durability to failure was cycles.
Upon investigation of the durability to failure histograms of the aluminium alloy D16T1 under strain-controlled loading (Figure 6c), positive asymmetry was found for all loading levels, while the form was found to be close to the normal distribution. The histograms of the durability to failure of the aluminium alloy D16T1, had very few differences from the failure histograms, .
The analysis of histograms showed the qualitative correspondence of the characteristics of the durability to crack initiation ( and to failure () to the normal distribution. Nonetheless, for improvement of the statistical assessment of the characteristics, the statistical characteristics were calculated for the three most common distribution patterns: Weibull, normal, and log-normal. The calculation was performed using statistical characteristics: arithmetic mean (, standard deviation (, dispersion (, skewness (, and coefficient of variation :
The statistical characteristics of the Weibull distribution pattern were calculated according to [40]:
Table A1 and Table A2 present the calculated key statistical characteristics of the normal, log-normal, and Weibull distributions of the durability characteristics of the materials analysed under the strain-controlled and stress-controlled loading. Following the analysis of the statistical characteristics, it could be claimed that the lower values of the coefficient of variation of one of the key statistical indicators, , were obtained by using the log-normal distribution. Therefore, this distribution should be considered to be superior to the normal and Weibull distributions. It could be noted that the distribution of statistical durability on the coefficient of variation ( of the strain-controlled loading did not depend on the loading level. Analysis of the durability characteristics also showed positive asymmetry for most of the loading levels. Under strain-controlled loading, the dispersion and mean squared deviation decreased under an increasing loading level (Table A1).
The analysis of statistical characteristics showed that the minimally varying values of the coefficient were obtained under the log-normal distribution. Under strain-controlled loading, the coefficient of variation did not depend on the load level. Meanwhile, under stress-controlled loading, the coefficient increased under increasing loading level for all the materials analysed. This might probably depend on the skewness (degree of hardening) of the strain diagram. With an increasing loading level, the strain diagram became less sloped, and even minor variations in the stress level would cause greater variations in the hysteresis loop compared to the lower levels, where the strain diagram would be more sloped. This increased the dispersion of durability under high loading levels.
For a more accurate definition of the distribution law, a computer-aided study was conducted to confirm the agreement between the hypotheses of the empirical distribution and the theoretical law of the normal distribution according to the Smirnov compatibility criterion, [41]:
The criterion for the results of a sample to satisfy the law of the normal or log-normal distribution is expressed by inequality:
The results of the agreement with the normal distribution according to the Smirnov compatibility criterion () are provided in Table 4 and Table 5. Adjustment calculations were performed for the strain-controlled and stress-controlled loadings. A significance level of was assumed in the analysis of the characteristics of the durability to failure and failure . The calculation results confirmed inequality , which shows that the experimental data were in line with the theoretical pattern of normal distribution. Comparison of the calculation results of the criterion and the durability parameters of all of the materials showed that the values of function were distributed according to a normal pattern similar to the histograms.
Reliable quantitative evaluation of the durability parameters can be performed in the case of a large sample size. In the case of a limited number of tests, it is necessary to indicate the degree of accuracy and reliability, i.e., to calculate the confidence intervals [42]:
Based on the distribution pattern selected, the possible limits of the confidence intervals were calculated for the confidence levels . The calculation results are presented in Table A3 and Table A4. To increase the reliability of the probabilistic calculations of the strength and durability of the structural elements, using the calculated values of the reliability interval limits would be more reasonable than using the standard mechanical characteristics provided in the manuals.
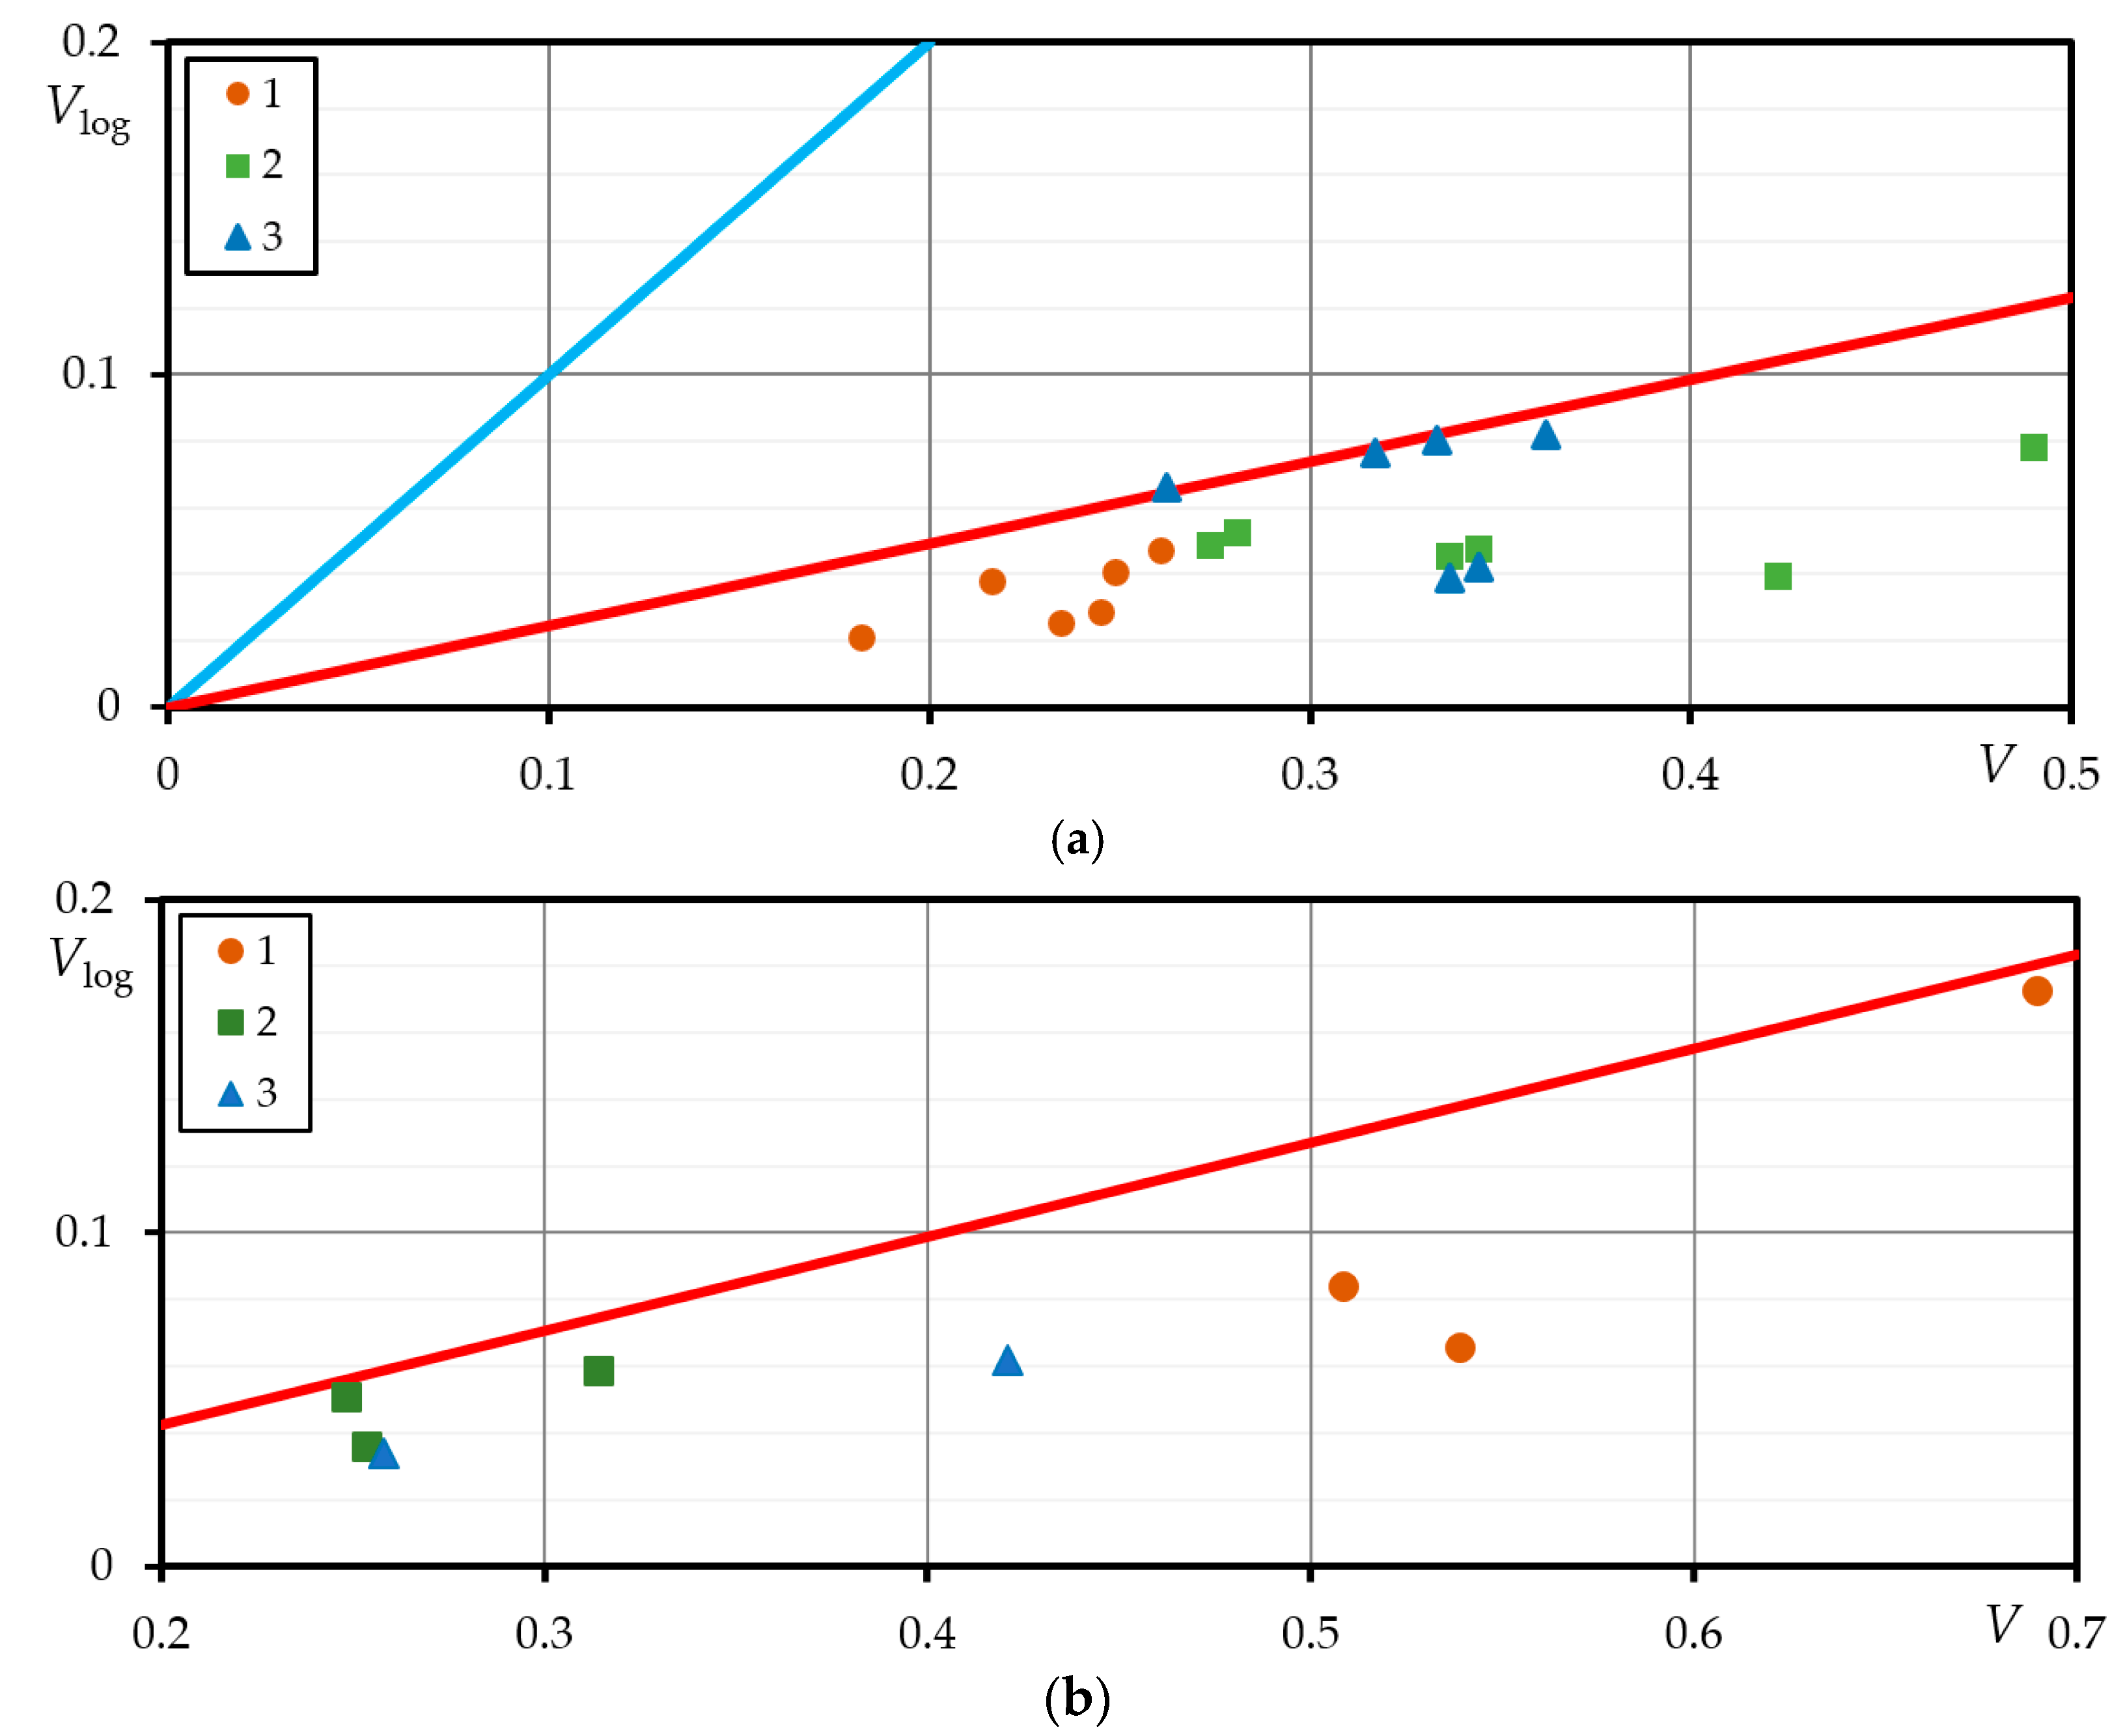
Figure 7 presents three coefficients of variation of the distribution patterns: log-normal, normal, and Weibull. Analysis of Figure 7 suggests that the log-normal pattern provides the best description of the durability parameters under various loading levels, under both the stress-controlled and the strain-controlled loadings.
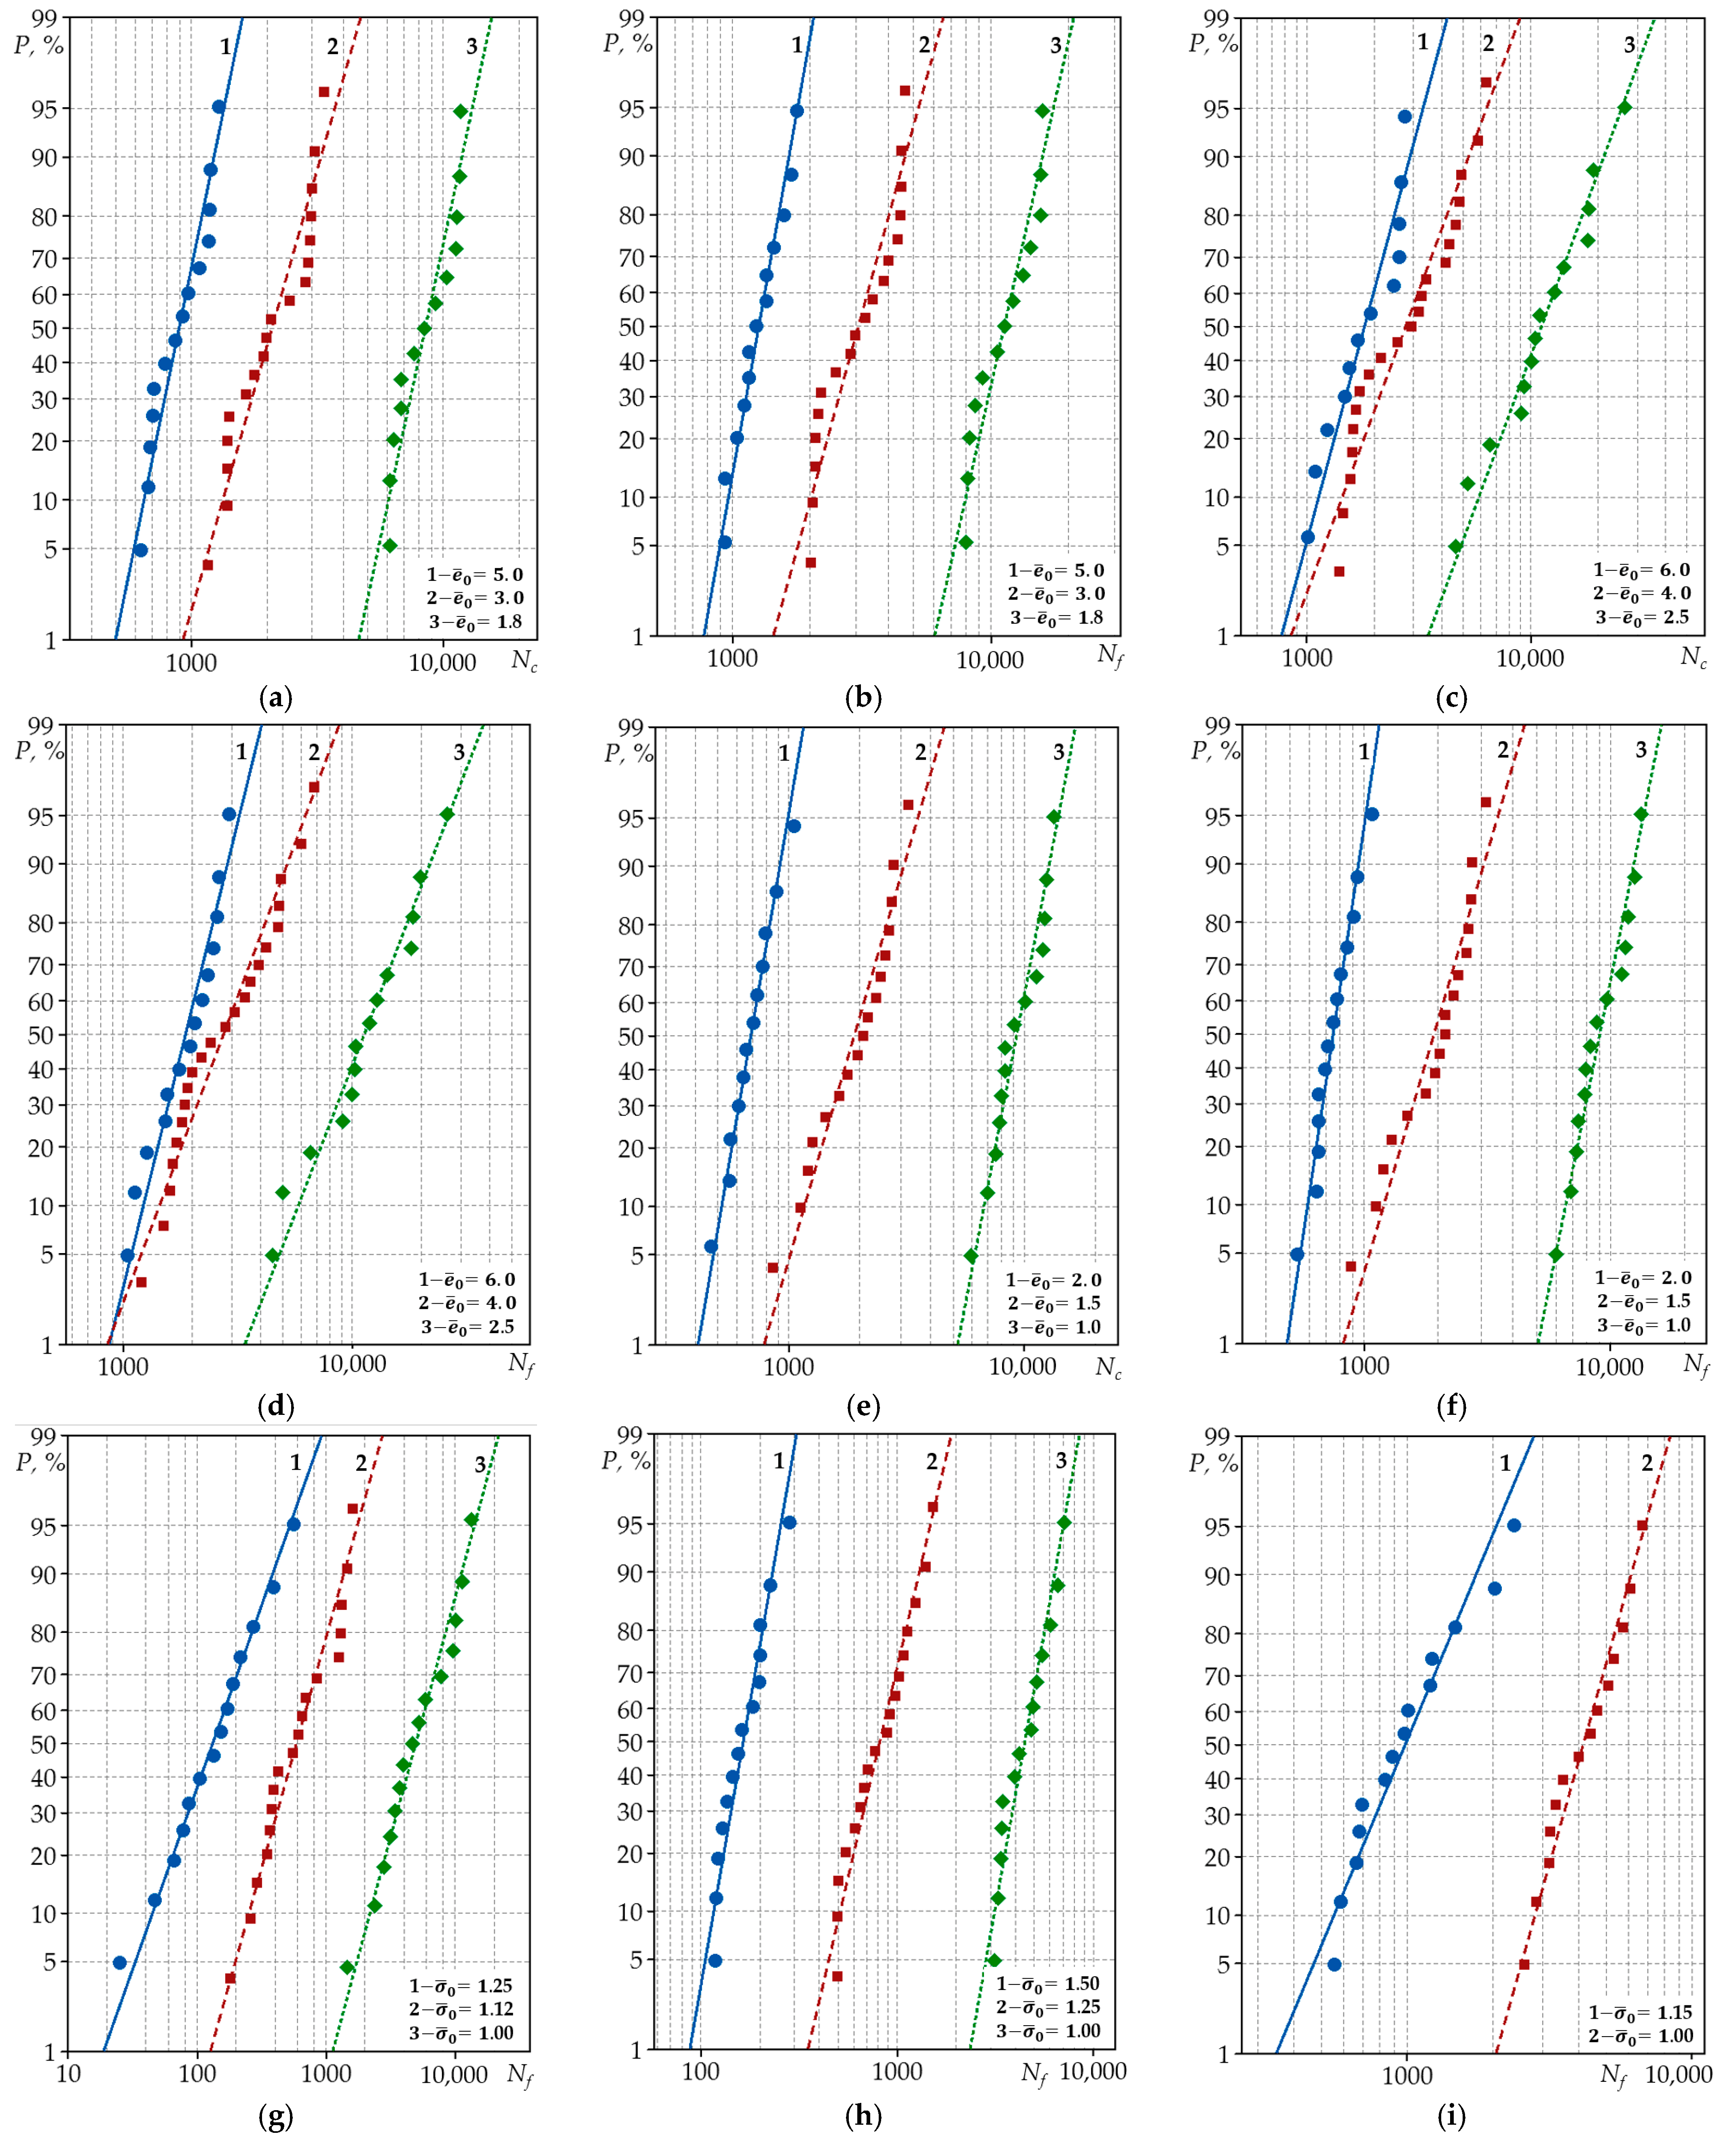
The durability results of the investigated materials are shown in Figure A1 in the coordinates of the probability of events and the durability of the probabilistic grid. The probability was described using the following equation:
The linear distribution of the experimental results in the probabilistic diagrams of the log-normal distribution support the correspondence to this pattern.
The distribution of a random event in a normal distribution pattern is known to be characterised by the mean squared deviation ( and dispersion (D). Whereas the standard deviation ( may be mathematically associated with the maximum and minimum values of the random quantity; the ratio of these values can also be assessed as the distribution characteristic:
The values of the quantity of the key durability characteristics () of the strain-controlled loading are presented in Table 6, while equivalent values of the quantity of the key durability characteristics () of the stress-controlled loading are presented in Table 7. The results suggest that in the case of strain-controlled loading, the values of the coefficient of steel 15Cr2MoVa did not depend on the loading level; while for steel C45, with the loading level increasing from to , coefficient decreased by two times. This could probably be related to the accuracy of adding the loading level. For steel C45, the start of unloading (reverse) of the first semi-cycle loading level from and is in the transitional area of the yield region and strengthening zone. Therefore, it is probable that the variation in the yield region at these loading levels caused considerable scattering of the durability. For the aluminium alloy D16T1, the same as for the steel 15Cr2MoVa, a strong scattering of the durability could be observed at the medium loading level. This could be explained by the larger sample size (Table 6).
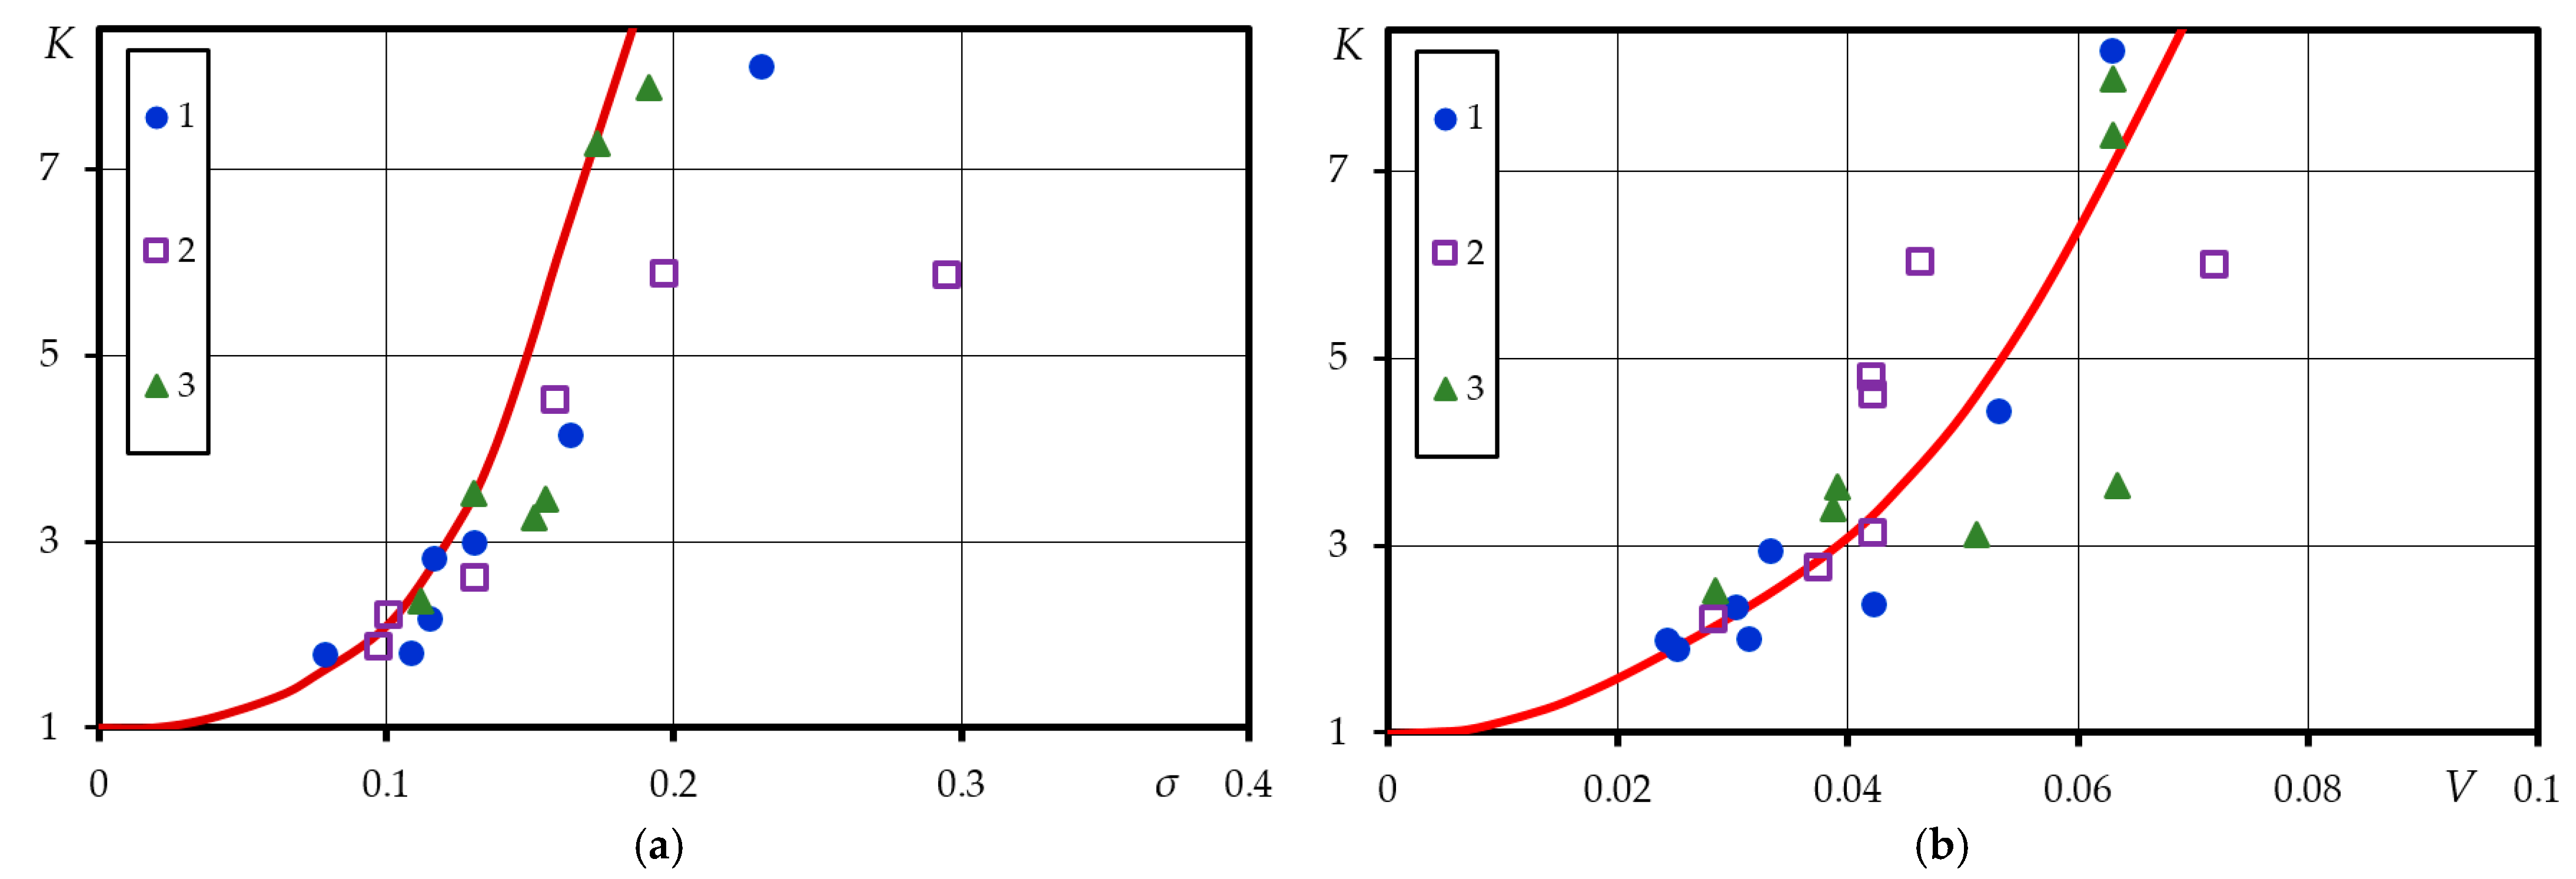
For steel 15Cr2MoVa and aluminium alloy D16T1, with an increasing loading level, the values of coefficient tended to increase as well. For steel 15Cr2MoVa, with the loading level that increased from to , the coefficient values varied from 8.09 to 18.75. For the aluminium alloy, with a loading level that increased from to , the coefficient values varied from 2.45 to 4.16. For steel C45, this connection between coefficient and the loading level was not observed. Investigation of the values of the variation coefficient of the materials suggested similar conclusions (Table A1). Diagrams and in Figure 8 show the curves of the characteristics of the materials analysed and the durability.
Using Equation (10), it is possible to perform a preliminary evaluation of the limiting values of the durability until crack initiation () and durability until the cracks propagated to the complete rupture () limit values of the arithmetic mean (), dispersion ), and coefficient of variation () under strain-controlled and stress-controlled loadings.
The resulting initial statistical characteristics may also be used to determine the minimum number of statistical specimens [34]:
This approach eliminates the need for performing additional experiments and statistical processing.
4. Conclusions
Based on the results, the following observations were made.
Histograms were developed and probabilistic parameters were calculated by statistical processing of the data on durability to fatigue crack initiation () and failure (. Analysis of the strain-controlled and stress-controlled loading histograms showed that positive asymmetry was characteristic of all the materials analysed and all the loading levels; however, when the specimen samples increased, the histograms levelled out and approached a normal distribution.
The analysis of the statistical characteristics showed that the minimally varying values of the coefficient were obtained under a log-normal distribution. Under strain-controlled loading, the coefficient of variation did not depend on the loading level. Meanwhile, under stress-controlled loading, the coefficient increased under the increasing loading level for all of the materials analysed. With increasing sample size, the durability under both the strain-controlled and stress-controlled loadings showed better correspondence to the log-normal distribution pattern. The experimental analysis results showed that under both strain-controlled and stress-controlled loading conditions, the results of the durability to fatigue crack initiation () and failure ( according to criterion of the analysed steel 15Cr2MoVa, C45, and aluminium alloy D16T1 were in a fairly good agreement with a normal distribution pattern. The authors propose using the log-normal pattern, as the values of the variation coefficients () obtained were lower than in the cases of normal or Weibull distribution patterns. Statistical analysis of the durability distribution of the parameters for crack initiation and failure under low-cycle loading was performed by loading type, level, and specimen sample size. The analysis enabled the authors to determine the satisfactory correspondence of the experimental results to the log-normal pattern. When the stress-controlled loading level increased, the distribution of the experimental results also increased. This determined the variations in the width of the hysteresis loop of the elastoplastic loading for the monotonous decrease in the strengthening coefficient.
Future research should be devoted to the development of applying the method of the greatest probability to evaluate the sensitive thresholds of the bottom (N0) and top (Nk) of the statistical distribution of the durability parameters to determine whether the limits of the sensitivity of the statistical distribution have been computed using the maximum likelihood method.
Author Contributions
Conceptualisation, methodology, validation, writing—original draft preparation, investigation and writing—review and editing, Ž.B. and V.L.; software and visualisation, V.L.; formal analysis, data curation and resources project administration, Ž.B. All co-authors contributed equally. All authors have read and agreed to the published version of the manuscript.
Funding
This research received no external funding.
Institutional Review Board Statement
Not applicable.
Informed Consent Statement
Not applicable.
Data Availability Statement
Not applicable.
Conflicts of Interest
The authors declare no conflict of interest. The authors declare that they have no known competing financial interests or personal relationships that could have appeared to influence the work reported in this paper.
Nomenclature
| Latin symbols | |
| tabular function value | |
| tabular parameter | |
| tabular parameter | |
| dispersion | |
| strain if initial (0 semi-cycle) loading normalised to proportional limit strain (%) | |
| proportional limit strain (%) | |
| tabular parameter | |
| the ratio of the maximum and minimum of the durability properties | |
| m3 | the third central moment of distribution |
| number of results in the ith interval | |
| the total number of the results obtained for particular characteristics | |
| minimum statistical quantity of samples | |
| quantity of statistical intervals | |
| number of cycles of the bottom threshold sensitivity value | |
| durability (number of load cycles) until crack initiation | |
| number of load cycles | |
| durability (number of load cycles) till the cracks propagated to complete rupture | |
| number of cycles in the top threshold sensitivity value | |
| the density of the statistical data | |
| tabular parameter | |
| S | skewness |
| Student’s t-distribution | |
| quantile of normal distribution | |
| V | coefficient of variation |
| critical value of the Smirnov criterion (;;) | |
| sample mean | |
| random variable | |
| width of the bins (statistical intervals) | |
| maximum values of the material durability properties in the bins (statistical intervals) | |
| minimum values of material durability properties in the bins (statistical intervals) | |
| Greek symbols | |
| level of significance | |
| reliability of normal distribution | |
| the error of determination of the mean value of the random variable | |
| µ | arithmetic mean |
| standard deviation | |
| stress of the initial (0 semi-cycle) loading normalised to the proportional limit stress (MPa) | |
| proportional limit stress (MPa) | |
| elastic limit or yield strength, the stress at which 0.2% plastic strain occurs (MPa) | |
| ultimate tensile stress (MPa) | |
| rupture strength (MPa) | |
| Laplace function value | |
| cross-sectional narrowing (%) | |
| Smirnov compatibility criterion | |
Appendix A

Table A1.
Durability to crack initiation ( and failure ( under stress-controlled loading statistical properties for the normal, log-normal, Weibull distributions.
Table A1.
Durability to crack initiation ( and failure ( under stress-controlled loading statistical properties for the normal, log-normal, Weibull distributions.
| Cyclic Property | Material | n | Normal | Log-Normal | Weibull | ||||||||||||
|---|---|---|---|---|---|---|---|---|---|---|---|---|---|---|---|---|---|
| 15Cr2MoVa | 1.00 | 20 | 4194 | 2275 | 0.52 × 10⁷ | 0.927 | 0.542 | 3675 | 0.22970 | 0.0528 | 0.012 | 0.064 | 4194 | 2275 | 1.084 | 0.542 | |
| 1.12 | 40 | 522 | 265 | 0.71 × 10⁵ | 1.191 | 0.558 | 448 | 0.2045 | 0.0418 | −0.321 | 0.077 | 522 | 265 | 1.224 | 0.558 | ||
| 1.25 | 20 | 142 | 99 | 0.98 × 10⁴ | 1.590 | 0.698 | 116 | 0.2928 | 0.0857 | −0.242 | 0.142 | 142 | 99 | 1.859 | 0.698 | ||
| C45 | 1.00 | 20 | 4538 | 1106 | 0.12 × 10⁷ | 0.362 | 0.244 | 4413 | 0.1052 | 0.0111 | 0.085 | 0.029 | 4538 | 1106 | 0.424 | 0.244 | |
| 1.25 | 40 | 835 | 261 | 0.68 × 10⁵ | 1.594 | 0.312 | 801 | 0.1244 | 0.0155 | 0.343 | 0.043 | 757 | 261 | 1.720 | 0.345 | ||
| 1.50 | 20 | 164 | 39 | 0.15 × 10⁴ | 0.887 | 0.236 | 161 | 0.0973 | 0.0095 | 0.391 | 0.044 | 164 | 39 | 1.038 | 0.236 | ||
| D16T1 | 1.0 | 20 | 4388 | 1080 | 0.12 × 10⁷ | 0.273 | 0.246 | 4262 | 0.1082 | 0.0117 | −0.090 | 0.029 | 4388 | 1080 | 0.319 | 0.246 | |
| 1.15 | 20 | 1070 | 460 | 0.21 × 10⁶ | 1.448 | 0.429 | 997 | 0.1616 | 0.0261 | 0.661 | 0.054 | 1070 | 460 | 1.693 | 0.429 | ||
Table A2.
Durability to crack initiation () and failure ( under strain-controlled loading statistical properties for the normal, log-normal, Weibull distributions.
Table A2.
Durability to crack initiation () and failure ( under strain-controlled loading statistical properties for the normal, log-normal, Weibull distributions.
| Cyclic Property | Material | n | Normal | Log-Normal | Weibull | ||||||||||||
|---|---|---|---|---|---|---|---|---|---|---|---|---|---|---|---|---|---|
| 15Cr2MoVa | 1.8 | 40 | 8442 | 2036 | 0.42 × 10⁷ | 0.345 | 0.241 | 8215 | 0.103 | 0.0107 | 0.182 | 0.026 | 8442 | 2036 | 0.404 | 0.241 | |
| 3.0 | 80 | 2157 | 541 | 0.29 × 10⁶ | 0.073 | 0.251 | 2088 | 0.1137 | 0.0129 | −0.323 | 0.034 | 2157 | 541 | 0.079 | 0.251 | ||
| 5.0 | 40 | 907 | 195 | 0.38 × 10⁵ | 0.227 | 0.215 | 887 | 0.0936 | 0.0088 | 0.028 | 0.032 | 907 | 195 | 0.265 | 0.215 | ||
| C45 | 2.5 | 50 | 12,236 | 6043 | 0.37 × 10⁸ | 0.453 | 0.494 | 10,424 | 0.2922 | 0.0854 | −1.503 | 0.073 | 12,236 | 6043 | 0.53 | 0.494 | |
| 4.0 | 120 | 2901 | 1005 | 0.10 × 10⁷ | 0.667 | 0.347 | 2732 | 0.1515 | 0.0229 | −0.064 | 0.044 | 2901 | 1005 | 0.687 | 0.347 | ||
| 6.0 | 50 | 1921 | 516 | 0.27 × 10⁶ | −0.193 | 0.268 | 1849 | 0.1275 | 0.0162 | −0.571 | 0.039 | 1921 | 516 | −0.226 | 0.268 | ||
| D16T1 | 1.0 | 20 | 6123 | 2127 | 0.45 × 10⁷ | 0.438 | 0.347 | 5782 | 0.1514 | 0.0229 | 0.012 | 0.040 | 6123 | 2126 | 0.512 | 0.347 | |
| 1.5 | 80 | 546 | 192 | 0.37 × 10⁵ | 0.055 | 0.351 | 507 | 0.1846 | 0.0291 | −1.233 | 0.063 | 546 | 192 | 0.059 | 0.351 | ||
| 2.0 | 20 | 98 | 30 | 0.91 × 10³ | 0.968 | 0.306 | 94 | 0.1273 | 0.0162 | 0.143 | 0.064 | 98 | 30 | 1.132 | 0.320 | ||
| 15Cr2MoVa | 1.8 | 20 | 11,459 | 2699 | 0.73 × 10⁷ | 0.279 | 0.235 | 11,161 | 0.1019 | 0.104 | 0.095 | 0.025 | 11,459 | 2699 | 0.326 | 0.235 | |
| 3.0 | 40 | 3250 | 792 | 0.63 × 10⁶ | 0.104 | 0.244 | 3153 | 0.1093 | 0.0119 | −0.218 | 0.031 | 3250 | 792 | 0.112 | 0.244 | ||
| 5.0 | 20 | 1286 | 233 | 0.55 × 10⁵ | 0.615 | 0.181 | 1266 | 0.0768 | 0.0059 | 0.255 | 0.025 | 1286 | 233 | 0.719 | 0.181 | ||
| C45 | 2.5 | 20 | 12,508 | 5378 | 0.29 × 10⁸ | 0.778 | 0.429 | 11,441 | 0.1926 | 0.071 | −0.305 | 0.047 | 12,508 | 5378 | 0.909 | 0.429 | |
| 4.0 | 40 | 300 | 1027 | 0.11 × 10⁷ | 0.776 | 0.342 | 2833 | 0.1474 | 0.0217 | 0.014 | 0.043 | 3000 | 1027 | 0.799 | 0.342 | ||
| 6.0 | 20 | 1979 | 520 | 0.27 × 10⁶ | −0.213 | 0.263 | 1967 | 0.1247 | 0.0156 | −0.592 | 0.038 | 1979 | 520 | −0.249 | 0.263 | ||
| D16T1 | 1.0 | 20 | 6185 | 2121 | 0.45 × 10⁷ | 0.436 | 0.343 | 5851 | 0.1488 | 0.0221 | 0.056 | 0.039 | 6185 | 2121 | 0.510 | 0.343 | |
| 1.5 | 80 | 563 | 184 | 0.34 × 10⁵ | 0.025 | 0.326 | 527 | 0.1706 | 0.0162 | 0.143 | 0.064 | 563 | 184 | 0.027 | 0.326 | ||
| 2.0 | 20 | 113 | 29 | 0.94 × 10³ | 0994 | 0.225 | 110 | 0.1054 | 0.011 | 0.233 | 0.052 | 113 | 29 | 1.163 | 0.274 | ||
Appendix B
Figure A1.
Low-cycle durability log-normal distribution curves under strain-controlled loading (steel 15Cr2MoVa (a,b); steel C45 (c,d); aluminium alloy D16T1 (e,f)) and stress-controlled loading (steel 15Cr2MoVa (g); steel C45 (h); aluminium alloy D16T1 (i)).
Figure A1.
Low-cycle durability log-normal distribution curves under strain-controlled loading (steel 15Cr2MoVa (a,b); steel C45 (c,d); aluminium alloy D16T1 (e,f)) and stress-controlled loading (steel 15Cr2MoVa (g); steel C45 (h); aluminium alloy D16T1 (i)).

Appendix C
Table A3.
The range of the confidence intervals of the durability to crack initiation and durability to crack propagation to complete rupture ( under strain-controlled loading .
Table A3.
The range of the confidence intervals of the durability to crack initiation and durability to crack propagation to complete rupture ( under strain-controlled loading .
| Material | p | |||||
|---|---|---|---|---|---|---|
| 15Cr2MoVa | 1.8 | 0.01 | 7869 | 7646 | 10,704 | 10,533 |
| 0.50 | 8334 | 8098 | 11,196 | 11,006 | ||
| 0.99 | 8825 | 8575 | 11,966 | 11,636 | ||
| 3.0 | 0.01 | 1971 | 1926 | 2990 | 2927 | |
| 0.50 | 2112 | 2064 | 3187 | 3119 | ||
| 0.99 | 2263 | 2211 | 3396 | 3324 | ||
| 5.0 | 0.01 | 857 | 837 | 1237 | 1217 | |
| 0.50 | 898 | 877 | 1276 | 1257 | ||
| 0.99 | 941 | 919 | 1217 | 1297 | ||
| C45 | 2.5 | 0.01 | 7398 | 5883 | 9859 | 8925 |
| 0.50 | 11,688 | 9295 | 12,026 | 10,887 | ||
| 0.99 | 18,466 | 14,686 | 14,669 | 13,279 | ||
| 4.0 | 0.01 | 2863 | 2786 | 2966 | 2888 | |
| 0.50 | 3171 | 3085 | 3277 | 3190 | ||
| 0.99 | 3513 | 3418 | 3620 | 3525 | ||
| 6.0 | 0.01 | 1732 | 1659 | 1792 | 1719 | |
| 0.50 | 1890 | 1809 | 2009 | 1926 | ||
| 0.99 | 2060 | 1973 | 2118 | 2031 | ||
| D16T1 | 1.0 | 0.01 | 5474 | 4960 | 5353 | 5045 |
| 0.50 | 5963 | 5607 | 6027 | 5680 | ||
| 0.99 | 6741 | 6339 | 6783 | 6393 | ||
| 1.5 | 0.01 | 435 | 409 | 464 | 440 | |
| 0.50 | 523 | 492 | 541 | 513 | ||
| 0.99 | 627 | 590 | 633 | 601 | ||
| 2.0 | 0.10 | 88 | 84 | 106 | 102 | |
| 0.50 | 96 | 92 | 112 | 108 | ||
| 0.99 | 105 | 101 | 119 | 115 | ||
Table A4.
The range of the confidence intervals of the durability to crack initiation () and durability to crack propagation to complete rupture under stress-controlled loading .
Table A4.
The range of the confidence intervals of the durability to crack initiation () and durability to crack propagation to complete rupture under stress-controlled loading .
| Material | p | |||
|---|---|---|---|---|
| 15Cr2MoVa | 1.00 | 0.01 | 2973 | 2581 |
| 0.50 | 3945 | 3424 | ||
| 0.99 | 5235 | 4544 | ||
| 1.12 | 0.01 | 379 | 338 | |
| 0.50 | 474 | 424 | ||
| 0.99 | 594 | 531 | ||
| 1.25 | 0.01 | 82 | 65 | |
| 0.50 | 130 | 103 | ||
| 0.99 | 205 | 163 | ||
| C45 | 1.00 | 0.01 | 4220 | 4096 |
| 0.50 | 4479 | 4348 | ||
| 0.99 | 4753 | 4614 | ||
| 1.25 | 0.01 | 747 | 727 | |
| 0.50 | 812 | 790 | ||
| 0.99 | 883 | 859 | ||
| 1.50 | 0.01 | 155 | 151 | |
| 0.50 | 163 | 159 | ||
| 0.99 | 171 | 167 | ||
| D16T1 | 1.0 | 0.01 | 4162 | 4033 |
| 0.50 | 4331 | 4194 | ||
| 0.99 | 4617 | 4472 | ||
| 1.15 | 0.01 | 898 | 837 | |
| 0.50 | 1032 | 958 | ||
| 0.99 | 1188 | 1117 | ||
References
- Маkhutov, N.А. Volume 1: Structural Durability, Resource and Tech. Safety; Nauka: Novosibirsk, Russia, 2005. (In Russian) [Google Scholar]
- Маkhutov, N.А. Volume 2: Structural Durability, Resource and Tech. Safety; Nauka: Novosibirsk, Russia, 2005. (In Russian) [Google Scholar]
- Makhutov, N.A.; Gadenin, M.M. Integrated Assessment of the Durability, Resources, Survivability, and Safety of Machinery Loaded under Complex Conditions. J. Mach. Manuf. Reliab. 2020, 49, 292–300. [Google Scholar] [CrossRef]
- Makhutov, N.A.; Panov, A.N.; Yudina, O.N. The development of models of risk assessment complex transport systems. In IOP Conference Series: Materials Science and Engineering, Proceedings of the V International Scientific Conference, Survivability and Structural Material Science (SSMS 2020), Moscow, Russia, 27–29 October 2020; Institute of Physics Publishing (IOP): Moscow, Russia, 2021; Volume 1023, Available online: https://scholar.google.lt/scholar?hl=lt&as_sdt=0%2C5&q=The+development+of+models+of+risk+assessment+complex+transport+systems&btnG (accessed on 25 March 2022).
- Bazaras, Ž.; Leonavičius, M.; Lukoševičius, V.; Raslavičius, L. Assessment of the Durability of Threaded Joints. Appl. Sci. 2021, 11, 12162. [Google Scholar] [CrossRef]
- O’Hara, E.M.; Phelan, B.; Osgerby, S.; Barrett, R.A.; Raghavendra, R.; Leen, S.B.; Harrison, N.M. Experimental and computational characterization of the effect of manufacturing-induced defects on high temperature, low-cycle fatigue for MarBN. Materialia 2020, 12, 100683. [Google Scholar] [CrossRef]
- Bao, J.; Wu, S.; Withers, P.J.; Wu, Z.; Li, F.; Fu, Y.; Sun, W. Defect evolution during high temperature tension-tension fatigue of SLM AISi10Mg alloy by synchrotron tomography. Mater. Sci. Eng. A 2020, 792, 139809. [Google Scholar] [CrossRef]
- Makhutov, N.A.; Zatsarinny, V.V.; Reznikov, D.O. Fatigue prediction on the basis of analysis of probabilistic mechanical properties. AIP Conf. Proc. 2020, 2315, 040025. [Google Scholar] [CrossRef]
- Tomaszewski, T.; Strzelecki, P.; Mazurkiewicz, A.; Musiał, J. Probabilistic estimation of fatigue strength for axial and bending loading in high-cycle fatigue. Materials 2020, 13, 1148. [Google Scholar] [CrossRef] [Green Version]
- Li, X.-K.; Chen, S.; Zhu, S.-P.; Ding Liao, D.; Gao, J.-W. Probabilistic fatigue life prediction of notched components using strain energy density approach. Eng. Fail. Anal. 2021, 124, 105375. [Google Scholar] [CrossRef]
- Gadolina, I.V.; Makhutov, N.A.; Erpalov, A.V. Varied approaches to loading assessment in fatigue studies. Int. J. Fatigue 2021, 144, 106035. [Google Scholar] [CrossRef]
- Angulo, S.C.; Silva, N.V.; Lange, D.A.; Tavares, L.M. Probability distributions of mechanical properties of natural aggregates using a simple method. Constr. Build. Mater. 2020, 233, 117269. [Google Scholar] [CrossRef]
- Raslavičius, L.; Bazaras, Ž.; Lukoševičius, V.; Vilkauskas, A.; Česnavičius, R. Statistical investigation of the weld joint efficiencies in the repaired WWER pressure vessel. Int. J. Press. Vessel. Pip. 2021, 189, 104271. [Google Scholar] [CrossRef]
- Weibull, W. Fatigue Testing and Analysis of Results; Pergamon Press: New York, NY, USA, 1961; Available online: https://books.google.lt/books?hl=lt&lr=&id=YM4gBQAAQBAJ&oi=fnd&pg=PP1&dq=Weibull,+W.+Fatigue+Testing+and+Analysis+of+Results&ots=VIVGA6VzJY&sig=UsrDkGvsP8go6hPS6IuYK3q9-H0&redir_esc=y#v=onepage&q=Weibull%2C%20W.%20Fatigue%20Testing%20and%20Analysis%20of%20Results&f=false (accessed on 31 March 2021).
- Weibull, W.; Rockey, K.C. Fatigue Testing and Analysis of Results. J. Appl. Mech. 1962, 29, 607. [Google Scholar] [CrossRef]
- Freudenthal, A.M.; Gumbel, E.J. On the statistical interpretation of fatigue tests. Proc. R. Soc. Lond. Ser. A 1953, 216, 309–332. [Google Scholar] [CrossRef]
- Freudenthal, A.M.; Gumbel, E.J. Physical and Statistical Aspects of Fatigue. Adv. Appl. Mech. 1956, 4, 117–158. [Google Scholar] [CrossRef]
- Iida, K.; Inoue, H. Evaluation of low cycle fatigue design curve based on life distribution shape. J. Soc. Nav. Archit. Jpn. 1973, 133, 235–247. [Google Scholar] [CrossRef]
- Serensen, S.V.; Shneiderovich, R.M. Deformations and rupture criteria under low-cycles fatigue. Exp. Mech. 1966, 6, 587–592. [Google Scholar] [CrossRef]
- Serensen, S.V.; Kogayev, V.P.; Shneiderovich, R.M. Load Carrying Ability and Strength Evaluation of Machine Components, 3rd ed.; Mashinostroeniya: Moscow, Russia, 1975; pp. 255–311. (In Russian) [Google Scholar]
- Stepnov, M.N.; Giacintov, E.V. Fatigue of Light Structural Alloys; Mashinostroeniya: Moscow, Russia, 1973. (In Russian) [Google Scholar]
- Daunys, M.; Sniuolis, R. Statistical evaluation of low cycle loading curves parameters for structural materials by mechanical characteristics. Nucl. Eng. Des. 2006, 236, 1352–1361. [Google Scholar] [CrossRef]
- Daunys, M.; Dundulis, R.; Kilikevicius, S.; Cesnavicius, R. Analytical investigation and numerical simulation of the stress-strain state in mechanically heterogeneous welded joints with a single-V butt weld. Eng. Fail. Anal. 2016, 62, 232–241. [Google Scholar] [CrossRef]
- Daunys, M.; Stulpinaitė, A.; Šniuolis, R. Statistical evaluation of low cycle stress-strain curves parameters for alloyed structural steels weld metals at room and elevated temperature. Mechanics 2010, 85, 5–10. [Google Scholar]
- Daunys, M.; Šniuolis, R.; Stulpinaitė, A. Evaluation of cyclic instability by mechanical properties for structural materials. Mechanics 2012, 18, 280–284. [Google Scholar] [CrossRef] [Green Version]
- Jiang, Z.; Han, Z.; Li, M. A probabilistic model for low-cycle fatigue crack initiation under variable load cycles. Int. J. Fatigue 2022, 155, 106528. [Google Scholar] [CrossRef]
- Williams, C.R.; Lee, Y.-L.; Rilly, J.T. A practical method for statistical analysis of strain–life fatigue data. Int. J. Fatigue 2003, 25, 427–436. [Google Scholar] [CrossRef]
- Strzelecki, P. Determination of fatigue life for low probability of failure for different stress levels using 3-parameter Weibull distribution. Int. J. Fatigue 2021, 145, 106080. [Google Scholar] [CrossRef]
- Liu, C.L.; Lu, Z.Z.; Xu, Y.L.; Yue, Z.F. Reliability analysis for low cycle fatigue life of the aeronautical engine turbine disc structure under random environment. Mater. Sci. Eng. A 2005, 395, 218–225. [Google Scholar] [CrossRef]
- Zhu, S.-P.; Huang, H.-Z.; Smith, R.; Ontiveros, V.; He, L.-P.; Modarres, M. Bayesian framework for probabilistic low cycle fatigue life prediction and uncertainty modeling of aircraft turbine disk alloys. Probabilistic Eng. Mech. 2013, 34, 114–122. [Google Scholar] [CrossRef]
- Zhao, Y.X.; Wang, J.N.; Gao, Q. Statistical evolution of small fatigue crack in 1Cr18Ni9Ti weld metal. Theor. Appl. Fract. Mech. 1999, 32, 55–64. [Google Scholar] [CrossRef]
- Bazaras, Ž.; Lukoševičius, V.; Vilkauskas, A.; Česnavičius, R. Probability Assessment of the Mechanical and Low-Cycle Properties of Structural Steels and Aluminium. Metals 2021, 11, 918. [Google Scholar] [CrossRef]
- Bazaras, Ž.; Lukoševičius, V. Statistical Estimation of Resistance to Cyclic Deformation of Structural Steels and Aluminum Alloy. Metals 2022, 12, 47. [Google Scholar] [CrossRef]
- GOST 25502-79 Standard; Strength Analysis and Testing in Machine Building. Methods of Metals Mechanical Testing. Methods of Fatigue Testing. Standardinform: Moscow, Russia, 1993.
- GOST 22015–76 Standard; Quality of Product. Regulation and Statistical Quality Evaluation of Metal Materials and Products on Speed-torque Characteristics. Standardinform: Moscow, Russia, 2010.
- Daunys, M. Cycle Strength and Durability of Structures; Technologija: Kaunas, Lithuania, 2005. (In Lithuanian) [Google Scholar]
- Bazaras, Ž.; Lukoševičius, V.; Bazaraitė, E. Structural Materials Durability Statistical Assessment Taking into Account Threshold Sensitivity. Metals 2022, 12, 175. [Google Scholar] [CrossRef]
- Regularities and Norms in Nuclear Power Engineering (PNAE) No. G-7-002-89; Rules of Equipment and Pipelines Strength Calculation of Nuclear Power Plant. Energoatomizdat: Moscow, Russia, 1989.
- Daunys, M.; Česnavičius, R. Low cycle stress strain curves and fatigue under tension—Compression and torsion. Mechanics 2009, 80, 5–11. [Google Scholar]
- GOST R 50779. 27–2017. State Standard R 50779.27–2017; Statistical Methods. Weibull Distribution. Data Analysis. Standardinform: Moscow, Russia, 2017.
- Stepnov, M.N. Statistical Methods for Computation of the Results of Mechanical Experiments, Mechanical Engineering; Mashinostroeniya: Moscow, Russia, 1985; pp. 87–89. (In Russian) [Google Scholar]
- Montgomery, D.C.; Runger, G.C. Statistical Intervals for a Single Sample. In Applied Statistics and Probability for Engineers, 7th ed.; Wiley: Hoboken, NJ, USA, 2018; pp. 170–192. [Google Scholar]
Figure 1.
Shape and dimensions of the specimens for low-cycle fatigue tension–compression experiments (units in mm).
Figure 1.
Shape and dimensions of the specimens for low-cycle fatigue tension–compression experiments (units in mm).

Figure 2.
Low-cycle fatigue durability curves of stress-controlled loading (1) and (2) comparative to cross-sectional narrowing (2) of steel 15Cr2MoVa.
Figure 2.
Low-cycle fatigue durability curves of stress-controlled loading (1) and (2) comparative to cross-sectional narrowing (2) of steel 15Cr2MoVa.

Figure 3.
Low-cycle fatigue durability curves of stress-controlled loading (1) and (2) comparative to cross-sectional narrowing (2) of steel C45.
Figure 3.
Low-cycle fatigue durability curves of stress-controlled loading (1) and (2) comparative to cross-sectional narrowing (2) of steel C45.

Figure 4.
Low-cycle fatigue durability curves of stress-controlled loading (1) and (2) comparative to cross-sectional narrowing (2) of aluminium alloy D16T1.
Figure 4.
Low-cycle fatigue durability curves of stress-controlled loading (1) and (2) comparative to cross-sectional narrowing (2) of aluminium alloy D16T1.

Figure 5.
Stress-controlled loading failure histograms of steel 15Cr2MoVa ((a)—loading level ); steel C45 ((b)—loading level ); aluminium alloy D16T ((c)—loading level ).
Figure 5.
Stress-controlled loading failure histograms of steel 15Cr2MoVa ((a)—loading level ); steel C45 ((b)—loading level ); aluminium alloy D16T ((c)—loading level ).

Figure 6.
The histograms of the durability to fatigue crack initiation () (a–c) and failure () (d–f) of steel 15Cr2MoVa ((a,d)—loading level ); steel C45 ((b,e)—loading level ); aluminium alloy D16T ((c,f)—loading level ), under strain-controlled loading.
Figure 6.
The histograms of the durability to fatigue crack initiation () (a–c) and failure () (d–f) of steel 15Cr2MoVa ((a,d)—loading level ); steel C45 ((b,e)—loading level ); aluminium alloy D16T ((c,f)—loading level ), under strain-controlled loading.

Figure 7.
Comparison of the coefficients of variation of the log-normal distribution pattern with normal (red line) and Weibull (blue line) distribution patterns: strain-controlled loading (a), stress-controlled loading (b); (1—steel 15Cr2MoVa; 2—steel C45; 3—aluminium alloy D16T1).
Figure 7.
Comparison of the coefficients of variation of the log-normal distribution pattern with normal (red line) and Weibull (blue line) distribution patterns: strain-controlled loading (a), stress-controlled loading (b); (1—steel 15Cr2MoVa; 2—steel C45; 3—aluminium alloy D16T1).

Figure 8.
The dependence of the relative quantity K of the log-normal distribution pattern on the mean squared deviation (σ) (a) and the coefficient of variation (V) (b) (1—steel 15Cr2MoVa; 2—steel C45; 3—aluminium alloy D16T1).
Figure 8.
The dependence of the relative quantity K of the log-normal distribution pattern on the mean squared deviation (σ) (a) and the coefficient of variation (V) (b) (1—steel 15Cr2MoVa; 2—steel C45; 3—aluminium alloy D16T1).

Table 1.
Chemical composition of the materials.
| Material | C | Si | Mn | Cr | Ni | Mo | V | S | P | Mg | Cu | Al |
|---|---|---|---|---|---|---|---|---|---|---|---|---|
| % | ||||||||||||
| 15Cr2MoVA (GOST 5632-2014) | 0.18 | 0.27 | 0.43 | 2.7 | 0.17 | 0.67 | 0.30 | 0.019 | 0.013 | - | - | - |
| C45 (GOST 1050-2013) | 0.46 | 0.28 | 0.63 | 0.18 | 0.22 | - | - | 0.038 | 0.035 | - | - | - |
| D16T1 (GOST 4784-97) | - | - | 0.70 | - | - | - | - | - | - | 1.6 | 4.5 | 9.32 |
Table 2.
Mechanical properties of the materials.
| Material | ||||||
|---|---|---|---|---|---|---|
| % | MPa | % | ||||
| 15Cr2MoVA (GOST 5632-2014) | 0.200 | 280 | 400 | 580 | 1560 | 80 |
| C45 (GOST 1050-2013) | 0.260 | 340 | 340 | 800 | 1150 | 39 |
| D16T1 (GOST 4784-97) | 0.600 | 290 | 350 | 680 | 780 | 14 |
Table 3.
Low-cycle testing programme.
| Material | ||||
|---|---|---|---|---|
| Number of Specimens, Pieces | Number of Specimens, Pieces | |||
| 15Cr2MoVA | 1.8 | 40 | 1.00 | 20 |
| 3.0 | 80 | 1.12 | 40 | |
| 5.0 | 40 | 1.25 | 20 | |
| C45 | 2.5 | 50 | 1.00 | 20 |
| 4.0 | 120 | 1.25 | 40 | |
| 6.0 | 50 | 1.50 | 20 | |
| D16T1 | 1.0 | 20 | 1.00 | 20 |
| 1.5 | 80 | 1.15 | 20 | |
| 2.0 | 20 | - | - | |
Table 4.
Goodness-of-fit estimation of the durability properties under the strain-controlled loading showed that the result samples were characterised by log-normal distribution using the Smirnov compatibility criterion, .
Table 4.
Goodness-of-fit estimation of the durability properties under the strain-controlled loading showed that the result samples were characterised by log-normal distribution using the Smirnov compatibility criterion, .
| Cyclic Properties | Material | Number of Samples | |||
|---|---|---|---|---|---|
| 15Cr2MoVa | 40 | 1.8 | 0.6342 | 0.371 | |
| 80 | 3.0 | 0.4322 | 0.171 | ||
| 40 | 5.0 | 0.5032 | 0.253 | ||
| C45 | 50 | 1.5 | 0.4408 | 0.181 | |
| 120 | 4.0 | 0.440 | 0.151 | ||
| 50 | 6.0 | 0.6814 | 0.416 | ||
| D16T1 | 20 | 1.0 | 0.5506 | 0.294 | |
| 80 | 1.5 | 0.4582 | 0.202 | ||
| 20 | 2.0 | 0.4522 | 0.192 | ||
| 15Cr2MoVa | 40 | 1.8 | 0.5840 | 0.323 | |
| 80 | 3.0 | 0.8718 | 0.560 | ||
| 40 | 5.0 | 0.4000 | 0.151 | ||
| C45 | 50 | 1.5 | 0.4934 | 0.233 | |
| 120 | 4.0 | 0.4642 | 0.202 | ||
| 50 | 6.0 | 0.2232 | 0.013 | ||
| D16T1 | 20 | 1.0 | 0.5730 | 0.313 | |
| 80 | 1.5 | 0.4090 | 0.151 | ||
| 20 | 2.0 | 0.5380 | 0.284 |
Table 5.
Goodness-of-fit estimation of the durability properties under the stress-controlled loading showed that the result samples were characterised by log-normal distribution using the Smirnov compatibility criterion, .
Table 5.
Goodness-of-fit estimation of the durability properties under the stress-controlled loading showed that the result samples were characterised by log-normal distribution using the Smirnov compatibility criterion, .
| Cyclic Property | Material | Number of Samples | |||
|---|---|---|---|---|---|
| 15Cr2MoVa | 20 | 1.00 | 0.2530 | 0.025 | |
| 40 | 1.12 | 0.5764 | 0.313 | ||
| 20 | 1.25 | 0.2248 | 0.013 | ||
| C45 | 20 | 1.00 | 0.3834 | 0.122 | |
| 40 | 1.25 | 0.4620 | 0.202 | ||
| 20 | 1.50 | 0.5242 | 0.263 | ||
| D16T1 | 20 | 1.00 | 0.2188 | 0.013 | |
| 20 | 1.15 | 0.3637 | 0.104 |
Table 6.
Values of the coefficient under the strain-controlled loading.
| 15Cr2MoVa | C45 | D16T1 | ||||
|---|---|---|---|---|---|---|
| 1.0 | - | - | - | - | 3.33 | 3.37 |
| 1.5 | - | - | - | - | 7.26 | 7.90 |
| 1.8 | 1.96 | 1.92 | - | - | - | - |
| 2.0 | - | - | - | - | 3.01 | 3.59 |
| 2.5 | - | - | 5.93 | 5.93 | - | - |
| 3.0 | 2.24 | 2.81 | - | - | - | - |
| 4.0 | - | - | 4.52 | 4.63 | - | - |
| 5.0 | 1.93 | 1.98 | - | - | - | - |
| 6.0 | - | - | 2.67 | 2.67 | - | - |
Table 7.
Values of the coefficient under the stress-controlled loading.
| 15Cr2MoVa | C45 | D16T1 | |
|---|---|---|---|
| 1.00 | 8.09 | 2.17 | 2.45 |
| 1.12 | 12.33 | - | - |
| 1.15 | - | - | 4.16 |
| 1.25 | 18.75 | 3.03 | - |
| 1.50 | - | 2.32 | - |
Publisher’s Note: MDPI stays neutral with regard to jurisdictional claims in published maps and institutional affiliations. |
© 2022 by the authors. Licensee MDPI, Basel, Switzerland. This article is an open access article distributed under the terms and conditions of the Creative Commons Attribution (CC BY) license (https://creativecommons.org/licenses/by/4.0/).
Share and Cite
MDPI and ACS Style
Bazaras, Ž.; Lukoševičius, V. Statistical Assessment of Low-Cycle Fatigue Durability. Symmetry 2022, 14, 1205. https://0-doi-org.brum.beds.ac.uk/10.3390/sym14061205
AMA Style
Bazaras Ž, Lukoševičius V. Statistical Assessment of Low-Cycle Fatigue Durability. Symmetry. 2022; 14(6):1205. https://0-doi-org.brum.beds.ac.uk/10.3390/sym14061205
Chicago/Turabian StyleBazaras, Žilvinas, and Vaidas Lukoševičius. 2022. "Statistical Assessment of Low-Cycle Fatigue Durability" Symmetry 14, no. 6: 1205. https://0-doi-org.brum.beds.ac.uk/10.3390/sym14061205
Note that from the first issue of 2016, this journal uses article numbers instead of page numbers. See further details here.