

Asymmetric Heat Transfer in Aircraft Electrothermal Anti-Icing

1
Yibin Institute of Industrial Technology, Sichuan University, Chengdu 610065, China
2
State Key Laboratory of Aerodynamics, China Aerodynamics Research and Development Center, Mianyang 621050, China
3
Key Laboratory of Deep Earth Science and Engineering, Sichuan University, Chengdu 610065, China
*
Authors to whom correspondence should be addressed.
Symmetry 2023, 15(3), 599; https://0-doi-org.brum.beds.ac.uk/10.3390/sym15030599
Submission received: 23 December 2022
/
Revised: 2 February 2023
/
Accepted: 23 February 2023
/
Published: 26 February 2023
(This article belongs to the Special Issue Symmetry and Asymmetry in Composite Materials and Its Applications)
Abstract
:Aircraft icing is an important cause of air disasters, and electrothermal anti-icing is a common protection method. In this work, the influence of icing meteorological conditions on the anti-icing was studied through an icing wind tunnel experiment on the fairing. Based on the finite volume method, a transient heat transfer calculation method for electrothermal anti-icing was proposed. The calculated results were compared with the experimental results, and the influence of heating mode and structure layout on the anti-icing effect was analyzed. The results show that the calculated results are in good agreement with the experimental results, and the heat transfer of the anti-icing structure shows obvious asymmetry. First, during heating, the temperature gradient of the structural profile is large, the high temperature is concentrated in the heating layer, and the temperature distribution of the heating layer is relatively uniform. During cooling, the temperature distribution of the structural profile is more uniform, the high temperature is mainly concentrated in the back conduction layer, and the temperature of the outer wall increases first and then decreases from the center to the surroundings. Second, when the spray is turned on, the temperature of the outer wall is significantly reduced, but the temperature of the heating layer hardly changes. Third, the uniform heating mode can simultaneously raise the temperature of the outer wall and reduce the temperature of heating layer. Fourth, while the front conduction layer can significantly affect the temperature of the heating layer and the outer wall, the effect of the back conduction layer is small. However, the back one can be used to control the structural temperature more finely.
1. Introduction
When an aircraft passes through a cloud containing supercooled water droplets, the supercooled water will impact its surface, resulting in icing phenomena. Icing will damage its aerodynamic performance and bring about a series of negative effects such as reduced lift, increased resistance, stuck control surface, etc. In serious cases, it will directly harm the safety of the aircraft and lead to flight accidents [1,2,3]. In the past two decades, icing has caused many air disasters, including the Yichun accident in 2001, Anhui accident in 2006, etc.
By adopting various research methods such as theoretical analysis [4], numerical calculation [5,6,7], icing wind tunnel experiments [4,8], and real flight experiments, researchers have carried out a series of studies on icing and protection of aircraft components, and obtained relatively fruitful results [9,10,11,12,13], including the numerical calculation method of collection efficiency of droplets, the similarity criterion of icing wind tunnel tests, etc. Based on the existing technical means, electrothermal anti-icing is a relatively reliable anti-icing method at present. The key problem is the design of heating mode and structure layout. The design of an electrothermal anti-icing system involves external anti-icing heat load and internal structural heat transfer, as well as their coupling. The relevant research can be carried out by numerical computation and icing experiments. For the computation of anti-icing heat load preventing the freezing of supercooled water, current research methods are relatively mature [14,15,16], and there are many conclusions. For the computation of coupling heat transfer, the current research usually adopts the loose coupling method, that is, the computations of fluid domain and solid domain are performed separately.
Considering the need for anti-icing of the outer wall and the durability of the heating layer, the design of the anti-icing system needs to meet two asymmetric temperature requirements, that is, the minimum temperature of the outer wall should be higher than 273.15 K under icing conditions and the maximum temperature of the heating layer should be lower than 363.15 K under non-icing conditions. Therefore, the heat transfer analysis of the internal structure is important. For the experiment, the anti-icing structure is composed of multi-layer composite materials, including resistance wire, glass cloth, insulation cloth, etc. Hence, it is difficult to measure the internal structural temperature. However, without the experiment, the numerical computation may lead to some errors due to improper theories and unreasonable settings. Therefore, the combination of numerical computation and an experiment is necessary for the electrothermal anti-icing problem, but relevant studies are few at present.
Compared with other parts of the aircraft, the icing of the fairing may lead to more serious consequences, especially ice shedding, which may cause destructive damage to the propeller and the airframe structure. Hot air anti-icing cannot be realized easily due to the restriction of fairing structure, mechanical de-icing may aggravate the risk of ice shedding, and material anti-icing is not mature. Therefore, electrothermal anti-icing is the main anti-icing method of fairings at this stage. However, the existing research objects of electrothermal anti-icing are mainly wings and other aircraft components, and research on the propeller fairing is scarce [17,18]. In engineering, the anti-icing of the fairing generally refers directly to the anti-icing mode of other components. Influenced by the shape, installation position, and aerodynamic characteristics, the anti-icing characteristics of the fairing may be different from those of the wing, etc. This rough treatment may bring low anti-icing efficiency and potential safety hazards.
In view of the lack of heat transfer research on anti-icing structures at present, a typical fairing model was used to study the asymmetric heat transfer in electrothermal anti-icing by combining experimental and numerical methods. To meet the asymmetric temperature requirements of anti-icing structures, the influence of heating mode and structure layout on the anti-icing was analyzed quantitatively.
2. Materials and Methods
2.1. Experimental Scheme and Equipment
2.1.1. Design of Experimental Scheme
The technical difficulties and costs of designing and manufacturing icing wind tunnels increase exponentially with size. Therefore, all icing wind tunnels have size limitations at present, even some large icing wind tunnels, such as the French S1MA [19] of 14 m in length and 8 m in diameter, the French CEPr R6 of 5 m in diameter [20], the American IRT [21] of 2.7 × 1.8 × 6.1 m3, the Russian AHT-SD of 1.0 × 1.0 m2 [20], the Italian IWT [22] of 2.35 × 2.25 × 7.0 m3, the Chinese FL-16 [23] of 3.0 × 2.0 × 6.5 m3, etc. A full-size aircraft is difficult to fit directly, so geometric shrinkage is important. Geometric shrinkage is divided into full-size shrinkage and mixed shrinkage. Full-size shrinkage is a method to reduce the whole size of the real geometry according to the geometric scale, so as to break the size limitation and conduct relevant experiments. However, the similar criteria for anti-icing experiments in the field are not mature yet, so the accuracy of the method cannot be guaranteed. Mixed shrinkage is a method to ensure that the leading shape of the scaled geometry is the same as that of the real geometry, and adopts large-scale or other smooth shapes for the rear of the real geometry [24]. Thus, the pressure coefficient distribution of the scaled geometry is same as the real geometry, so as to ensure that the collection efficiency of droplets, an important parameter in anti-icing experiments, is consistent with that of the real geometry. Since the anti-icing experimental results of the full-size shrinkage method may have large errors, the mixed shrinkage method with better effect was adopted in this study.
2.1.2. Experimental Equipment
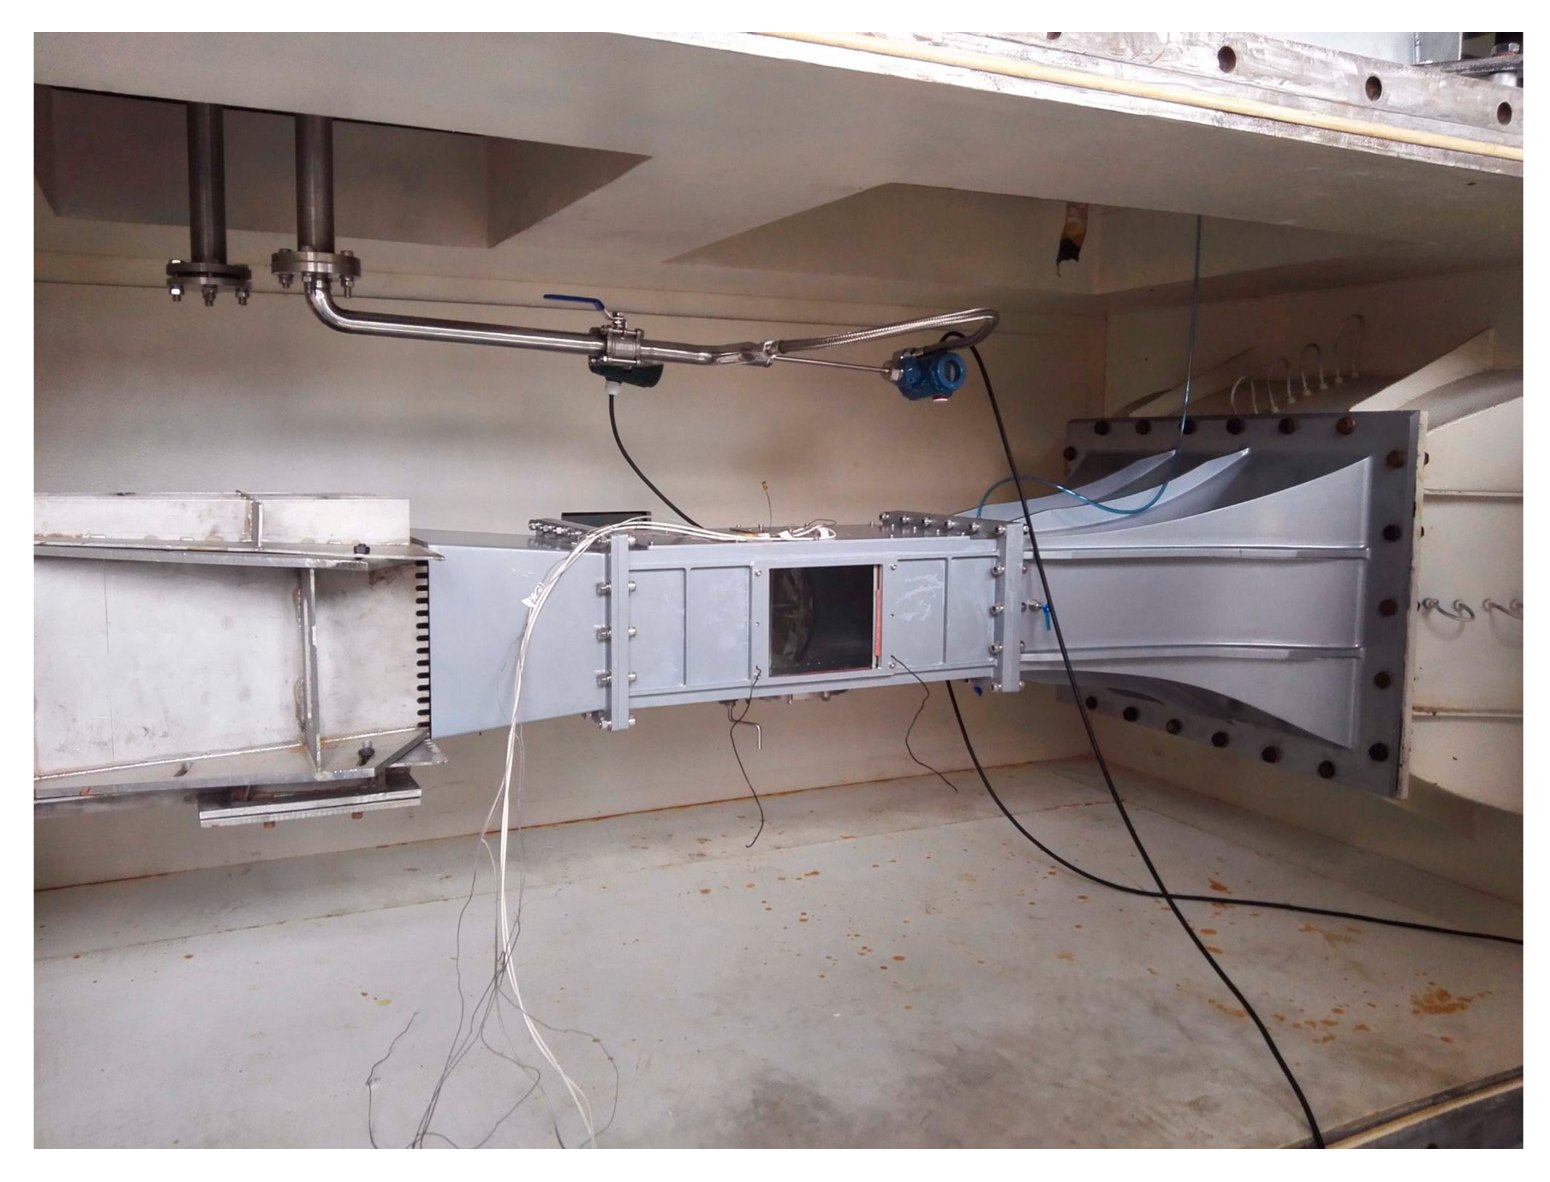
This experiment was carried out with the icing wind tunnel FL-16y of 0.3 × 0.2 × 0.65 m3 at the China Aerodynamics Research and Development Center. The layout of the wind tunnel and the experimental section are shown in Figure 1 and Figure 2, respectively. Its main performance parameters are shown in Table 1.
2.1.3. Experimental Model and Installation
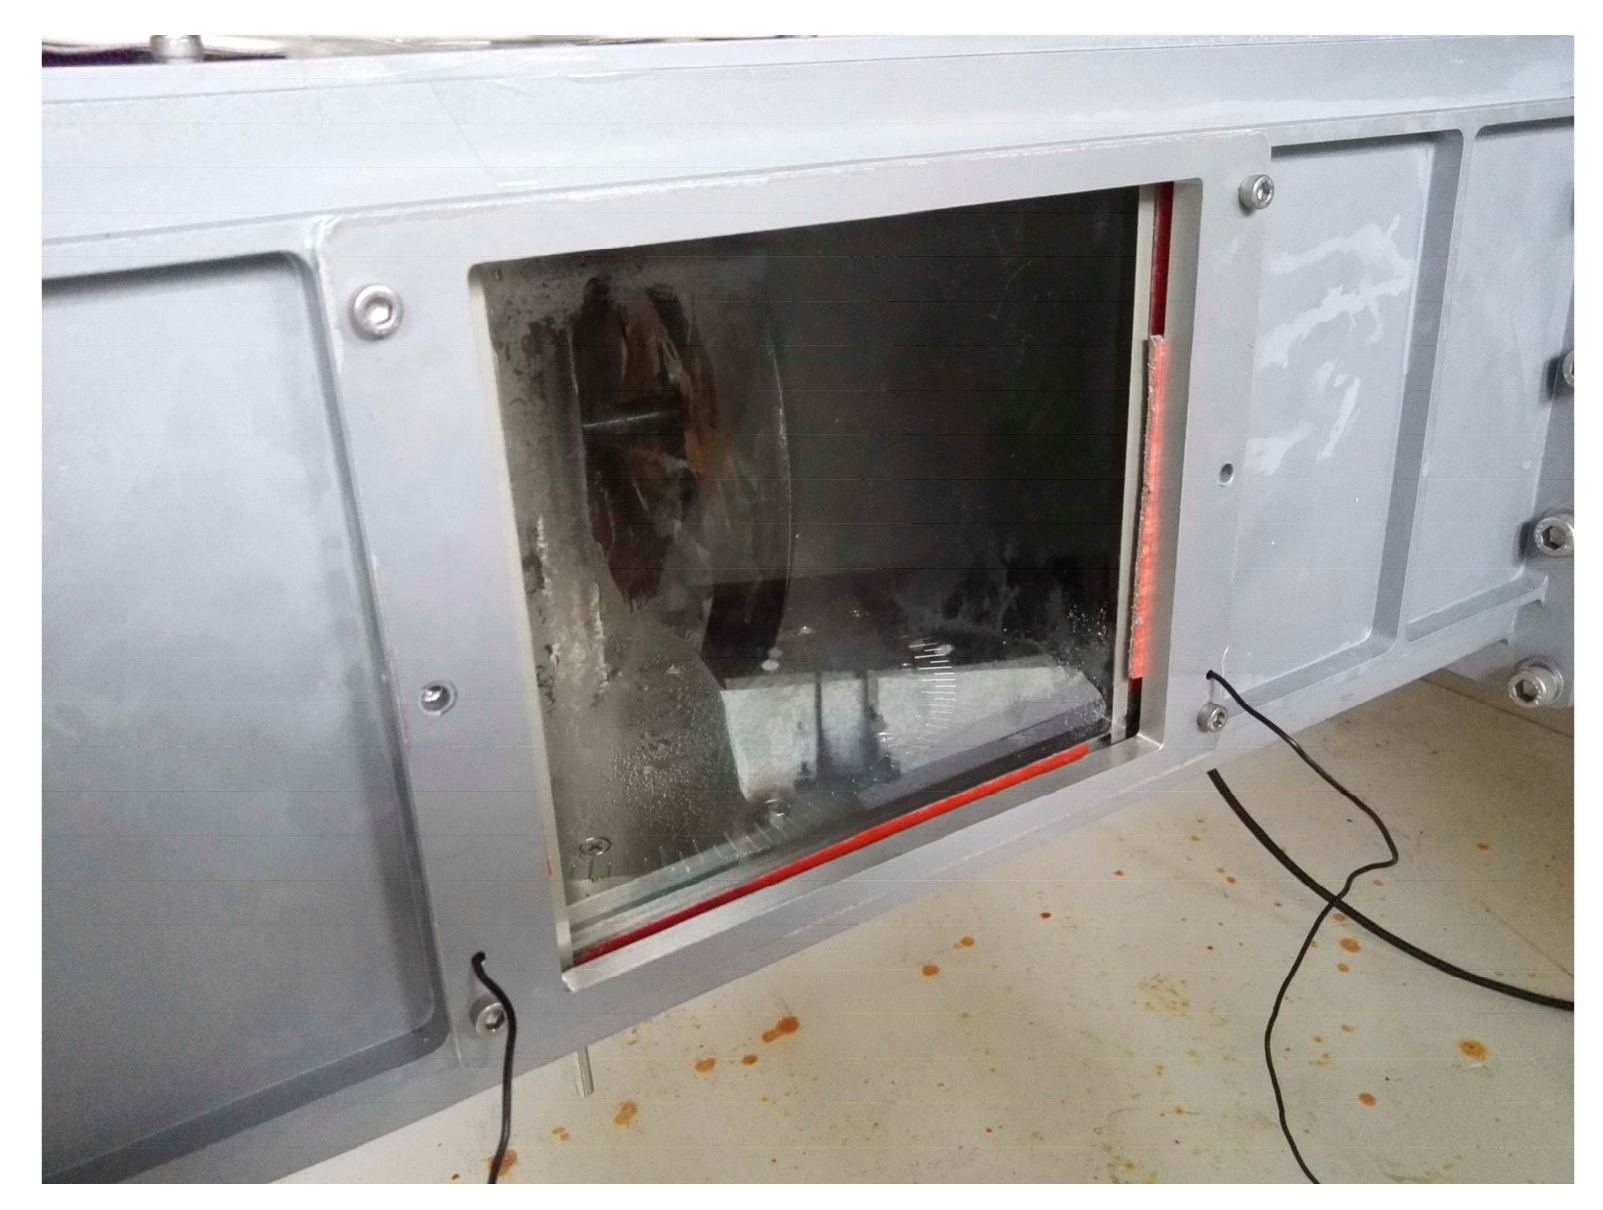
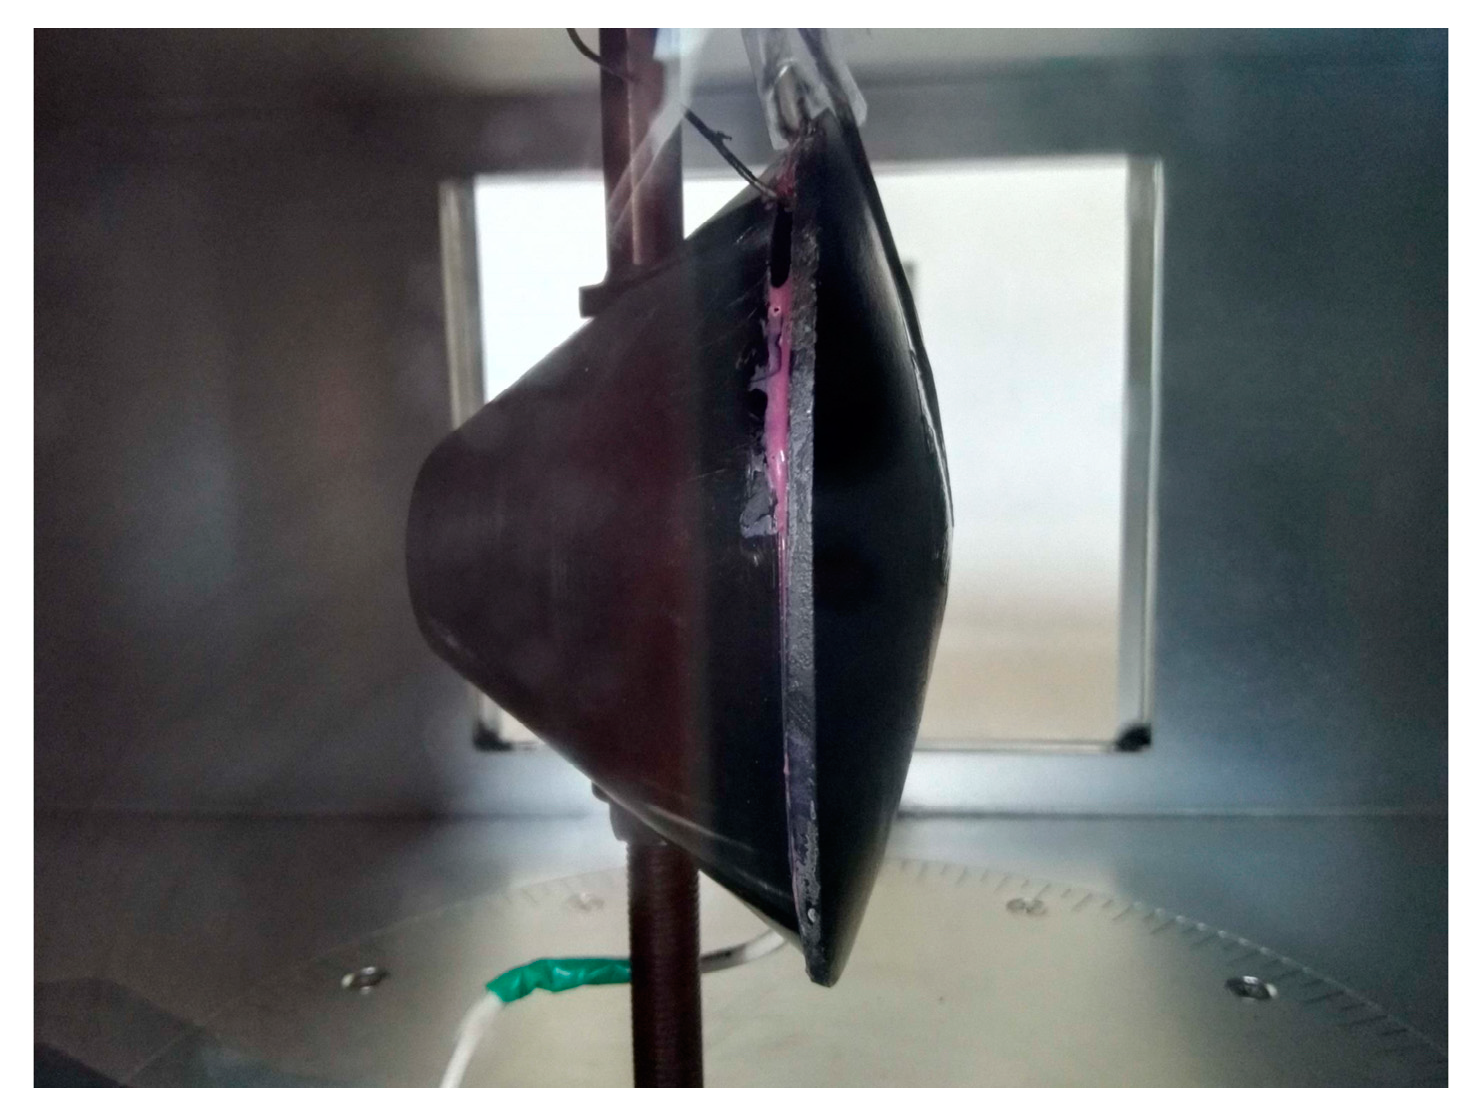
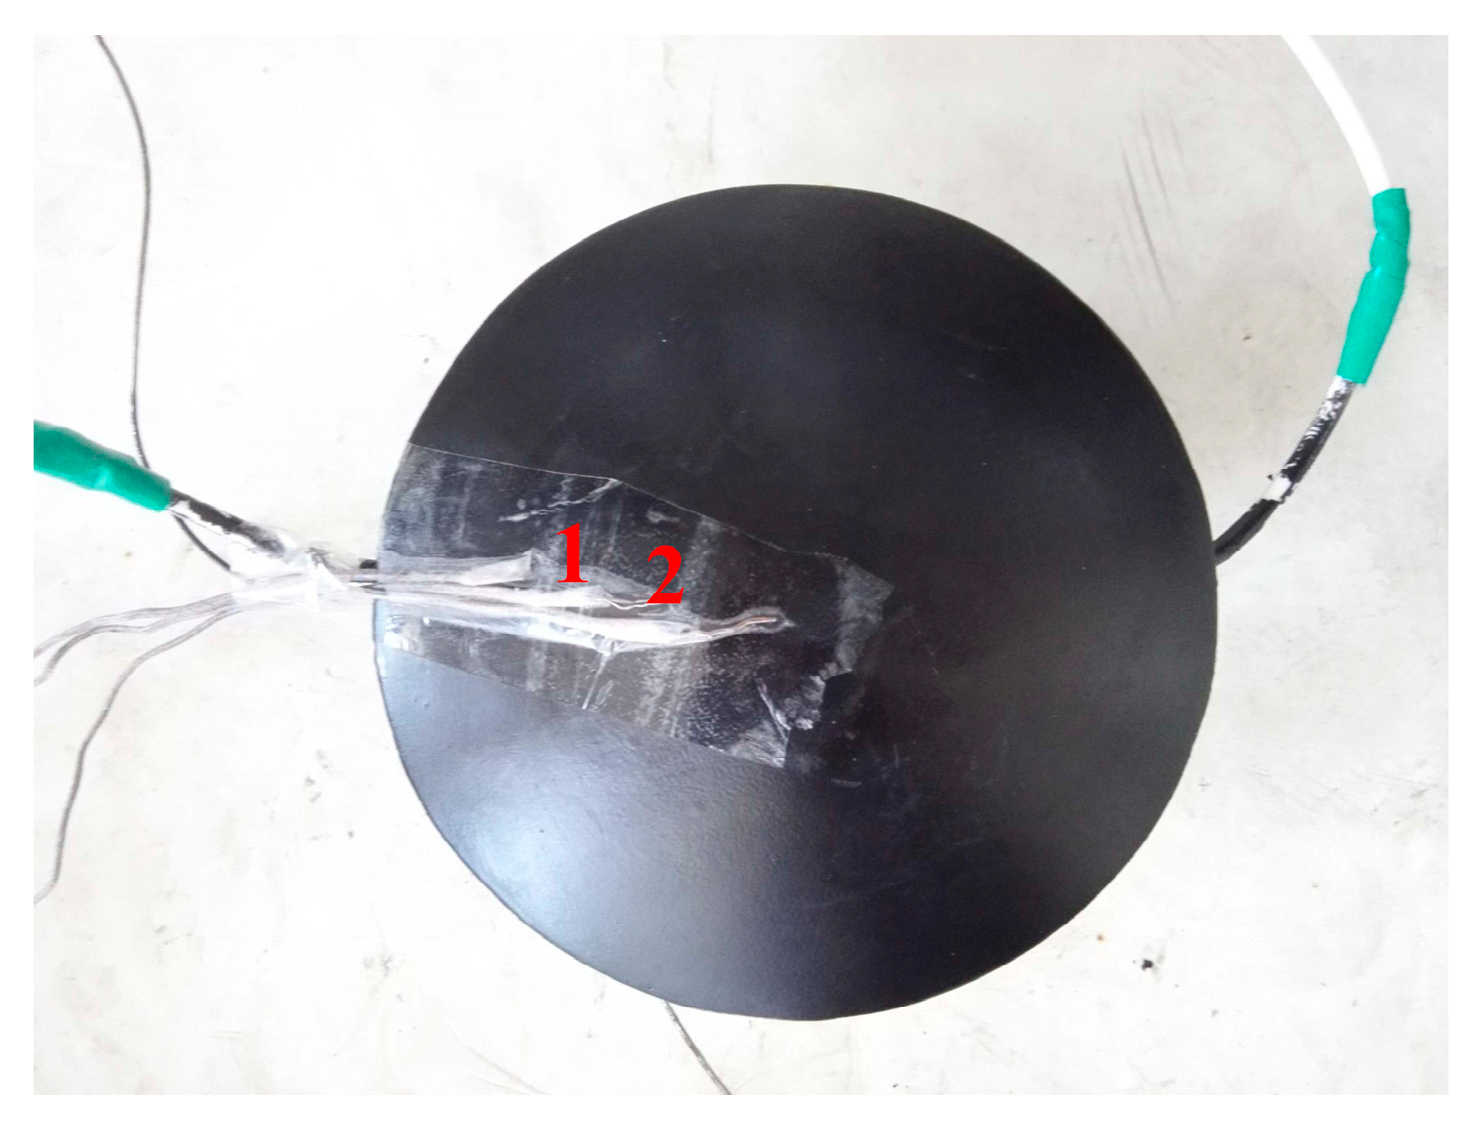
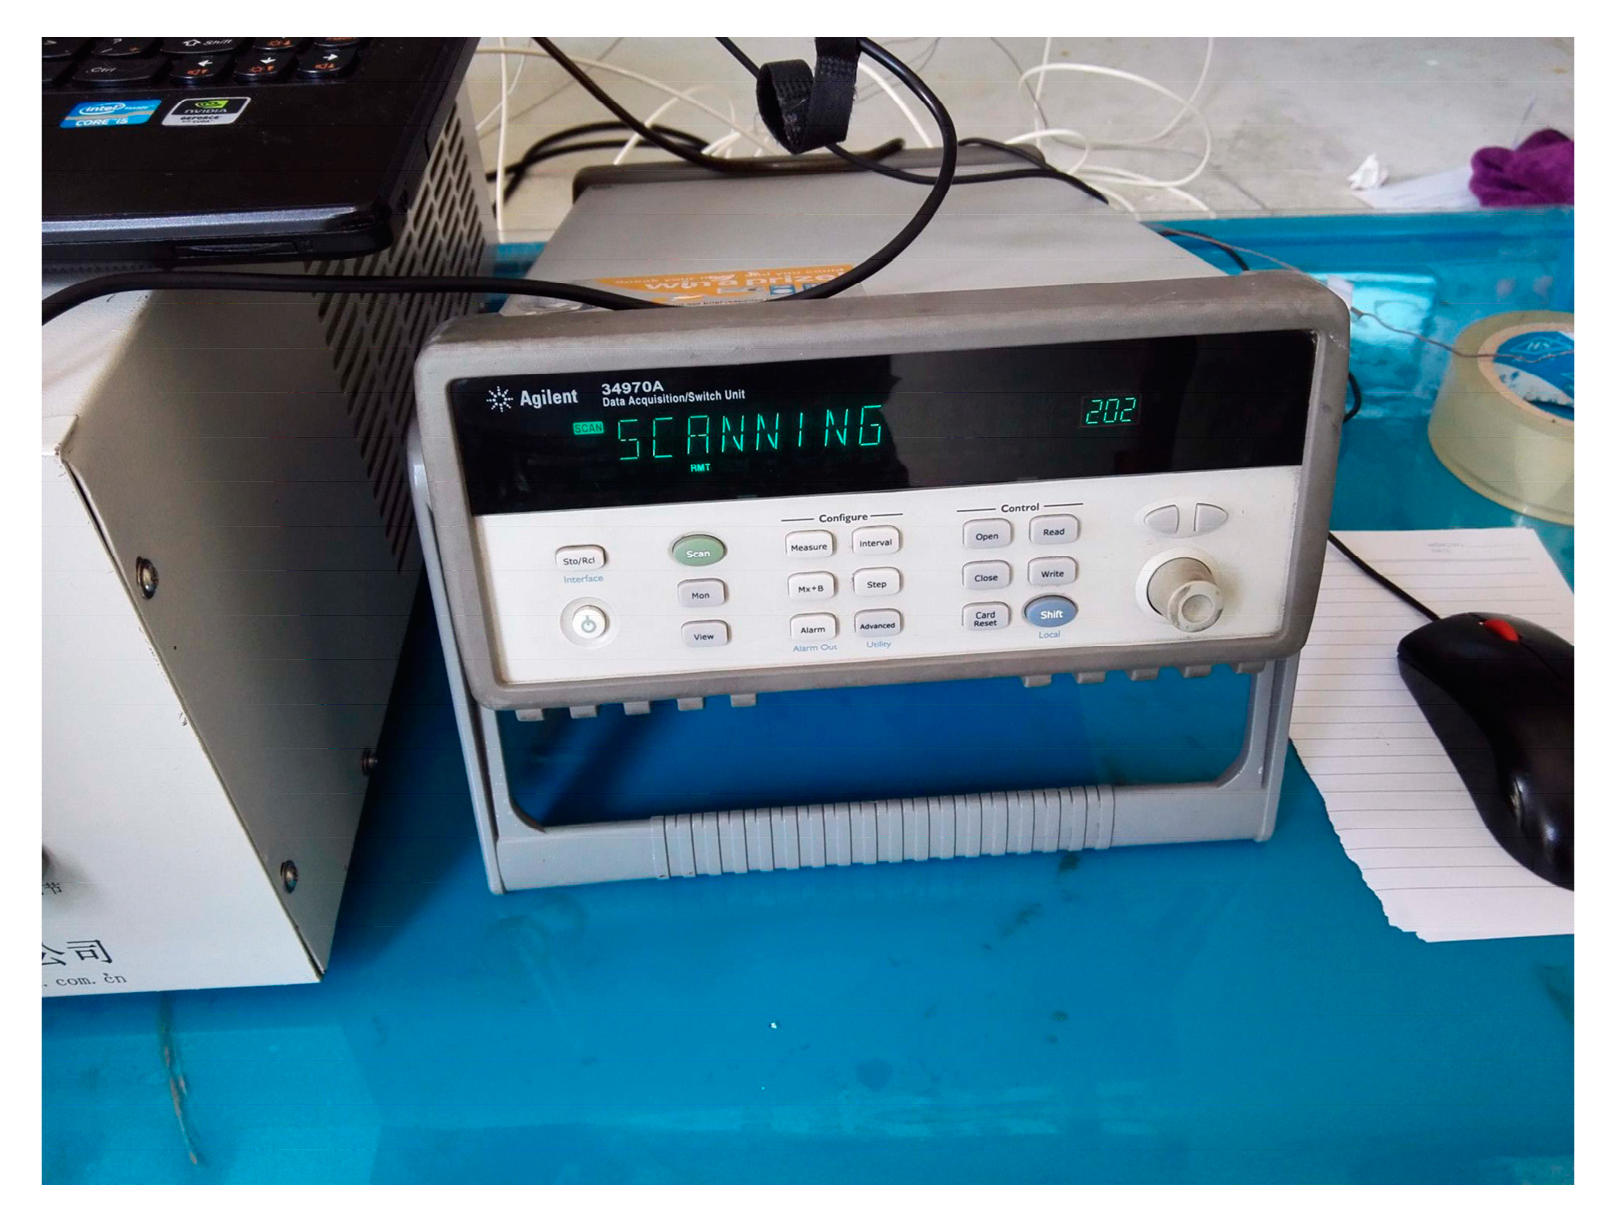
When the model size is large, there will be obvious marginal effects interfering with the convective heat transfer on the model surface. To reduce the interference of the marginal effect, the experimental model adopts the mixed shrinkage model of a small fairing 0.12 m in diameter. The leading shape of the experimental model is consistent with that of a real fairing, which is divided into the front conduction layer, the heating layer, and the back conduction layer. The material of the conduction layer is glass cloth, and the heating layer is uniformly arranged resistance wire. The heating power of the resistance wire is 6200 W/m2, lasting for 45 s, and then cooling for 80 s. To reduce the influence of turbulence on the leading shape, the rear shape of the experimental model is smoothed with the structure shown in Figure 3. The interior of the rear shape is an inner cavity filled with air. The actual structure is shown in Figure 4. It is worth pointing out that the endothermic layer in Figure 4 is a new concept introduced to realize the tight coupling of heat transfer between the fluid domain and the solid domain. The specific simulation settings are shown in Section 2.2 and Section 3.1 according to the actual experimental conditions. Symmetry exists in the structure of the fairing. To measure the anti-icing effect of different areas, two thermistors are respectively arranged at 0.5 R and 0.25 R, as shown in Figure 5. The numbers are 1 and 2 from the edge to the center. The thermistor is connected to the multi-channel temperature-measuring instrument (the Keysight 34970A temperature recorder with a sensitivity of 0.001 K) to monitor the surface temperature of the model, as shown in Figure 6. Its sampling period is 1 s.
2.2. Numerical Computation Method
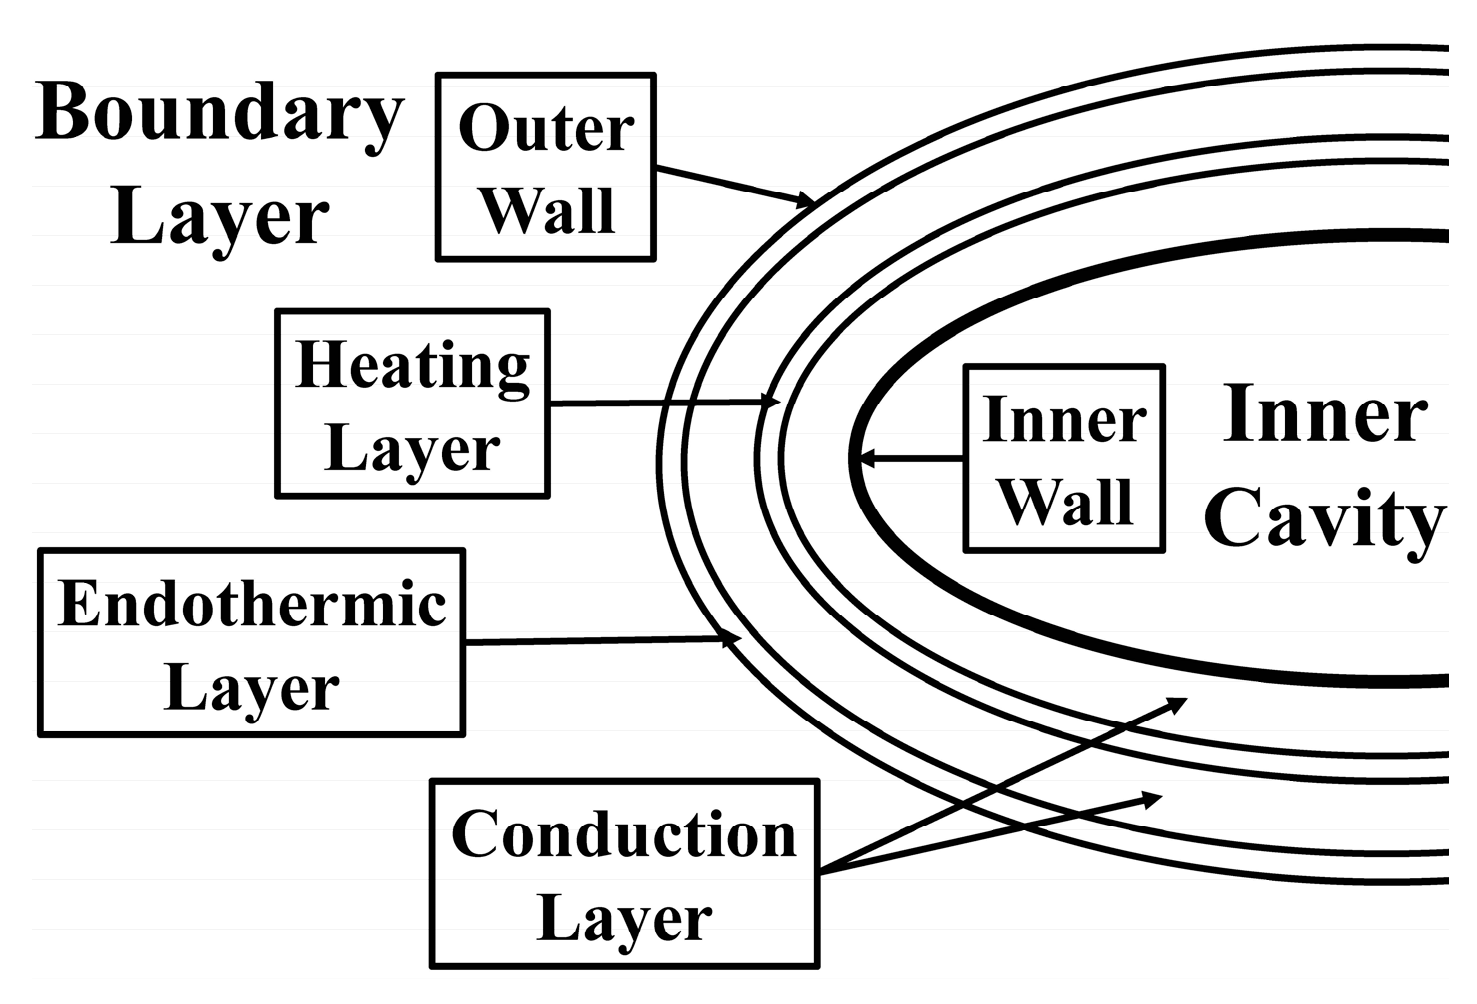
As the electrothermal anti-icing system contains multiple structures, such as the heating layer, conduction layer, and inner cavity, it is difficult to measure the internal temperature in the experiment, and the distribution of the surface temperature is also hard to obtain due to the limitation of the measuring device. Therefore, the work analyzes the heat transfer of the electrothermal anti-icing structure by numerical computation. According to the experimental model, the geometric model used in the computation is as consistent with it as possible. Its structure comprises two conduction layers and a heating layer between them. Its outer surface is simplified as a very thin endothermic layer varying with the wall temperature due to the energy terms, such as evaporation and water droplet impingement. The numerical computation of the anti-icing process is mainly divided into three stages: air flow field computation, water droplet flow field computation, and heat transfer computation of the anti-icing structure. The computation methods of the first two stages are relatively mature [10,25]. An SA turbulence model with equivalent roughness correction is adopted for the computation of air flow field, and the Euler method is adopted for the computation of the water droplet flow field. The heat transfer process is described by the unsteady heat conduction equation. For the computation of heat transfer, the computation is carried out in Fluent combined with UDF. The SIMPLE algorithm, combined with second order upwind scheme and first order implicit method, is adopted. The time step of the simulation is 0.5 s. In the simulation, the initial state of the solid region is the inflow temperature. The governing equation of heat transfer is as follows:
where is the thermal conductivity, is the material density, is the temperature, and is a volumetric heat source. is the sensible enthalpy, and its computation formula is as follows:
where is the reference temperature, is the specific heat of the material.Figure 4 shows the structure model adopted in this computation. As the inner cavity of the structure is filled with air, the boundary of the inner wall is regarded as natural convection, and the convective heat transfer coefficient is 2 W/(m2·K). The heat flux of the inner wall is as follows:
where is the temperature of the inner wall, and is the free stream temperature.
The two conduction layers are made of glass cloth, and their material parameters are shown in Table 2. In the two domains, is as follows:
The heating layer is an alloy sheet. In the simulation, it is regarded as the boundary between the two conduction layers and applied with a virtual thickness () of 1.0 × 10⁻⁴ m. Its material is set as aluminum, and it is a periodic volumetric heat source of 6.200E7 W/m3 (heating time of 45 s and cooling time of 80 s). In the domain, is as follows:
The outer wall is a coupled wall, applied with a virtual thickness () of 1.0 × 10⁻⁵ m and constructed of glass cloth. This virtual layer is the endothermic layer. Moreover, a negative volumetric heat source is applied to the layer to achieve the tight coupling of energy terms in anti-icing. In the domain, is as follows:
In theory, convective heat transfer is included in the endothermic layer (in operation, because Fluent can calculate the convective heat transfer with air using the coupled wall, it is necessary to take out the role of convective heat transfer from the following formula).
The negative volumetric heat source is calculated by the following formula:
In the equation, is the convective heat transfer, and is the heat flux carried away by evaporation. is the heat flux caused by the temperature difference between water droplets and the object surface. represents the pneumatic heating. is the heat flux converted from the kinetic energy of water droplets. They are specified as follows:
where is the convective heat transfer coefficient, obtained from the airflow field. is the recovery factor, which is 0.9. is the inflow velocity. is the specific heat capacity of air. is the impact velocity of water droplets. is the temperature of the outer wall. is the inflow temperature. is the specific heat capacity of droplets. is the coefficient of droplet kinetic energy conversion, its formula is from the ratio of viscous dissipation to kinetic energy in [26], and its value is 0.65 in the simulation. is the maximum diameter of droplets. is the initial diameter of droplets. is the Reynolds number of droplets. is latent heat of evaporation. The formulas for and are as follows:
where is the liquid water content determined by icing ambient conditions, is the collection efficiency of droplets coming from the water droplet field. is the density of air. is a vapor gas constant, which is 461.4. is the Lewis number, which is 1.
3. Experimental and Calculated Results and Analysis
To keep the temperature fluctuation of the structure in adjacent periods consistent, the electric heating in the experiment needed at least three cycles. The electric heating needed different cycles with different heating modes and space layout. For the convenience of uniformity, the heat transfer computation of 32 cycles was carried out before opening the spray. The spray was turned on at 4000 s to simulate icing conditions. In the experiment, only the outer wall temperature was monitored. In the computation, the temperatures of the heating layer and the outer wall were monitored simultaneously. The calculated outer wall temperature was compared with the experimental results.
3.1. Experimental and Calculated Results
In the experiment and the computation, the thickness of the front conduction layer was 1.6 mm and the thickness of the back conduction layer was 4.8 mm.
According to the purpose of the experiment and the capacity of the icing wind tunnel, the icing conditions are shown in Table 3 Case 1. In the computation of air flow field, the inlet was given the velocity inlet boundary conditions with the temperature of 263.15 K and velocity of 30 m/s, and the outlet was given the pressure outlet boundary conditions of the same temperature. The geometric wall adopted the roughness model of NASA correlation and was given a constant temperature of 273.15 K to obtain the convective heat transfer coefficient. For the water droplet field, the Euler method was used, which was realized by Fluent’s UDS function. The inlet was given the inlet boundary conditions of 30 m/s, and the wall adopted the suction boundary conditions. The relevant theories are relatively mature [9,10,11]. For the coupled heat transfer computation between the anti-icing structure and the air, its boundary conditions and heat sources can be seen in Section 2.2.
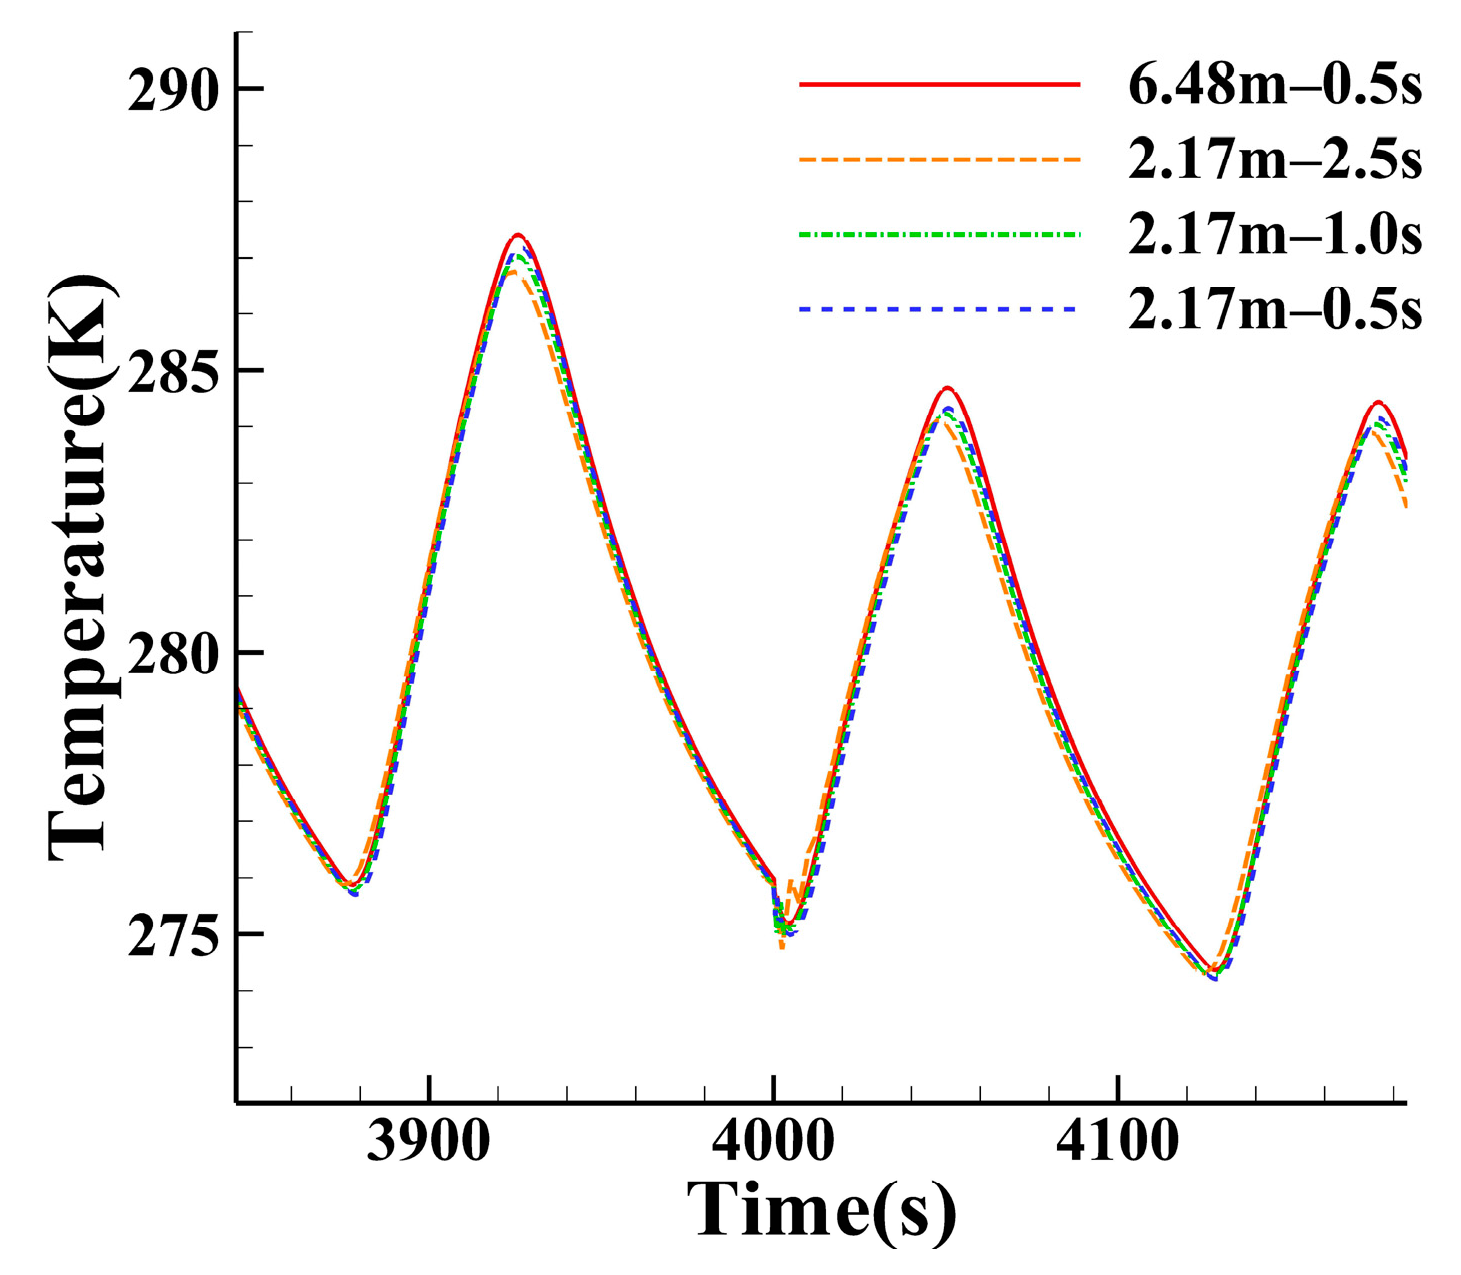
Figure 7 shows the influence of mesh number and time step on the temperature of T1. In the legend, the first number is the mesh number, in millions, and the second number is the time step, in seconds. It can be found that with the decrease in time step and the increase in mesh number, the temperature curve at T1 has a certain fluctuation, but the amplitude is less than 0.5 K, which can be mostly ignored. Considering the computation efficiency and accuracy, the mesh number of 2.17 million and the time step of 0.5 s were adopted.
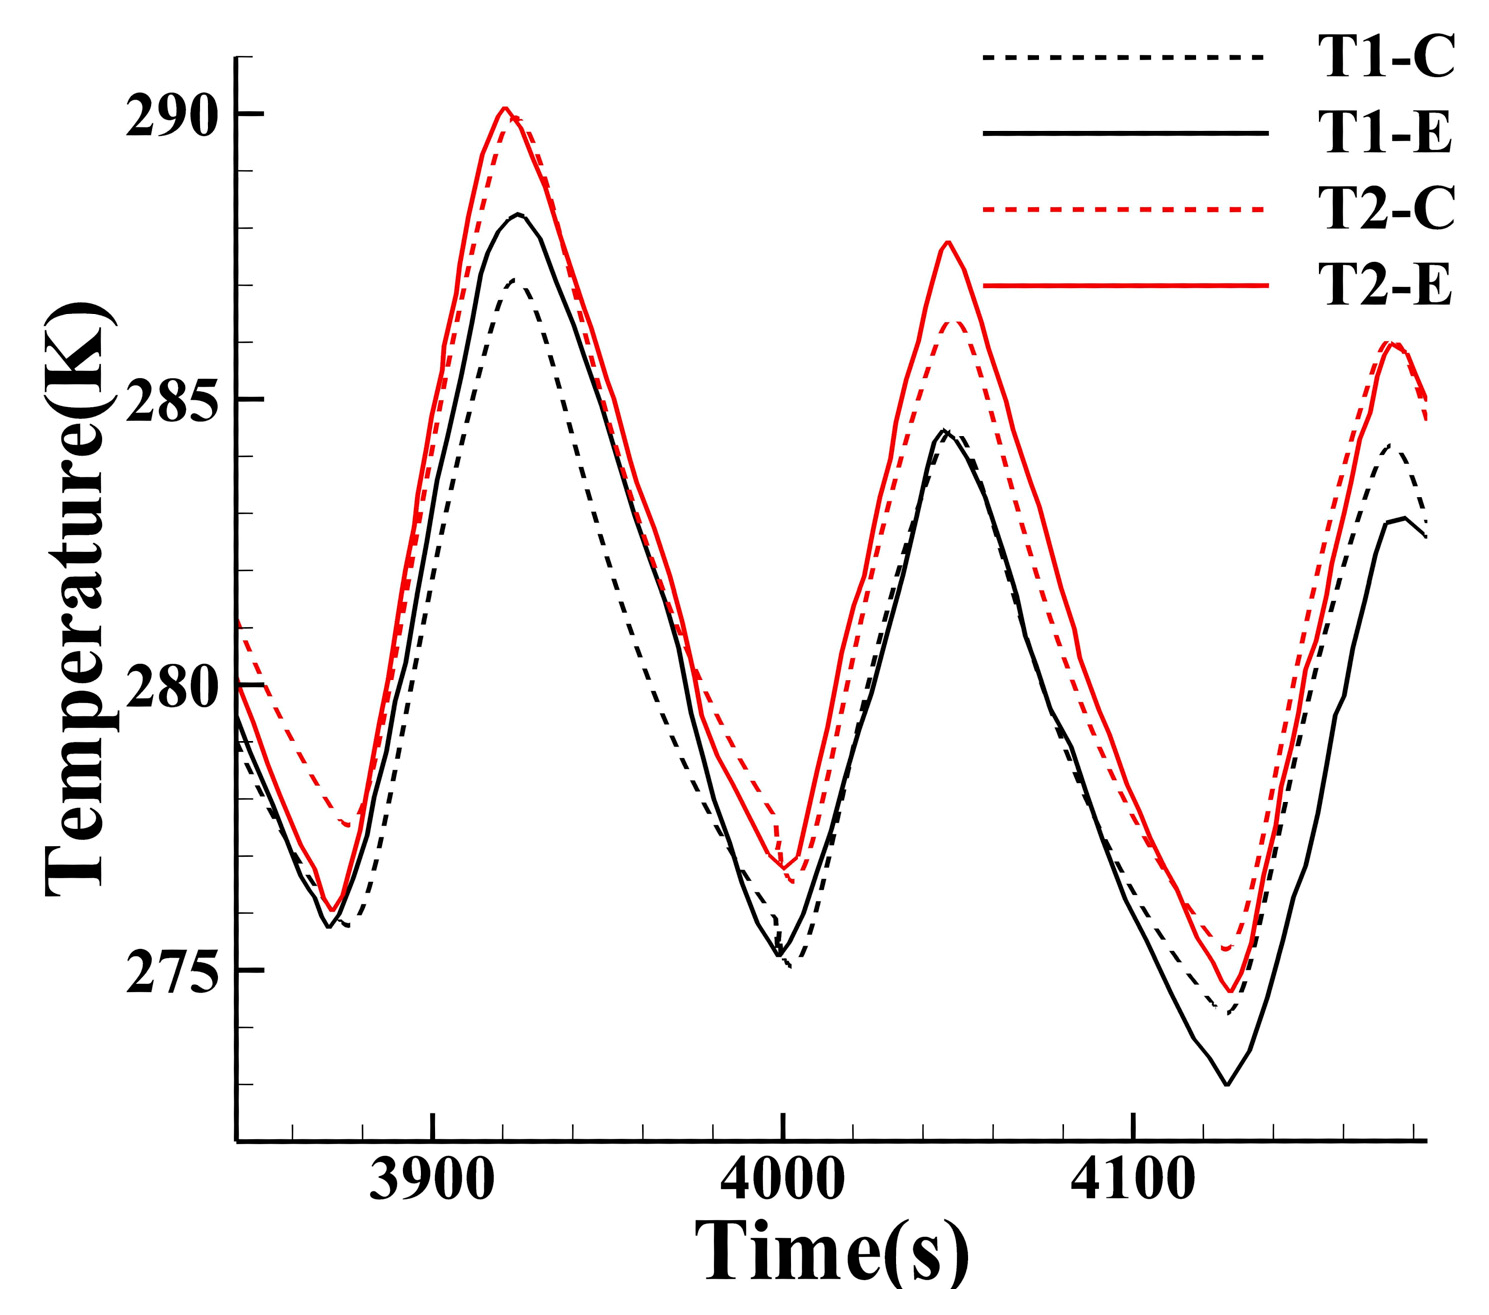
Figure 8 shows the temperature curves at T1 and T2 points on the outer wall. The temperature changes before and after spraying are captured. As the model is a fairing, its convective heat transfer coefficient gradually increases from the center to the edge, so the heat dissipation capacity of T1 is higher than that of T2. As a result, the temperature of T1 is lower than that of T2 in both experimental and calculated results.
Before the spray starts, the maximum experimental temperature for T2 is close to that of the simulation, about 290 K. For T1, the maximum experimental temperature is about 1 K higher than the calculated temperature. This may be due to the slightly poor tightness of the tape at T1 in the experiment, resulting in the formation of an air cavity. It gives T1 a better thermal insulation and a higher temperature.
After the spray starts, the experimental and calculated temperatures of T2 are still close. Compared to before, the maximum temperature drops by about 4 K, reaching around 286 K. At T1, the calculated temperature is about 1 K higher than the experimental temperature, which is also due to the air cavity. After turning on the spray, low-temperature water vapor tends to accumulate in the cavity, reducing the temperature of T1. In general, the experimental results are in good agreement with the computation results.
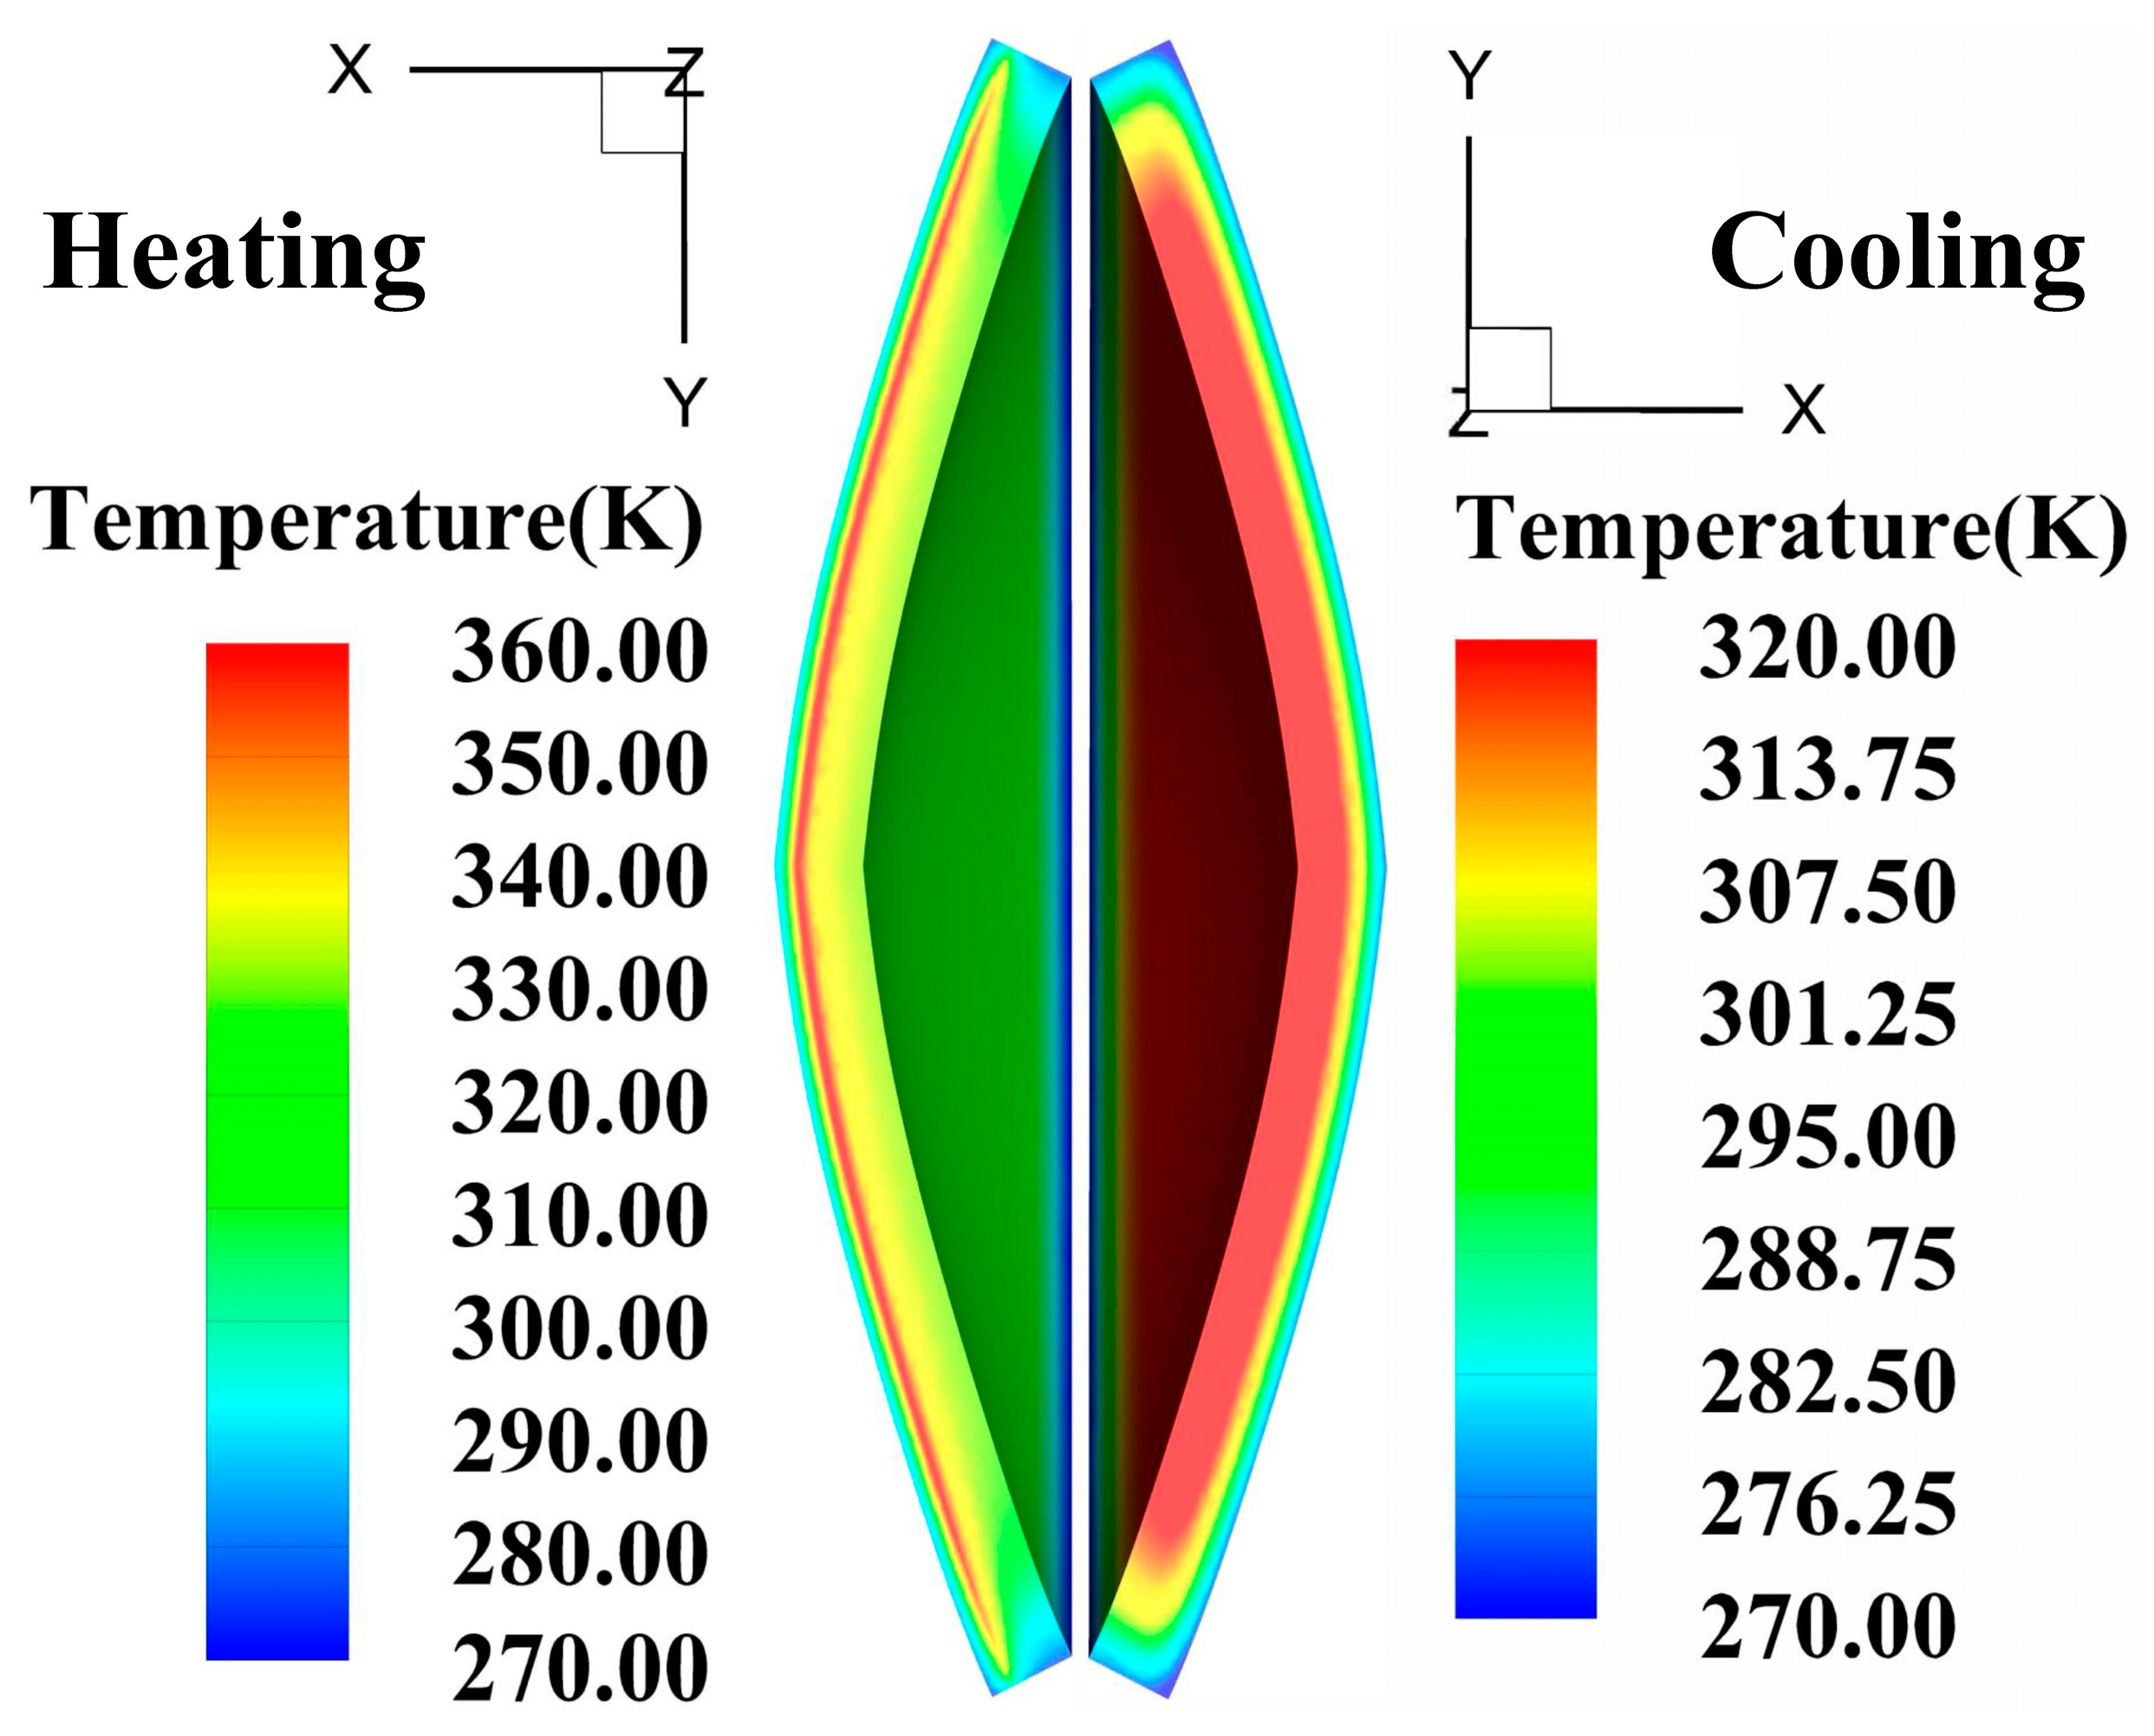
Figure 9 shows the asymmetric temperature distribution of the fairing profile when the heating layer reaches the highest temperature (left) and the outer wall reaches the lowest temperature (right). The results indicate that structural heat transfer during heating and cooling has significant asymmetry. During heating, the temperature of the heating layer is the highest, and the temperature difference is large between different layers, which means that there is a certain delay in energy transfer. During cooling, while the heating layer no longer provides a heat source, the back conduction layer and the front conduction layer play the main role of insulation. The temperature of the back conduction layer is significantly higher than that of the front conduction layer, about 30 K.
Both conduction layers are made of glass cloth, and their thermal conductivity is low. Thus, the energy transfer is so low that the energy is concentrated in the heating layer, resulting in the high temperature. In addition, the inner cavity of the fairing is full of air and its heat transfer is regarded as natural convection, so its convection heat transfer coefficient is small. The two factors act at the same time, so the thermal insulation performance of the back conduction layer is good. For the front conduction layer, it is close to the endothermic layer, so its heat loss is very large Its overall temperature is significantly lower than that of the back conduction layer.
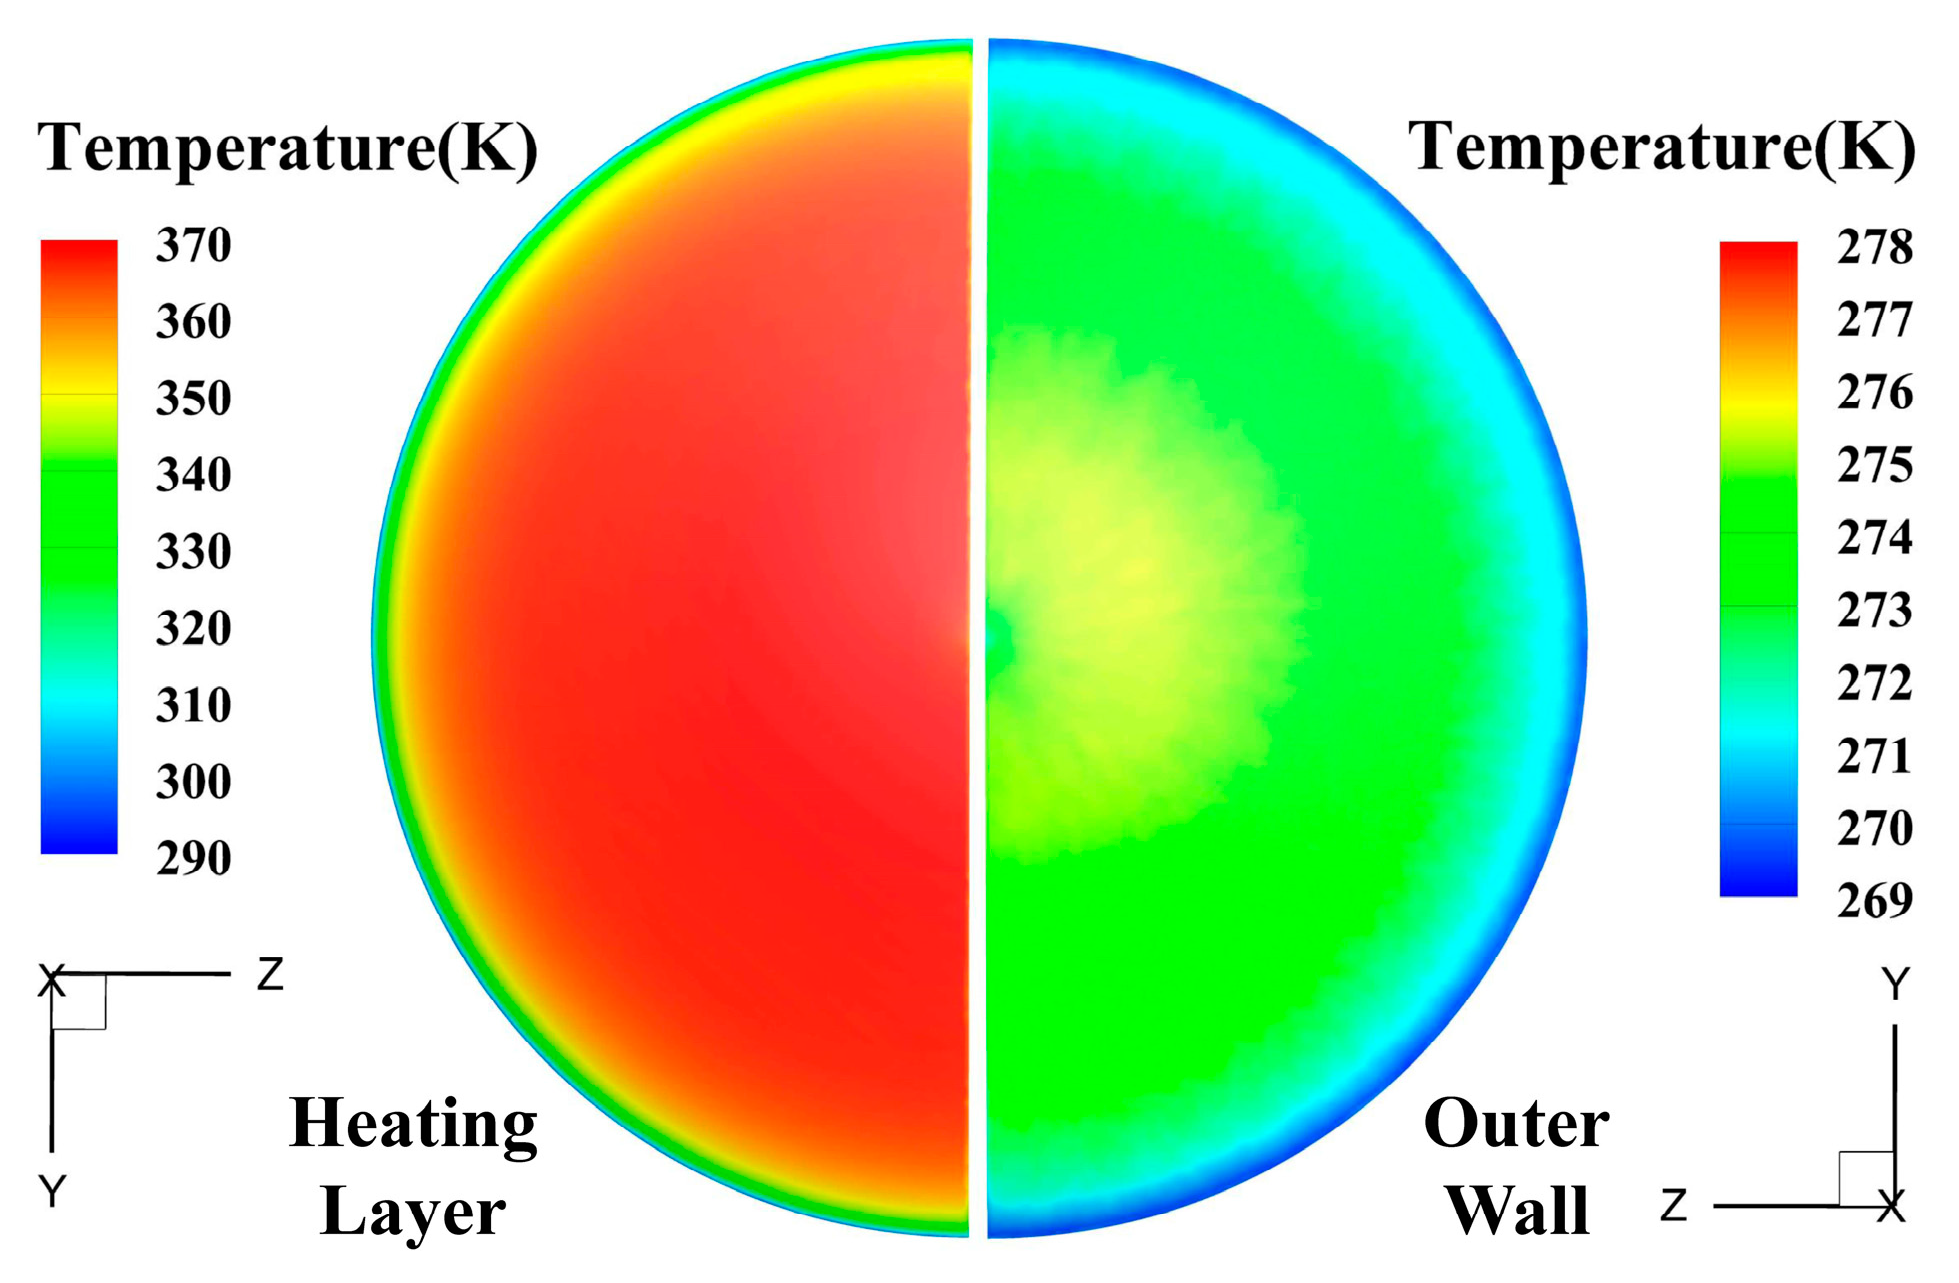
Figure 10 shows the temperature distribution of the heating layer (left) and the outer wall (right) when the heating layer reaches the highest temperature and the outer wall reaches the lowest temperature. The results indicate that the temperature distribution of the heating layer is more uniform. However, the margin of the heating layer is close to the endothermic layer, so its temperature gradient is larger. The overall temperature of the outer wall shows a decreasing trend from the center to the margin, which is consistent with the phenomenon that the temperature of T1 is lower than that of T2 as reflected in Figure 8. It is worth noting that the central temperature is lower than the surrounding temperature. This is due to the fact that the center is facing the incoming flow, and it collects lots of droplets, resulting in a serious temperature drop. The phenomenon has also been found in previous research related to wings [27,28] and fairings [29].
3.2. Results and Analysis
3.2.1. Analysis of Heating Mode and Heat Transfer Effect of Anti-Icing Components
In electrothermal anti-icing, the heating period is generally determined by meteorological conditions. The anti-icing cycle of this work is fixed at 125 s. To analyze the energy efficiency of different heating modes, the total energy output of the heating layer was kept constant in one cycle. The influence of different heating power–time allocations on the temperature of the heating layer and the outer wall was studied. The spray was turned on at 4000 s to study the temperature change of T1 under the conditions from non-icing to icing. The icing conditions are shown in Table 3 Cases 1–7.
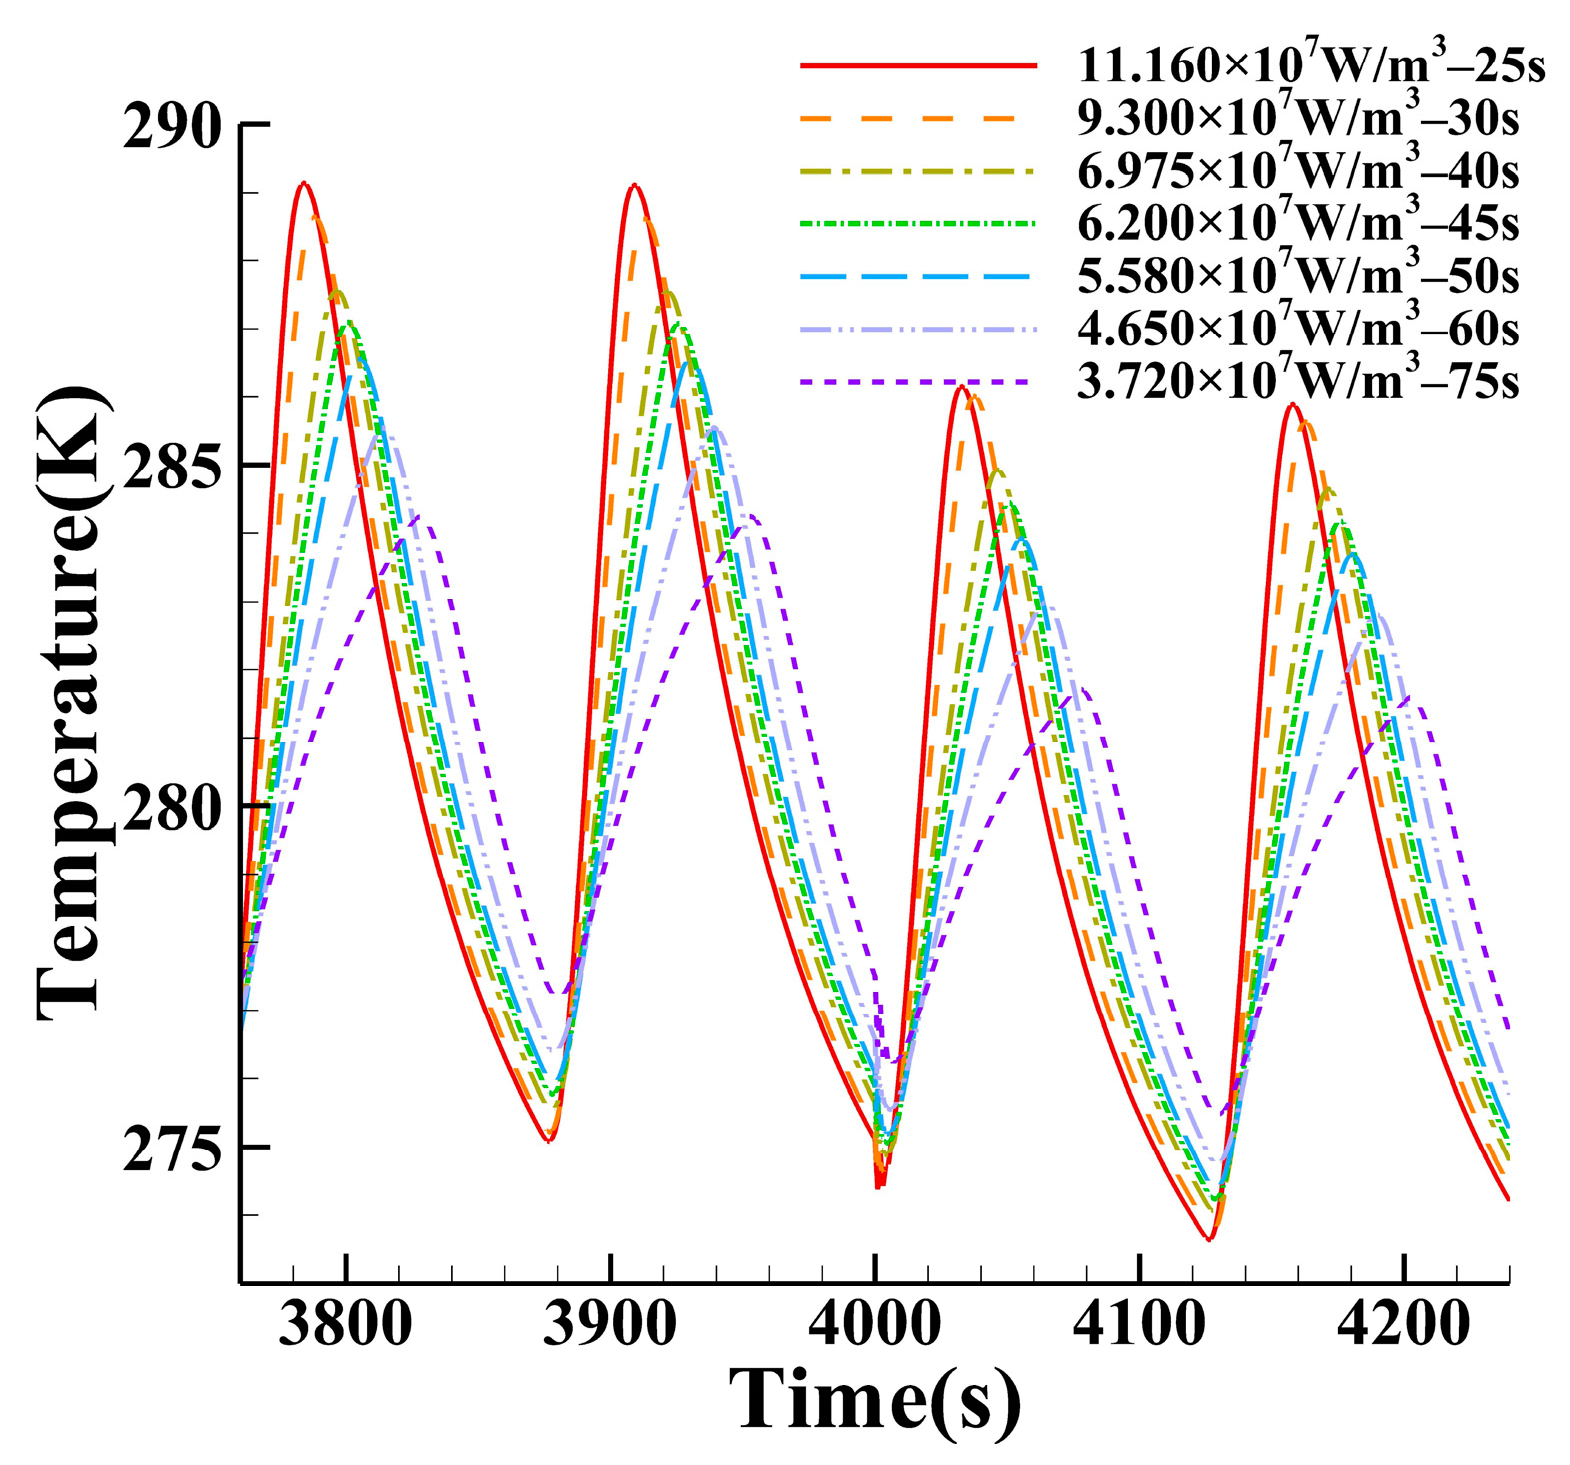
Figure 11 shows the variation of outer wall temperature with time under different heating power–time allocations. The figure indicates that with the increase in heating time, while the maximum temperature of the outer wall has a downward trend, its minimum temperature has an upward trend, resulting in a gradual narrowing of the temperature difference. Existing research [29] also shows that the short-term high-power energy release is not conducive to the temperature requirement of the heating layer. In addition, when the spray is opened, the outer wall temperature is significantly reduced, about 3.3 K.
With the increase of heating time, the outer wall temperature above a certain value increases. Higher wall temperature leads to greater energy loss such as convective heat transfer, resulting in lower maximum temperature. Meanwhile, the increase in heating time means a decrease in cooling time. The outer wall has no time to cool down, so its minimum temperature increases.
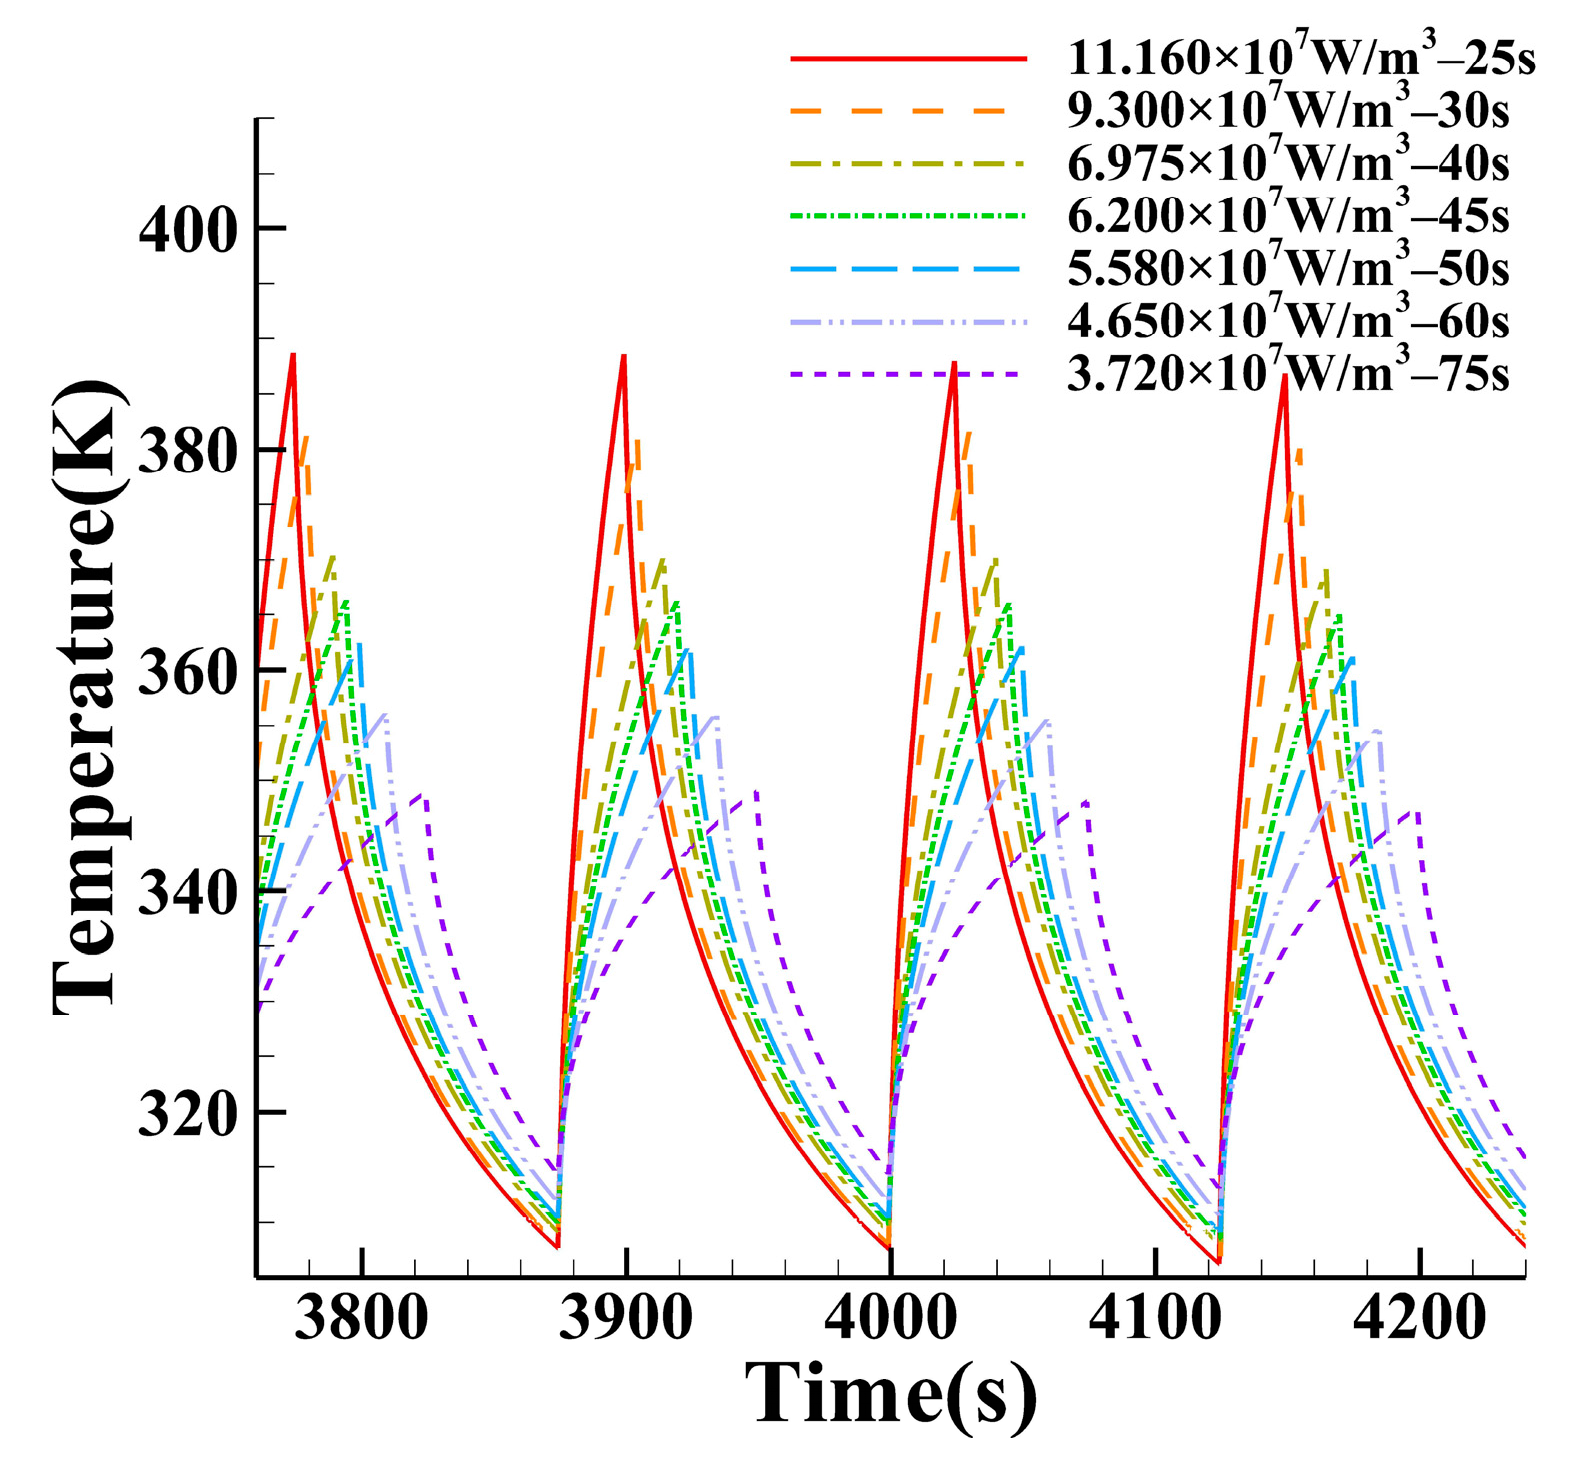
Figure 12 indicates that under different heating power–time allocations, the temperature trend of the heating layer is consistent with that of the outer wall. Moreover, short-term heating with high power can easily make the temperature of the heating layer exceed 363.15 K, namely its temperature limit. It is worth pointing out that unlike the outer wall, the temperature curve of the heating layer is mostly unaffected by the spray.
The front conduction layer separates the heating layer and the endothermic layer, and the back conduction layer is close to the heating layer. The two conduction layers can provide good thermal insulation for the heating layer, so its temperature is hardly affected by the spray. This means that in the design of the anti-icing system, it is not necessary to consider the requirement of the maximum temperature of the heating layer under non-icing conditions, but it is to meet the same requirement under icing conditions.
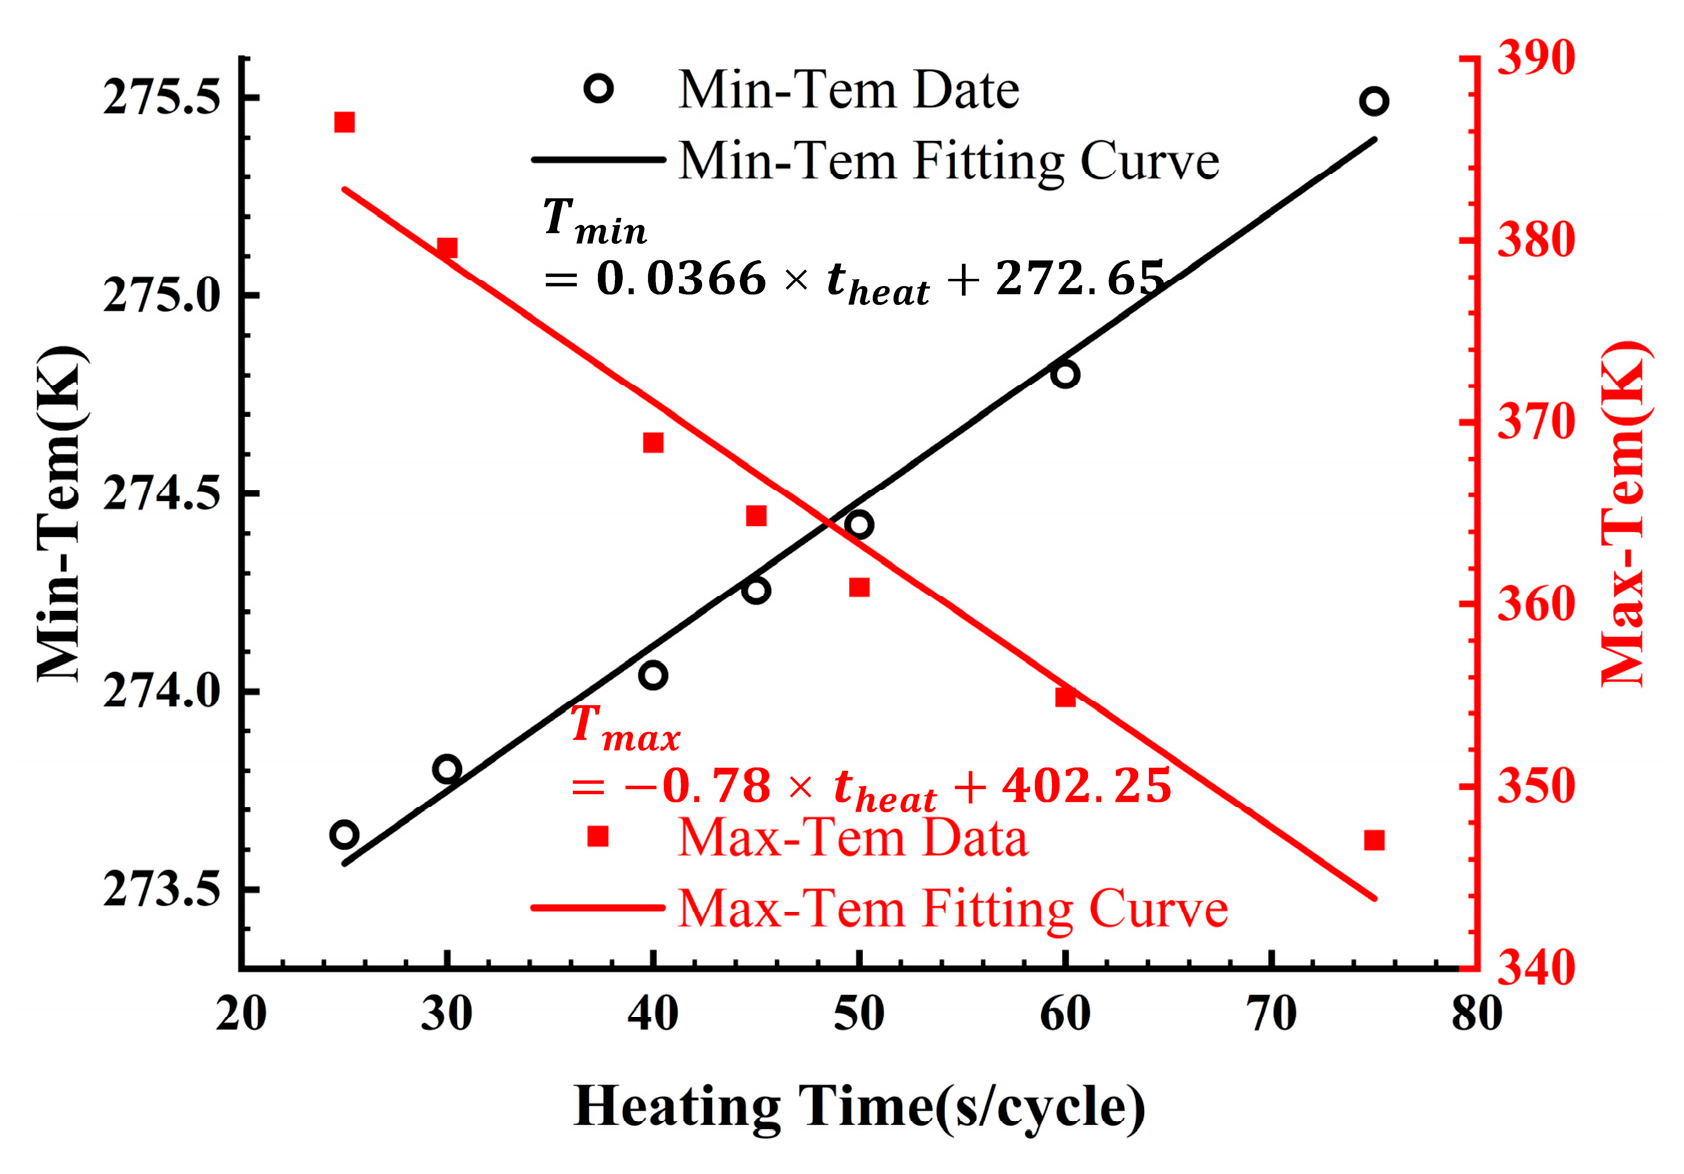
By comparing Figure 11 and Figure 12, it can be found that there is a certain delay in heat transfer of the heating layer, about 4–10 s, and its temperature step is more pronounced than the outer wall. Figure 13 shows the fitting curves of the maximum temperature of the heating layer and the minimum temperature of the outer wall. It can be seen from the curves that both of them are nearly linear, and they also show an asymmetry. Within the research scope, the heating mode has a greater impact on the heating layer than the outer wall. While the temperature difference of the former is more than 39 K, the temperature difference of the latter is less than 2 K. The heating mode has completely opposite effects on the two, which is reflected in the slope of the fitting curves, namely one positive and the other negative. Based on the phenomenon, if the overflow water that may form ice ridges is ignored in the anti-icing, and only the temperature requirements of the outer wall and the heating layer are considered, the best anti-icing effect can be obtained by heating as evenly as possible.
3.2.2. Analysis of Structural Thickness and Heat Transfer Effect of Anti-Icing Components
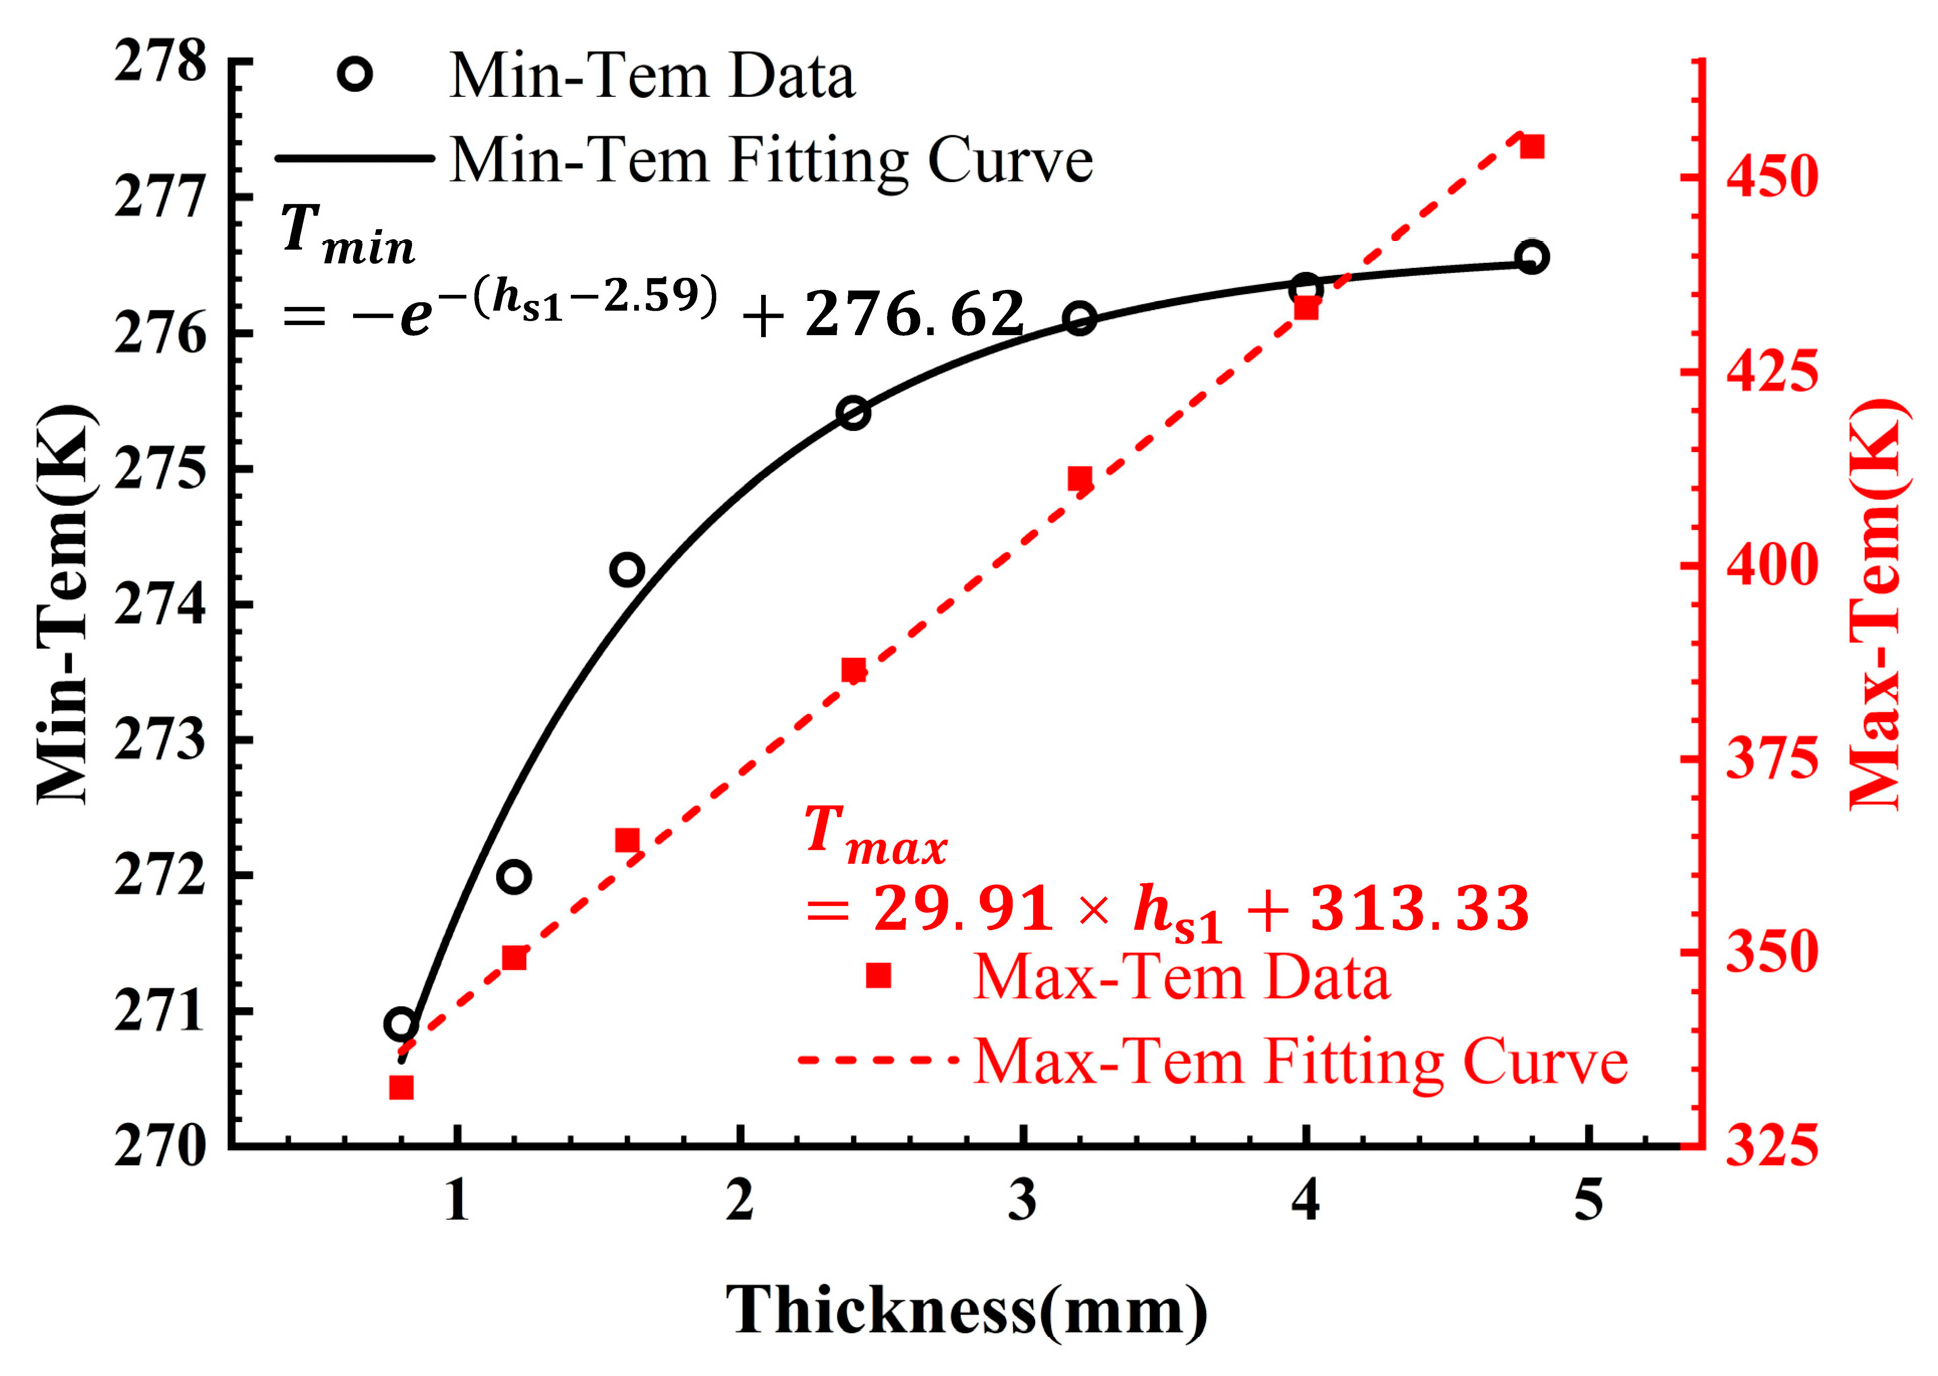
To analyze the influence of the thickness of glass cloth on heat transfer efficiency and anti-icing effect, the front conduction layer should be discussed separately from the back conduction layer. The icing conditions are shown in Table 3 Case 1, Cases 8–14. Figure 14 shows the fitting curves of the maximum temperature of the heating layer and the minimum temperature of the outer wall at T1 with the thickness of the front conduction layer. The results show that although the front conduction layer can simultaneously raise the temperature of the outer wall and heating layer, their temperature rise effects are not similar. With the increase in the thickness, the maximum temperature of the heating layer increases almost linearly, and the temperature rise can exceed 125 K. However, the minimum temperature of the outer wall increased first and then stabilized, and the temperature rise was only about 5 K.
This difference means that the thickness of the front conduction layer has a more direct effect on the heating layer. Its increase can enhance the thermal insulation effect of the heating layer to a greater extent. For the outer wall, as can be seen from Equations (8), (12), and (13), its heat dissipation capacity would also be enhanced with the increase in the wall temperature. This means that its temperature rise effect would also gradually weaken. Therefore, in the design of an electrothermal anti-icing system, to meet the temperature requirement of the outer wall, the thickness of the front conduction layer cannot be increased indefinitely. Otherwise, it is easy to cause the heating layer temperature to rise rapidly and ablate the heating material.
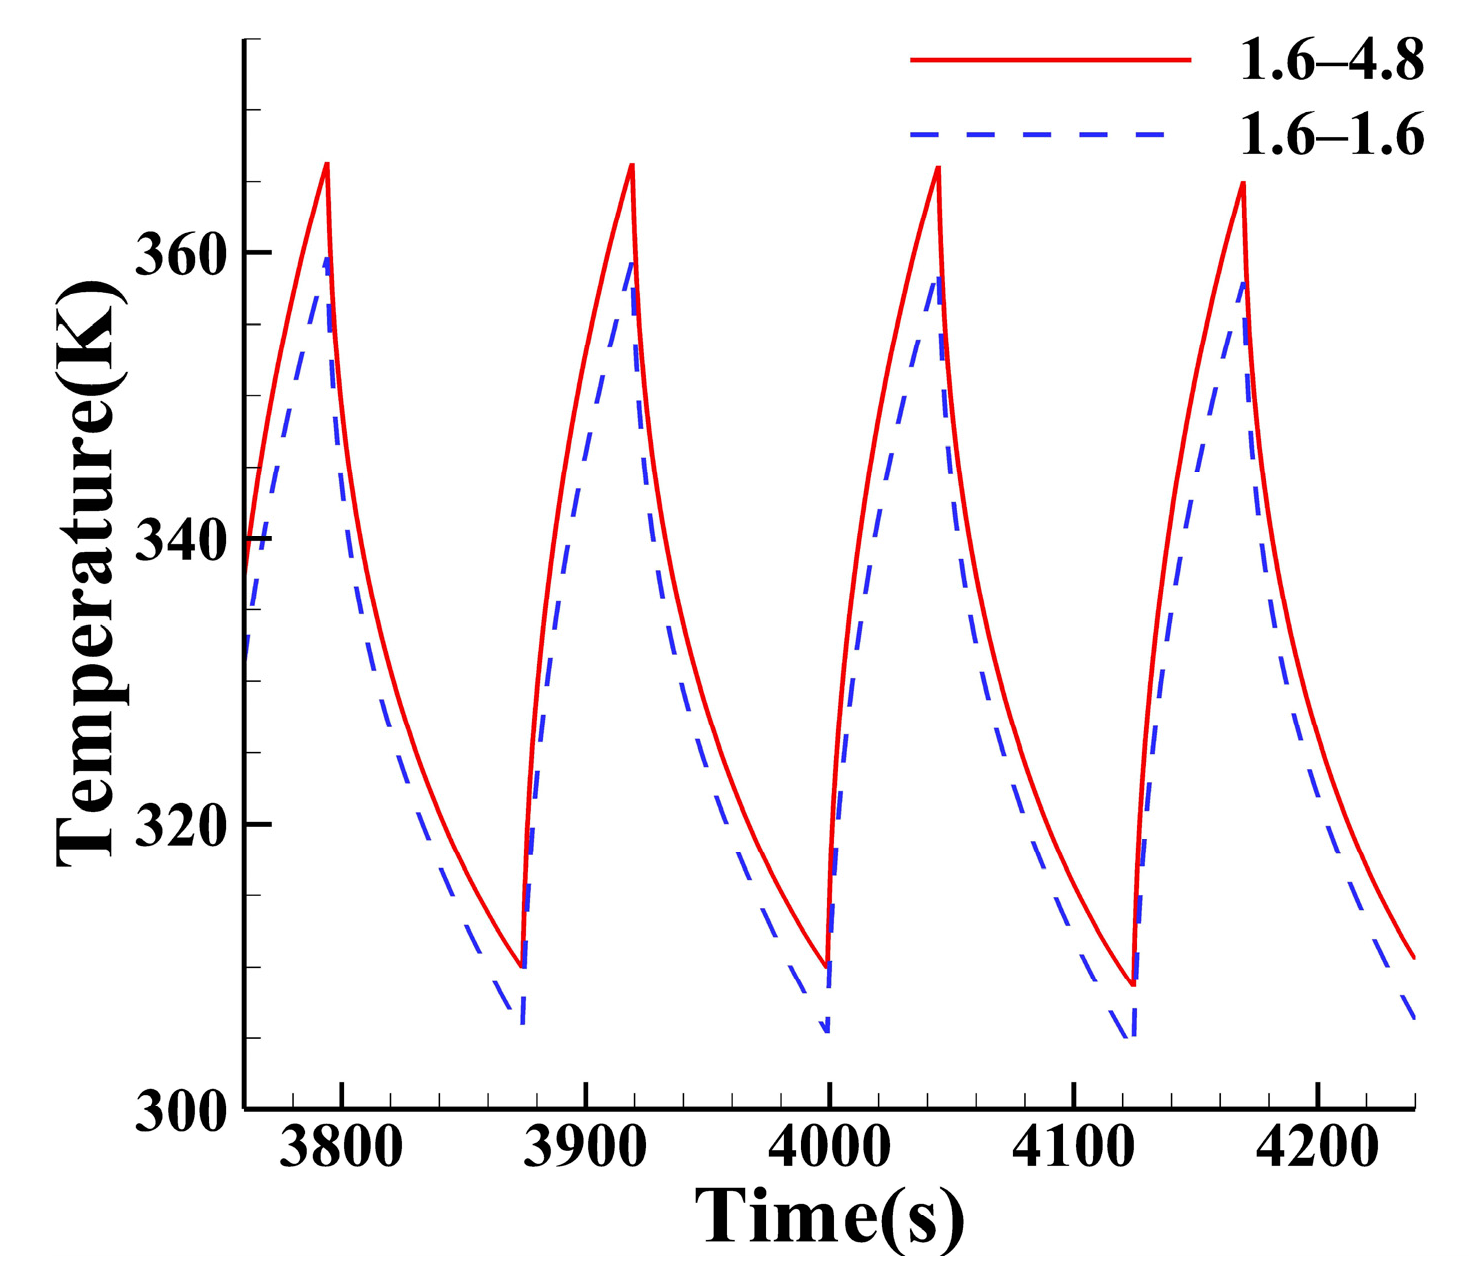
Figure 15 and Figure 16 show the influence of the thickness of the back conduction layer on the temperature of the outer wall and heating layer (in the legend, the first number is the thickness of the front conduction layer and the latter is the thickness of the back conduction layer). The computation results show that the increase in its thickness can raise the temperature of the outer wall and heating layer. However, the temperature rise effect on both is less than that on the front conduction layer, about 1.2 K and 7.5 K, respectively. Compared with the front conduction layer, the back conduction layer is far away from the endothermic layer, and it accumulates more energy during heating and releases the energy more slowly during cooling, as shown in Figure 9, thus playing a more moderate role in the temperature regulation. In the design of the anti-icing system, this property allows finer regulation for the heat transfer, so as to improve the energy efficiency.
4. Conclusions
In the work, the asymmetric heat transfer of a symmetric structure during anti-icing was studied. According to the asymmetric temperature requirements of the anti-icing structure, the minimum temperature of the outer wall (the first temperature) and the maximum temperature of the heating layer (the latter temperature) are fitted with the changes of the heating mode and structure layout, respectively. The main conclusions are as follows:
- The transient heat transfer computation method proposed in the work is in good agreement with the experiment. After the spray starts, the outer wall temperature will decrease significantly, at least 3 K. During heating, the temperature of the heating layer is significantly higher than other layers, and even 80 K higher than the outer wall. Its distribution is uniform. During cooling, the structural temperature gradient is smaller. The temperature of the back conduction layer is significantly higher than that of the front conduction layer, about 30 K. The temperature distribution of the outer wall increases first and then decreases from the center to the edge.
- While the temperature change of the outer wall has a delay of 4–10 s, the temperature of the heating layer has a step phenomenon. After the spray starts, the heating layer is mostly not affected, less than 1 K. Moreover, the fitting results show that the influence of heating mode on the first temperature and the latter temperature is opposite and nearly linear. The influence degree of the heating mode can be expressed by the slope of the fitting curve, and the former temperature changed by 2 K, which is about 1/20 of the latter temperature. The uniform heating mode can better meet the temperature requirements of the above two.
- The thickness increase in the conduction layer can raise the structural temperature. For the front conduction layer, while its influence on the first temperature can be fitted with the EXP function, namely increased first and then unchanged, its influence on the latter temperature is linear. Within the research scope of the work, the first temperature increased by about 5 K, and the latter temperature increased by more than 125 K. For the back conduction layer, its influence is smaller, about 1/5 and 1/20 that of the front one, respectively. Due to this property, the back one can control the structural temperature more finely.
Therefore, to avoid aircraft icing and ensure the durability of anti-icing materials, a relatively uniform heating mode is appropriate. When the heating energy is enough, but the temperature of the outer wall is less than 273.15 K, the thickness of the front conduction layer needs to be increased. To further improve the energy efficiency, it is a good method to properly reduce the thickness of the front conduction layer and increase the thickness of the back conduction layer. According to the actual icing conditions, the specific anti-icing design can be carried out with the computation method.
Author Contributions
Conceptualization, Z.Z.; methodology, H.X. and Y.A.; software, H.X. and Y.A.; validation, W.W.; formal analysis, H.X. and W.W.; investigation, H.X. and Z.Z.; resources, W.W. and Z.Z.; data curation, X.L.; writing—original draft preparation, H.X. and Z.Z.; writing—review and editing, H.X. and Z.Z.; visualization, H.X.; supervision, Z.Z.; project administration, Z.Z.; funding acquisition, Z.Z. All authors have read and agreed to the published version of the manuscript.
Funding
This research was funded by the National Natural Science Foundation of China, grant number 12072213, and the National Science and Technology Major Project, grant number J2019-III-0010-0054.
Data Availability Statement
Data available on request due to restrictions, e.g., privacy or ethical.
Conflicts of Interest
The authors declare no conflict of interest.
References
- Cebeci, T.; Kafyeke, F. Aircraft icing. Annu. Rev. Fluid Mech. 2003, 35, 11–21. [Google Scholar] [CrossRef]
- Gui, Y.W.; Zhou, Z.H.; Li, Y.H.; Xu, H.J. Multiple safety boundaries protection on aircraft icing. Acta Aeronaut. Et Astronaut. Sin. 2017, 38, 520723–520734. [Google Scholar]
- Yuan, X.; Haojun, X.; Binbin, P.; Xiaolong, W. Dynamic characteristics analysis after aircraft icing based on Monte Carlo method. J. Exp. Fluid Mech. 2016, 30, 26–31. [Google Scholar]
- Bogoslov, E.A.; Danilaev, M.P.; Mikhailov, S.A.; Pol′skii, Y.E. Energy Efficiency of an Integral Anti-Ice System Based on Fluoroplastic Films. J. Eng. Phys. Therm. 2016, 89, 815–820. [Google Scholar] [CrossRef]
- Wang, Z.-Z.; Liu, C.-Y.; Zhu, C.-L.; Zhao, N. Performance calculation of electrothermal anti-icing system on three-dimensional surface. Int. J. Mod. Phys. B 2020, 34, 14–16. [Google Scholar] [CrossRef]
- Carozza, A.; Petrosino, F.; Mingione, G. Numerical procedure for the simulation of an electro-thermal anti-icing system. Aircr. Eng. Aerosp. Technol. 2022, 94, 1433–1448. [Google Scholar] [CrossRef]
- Pourbagian, M.; Habashi, W.G. Aero-thermal optimization of in-flight electro-thermal ice protection systems in transient de-icing mode. Int. J. Heat Fluid Flow 2015, 54, 167–182. [Google Scholar] [CrossRef]
- Ahn, G.B.; Jung, K.Y.; Myong, R.S.; Shin, H.B.; Habashi, W.G. Numerical and Experimental Investigation of Ice Accretion on Rotorcraft Engine Air Intake. J. Aircr. 2015, 52, 903–909. [Google Scholar] [CrossRef] [Green Version]
- Yi, X.; Wang, K.C.; Gui, Y.W.; Zhu, G.L. Study on Eulerian method for icing collection efficiency computation and its application. Acta Aerodyn. Sin. 2010, 28, 596–601. [Google Scholar]
- Zhang, H.; Wen, C.; Su, J. A Numerical Study of Droplet Impingement for In-flight Ice Accretion Prediction. In Proceedings of the ASME 2016 Fluids Engineering Division Summer Meeting, Washington, DC, USA, 10–14 July 2016. [Google Scholar]
- Bourgault, Y.; Habashi, W.G.; Dompierre, J.; Baruzzi, G.S. A finite element method study of Eulerian droplets impingement models. Int. J. Numer. Methods Fluids 1999, 29, 429–449. [Google Scholar] [CrossRef]
- Bragg, M.; Broeren, A.; Addy, H.; Potapczuk, M.; Guffond, D.; Montreuil, E. Airfoil Ice-Accretion Aerodynamics Simulation. In Proceedings of the 45th Aerospace Sciences Meeting and Exhibit, Reno, NV, USA, 1–8 January 2007. [Google Scholar]
- Anderson, D.N. Further Evaluation of Traditional Icing Scaling Methods. In Proceedings of the 34th Aerospace Sciences Meeting and Exhibit, Reno, NV, USA, 15–18 January 1996. [Google Scholar]
- Papadakis, M.; Yeong, H.W.; Shimoi, K.; Wong, S.H. Ice Shedding Experiments with Simulated Ice Shapes. In Proceedings of the 1st AIAA Atmospheric and Space Environments Conference, San Antonio, TX, USA, 22–25 June 2009. [Google Scholar]
- Ruff, G.A. Quantitative Comparison of Ice Accretion Shapes on Airfoils. J. Aircr. 2002, 39, 418–426. [Google Scholar] [CrossRef]
- Zhou, Z.H.; Li, F.W.; Li, G.N. Applying Eulerian Droplet Impingement Model to Numerically Simulating Ice Accretion but with Some Improvements. J. Northwest. Polytech. Univ. 2010, 28, 138–142. [Google Scholar]
- Li, H.; Qi, L.; Han, H.; Guo, L. Neural network modeling and optimization of semi-solid extrusion for aluminum matrix composites. J. Mater. Process. Technol. 2004, 151, 126–132. [Google Scholar] [CrossRef]
- Sterjovski, Z.; Nolan, D.; Carpenter, K.; Dunne, D.; Norrish, J. Artificial neural networks for modelling the mechanical properties of steels in various applications. J. Mater. Process. Technol. 2005, 170, 536–544. [Google Scholar] [CrossRef]
- Cartieri, A.; Hue, D.; Chanzy, Q.; Atinault, O. Experimental Investigations on Common Research Model at ONERA-S1MA-Drag Prediction Workshop Numerical Results. J. Aircr. 2018, 55, 1491–1508. [Google Scholar] [CrossRef] [Green Version]
- Zhu, D.Y.; Feng, Q.; Han, X.T.; Yang, X.; Cui, X.; Li, Y. Researches on a large natural moveable icing wind tunnel and test methods. J. Exp. Fluid Mech. 2022, 36, 52–61. [Google Scholar]
- Zhan, P.G. Review on the system of icing facilities in NASA. Aeronaut. Sci. Technol. 2021, 32, 1–6. [Google Scholar]
- Vecchione, L.; De Metteis, P.P.; Giuseppe, L. An overview of the CIRA icing wind tunnel. In Proceedings of the 41st AIAA Aerospace Sciences Meeting and Exhibit, Reno, NV, USA, 6–9 January 2003. [Google Scholar]
- Ni, Z.S.; Liu, S.Y.; Wang, Q.; Wang, Z.; Guo, L. Research progress of test technologies for 3 m × 2 m icing wind tunnel. J. Exp. Fluid Mechnics 2019, 33, 46–53. [Google Scholar]
- Saeed, F.; Selig, M.S.; Bragg, M.B. Hybrid airfoil design procedure validation for full-scale ice accretion simulation. J. Aircr. 1999, 36, 769–776. [Google Scholar] [CrossRef] [Green Version]
- Yang, S.H.; Lin, G.P.; Song, X. Comparative study on the numerical computation of convective heat transfer over rough surfaces. J. Aerosp. Power 2011, 26, 570–575. [Google Scholar]
- Huang, H.M.; Chen, X.P. Energetic analysis of drop’s maximum spreading on solid surface with low impact speed. Phys. Fluids 2018, 30, 022106. [Google Scholar] [CrossRef]
- Bu, X.; Lin, G.; Shen, X.; Hu, Z.; Wen, D. Numerical simulation of aircraft thermal anti-icing system based on a tight-coupling method. Int. J. Heat Mass Transf. 2020, 148, 119061. [Google Scholar] [CrossRef]
- Shen, X.; Guo, Q.; Lin, G.; Zeng, Y.; Hu, Z. Study on Loose-Coupling Methods for Aircraft Thermal Anti-Icing System. Energies 2020, 13, 1463. [Google Scholar] [CrossRef] [Green Version]
- Ding, L.; Chang, S.; Leng, M. Transient Characteristics of an Electrothermal Anti-icing Process Based on the Improved Messinger Model. In Proceedings of the IEEE/CSAA International Conference on Aircraft Utility Systems (AUS), Beijing, China, 10–12 October 2016. [Google Scholar]
Figure 1.
The icing wind tunnel FL-16y.

Figure 2.
Main experimental section.

Figure 3.
Experimental model installation diagram.

Figure 4.
Anti-icing structure model.

Figure 5.
Thermistor arrangement.

Figure 6.
Multi-channel temperature-measuring instrument.

Figure 7.
The influence of mesh number and time step at T1.

Figure 8.
Comparison of experimental (-E) and calculated (-C) results on surface temperature.

Figure 9.
Asymmetric temperature distribution of the profile during heating and cooling.

Figure 10.
Temperature distribution of heating layer during heating and outer wall during cooling.

Figure 11.
Temperature variation of outer wall with time under different heating power–time allocations.
Figure 11.
Temperature variation of outer wall with time under different heating power–time allocations.

Figure 12.
Temperature variation of heating layer with time under different heating power-time.

Figure 13.
Fitting curves of maximum temperature of heating layer and minimum temperature of outer wall.
Figure 13.
Fitting curves of maximum temperature of heating layer and minimum temperature of outer wall.

Figure 14.
Fitting curves of maximum temperature of heating layer and minimum temperature of outer wall with the thickness of the front conduction layer.
Figure 14.
Fitting curves of maximum temperature of heating layer and minimum temperature of outer wall with the thickness of the front conduction layer.

Figure 15.
Comparison of outer wall temperature under 1.6 mm and 4.8 mm back conduction layers.

Figure 16.
Comparison of heating layer temperature under 1.6 mm and 4.8 mm back conduction layers.


Table 1.
Main performance parameters.
| Velocity (m/s) | Pressure (kPa) | Temperature (K) | MVD (µm) | LWC (g/m3) | |
|---|---|---|---|---|---|
| Max | 170 | Ambient pressure | Ambient temperature | 50 | 2 |
| Min | 0 | 5 | 233.15 | 10 | 0.3 |
Table 2.
Material parameter table.
| Material | Density (kg/m3) | Conductivity (W/(m·K)) | Specific Heat (J/(kg·K)) |
|---|---|---|---|
| Glass cloth | 2760 | 670 | 0.06 |
| Aluminum | 270 | 880 | 202 |
Table 3.
Icing conditions.
| Case | V (m/s) | T (K) | MVD (µm) | LWC (g/m3) | P (kPa) | Power–Time (W/m3-s) | Front–Back (mm–mm) |
|---|---|---|---|---|---|---|---|
| 1 | 30 | 263.15 | 20 | 0.55 | 101.3 | 6.200 × 10⁷–45 | 1.6–4.8 |
| 2 | 30 | 263.15 | 20 | 0.55 | 101.3 | 3.720 × 10⁷–75 | 1.6–4.8 |
| 3 | 30 | 263.15 | 20 | 0.55 | 101.3 | 4.650 × 10⁷–60 | 1.6–4.8 |
| 4 | 30 | 263.15 | 20 | 0.55 | 101.3 | 5.580 × 10⁷–50 | 1.6–4.8 |
| 5 | 30 | 263.15 | 20 | 0.55 | 101.3 | 6.975 × 10⁷–40 | 1.6–4.8 |
| 6 | 30 | 263.15 | 20 | 0.55 | 101.3 | 9.300 × 10⁷–30 | 1.6–4.8 |
| 7 | 30 | 263.15 | 20 | 0.55 | 101.3 | 11.160 × 10⁷–25 | 1.6–4.8 |
| 8 | 30 | 263.15 | 20 | 0.55 | 101.3 | 6.200 × 10⁷–45 | 0.8–4.8 |
| 9 | 30 | 263.15 | 20 | 0.55 | 101.3 | 6.200 × 10⁷–45 | 1.2–4.8 |
| 10 | 30 | 263.15 | 20 | 0.55 | 101.3 | 6.200 × 10⁷–45 | 2.4–4.8 |
| 11 | 30 | 263.15 | 20 | 0.55 | 101.3 | 6.200 × 10⁷–45 | 3.2–4.8 |
| 12 | 30 | 263.15 | 20 | 0.55 | 101.3 | 6.200 × 10⁷–45 | 4.0–4.8 |
| 13 | 30 | 263.15 | 20 | 0.55 | 101.3 | 6.200 × 10⁷–45 | 4.8–4.8 |
| 14 | 30 | 263.15 | 20 | 0.55 | 101.3 | 6.200 × 10⁷–45 | 1.6–1.6 |
Disclaimer/Publisher’s Note: The statements, opinions and data contained in all publications are solely those of the individual author(s) and contributor(s) and not of MDPI and/or the editor(s). MDPI and/or the editor(s) disclaim responsibility for any injury to people or property resulting from any ideas, methods, instructions or products referred to in the content. |
© 2023 by the authors. Licensee MDPI, Basel, Switzerland. This article is an open access article distributed under the terms and conditions of the Creative Commons Attribution (CC BY) license (https://creativecommons.org/licenses/by/4.0/).
Share and Cite
MDPI and ACS Style
Xiong, H.; Wu, W.; An, Y.; Li, X.; Zhou, Z. Asymmetric Heat Transfer in Aircraft Electrothermal Anti-Icing. Symmetry 2023, 15, 599. https://0-doi-org.brum.beds.ac.uk/10.3390/sym15030599
AMA Style
Xiong H, Wu W, An Y, Li X, Zhou Z. Asymmetric Heat Transfer in Aircraft Electrothermal Anti-Icing. Symmetry. 2023; 15(3):599. https://0-doi-org.brum.beds.ac.uk/10.3390/sym15030599
Chicago/Turabian StyleXiong, Huajie, Wenjun Wu, Yijing An, Xiao Li, and Zhihong Zhou. 2023. "Asymmetric Heat Transfer in Aircraft Electrothermal Anti-Icing" Symmetry 15, no. 3: 599. https://0-doi-org.brum.beds.ac.uk/10.3390/sym15030599
Note that from the first issue of 2016, this journal uses article numbers instead of page numbers. See further details here.