
Consistent Positive Co-Variation between Fluctuating Asymmetry and Sexual Trait Size: A Challenge to the Developmental Instability-Sexual Selection Hypothesis

Abstract
: The developmental instability (DI)-sexual selection hypothesis proposes that large size and symmetry in secondary sexual traits are favored by sexual selection because they reveal genetic quality. A critical prediction of this hypothesis is that there should exist negative correlations between trait fluctuating asymmetry (FA) and size of condition dependent sexual traits; condition dependent traits should reveal an organism’s overall health and vigor, and be influenced by a multitude of genetic loci. Here, we tested for the predicted negative FA-size correlations in the male sex comb of Drosophila bipectinata. Among field-caught males from five widely separated geographic localities, FA-size correlations were consistently positive, despite evidence that sex comb size is condition dependent. After controlling for trait size, FA was significantly negatively correlated with body size within several populations, indicating that developmental instability in the comb may reveal individual genetic quality. We suggest the possibility that condition dependent traits in some cases tap into independent units of the genome (a restricted set of genes), rather than signaling overall genetic properties of the organism. There were pronounced among-population differences in both comb FA and size, and these traits were positively correlated across populations, recapitulating the within-population patterns. We conclude that the results are inconsistent with the DI-sexual selection hypothesis, and discuss potential reasons for positive FA-size co-variation in sexual traits.1. Introduction
Fluctuating asymmetry (FA) refers to the subtle, random, differences between right and left values of otherwise perfectly symmetrical bilateral traits of organisms [1,2]. FA is distinguished from other forms of asymmetry in bilateral traits by the pattern of variation of right-minus-left (R-L) values [2–4]. FA occurs when R-L variation has a mean not significantly different from zero, and when it is normally distributed (though certain non-normal distributions are also consistent with FA in the population). Antisymmetry refers to cases in which R-L variation is also distributed around a mean of zero, but the distribution tends significantly toward bimodality (platykurtosis). Directional asymmetry occurs when the mean of R-L differences deviates from zero and is significantly either negative or positive.
Among these different forms of biological asymmetry, only FA is believed to reflect underlying developmental instability (DI), a key evolutionary parameter that results from small, random, perturbations to the developmental processes common to all traits of organisms [5,6]. In contrast, because antisymmetry and directional asymmetry likely arise through a combination of complex genetic and non-genetic causes [7], these forms of asymmetry are unlikely to unambiguously reflect individual differences in DI.
Developmental instability is generally understood as the outcome of a developing individual’s inability to attain its “target phenotype”, prescribed by its particular genetic makeup (genotype) and under a defined set of environmental conditions [8]. Thus, greater values of asymmetry are thought to result from greater developmental imprecision, and, thus, compromised expression of fitness related traits. A foundation stone of FA research is the realization that departures from symmetry cannot be readily compensated post-developmentally, thus degree of asymmetry can be used as a reliable index of how well the adult organism was able to cope with its developmental environment. The expectation that morphological symmetry, especially in secondary sexual traits of animals, may serve as a cue of individual health and vigor, has generated a great deal of interest in the role of FA/DI in sexual selection [9–12]. The proposed role of FA/DI in sexual selection is known as the DI-sexual selection hypothesis [13].
The DI-sexual selection hypothesis posits that individuals have evolved the ability to detect FA in secondary sexual traits, and to use it as a cue of the relative genetic quality of potential mates and rivals [14,15]. Mating preferences for symmetry evolve because choosy females gain indirect benefits transmitted to offspring, as the most symmetrical males should have a higher breeding value for fitness. Thus, the DI-sexual selection hypothesis conforms to “good genes” (indicator) models of sexual selection [16–19].
A key prediction of the DI-sexual selection hypothesis is the occurrence of negative relationship between secondary sexual trait FA and size, which is expected because both secondary sexual trait size and developmental stability are thought to be a function of individual quality [20,21]. Whereas several studies have reported negative FA-size correlations in secondary sexual traits [20,22,23], others have not [24–27]. Such inconsistent findings have brought critical attention to the theoretical foundation of the prediction and to its validity [28–30], and question the generality of the DI-sexual selection hypothesis [13,31].
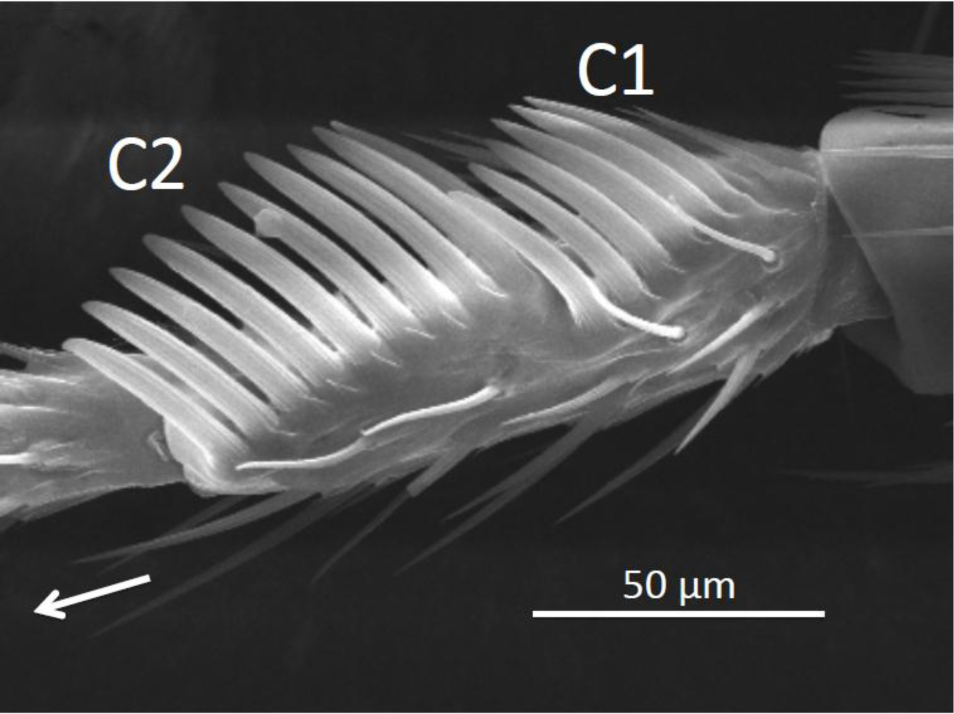
Here, we evaluate this prediction using Drosophila bipectinata Duda (Diptera: Drosophilidae), a well-studied system in the context of sexual selection for secondary sexual trait size and FA. D. bipectinata is a member of the ananasssae subgroup of the melanogaster species group [32], and is widely distributed in the Australian and Oriental biogeographic zones [32]. The trait under study is the male sex comb, a heritable and condition dependent secondary sexual trait [33–36] undergoing incipient diversification throughout its geographic range [35,37,38]. The sex comb consists of two major components (referred to as C1 and C2), each comprised of a row stout black bristles, or “teeth”, arranged obliquely along the foretarsus of each of the front legs of males (Figure 1); females do not possess sex combs. The sex comb is used to grasp females during courtship, and females may assess sex comb size via tactile cues, as the combs make direct contact with the lateral flanks of the female abdomen [39–41]. When the combs are surgically ablated, males fail to achieve traction with the female abdomen and are unable to mount and copulate [39].
In the present paper we test for negative FA-size relationships among male flies sampled directly from the field at five widely separated geographic localities. We first tested for negative FA-size scaling in each population, separately for the two comb segments, C1 and C2. Next, we tested for FA-size scaling across populations, by examining the correlation between mean FA and mean trait size. In this case, mean values were first corrected for co-variation with body size, so as to examine the relationship between true (i.e., body size specific) investment into secondary sexual trait and trait FA.
2. Results
2.1. Distributions of Signed Asymmetry
We measured asymmetry in both major sections of the D. bipectinata sex comb, C1 and C2 (Figure 1), in males collected in the field at five widely spaced localities (Figure 2; Table 1). All distributions (n = 10) of R-L values had mean values that were not significantly different from zero (Table 2), and all distributions but one conformed to normality (Table 2). Thus, the sex comb traits we analyzed conform to ideal FA [42,43].
2.2. Within Population Relationships
The number of teeth within C1 and C2 (TC1 and TC2, respectively) were strongly positively related with male thorax length (our measure of trait size) [44], indicated by highly significant regression slopes in all cases (Table 3). The highly significant slopes were also present when the data were first log-transformed (Table 3). Thus, to acquire measures of comb size corrected for this strong scaling for subsequent analyses, we used residuals from the regression of comb size on thorax length. We found no evidence for negative relationships between the FA of C1 (FA1) and comb size, either in the case of uncorrected (TC1) or thorax length-corrected comb size values (TC1c) (Table 4). Rather, all correlations were positive, and significantly so in three of the five populations (Table 4). The mean ± standard error (s.e.) of the FA1-TC1 correlation coefficients was 0.1001 ± 0.0317, and for FA1-TC1c coefficients the mean was 0.1108 ± 0.0361. Both means differed significantly from zero (t = 3.155, p = 0.0344 and t = 3.068, p = 0.0373, respectively).
Similarly, all relationships between the FA of C2 (FA2) and TC2 were positive, and significantly so in the Taiwan population (Table 4). The mean of these correlation coefficients was 0.05786 ± 0.01458, and the mean for FA2-TC2c coefficients was 0.07368 ± 0.01679). As above, both means were significantly different from zero (t = 3.9686, p = 0.0166 and t = 4.3883, p = 0.0118, respectively).
We also examined relationships between FAs and thorax length for each population. For the FA1-thorax length relationships, there was no discernable trend toward either positive or negative values (Table 5), and the mean correlation coefficient was not significantly different from zero (0.03796 ± 0.02652; t = 1.431, p = 0.226). In contrast, all correlations between FA1c and thorax length were negative, and significantly so in three out of the five populations (Table 5). The mean of the FA1c-thorax length correlation was −0.08504 ± 0.02069, which differed significantly from zero (t = −4.110, p = 0.0147).
For FA2-thorax length relationships, all correlation coefficients were positive, and significantly so in the Hiva Oa population (Table 5); the mean of the coefficients was significantly positive (0.06998 ± 0.01616; t = 4.331, p = 0.0123). For FA2c-thorax length relationships, there was no apparent trend in either direction, and the mean of the coefficients did not differ significantly from zero (−0.01088 ± 0.01667; t = −0.659, p = 0.550).
To summarize this section, we found that relationships between absolute fluctuating asymmetry and size of both sex comb segments were positive, and that this pattern held across all the populations we examined. In contrast, we detected negative correlations between FA1c (FA1 corrected for variation in comb size) and thorax length in the case of FA1; this negative correlation was evident in all populations, and the mean correlation coefficient across populations was significantly negative. In contrast, no such negative trend was evident for FA2.
2.3. Among Population Differences in Trait Size and FA
There were pronounced differences in trait size among the populations for both TC1 and TC2 (Tables 6 and 7). For TC1, the population × thorax length interaction was not significant, indicating homogeneity of slopes among the populations (Table 6) [45]. For TC2, however, the population × thorax length interaction was significant, although only weakly so (Table 6). Nevertheless, we performed a follow-up analysis on residuals in TC2 from a regression of TC2 on thorax length. Results of ANOVA confirmed the strongly significant effects of population on these residual TC2 values (F4,2840 = 208.63, p < 0.0001).
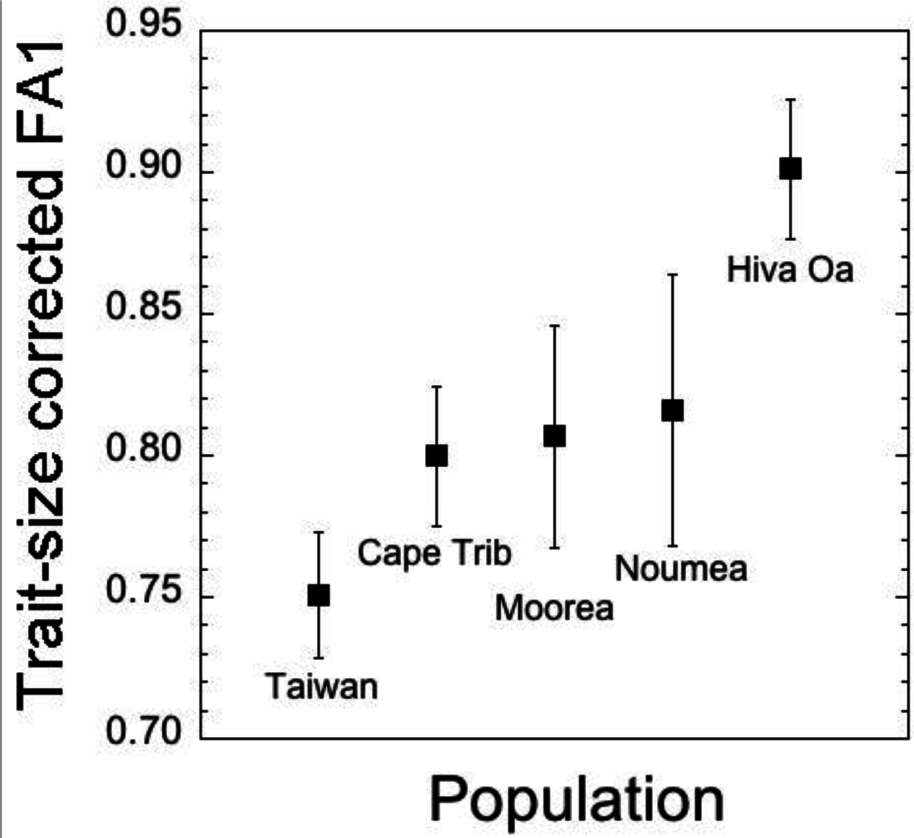
We also found significant differences among populations for FA1 but not for FA2 (Table 8). Mean values for FA1 and FA2 are presented in Table 9. We also checked whether this significant effect of population on FA1 would persist after correcting FA values for trait size. ANCOVA revealed that the significant effect of population did persist for these residual FA1 values, although it was weaker compared to the analysis on uncorrected FA1 values (population, F4,2834 = 1.379, p = 0.0339; thorax length, F1,2834 = 3.793, p = 0.0074). Trait-size corrected FA1 means across populations are presented in Figure 3. Owing to the lack of significant differences among populations in mean FA2, we restricted our focus on C1 in addressing whether FA and trait size were related across populations in the next section.
2.4. Comb Size versus FA across Populations
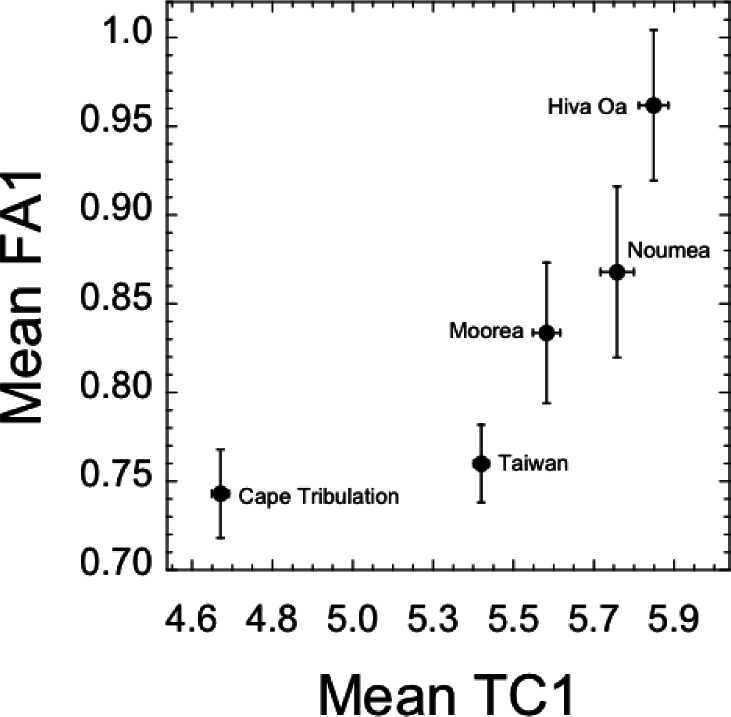
Mean FA1 and TC1 were strongly positively related across populations (Spearman r = 1.0, p < 0.001). The Cape Tribulation population exhibited the smallest values of each trait, whereas Hiva Oa exhibited greatest values of both traits (Figure 4). To test for significance of the apparent curvature in this relationship, we constructed a quadratic regression model, the results of which are presented in Table 10. The linear term relating TC1 and FA1 was significant (Table 10), consistent with the non-parametric evaluation, although the quadratic term was marginally non-significant. These results held for the case of the relationship between log-transformed TC1 and FA1 values (Table 10).
3. Discussion
The DI-sexual selection hypothesis predicts that FA should be negatively correlated with secondary sexual trait size within populations [15,21]. When both size and symmetry are functions of overall genetic quality, individuals of highest genetic quality should be able to invest most heavily into costly traits while maintaining superior developmental control. Thus, in the presence of variation for genetic quality in the population, FA and size of condition dependent secondary sexual traits should be negatively correlated across individuals [15,21].
We studied patterns of co-variation between FA and trait size among wild-caught males in five geographic populations, and contrary to the DI-sexual selection hypothesis, found that none of the FA-size correlation coefficients within populations for either comb segment were negative. We checked for FA-size relationships when trait size was either corrected or uncorrected for body size, and in neither case did we find the predicted pattern of co-variation. Instead, all FA-size correlations were positive, and, on average, significantly so for FA1. These findings are in general agreement with another study of Drosophila by Sharma et al. [46], which likewise found no evidence for negative FA-size relationships in three other species (D. melanogaster, D. simulans, and D. pseudoobscura). However, unlike the positive scaling we found in D. bipectinata, the comb FA-size correlations in these species were flat and not significantly different from zero [46]. The disparity between these studies may be driven by the developmental environments from which flies were sampled. Sharma et al. focused on lab-adapted flies that had been maintained on artificial medium for > 50 generations, whereas our measurements were taken from flies sampled directly from the field.
One of the requirements of the DI-sexual selection hypothesis is that secondary sexual trait production is costly, and hence condition dependent. Thus, a corollary of the DI-sexual selection hypothesis is that a lack of negative FA-size relationships should characterize secondary sexual traits that are not condition dependent. For example, in a study of 30 genera of earwigs (Dermaptera) that examined FA-size relationships in the male forceps, variable morphological structures used in both male-male competition and courtship, the correlation between FA and size was flat overall, suggesting that forcep size in earwigs may generally not be condition dependent ([47], but see [48]). However, a lack of condition dependence is not the case for the sex comb in D. bipectinata. In fact sex comb size is both heritable and condition dependent, and therefore not surprisingly, also under sexual selection in some populations [35,36]. Condition dependence of the sex comb has been demonstrated in a previous study, in which increased temperature applied during larval development decreased sex comb size [28]. This reduction occurred independently of changes in body size, indicating that the sex comb is physiologically costly, and, hence, condition dependent [28].
How can we reconcile the lack of negative FA-size scaling with the fact that comb size exhibits condition dependence? Perhaps comb size does not signal genome wide genetic quality (and see [49]), as envisioned in “good genes” (indicator) models of sexual selection [17–19]. Indeed, a recent study of D. bipectinata has shown that genotypic effects of comb size were strongly trait specific, affecting pupal viability but not other traits expected to be reliant on many genes throughout the genome, including courtship, mating success, or body size [50]. These results support the view that comb size variation reveals “quality” prescribed by a restricted set of genes, which influences comb production and one or a few other traits (e.g., pupal viability), but not genome wide quality. If sexual trait size and symmetry predominantly are affected by non-overlapping properties of the genome, this may explain why some secondary sexual traits fail to exhibit negative FA-size co-variation despite being condition dependent.
In contrast to comb size, the evidence presented here suggests that comb symmetry might be a reliable indicator of overall genetic quality. When FA was corrected for its positive relationship with trait size, FA1c values were significantly and consistently negatively correlated with male body size. These negative relationships suggest that FA is influenced by a multitude of loci throughout the genome, as body size in Drosophila and other organisms is a complex, multifactorial trait related to fitness [51–54]. Interestingly, in a field study in New Caledonia, where FA was strongly and consistently shown to be the target of sexual selection, it was FA1, not FA2 or comb size, that predicted male mating success [36]. These differential effects on mating success further support the view that FA and comb size tap distinct properties of the genome.
The positive relationships we found between FA and comb size may be related to a host of potential mechanisms described in models of the etiology of FA in morphological traits [55,56]. For example, morphogenetic mechanisms maintaining symmetry, such as compensatory growth between body sides, could be less efficient for the largest traits in the population. Alternatively, perhaps larger traits, because they take longer to grow or that they grow faster, simply accumulate more random errors during ontogeny than smaller traits [1,57–59]. Møller [60], for example, showed consistent between-moult side-bias in the development of tail feather FA in the barn swallow, Hirundo rustica. Small asymmetries in daily growth increments of feathers were repeated and gave rise to large asymmetries in morphology, suggesting that errors may accumulate. Finally, Morris et al. [61] recently proposed that a trade-off may exist between developmental stability and growth rate, a mechanism that could help explain positive FA-size relationships in secondary sexual traits, and perhaps more generally. In their study, which examined FA in vertical bars of swordtail fish (Xiphophorus multilineatus), males of a faster growing genotype were more asymmetric than slower growing genotypes, and a positive relationship was detected between growth rate and FA among the faster growing males [61]. In D. bipectinata, if larger sex combs have faster growth rates, a developmental stability-growth rate trade-off could cause the persistent positive FA-size correlations we found. Interestingly, the existence of such a trade-off would also reconcile the contrasting results of our own study with those of Sharma et al. [46], who found flat FA-size co-variation in laboratory populations of flies. We would expect trade-offs normally generating positive FA-size co-variation in the field to attenuate or disappear altogether under nutritionally ameliorated conditions of the laboratory.
Across populations, we found pronounced differences in mean trait size, with the largest comb size occurring in flies sampled on the island of Hiva Oa. Sex comb size is heritable [28,35,36] and found to be the target sexual selection [35], suggesting that the likely cause of this pronounced inter-population differentiation is sexual selection, although other micro-evolutionary factors, such as genetic drift, may be involved. In addition to significant differences in trait size, we also found significant differences in FA among the populations, with mean FA being greatest in the Hiva Oa population. Importantly, FA differences persisted after trait size correction, with the population on Hiva Oa, a small and remote island in the South Pacific Ocean, maintaining its higher levels of developmental instability. A number of factors may be exacerbating developmental instability on Hiva Oa, such as inbreeding, loss of genic co-adaptation, disruptive gene flow, and novel selection regimes, all of which can be increased in isolated, island populations [9,62,63].
The positive relationships we found between FA and comb size within populations was recapitulated in our across-population analysis. The likely cause of this pattern at the population level is sexual selection driving diversification in comb size, with correlated shifts in developmental instability. The various mechanisms discussed above (e.g., greater accumulation of developmental errors, a trade-off between growth and developmental control), have the potential to explain the elevated FA in response to shifts in mean trait size, in addition to two other mechanisms. First, directional selection, which characterizes secondary sexual traits and may act against genetic modifiers of developmental control [64], could genetically predispose secondary sexual traits with above average expression to unusually high levels of developmental instability and FA [65,66]. Second, since directional selection often pushes traits to their physiological limits of expression, the corresponding increase in condition dependence of sexual traits [67] may also put them at heightened risk of greater FA (assuming developmental stability mechanisms themselves attract physiological costs) [15,68]. Future research with D. bipectinata should focus on evaluating these hypotheses. For example, one could artificially select for increased and decreased trait size, and test for correlated responses in developmental instability [69]. One prediction is that up-selected lines should show destabilized development relative to down-selected lines, which would support the largely untested hypothesis that directional selection for increasing ornament trait size selects against genetic modifiers of developmental control.
4. Materials and Methods
4.1. Geographic Localities and Fly Collection
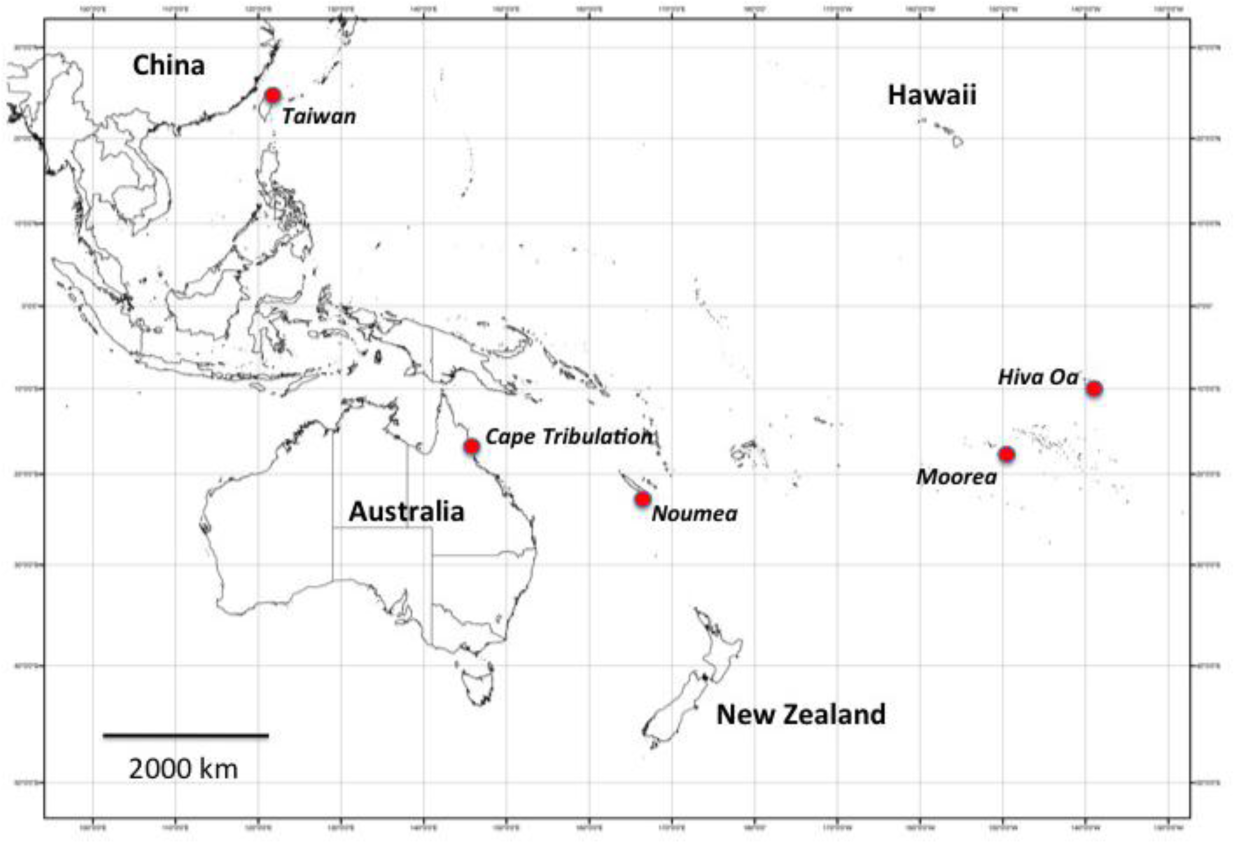
Male D. bipectinata were collected in the field between 2003 and 2011 at 5 widely spaced geographic localities (Table 1). Localities ranged from Taiwan in East Asia, to the island of Hiva Oa in the Marquesas Archipelago in the South Pacific Ocean (Figure 1). At all localities, flies were collected directly from the surface of fruit substrates using an aspirator [35]. Flies were preserved in 70% ethanol immediately after capture.
4.2. Phenotypic Characterization of Flies
In the laboratory, flies were characterized for thorax length, sex comb size and sex comb asymmetry. The process of characterizing flies is described in detail elsewhere [35]. Briefly, each fly was extracted from the ethanol, rehydrated, and placed on transparent double-sided adhesive tape on a microscope slide. Each males’ body size was estimated as thorax length (distance from the anterior edge of the thorax to the distal end of the scutellum) [44], measured using an ocular micrometer of an Olympus SZX12 stereomicroscope. Both forelegs of each male were removed and adhered to the tape, and the slide placed over a white background so that the individual teeth of the sex comb could be easily discerned. The major rows of sex comb teeth in D. bipectinata, referred to as C1 and C2, occur as oblique rows of tightly spaced teeth along the first tarsal segment (foretarsus) of each front leg (Figure 2). The number of teeth in C1 and C2 on both forelegs were counted by two researchers (MP and KJH). To assess measurement error, each person counted the number of teeth in C1 and C2 (TC1 and TC2, respectively) in 25 males twice [35]. Replicate counts were made independently of each other, 7–14 days apart. There was no discrepancy between replicate counts made by either researcher.
Comb size was calculated for both segments as the mean number of teeth on the right and left body sides. Asymmetry was calculated as the difference in trait size between right and left sides (R-L). Unless otherwise mentioned, FA refers to the absolute (i.e., unsigned) value of the difference between right and left, |R-L|.
For a given bilateral trait to exhibit “ideal” FA [42], its signed (R-L) values should have a mean of zero (to distinguish it from directional asymmetry) [1,2]. Signed values should also be normally distributed, although leptokurtotic distributions are also consistent with ideal FA [1,44]. For each population, we checked for ideal FA by examining distributions of signed values for TC1 and TC2 separately; we calculated mean, skewness, and kurtosis for each population.
4.3. Within Population Relationships
We tested for negative FA-trait size and FA-thorax length relationships for each comb segment using Spearman rank correlation coefficients (rs). For each population, we calculated rs between FA and its corresponding measure of trait size, which was either uncorrected or corrected for co-variation with thorax length. This correction was conducted by regressing TC1 and TC2 on thorax length, and obtaining the residuals from each analysis. Regression analyses were conducted separately by population. TC1c and TC2c refer to comb size residuals.
We also evaluated relationships between FA and thorax length using Spearman rank correlation coefficients (rs). As above, we first calculated rs between FA1 and thorax length and also between FA2 and thorax length, by population. We then recalculated Spearman rank correlations with each FA trait corrected for its respective measure of trait size (i.e., TC1 and TC2, respectively), using regression. As above, regression analyses were conducted separately by population. FA1c and FA2c refer to FA residuals.
4.4. Among Population Differences in Trait Size and FA
We tested for differences in both measures of trait size (TC1 and TC2) among populations using analyses of covariance (ANCOVA). We entered population as a fixed-effect factor, and thorax length as the covariate in each case. To test for FA differences, we likewise used ANCOVAs, conducted on absolute asymmetry values [1,42]. To evaluate the homogeneity of slopes assumption, we tested for the significance of the population × thorax length interaction term in all ANCOVAs [45].
4.5. Comb Size versus FA among Populations
Because only FA1 and not FA2 differed significantly among populations (see Results), it was appropriate to restrict our analysis of FA/trait size relationships among populations to FA1. We calculated a Spearman rank correlation coefficient to assess the relationship between mean FA1 and mean TC1 across populations. To test for curvature in this relationship, we constructed a quadratic least squares regression model, in which we evaluated linear and quadratic effects of mean TC1 on mean FA1.
Acknowledgments
The research was partially funded by the National Science Foundation (NSF) grant DEB-1118599 (to M.P.), the Department of Biological Sciences and McMicken College of Arts and Sciences at the University of Cincinnati. We thank Necati Kaval (Department of Chemistry, University of Cincinnati) for the scanning electron micrograph.
Author Contributions
Michal Polak collected fly samples in the field, contributed to data collection, analysis, and writing of the manuscript. Kassie J. Hooker contributed to data collection. Frances Tyler contributed to data analysis and writing of the manuscript.
Conflicts of Interest
The authors declare no conflict of interest
References
- Palmer, A.R.; Strobeck, C. Fluctuating asymmetry: Measurement, analysis, patterns. Annu. Rev. Ecol. Syst. 1986, 17, 391–421. [Google Scholar]
- Van Valen, L. A study of fluctuating asymmetry. Evolution 1962, 16, 125–142. [Google Scholar]
- Graham, J.H.; Freeman, D.C.; Emlen, J.M. Developmental stability: A sensitive indicator of population stress. In Environmental Toxicology and Risk Assessment; ASTM STP 1179; Landis, W.G., Hughes, J.S., Lewis, M.A., Eds.; American Society for Testing and Materials: Philadelphia, PA, USA, 1993; pp. 136–158. [Google Scholar]
- Palmer, A.R.; Strobeck, C. Fluctuating asymmetry analyses revisited. In Developmental Instability: Causes and Consequences; Polak, M., Ed.; Oxford: New York, NY, USA, 2003; pp. 279–319. [Google Scholar]
- Waddington, C.H. The Strategy of the Genes; George Allen & Unwin: London, UK, 1957. [Google Scholar]
- Zakharov, V.M. Population phenogenetics: Analysis of developmental stability in natural populations. Acta Zool. Fenn 1992, 191, 7–30. [Google Scholar]
- Palmer, A.R.; Strobeck, C. Fluctuating asymmetry as a measure of developmental stability: Implications of non-normal distributions and power of statistical tests. Acta Zool. Fenn 1992, 191, 57–72. [Google Scholar]
- Nijhout, H.F.; Davidowitz, G. Developmental perspectives on phenotypic variation, canalization, and fluctuating asymmetry. In Developmental Instability: Causes and Consequences; Polak, M., Ed.; Oxford University Press: New York, NY, USA, 2003; pp. 3–13. [Google Scholar]
- Møller, A.P.; Swaddle, J.P. Asymmetry, Developmental Stability, and Evolution; Oxford University Press: Oxford, UK, 1997. [Google Scholar]
- Polak, M., Ed.; Developmental Instability: Causes and Consequences; Oxford University Press: New York, NY, USA, 2003.
- Markow, T.A. Evolutionary ecology and developmental instability. Annu. Rev. Entomol. 1995, 40, 105–120. [Google Scholar]
- Møller, A.P.; Thornhill, R. Bilateral symmetry and sexual selection: A meta-analysis. Am. Nat. 1998, 151, 174–192. [Google Scholar]
- Tomkins, J.L.; Simmons, L.W. Fluctuating asymmetry and sexual selection: Paradigm shifts, publication bias, and observer expectation. In Developmental Instability: Causes and Consequences; Polak, M., Ed.; Oxford University Press: New York, NY, USA, 2003; pp. 231–261. [Google Scholar]
- Møller, A.P. Female swallow preference for symmetrical male sexual ornaments. Nature 1992, 357, 238–240. [Google Scholar]
- Møller, A.P.; Pomiankowski, A. Fluctuating asymmetry and sexual selection. Genetica 1993, 89, 267–279. [Google Scholar]
- Zahavi, A. The cost of honesty (further remarks on the handicap principle). J. Theor. Biol. 1977, 67, 603–605. [Google Scholar]
- Andersson, M. Sexual selection, natural selection and quality advertisement. Biol. J. Linn. Soc. 1982, 17, 375–393. [Google Scholar]
- Kodrick-Brown, A.; Brown, J.H. Truth in advertising: The kinds of traits favored by sexual selection. Am. Nat. 1984, 124, 309–323. [Google Scholar]
- Rowe, L.; Houle, D. The lek paradox and the capture of genetic variance by condition dependent traits. Proc. R. Soc. Lond. Ser. B-Biol. Sci. 1996, 263, 1415–1421. [Google Scholar]
- Møller, A.P. Patterns of fluctuating asymmetry in weapons: Evidence for reliable signalling of quality in beetle horns and bird spurs. Proc. R. Soc. Lond. Ser. B-Biol. Sci. 1992, 248, 199–206. [Google Scholar]
- Møller, A.P. Fluctuating asymmetry in male sexual ornaments may reliably reveal male quality. Anim. Behav. 1990, 40, 1185–1187. [Google Scholar]
- Manning, J.T.; Chamberlain, A.T. Fluctuating asymmetry, sexual selection and canine teeth in primates. Proc. R. Soc. Lond. Ser. B-Biol. Sci. 1993, 251, 83–87. [Google Scholar]
- Møller, A.P.; Höglund, J. Patterns of fluctuating asymmetry in avian feather ornaments: Implications for models of sexual selection. Proc. R. Soc. Lond. Ser. B-Biol. Sci. 1991, 245, 1–5. [Google Scholar]
- Balmford, A.; Jones, I.L.; Thomas, A.L.R. On avian asymmetry: Evidence of natural selection for symmetrical tails and wings in birds. Proc. R. Soc. Lond. Ser. B-Biol. Sci. 1993, 252, 245–251. [Google Scholar]
- Hunt, J.; Simmons, L.W. Patterns of fluctuating asymmetry in beetle horns: No evidence for reliable signalling. Behav. Ecol. 1998, 9, 465–470. [Google Scholar]
- Ketola, T.; Kortet, R.; Kotiaho, J.S. Testing theories of sexual selection in decorated crickets (Gryllodes sigillatus). Evol. Ecol. Res. 2007, 9, 869–885. [Google Scholar]
- Tomkins, J.L.; Simmons, L.W. Female choice and manipulations of forceps size and symmetry in the earwig Forficula auricularia L. Anim. Behav. 1998, 56, 347–356. [Google Scholar]
- Polak, M.; Starmer, W.T. Environmental origins of sexually selected variation and a critique of the fluctuating asymmetry-sexual selection hypothesis. Evolution 2005, 59, 577–585. [Google Scholar]
- Simmons, L.W.; Tomkins, J.L.; Manning, J.T. Sampling bias and fluctuating asymmetry. Anim. Behav. 1995, 49, 1697–1699. [Google Scholar]
- Swaddle, J.P.; Witter, M.S.; Cuthill, I.C. The analysis of fluctuating asymmetry. Anim. Behav. 1994, 48, 986–989. [Google Scholar]
- Polak, M. The developmental instability-sexual selection hypothesis: A general evaluation and case study. Evol. Biol. 2008, 35, 208–230. [Google Scholar]
- Bock, I.R. The bipectinata complex: A study in interspecific hybridization in the genus Drosophila (Insecta: Diptera). Aust. J. Biol. Sci. 1978, 31, 197–208. [Google Scholar]
- Ahuja, A.; De Vito, S.; Singh, R.S. Condition dependence and the nature of genetic variation for male sex comb bristle number in Drosophila melanogaster. Genetica 2011, 139, 505–510. [Google Scholar]
- Ahuja, A.; Singh, R.S. Variation and evolution of male sex combs in Drosophila: Nature of selection response and theories of genetic variation for sexual traits. Genetics 2008, 179, 503–509. [Google Scholar]
- Polak, M.; Starmer, W.T.; Wolf, L.L. Sexual selection for size and symmetry in a diversifying secondary sexual character in Drosophila bipectinata Duda (Diptera: Drosophilidae). Evolution 2004, 58, 597–607. [Google Scholar]
- Polak, M.; Taylor, P.W. A primary role of developmental instability in sexual selection. Proc. R. Soc. Lond. Ser. B-Biol. Sci. 2007, 274, 3133–3140. [Google Scholar]
- Matsuda, M.; Tomimura, Y.; Tobari, Y.N. Reproductive isolation among geographical populations of Drosophila bipectinata Duda (Diptera, Drosophilidae) with recognition of three subspecies. Genetica 2005, 125, 69–78. [Google Scholar]
- Mishra, P.K.; Singh, B.N. Unique phenotypes and variation in the sex comb patterns and their evolutionary implications in the Drosophila bipectinata species complex (Diptera: Drosophilidae). Eur. J. Entomol. 2006, 103, 805–815. [Google Scholar]
- Hurtado-Gonzales, J.L.; Gallaher, W.; Warner, A.; Polak, M. Micro-scale laser ablation reveals the function of the male sex comb in Drosophila bipectinata Meigen and D. melanogaster Duda. Ethology 2014, 120, 1–12. [Google Scholar]
- Spieth, H.T. Mating behavior within the genus Drosophila (Diptera). Bull. Am. Mus. Nat. Hist. 1952, 99, 395–474. [Google Scholar]
- Cooperman, A.F.; Polak, M.; Evans, C.S.; Taylor, P.W. Different sexual traits show covariation among genotypes: Implications for sexual selection. Behav. Ecol. 2007, 18, 311–317. [Google Scholar]
- Palmer, A.R. Fluctuating asymmetry: A primer. In Developmental Instability: Its Origins and Evolutionary Implications; Markow, T.A., Ed.; Kluwer: Dordrecht, The Netherland, 1994; pp. 335–364. [Google Scholar]
- Van Dongen, S. Fluctuating asymmetry and developmental instability in evolutionary biology: Past, present and future. J. Evol. Biol. 2006, 19, 1727–1743. [Google Scholar]
- Roberston, F.W.; Reeve, E. Studies in quantitative inheritance I. The effects of selection on wing and thorax length in Drosophila melanogaster. J. Genet. 1952, 50, 414–448. [Google Scholar]
- Kutner, M.H.; Nachtsheim, C.J.; Neter, J.; Li, W. Applied Linear Statiscal Models, 5th ed; McGraw-Hill/Irwin: Boston, MA, USA, 2005. [Google Scholar]
- Sharma, M.D.; Tregenza, T.; Hosken, D.J. Sex combs, allometry, and asymmetry in Drosophila. Biol. J. Linn. Soc. 2011, 103, 923–934. [Google Scholar]
- Tomkins, J.L.; Simmons, L.W. Patterns of fluctuating asymmetry in earwig forceps: No evidence for reliable signalling. Proc. R. Soc. Lond. Ser. B-Biol. Sci. 1995, 259, 89–96. [Google Scholar]
- Tomkins, J.L. Environmental and genetic determinants of the male forceps length dimorphism in the European earwig Forficula auricularia. Behav. Ecol. Sociobiol. 1999, 47, 1–8. [Google Scholar]
- Schielzeth, H.; Kempenaers, B.; Ellegren, H.; Forstmeier, W. QTL linkage mapping of zebra finch beak color shows an oligogenic control of a sexually selected trait. Evolution 2012, 66, 18–30. [Google Scholar]
- Polak, M.; Fanson, K.; Taylor, P.W.; Yap, S. Differential effects of secondary sexual trait size on offspring mating success and viability. Behav. Ecol. 2015. submitted for publication. [Google Scholar]
- Calboli, F.C.F.; Kennington, W.J.; Partridge, L. QTL mapping reveals a striking coincidence in the positions of genomic regions associated with adaptive variation in body size in parallel clines of Drosophila melanogaster on different continents. Evolution 2003, 57, 2653–2658. [Google Scholar]
- Partridge, L.; Farquhar, M. Lifetime mating success of male fruitflies (Drosophila melanogaster) is related to their size. Anim. Behav. 1983, 31, 871–877. [Google Scholar]
- Turner, T.L.; Stewart, A.D.; Fields, A.T.; Rice, W.R.; Tarone, A.M. Population-based resequencing of experimentally evolved populations reveals the genetic basis of body size variation in Drosophila melanogaster. PLoS Genet 2011, 7, e1001336. [Google Scholar]
- Santos, M.; Ruiz, A.; Quezada-Díaz, J.E.; Barbadilla, A.; Fontdevila, A. The evolutionary history of Drosophila buzzatii. XX. Positive phenotypic covariance between field adult fitness components and body size. J. Evol. Biol. 1992, 5, 403–422. [Google Scholar]
- Kellner, J.R.; Alford, R.A. The ontogeny of fluctuating asymmetry. Am. Nat. 2003, 161, 931–947. [Google Scholar]
- Swaddle, J.P.; Witter, M.S. On the ontogeny of developmental stability in a stabilized trait. Proc. R. Soc. Lond. Ser. B-Biol. Sci. 1997, 264, 329–334. [Google Scholar]
- Hallgrímsson, B. Fluctuating asymmetry in Macaca fascicularis: A study of the etiology of developmental noise. Int. J. Primatol. 1993, 14, 421–443. [Google Scholar]
- Hallgrímsson, B. Ontogenetic patterning of skeletal fluctuating asymmetry in rhesus macaques and humans: Evolutionary and developmental implications. Int. J. Primatol. 1999, 20, 121–151. [Google Scholar]
- Reeve, E.C.R. Some genetic tests on asymmetry of sternopleural chaeta number in Drosophila. Genet. Res. 1960, 1, 151–172. [Google Scholar]
- Møller, A.P. Development of fluctuating asymmetry in tail feathers of the barn swallow Hirundo rustica. J. Evol. Biol. 1996, 9, 677–694. [Google Scholar]
- Morris, M.R.; Rios-Cardenas, O.; Lyons, S.M.; Tudor, M.S.; Bono, L.M. Fluctuating asymmetry indicates the optimization of growth rate over developmental stability. Funct. Ecol. 2012, 26, 723–731. [Google Scholar]
- Levin, D.A. Developmental instability and evolution in peripheral isolates. Am. Nat. 1970, 104, 343–353. [Google Scholar]
- Soulé, M. Phenetics of natural populations. II. Asymmetry and evolution in a lizard. Am. Nat. 1967, 101, 141–160. [Google Scholar]
- Pomiankowski, A.; Møller, A.P. A resolution of the lek paradox. Proc. R. Soc. Lond. Ser. B-Biol. Sci. 1995, 260, 21–29. [Google Scholar]
- Møller, A.P. Developmental stability, sexual selection and speciation. J. Evol. Biol. 1993, 6, 493–509. [Google Scholar]
- McKenzie, J.A. The analysis of the asymmetry phenotype: Single genes and the environment. In Developmental Instability: Causes and Consequences; Polak, M., Ed.; Oxford University Press: New York, NY, USA, 2003; pp. 135–141. [Google Scholar]
- Pomiankowski, A.; Iwasa, Y.; Nee, S. The evolution of costly mate preferences I. Fisher and biased mutation. Evolution 1991, 1422–1430. [Google Scholar]
- Parsons, P.A. Stress and limits to adaptation: Sexual ornaments. J. Evol. Biol. 1995, 8, 455–461. [Google Scholar]
- Pélabon, C.; Hansen, T.F.; Carter, A.J.R.; Houle, D. Response of fluctuating asymmetry and directional asymmetry to selection on wing shape in Drosophila melanogaster. J. Evol. Biol. 2006, 19, 764–776. [Google Scholar]


| Locality | Date | Latitude | Longitude |
|---|---|---|---|
| Taiwan | September 2006 | 25°2′30.24″ N | 121°36′39.37″ E |
| Cape Tribulation | January 2003 | 16°5′9.25″ S | 145°27′44.45″ E |
| Noumea | January 2006 | 22°18′11.01″ S | 166°26′48.11″ E |
| Moorea | February 2009 | 17°32′58.82″ S | 149°52′59.52″ W |
| Hiva Oa | February–March 2009 | 9°47′52.40″ S | 9°47′52.40″ S |
| Population | Trait | n | Mean | p † | VAR | Skew | Kurtosis | z‡ | p |
|---|---|---|---|---|---|---|---|---|---|
| Taiwan | C1 | 1112 | −0.006295 | 0.84 | 1.0810 | −0.02593 | 0.2074 | 1.3677 | 0.171 |
| C2 | 1112 | 0.01169 | 0.71 | 1.1133 | −0.3457 *** | 1.6950 *** | 6.7097 | <0.001 | |
| Cape Tribulation | C1 | 863 | 0.06373 | 0.067 | 1.0412 | 0.06915 | −0.08903 | −0.485 | 0.628 |
| C2 | 863 | −0.002317 | 0.95 | 1.0162 | −0.04303 | 0.02968 | 0.2579 | 0.796 | |
| Noumea | C1 | 230 | −0.07826 | 0.31 | 1.3476 | 0.03538 | 0.1067 | 0.4697 | 0.638 |
| C2 | 230 | 0.03478 | 0.62 | 1.1167 | 0.1542 | 0.5278 | 1.5244 | 0.127 | |
| Moorea | C1 | 340 | 0.05882 | 0.34 | 1.3004 | 0.08832 | −0.08189 | −0.2092 | 0.834 |
| C2 | 340 | −0.04412 | 0.46 | 1.2045 | −0.1008 | 0.1277 | 0.5883 | 0.556 | |
| Hiva Oa | C1 | 297 | −0.003367 | 0.96 | 1.6115 | 0.006348 | −0.007696 | 0.0997 | 0.920 |
| C2 | 297 | 0.1010 | 0.12 | 1.2398 | −0.3043 * | 0.2025 | 0.8019 | 0.423 | |
†p value evaluating Ho: Mean = 0;*p < 0.05,***p < 0.001;‡D’Agostino test for normality and its associated p value in the next column.
| Trait | Population | a* (s.e.) | b** (s.e.) | t*** | p |
|---|---|---|---|---|---|
| Linear regression of size (TC1 and TC2) | |||||
| TC1 | Taiwan | 0.9384 (0.3103) | 5.9608 (0.4202) | 7.99 | <0.0001 |
| Cape Trib | 0.4518 (0.4037) | 5.6258 (0.5358) | 10.50 | <0.0001 | |
| Noumea | 0.008367 (0.7262) | 7.7193 (0.9656) | 7.99 | <0.0001 | |
| Moorea | 0.9059 (0.6666) | 6.2558 (0.8867) | 7.06 | <0.0001 | |
| Hiva Oa | 0.4895 (0.6320) | 7.1964 (0.8245) | 8.73 | <0.0001 | |
| TC2 | Taiwan | 5.6078 (0.4188) | 3.1383 (0.3039) | 13.39 | <0.0001 |
| Cape Trib | 3.7874 (0.5817) | 4.3039 (0.4383) | 6.50 | <0.0001 | |
| Noumea | 4.2367 (0.9703) | 4.9604 (0.7297) | 4.37 | <0.0001 | |
| Moorea | 3.3982 (0.8614) | 5.4943 (0.6476) | 3.83 | 0.0002 | |
| Hiva Oa | 5.2310 (0.8555) | 4.2608 (0.6558) | 6.11 | <0.0001 | |
| Linear regression of log-transformed size (log TC1 and log TC2) | |||||
| log TC1 | Taiwan | 0.8327 (0.007849) | 0.8281 (0.05711) | 14.50 | <0.0001 |
| Cape Trib | 0.7764 (0.01086) | 0.8926 (0.08557) | 10.43 | <0.0001 | |
| Noumea | 0.8907 (0.015770 | 1.0499 (0.1216) | 8.63 | <0.0001 | |
| Moorea | 0.8513 (0.01502) | 0.8567 (0.1169) | 7.33 | <0.0001 | |
| Hiva Oa | 0.8844 (0.01225) | 0.9402 (0.1016) | 9.25 | <0.0001 | |
| log TC2 | Taiwan | 0.9335 (0.005781) | 0.5569 (0.04206) | 13.24 | <0.0001 |
| Cape Trib | 0.8995 (0.01128) | 0.3981 (0.08698) | 6.34 | <0.0001 | |
| Noumea | 0.9586 (0.01128) | 0.3981 (0.08698) | 4.58 | <0.0001 | |
| Moorea | 0.9382 (0.0103) | 0.3079 (0.0805) | 3.82 | 0.0002 | |
| Hiva Oa | 0.9721 (0.009337) | 0.4850 (0.07745) | 6.26 | <0.0001 | |
*a: intercept;**b: slope;***testing Ho: b = 0.
| Trait | Population | rs | p |
|---|---|---|---|
| FA1 vs. TC1c * | Taiwan | 0.0803 | 0.00740 |
| Cape Tribulation | 0.0258 | 0.449 | |
| Noumea | 0.0643 | 0.331 | |
| Moorea | 0.1176 | 0.0301 | |
| Hiva Oa | 0.2125 | 0.0002 | |
| FA1 vs. TC1 | Taiwan | 0.0953 | 0.00180 |
| Cape Tribulation | 0.0213 | 0.532 | |
| Noumea | 0.0652 | 0.325 | |
| Moorea | 0.139 | 0.0101 | |
| Hiva Oa | 0.233 | <0.0001 | |
| FA2 vs. TC2c* | Taiwan | 0.0861 | 0.0041 |
| Cape Tribulation | 0.0019 | 0.956 | |
| Noumea | 0.0729 | 0.271 | |
| Moorea | 0.0670 | 0.218 | |
| Hiva Oa | 0.0614 | 0.292 | |
| FA2 vs. TC2 | Taiwan | 0.1009 | 0.0008 |
| Cape Tribulation | 0.0112 | 0.742 | |
| Noumea | 0.1049 | 0.113 | |
| Moorea | 0.0734 | 0.177 | |
| Hiva Oa | 0.0780 | 0.180 | |
*Comb size corrected for thorax length.
| Trait | Population | rs | p |
|---|---|---|---|
| FA1 vs. tl | Taiwan | 0.0319 | 0.288 |
| Cape Tribulation | −0.0207 | 0.544 | |
| Noumea | −0.0083 | 0.900 | |
| Moorea | 0.0596 | 0.273 | |
| Hiva Oa | 0.127 | 0.0283 | |
| FA1c vs. tl | Taiwan | −0.1047 | 0.0005 |
| Cape Tribulation | −0.1049 | 0.0020 | |
| Noumea | −0.1353 | 0.0404 | |
| Moorea | −0.0649 | 0.233 | |
| Hiva Oa | −0.0154 | 0.792 | |
| FA2 vs. tl | Taiwan | 0.0459 | 0.126 |
| Cape Tribulation | 0.0468 | 0.170 | |
| Noumea | 0.0970 | 0.143 | |
| Moorea | 0.0403 | 0.459 | |
| Hiva Oa | 0.120 | 0.0389 | |
| FA2c vs. tl | Taiwan | −0.0407 | 0.175 |
| Cape Tribulation | −0.0339 | 0.320 | |
| Noumea | 0.0456 | 0.491 | |
| Moorea | −0.0344 | 0.528 | |
| Hiva Oa | 0.0090 | 0.878 | |
| Variable | Source | MS | df* | F | p |
|---|---|---|---|---|---|
| TC1 | Population | 130.244 | 4 | 255.766 | <0.0001 |
| tl | 198.757 | 1 | 390.307 | <0.0001 | |
| Pop × tl | 2.8272 | 4 | 1.3880 | 0.235 | |
| Error | 0.5092 | 2831 | – | – | |
| r2 = 0.361 | – | – | – | – | |
| TC2 | Population | 106.472 | 4 | 199.654 | <0.0001 |
| tl | 90.913 | 1 | 170.478 | <0.0001 | |
| Pop × tl | 1.385 | 4 | 2.597 | 0.0346 | |
| Error | 0.533 | 2831 | – | – | |
| r2 = 0.305 | – | – | – | – | |
*df: degrees of freedom.
| Trait | Population | Mean [(R + L)/2] | s.e. | Range |
|---|---|---|---|---|
| TC1 | Taiwan | 5.329 | 0.0236 | 3–8.5 |
| Cape Tribulation | 4.684 | 0.0245 | 2.5–8 | |
| Noumea | 5.800 | 0.0569 | 3.5–8.5 | |
| Moorea | 5.600 | 0.0437 | 3.5–8.5 | |
| Hiva Oa | 5.995 | 0.0444 | 4–8.5 | |
| TC2 | Taiwan | 7.273 | 0.0231 | 5–10 |
| Cape Tribulation | 7.149 | 0.0257 | 5–9.5 | |
| Noumea | 8.139 | 0.0526 | 5.5–11 | |
| Moorea | 7.969 | 0.0405 | 6–10 | |
| Hiva Oa | 8.263 | 0.0436 | 6–10.5 | |
| Variable | Source | MS | df | F | p |
|---|---|---|---|---|---|
| FA1 | Population | 2.821 | 4 | 5.275 | 0.0003 |
| tl | 1.243 | 1 | 2.324 | 0.127 | |
| Pop × tl | 0.439 | 0.821 | 0.0822 | 0.511 | |
| Error | 0.535 | 2831 | – | – | |
| r2 = 0.012 | – | – | – | – | |
| FA2 | Population | 0.847 | 4 | 1.622 | 0.166 |
| tl | 6.041 | 1 | 11.565 | 0.0007 | |
| Pop × tl | 0.154 | 4 | 0.294 | 0.882 | |
| Error | 0.522 | 2831 | – | – | |
| r2 = 0.0079 | – | – | – | – | |
| Trait | Population | Mean |R-L| | s.e. | Range |
|---|---|---|---|---|
| FA1 | Taiwan | 0.7525 | 0.02152 | 0–4 |
| Cape Tribulation | 0.7474 | 0.02350 | 0–3 | |
| Noumea | 0.8696 | 0.05083 | 0–4 | |
| Moorea | 0.8353 | 0.04215 | 0–3 | |
| Hiva Oa | 0.9731 | 0.04719 | 0–4 | |
| FA2 | Taiwan | 0.7453 | 0.02152 | 0–4 |
| Cape Tribulation | 0.7346 | 0.02348 | 0–3 | |
| Noumea | 0.7304 | 0.05031 | 0–3 | |
| Moorea | 0.8206 | 0.03952 | 0–4 | |
| Hiva Oa | 0.8552 | 0.04169 | 0–4 | |
| Term | Coefficient | s.e. | t | p |
|---|---|---|---|---|
| TC1 | 0.2709 | 0.0432 | 6.28 | 0.024 |
| TC12 | 0.2796 | 0.07906 | 3.54 | 0.071 |
| log TC1 | 1.774 | 0.2730 | 6.50 | 0.023 |
| (log TC1)2 | 22.084 | 5.847 | 3.78 | 0.063 |
© 2015 by the authors; licensee MDPI, Basel, Switzerland This article is an open access article distributed under the terms and conditions of the Creative Commons Attribution license (http://creativecommons.org/licenses/by/4.0/).
Share and Cite
Polak, M.; Hooker, K.J.; Tyler, F. Consistent Positive Co-Variation between Fluctuating Asymmetry and Sexual Trait Size: A Challenge to the Developmental Instability-Sexual Selection Hypothesis. Symmetry 2015, 7, 976-993. https://0-doi-org.brum.beds.ac.uk/10.3390/sym7020976
Polak M, Hooker KJ, Tyler F. Consistent Positive Co-Variation between Fluctuating Asymmetry and Sexual Trait Size: A Challenge to the Developmental Instability-Sexual Selection Hypothesis. Symmetry. 2015; 7(2):976-993. https://0-doi-org.brum.beds.ac.uk/10.3390/sym7020976
Chicago/Turabian StylePolak, Michal, Kassie J. Hooker, and Frances Tyler. 2015. "Consistent Positive Co-Variation between Fluctuating Asymmetry and Sexual Trait Size: A Challenge to the Developmental Instability-Sexual Selection Hypothesis" Symmetry 7, no. 2: 976-993. https://0-doi-org.brum.beds.ac.uk/10.3390/sym7020976